Forex Trading vs Stock Trading: Key Differences, Pros & Cons

Forex and stock trading look similar on a chart, but they work under different rules. Those rules change your costs, risk, and execution. This guide breaks down the key differences that matter when you place real trades.
You will learn how market hours, liquidity, volatility, leverage, and fees compare. You will see how position sizing and risk control differ between currency pairs and individual stocks. You will also get clear pros and cons for each market, plus a fast checklist to help you pick what fits your time, capital, and strategy.
If you trade forex, spreads often drive your cost per trade. If you want a quick refresher, read what is spread in forex.
Key Takeaways
- Summary: Hours and gaps change your risk. Forex gives you more continuous pricing during the week. Stocks can open far from the prior close after earnings, news, or macro events.
- Leverage drives both opportunity and blowups. Forex brokers often offer higher leverage. That means small moves can hit your account fast. Stocks usually cap leverage lower, but single-name gaps can still exceed your stop.
- Costs show up in different places. In forex, the spread and swap can matter more than commissions. In stocks, commissions may be low, but fees, slippage, and wider spreads in small caps can add up.
- Liquidity is not uniform. Major FX pairs often stay liquid. Stocks range from ultra-liquid mega caps to thin names where exits cost more.
- Your position sizing rules must match the market. In forex you size by stop distance in pips, pip value, and lot size. In stocks you size by stop distance in dollars and share count, then account for gaps and halts.
- Pick the market that fits your schedule and edge. Forex suits traders who want flexible hours and short-term setups. Stocks suit traders who want company-specific catalysts and longer holding periods.
Forex Trading vs Stock Trading: What You’re Actually Trading
Forex basics: currency pairs, base and quote currency, pips, lots
In forex, you trade one currency against another. Every trade is a pair.
A pair has a base currency and a quote currency. Example, EUR/USD. EUR is the base. USD is the quote.
If EUR/USD rises, one euro buys more US dollars. If it falls, one euro buys fewer US dollars.
Your profit and loss comes from the price change in that pair, measured in pips. Most major pairs quote to 0.0001, so 1 pip is often 0.0001. JPY pairs often use 0.01 as 1 pip.
You trade in lots, which standardize position size.
- Standard lot: 100,000 units of the base currency
- Mini lot: 10,000 units
- Micro lot: 1,000 units
Your pip value changes with the pair, your lot size, and your account currency. That is why forex risk control starts with stop size in pips and pip value, not share count.
Stocks basics: shares, market capitalization, sectors, dividends
In stocks, you trade shares of a company. One share is a slice of ownership.
Share price tells you what one share trades for. Market capitalization tells you what the whole company is worth.
- Market cap: share price times shares outstanding
- Large cap: tends to move slower and trade with deeper liquidity
- Small cap: can move fast and gap more, spreads can widen
Sectors matter because stocks often move in groups. Tech, financials, energy, healthcare, and consumer sectors can rotate based on rates, earnings, and macro data.
Some stocks pay dividends. A dividend is a cash payment to shareholders on a schedule. Dividend dates can move price and affect short positions, since short sellers can owe the dividend.
How pricing works: exchange order books vs OTC dealer networks
Stocks price on centralized exchanges. Orders hit a visible order book, then match with other buyers and sellers. You get a national best bid and offer across venues, but fills still depend on liquidity and routing.
Most retail forex is OTC. You trade through a broker connected to liquidity providers. Pricing comes from a dealer network, not a single exchange book. Spreads can stay tight in liquid hours, then widen around news, rollovers, and session changes.
This structure difference changes execution. In stocks, you manage exchange microstructure, auctions, and halts. In forex, you manage spread changes, slippage around releases, and broker feed quality. For more detail, see forex liquidity.
Common instruments: spot FX, FX futures, stock CFDs, options, ETFs
- Spot FX: the most common retail forex product. You trade the pair with leverage, typically with a broker mark-up in the spread or commission. Holding past rollover can create swap fees.
- FX futures: exchange-traded currency contracts. You get centralized pricing and regulated clearing. Contract sizes are fixed, margin rules are standardized, and roll dates matter.
- Stocks (cash equities): buying and selling shares on an exchange. You can hold long term, trade earnings, or build baskets by sector.
- Stock CFDs: a broker contract that tracks a stock price. You do not own the shares. Costs include spread, commission, and financing for holds.
- Options: contracts on stocks or ETFs. You trade defined-risk structures, volatility, and time decay. You can hedge or express directional views with less capital, but complexity is higher.
- ETFs: baskets that track an index, sector, or theme. ETFs let you trade broad exposure with one ticker, often with better liquidity than many single names.
Market Structure and Trading Hours
Trading Sessions in FX
Spot FX trades 24 hours a day from Monday open in Sydney to Friday close in New York. Liquidity and spreads change by session.
- Sydney: Slower start to the week. Wider spreads in many pairs. Cleaner moves in AUD and NZD pairs.
- Tokyo: Stronger flow in JPY crosses. Ranges often tighten in EUR and GBP pairs.
- London: The main liquidity engine. Tighter spreads in majors. Many daily highs and lows form here.
- New York: Heavy volume early. Big moves around US data. Liquidity drops late day.
Overlaps matter most. London and New York overlap often brings the tightest spreads and the fastest fills in major pairs. Tokyo and London overlap tends to be thinner.
Stock Market Sessions
Stocks trade on centralized exchanges with set hours. You face discrete opens and closes.
- Regular session: Most volume prints here. Spreads usually tighten after the open and before the close.
- Opening auction: Price discovery concentrates at the open. You can see fast moves, wide spreads, and partial fills.
- Closing auction: Large funds rebalance at the close. Volume spikes, then liquidity ends.
- Pre-market and after-hours: Lower liquidity. Wider spreads. Higher slippage risk. Many earnings moves happen here.
Liquidity Cliffs and Gaps
FX and stocks both gap, but the cause differs.
- FX weekend risk: Spot FX stops for the weekend. News can hit while markets are closed. You can see a gap at the Sunday open, especially after elections, wars, or surprise policy shifts.
- Stocks overnight risk: Stocks stop each day. Earnings, guidance, and analyst changes often land outside regular hours. You can get large gaps at the next open, with limited chance to exit at your planned price.
Liquidity also drops around daily rollovers in FX and during the stock lunch lull. Your stops can slip more in both markets during these thin periods.
Holidays and Macro Calendars
Calendar effects change spreads, volatility, and trade quality.
- FX holidays: When a major center is closed, liquidity thins. Spreads can widen even if price looks calm. Examples include US holidays affecting USD pairs and UK holidays affecting GBP pairs.
- Stock holidays: Exchanges close полностью for market holidays. You lose intraday flexibility. Short weeks can compress volatility into fewer sessions.
- Macro releases: CPI, jobs data, central bank decisions, and rate guidance can move FX in seconds. Slippage rises during the first seconds of the release. Spreads often widen right before and after.
- Stock events: Earnings dates, product events, and index rebalances drive single-name gaps. Liquidity can look fine, then vanish during the print.
If you trade news, plan for wider spreads and faster moves. If you avoid news, block out high-impact times on your calendar and reduce size around thin sessions and holidays.
Liquidity, Volatility, and Typical Price Behavior
Liquidity: How Fast You Can Get Filled
FX majors often trade with deeper liquidity than most single stocks. You see it in tighter spreads and steadier fills, especially during the London and New York overlap. That overlap concentrates banks, funds, and corporates in the same hours. Quotes refresh fast and order books stay thick.
FX liquidity drops in late US hours, early Asia, and around holidays. You will still see prices, but you may pay more to enter and exit. Your fills can slip more when fewer providers quote.
Stock liquidity depends on the ticker. Mega caps can trade like a liquid market most of the day. Small caps can trade thin even at the open. Liquidity also clusters around the open and close. Midday can get quiet, then spreads widen.
In both markets, liquidity is not constant. It can vanish around scheduled releases, earnings prints, and sudden headlines.
Volatility: What Drives the Size of Moves
FX volatility comes from rates, inflation, central bank policy, and risk sentiment. Most pairs react to the same macro calendar. Moves often compress when the market waits for a data point, then expand in minutes when it hits.
Single-stock volatility is more event-driven and more idiosyncratic. Key drivers include earnings, guidance, buybacks, offerings, downgrades, lawsuits, and regulatory news. One stock can gap hard while the index barely moves.
- Earnings and guidance: The biggest one-day driver for many stocks. Gaps can ignore your stop price.
- Buybacks and capital actions: Can change supply and demand fast, and can support price in a down tape.
- News risk: Headlines can hit outside market hours. You can reopen to a new price.
Typical Price Behavior: Range vs Trend
FX pairs often spend long stretches in ranges, then trend hard when policy expectations shift. Mean reversion works best when volatility stays stable and the pair sits in a well-defined band. Trend approaches do better when the market reprices rates or breaks a multi-week level with volume and follow-through.
Stocks can trend longer because of business momentum, index flows, and investor positioning. Single names can also snap back fast after earnings. That creates a different mix. You see persistent trends in strong names, and sharp gaps that reset the chart in one print.
Timeframe matters. On short timeframes, both markets can look noisy. On higher timeframes, FX trends often align with rate differentials, while stock trends often align with earnings cycles and capital flows.
Slippage: When Your Fill Gets Worse Than Your Price
Slippage happens when price moves through your order faster than the available liquidity. It shows up most in market orders, stops, and during fast spikes.
| Market | Most common slippage windows | What it looks like | How to reduce it |
|---|---|---|---|
| Forex | High-impact data seconds, session opens, thin hours, sudden headline bursts | Wider spreads and fast ticks, stop orders fill several pips away | Trade during liquid overlaps, use limit orders when you can, size down near releases, understand your spread in forex |
| Stocks | Market open, earnings releases, halts, low-float names, after-hours prints | Gaps through stops, partial fills, wide bid-ask in thin names | Avoid market orders in thin names, use limits, reduce size into earnings, watch liquidity at your price level |
If you want cleaner execution, trade when liquidity concentrates. In FX, that usually means major pairs during the London and New York overlap. In stocks, that means liquid names during core hours, and away from earnings and headline risk.
Costs and Fees: Spreads, Commissions, Financing, and Taxes
Forex costs, spread-only vs commission plus raw spread
FX brokers price your trade through the spread, the commission, or both. Your real cost is the all-in round trip in pips and dollars.
- Spread-only account. You pay a wider spread, with no separate commission. This can look simple, but the spread can widen fast in news, rollover, or thin hours.
- Raw spread plus commission. You pay a small spread, sometimes near zero on majors, plus a fixed commission per lot. This often lowers cost if you trade frequently and during liquid hours.
Convert to one number so you can compare brokers. Example. If EUR/USD shows a 0.2 pip average spread and you pay $7 per round trip per standard lot, your all-in cost is about 0.9 pips because 1 pip is about $10 per standard lot on EUR/USD.
Costs also depend on how your broker routes and fills orders. Market structure and pricing details matter, see how the forex market works.
FX rollover and swap, why overnight can cost or pay
Hold a spot FX position past the daily rollover and you pay or receive swap. Swap comes from the interest rate gap between the two currencies, plus the broker markup.
- You can pay swap. Common when you hold the lower-yield currency long or when the broker charges a large markup.
- You can earn swap. Possible when you hold the higher-yield currency long, but the broker can reduce it with markups.
- Wednesday effect. Many brokers apply a triple swap once per week to account for weekend settlement. Check the broker’s rollover schedule.
If you swing trade FX, treat swap as part of your edge. A strategy that looks profitable on price alone can lose after financing, especially in high rate environments.
Stock trading costs, commissions, exchange fees, and short borrow
Stock costs show up as explicit fees and trade friction.
- Commissions. Many brokers offer zero-commission US equities, but some accounts still charge per trade or per share, especially for active tools or international markets.
- Exchange and regulatory fees. You still pay pass-through charges in many cases. In the US, you may see SEC and FINRA fees on sells, plus exchange or clearing fees depending on broker.
- Shorting costs. You pay borrow fees to locate and maintain a short. Hard-to-borrow names can cost a lot, and the rate can change daily. You also face buy-ins if shares become unavailable.
- Margin interest. If you borrow cash to buy stock, your broker charges a margin rate. This can dominate your P and L on longer holds.
For stocks, the trade ticket can look cheap, but borrow and margin costs can turn into the main expense.
Taxes, general guidance and why product choice matters
Taxes depend on your country, your account type, and the product you trade. Treat this as general guidance, then confirm with a local tax professional.
- Stocks. Many regions tax dividends and capital gains. Holding period can change the rate in some countries. Corporate actions can also create taxable events.
- Forex and CFDs. Some jurisdictions treat FX gains as ordinary income, some treat them as capital gains, and some apply special rules for leveraged derivatives. Reporting can be more complex if you trade many small lots.
- US note. US traders can face different tax treatment across spot FX, FX futures, and equities. The instrument you pick can change your effective tax rate.
Pick your product with after-tax returns in mind. A small edge can disappear after tax drag and financing.
Hidden frictions, execution quality, requotes, PFOF, and platform fees
Spreads and commissions do not capture your full cost. Track these frictions in your journal.
- Slippage. Fast markets can fill you worse than your intended price. This hits stops and market orders most.
- Requotes and rejects. Some dealing-desk setups can reject or reprice during volatility. You lose time and price.
- Spread widening. FX spreads often widen at rollover, around data releases, and outside liquid hours. Stock spreads widen in thin names and around news.
- PFOF and routing. Some stock brokers route orders for payment. You may get worse fills on marketable orders. Use limit orders and compare effective spread.
- Platform and data fees. Advanced stock platforms, live market data, and level 2 feeds can add monthly cost. Some FX brokers bundle these costs into spreads.
Measure what you actually pay. Use average spread, average slippage, and financing per day. Then compare FX and stocks on the same all-in basis.
Leverage, Margin, and Risk of Ruin
Typical Leverage Availability: Retail FX vs Equity Margin Rules
Forex brokers often offer high leverage. Common ranges sit around 20:1 to 50:1 in many regulated regions. Some jurisdictions allow higher, others cap it lower.
Stock brokers usually offer lower leverage. Cash accounts give you no leverage. Margin accounts often sit near 2:1 for overnight positions in many markets. Some brokers allow more for day trading if you meet equity and activity requirements.
Practical impact. A small price move in FX can hit your account like a large move in stocks if you use high leverage. You control this with position size, not with hope.
Margin Calls, Stop-Outs, and Negative Balance Protection
Forex margin systems tend to act fast. Your broker marks your positions to market in real time. If your margin level falls, you can get a margin call, then an automatic stop-out. The broker closes positions to protect its loan.
Stock margin can move slower, but it can still force liquidations. If your broker issues a margin call and you do not meet it, the broker can sell your holdings. It can happen at bad prices. You do not control the timing.
Negative balance protection depends on broker and regulation. Some retail FX accounts have it, especially in the UK and EU. Many stock margin accounts do not. In fast gaps, you can owe money in both markets.
- Know your stop-out level. Check the exact margin level where forced liquidation starts.
- Know your margin model. Some brokers use tiered margin that increases during news, weekends, or high volatility.
- Know your gap risk. Stops do not guarantee fills at your stop price in gaps.
Position Sizing Frameworks: % Risk, ATR Sizing, and Notional Exposure
Start with account risk. Pick a fixed percent of equity per trade. Many traders use 0.25% to 1.0%. Lower is easier to survive.
Then size the trade from your stop distance. This keeps your loss stable even when volatility changes.
- % risk model. Position size = (Account equity x risk %) / (stop distance x value per point).
- ATR-based sizing. Set stop distance as a multiple of ATR, then size using the same risk formula.
- Notional exposure cap. Set a max total notional, or a max leverage, across all open positions.
Notional exposure matters more than the instrument label. A 50:1 FX position can be less risky than a 2:1 stock position if your stop is tight and your notional is small. It can also be far riskier if you size by emotion.
If you want the math and examples, use this guide on how to calculate position size in forex.
Drawdowns and Compounding: How High Leverage Sabotages Consistency
High leverage increases your drawdown speed. Drawdowns compound against you. A larger loss requires a larger gain to recover.
| Account drawdown | Gain needed to break even |
|---|---|
| 10% | 11.1% |
| 20% | 25.0% |
| 30% | 42.9% |
| 50% | 100.0% |
Leverage does not create edge. It magnifies variance. If your strategy has a small edge, too much leverage can turn it into a losing path through large drawdowns and forced liquidations.
Risk Tools Checklist: Stops, Limits, Hedging, and Max Daily Loss Rules
- Hard stop on every trade. Place it at the structure level your trade idea fails, then size to it.
- Use limit orders when possible. You reduce spread cost and avoid bad fills in thin moments.
- Control total risk. Cap open risk across positions, not per trade only.
- Max daily loss rule. Stop trading after a fixed loss, such as 1R to 3R, or 1% to 3% of equity.
- News and weekend rules. Reduce size or flatten positions ahead of high-impact releases and illiquid closes.
- Hedging policy. If you hedge, define why. Many FX hedges just double spreads and carry without reducing net risk.
- Liquidity checks. Trade the most liquid pairs or stocks if you need tight execution.
- Review margin buffer. Keep excess margin so normal volatility cannot trigger a stop-out.
Risk of ruin drops when you keep losses small and consistent. Your job is survival first. Returns come second.
What Moves Prices: Fundamental Drivers in Forex vs Stocks
FX Catalysts: Rates, Central Banks, and Macro Shocks
Forex prices move on relative expectations. One currency strengthens when its future path looks better than the other side of the pair.
- Interest rates and rate differentials. Higher expected policy rates can support a currency. Cuts can weaken it. Markets price the path, not today’s rate.
- Central bank guidance. Forward guidance, dot plots, press conferences, and balance sheet plans can move FX fast. A small wording change can shift rate expectations.
- Inflation data. CPI, PCE, and wage inflation drive the next policy move. Sticky inflation often keeps a currency bid. Cooling inflation can cap it.
- Geopolitics and risk shocks. War, sanctions, elections, and energy disruptions hit FX through capital flows and commodity prices. Safe haven demand can dominate fundamentals for days or weeks.
- Terms of trade. Commodity exporters often track their key exports. Oil matters for CAD and NOK. Iron ore matters for AUD. A commodity spike can act like a tax cut or tax hike for the economy.
Equity Catalysts: Earnings, Multiples, and Flows
Stock prices move on company cash flows and what investors will pay for them. You need to watch both.
- Earnings and revenue. Beats and misses matter. So does the quality of results, margins, and cash flow.
- Guidance. Forward revenue, margins, and demand signals can outweigh the last quarter. One line in a call can reprice the stock.
- Valuation multiples. Rates and growth expectations change P/E and EV/EBITDA. Rising yields often compress multiples, even if earnings hold.
- Sector rotation. Money moves between sectors based on rates, inflation, and growth. Tech and defensives can trade like different markets.
- Sentiment and positioning. Options flows, short interest, buybacks, and fund rebalancing can drive moves that look irrational on fundamentals.
Macro Linkages: Risk-On, USD Strength, and Correlations
Forex and stocks connect through global risk appetite and the US dollar.
- Risk-on and risk-off. When investors want risk, equities tend to rise and high beta FX can benefit. When fear hits, equities can drop and safe havens can catch bids.
- USD as a global filter. A strong USD can tighten global financial conditions. It can pressure commodities and EM assets, and it can change how US multinationals translate foreign earnings.
- Correlation is unstable. FX and equity correlations shift by regime. In one quarter, stocks and a currency can move together. Next quarter, the link breaks because the driver changes from growth to inflation, or from earnings to rates.
Event Risk Playbook: FOMC, CPI, NFP vs Earnings Season
Trade events with a plan. Treat them as volatility sources first, opportunity second.
| Market | High impact events | What usually matters most | How to manage the risk |
|---|---|---|---|
| Forex | FOMC, CPI, NFP, central bank decisions, inflation reports | Rate path repricing, surprise vs consensus, guidance tone | Cut size into releases, widen stop logic or stay flat, avoid thin liquidity windows, define max loss per event |
| Stocks | Earnings, guidance, product launches, M&A, sector news | Forward guidance, margins, growth rate, valuation reset | Limit exposure into reports, consider options for defined risk, respect gap risk at the open |
For FX releases, your biggest risk is the spike and reversal on the first headlines. For earnings, your biggest risk is the gap. You cannot stop out at your intended price if the market jumps past it. If execution risk matters to you, learn what is slippage in forex and plan around it.
Analysis and Strategy Fit (Beginner to Advanced)
Technical analysis fit, indicators, structure, multi-timeframe
Forex responds well to clean price action and liquidity-driven structure. Major pairs often respect levels, session ranges, and round numbers. Stocks vary by name. Some trade clean. Many gap, wick, and jump around news.
Indicators work in both markets. Your edge usually comes from structure and context, not a new setting.
- Forex: Use session highs and lows, Asia range breaks, London and New York continuation, and multi-timeframe trend alignment. Watch spread and execution during rollover and news.
- Stocks: Use daily and weekly levels, premarket highs and lows, volume and VWAP, and relative strength versus an index. Respect gap zones and halts.
- Multi-timeframe reading: Start with weekly and daily to define the bias, then use 4H and 1H for zones, then 15M to 1M for entries. In stocks, the open sets the tone, your intraday plan must account for overnight gaps.
Fundamental workflows, macro view vs company financials
FX fundamentals start with macro. You track rates, inflation, growth, and risk sentiment. You focus on the spread between two economies. You also track positioning and policy messaging.
Stock fundamentals start with the business. You read financial statements, guidance, margins, and competitive position. You care about valuation versus growth and cash flow. You also track dilution, buybacks, and sector rotation.
- Forex macro workflow: map central bank stance, compare rate paths, mark key releases, define the risk regime, then pick pairs that express the view with the least noise.
- Stock research workflow: screen, read filings and earnings calls, check revenue drivers, model scenarios, then pick entries around liquidity and catalysts.
If you want a clear view of how FX pricing and execution work, read how the forex market works.
Popular forex approaches, scalping, intraday mean reversion, carry
- Scalping: Works best on liquid majors during active sessions. Your costs matter. You need tight spread, fast execution, and strict stop discipline. News spikes can erase many small wins.
- Intraday mean reversion: Common around range days and after impulse moves. You fade extremes back to VWAP-like anchors such as session mid and prior day levels. You must cut fast when trend days appear.
- Carry trades: Longer horizon. You target positive swap from rate differentials. You still manage drawdowns because carry can unwind fast in risk-off periods. You also track central bank pivots.
Popular stock approaches, swing catalysts, value or growth, dividends
- Swing trading catalysts: Earnings, guidance changes, product launches, FDA decisions, and macro prints. You plan entries around liquidity and define risk for gaps. You accept that stops do not protect you through overnight jumps.
- Value and growth: Value leans on cash flow, balance sheet strength, and valuation. Growth leans on revenue growth, margins, and TAM narratives. In both, you must track dilution, buybacks, and sector flows.
- Dividend strategies: Focus on yield quality, payout ratio, and free cash flow coverage. Watch ex-dividend dates, tax impact, and total return versus alternatives.
Backtesting differences, data, survivorship bias, corporate actions
FX backtests can look smoother because pairs do not delist and histories run long. Your risk is bad tick data and unrealistic execution. You must model spread, slippage, and rollover costs. You also need to handle timezone and session effects.
Stock backtests face more structural traps. You must handle survivorship bias and corporate actions. You also must include delisted names or your results will inflate.
| Area | Forex | Stocks |
|---|---|---|
| Data availability | Long history for majors, quality varies by broker and feed | Broad coverage, but clean survivorship-free datasets can cost more |
| Main backtest trap | Ignoring spread, slippage, rollover, and stop execution during spikes | Survivorship bias, delistings, and missing corporate action adjustments |
| Corporate actions | Rare, mostly none | Splits, dividends, spin-offs, mergers, ticker changes, halts |
| Execution realism | Must simulate variable spreads and news slippage | Must simulate gaps, limit fills, borrow costs for shorts, and halts |
Your strategy fit depends on your time horizon and your tolerance for execution risk. FX often suits systematic intraday traders who can manage costs. Stocks often suit catalyst and portfolio-style traders who accept gap risk.
Accessibility: Capital Requirements, Product Choices, and Platforms
Minimum capital realities
FX looks cheap because brokers let you trade small contract sizes. The real constraint is your risk per trade after spreads and slippage.
- Lot sizing in FX: Standard lot is 100,000 units. Many brokers offer mini lots (10,000) and micro lots (1,000). Some offer “nano” sizing. Small size helps, but costs matter. A 1 pip spread on a micro lot is about $0.10. On a standard lot it is about $10.
- Leverage changes the math: With margin, you can control more notional than your cash balance. That can help position sizing, but it also makes drawdowns faster. See forex leverage explained.
- Fractional shares in stocks: Many brokers let you buy $1 to $10 slices of large-cap stocks and ETFs. That lowers the entry barrier for long-only investing and basic strategies.
- Shorting and options need more capital: Stock shorts require borrow availability and often higher margin. Options require approval levels and you still face assignment and gap risk.
- Pattern day trading rules: In the US, active stock day trading in a margin account typically requires $25,000 equity. FX has no PDT rule, but brokers can set their own minimums.
Instrument menu
FX gives you fewer symbols but deep liquidity in the top pairs. Stocks give you thousands of names with wider dispersion in liquidity and news risk.
- FX pairs: Majors like EUR/USD, USD/JPY, GBP/USD. Minors like EUR/GBP, AUD/JPY. Exotics like USD/TRY. Liquidity and spreads usually worsen as you move from majors to exotics.
- Stock universe: Large-caps, mid-caps, small-caps, ADRs, and sector ETFs. Your choice impacts spreads, borrow costs, halt risk, and gap size.
- ETF access: Stocks let you express macro views through broad index ETFs, sectors, and factors. FX expresses macro through relative rates and risk sentiment in a pair.
- Event concentration: FX often reacts to scheduled macro releases and central bank decisions. Single stocks can reprice on earnings, guidance, lawsuits, or buyouts.
Platform ecosystem
FX platforms optimize for charting, fast order entry, and automation. Stock platforms vary from simple apps to professional direct market access.
- FX staples: MT4 and MT5 dominate retail. cTrader is common with ECN-style brokers. You get integrated indicators, expert advisors, and one-click execution.
- Stock platforms: Many brokers run proprietary web and mobile platforms. Advanced traders use platforms with routing controls, Level 2 quotes, and hotkeys. Some offer DMA to specific venues.
- Data costs: FX quotes usually come “free” inside the broker feed. Stocks often require exchange data subscriptions for real-time Level 1 and Level 2.
- Order types and routing: FX often gives market, limit, stop, and trailing stops, with broker-dependent fill logic. Stocks add routing choices, auction participation, and exchange specific order types, depending on the broker.
- Automation: FX retail algo workflows center on MT4 and MT5. Stocks often use APIs and third-party tools. Approval, data, and compliance constraints can be higher.
Regulation and protections
Your protection depends on the product structure and the regulator. You need to know what you own and who holds it.
- Stocks: In many jurisdictions, client assets sit in custody and investor protection schemes may apply. In the US, SIPC can protect securities and cash up to limits if a broker fails, it does not protect against market losses. In the UK, FSCS can apply to eligible investments under its rules.
- Spot FX with retail dealers: You trade an OTC product, often as a contract with the broker. Oversight focuses on conduct, capital requirements, and marketing rules. Protections vary by country and entity.
- Counterparty risk: In stocks, you typically hold securities at a broker-custodian model. In retail spot FX, your exposure often sits directly with the dealer or its liquidity arrangements.
- Practical step: Check the exact legal entity, regulator, and client money rules on your account agreement. Do this before you fund.
Pros and Cons: Forex Trading
Advantages
- High liquidity. Major pairs trade in deep markets. You often get tighter spreads and faster fills than many single stocks, especially outside US large caps.
- 24/5 access. FX runs from the Asia open to the US close, five days a week. You can trade before work, after work, or around other markets.
- Small starting sizes. Many brokers let you trade micro lots and small contract sizes. You can test execution and your process without large capital.
- Macro focus. FX reacts to rates, inflation, growth, and central bank policy. You can build a clear thesis from scheduled data like CPI, jobs reports, and rate decisions.
Disadvantages
- Leverage temptations. Retail FX offers high leverage in some regions. High leverage shrinks your error margin and can turn normal volatility into large drawdowns fast.
- Swap and funding costs. Hold trades overnight and you may pay or receive swap, based on rate differentials and broker markups. In some pairs, these costs add up and can erase edge.
- Broker quality variance. Execution, slippage, spread behavior, and stop handling vary by broker and account type. Your results can depend as much on your broker as on your strategy.
Best-suited trader profiles
- Active traders. You want frequent setups and tight spreads, and you can monitor risk during liquid sessions.
- Macro learners. You like tracking rates, central bank guidance, and economic calendars, and you want a market where macro shows up fast in price.
- Schedule flexibility. You can trade specific sessions, London and New York for liquidity, Asia for range conditions, without needing a single exchange open.
Common beginner mistakes
- Overtrading. You take marginal setups because the market is always moving. You rack up spread costs and increase error risk.
- News gambling. You trade major releases without a plan for spreads widening and slippage. You treat volatility as edge.
- Ignoring position sizing. You pick lot size based on hope, not risk. Use a fixed risk per trade and calculate size from stop distance, see how to calculate position size in forex.
Pros and Cons: Stock Trading
Advantages
- Ownership. When you buy shares, you own a piece of a company. You can hold through noise and let the business compound.
- Long-term upward bias. Broad stock indexes have tended to rise over long periods as earnings grow and inflation lifts nominal prices. This gives long-only traders a structural tailwind that most markets do not.
- Dividends. Many companies pay cash dividends. Reinvested dividends can add meaningful return over time and reduce reliance on perfect entries.
- Rich fundamental data. You get financial statements, guidance, transcripts, insider trades, buybacks, and institutional ownership data. You can build a thesis with inputs beyond price.
Disadvantages
- Gaps. Stocks can gap on overnight news, upgrades, lawsuits, or macro shocks. Your stop does not protect you from a gap through your level. Your fill can be far worse than planned.
- Single-name risk. One company can blow up from fraud, regulation, product failure, or dilution. Diversification matters more than in highly liquid major FX pairs.
- Shorting constraints. Shorts can face share borrow limits, hard-to-borrow fees, forced buy-ins, and restrictions during stress. You can also face higher margin requirements and tighter risk controls from brokers.
- Earnings volatility. Earnings can move a stock 5% to 30% in minutes. Options-implied moves often fail to capture the real tail risk in smaller names. If you hold through earnings, you accept binary outcomes.
Best-suited trader profiles
- Investors. You prefer long holding periods, business quality, and compounding. You can ignore intraday noise and focus on cash flows, balance sheets, and valuation.
- Sector specialists. You track one industry and know the drivers, competitors, and cycles. You trade relative strength, pairs, and rotation with context.
- Catalyst swing traders. You trade planned events like earnings, FDA decisions, product launches, and macro prints. You define the catalyst, the time window, and your exit rules before entry.
Common beginner mistakes
- Chasing hype. You buy after a news spike or social push. You enter when liquidity thins and spreads widen, then you become exit liquidity.
- Concentrating positions. You load one or two tickers because they feel “sure.” One gap can erase weeks of gains. Cap single-name exposure and size to your stop distance.
- Ignoring valuation. You treat a great company as a great price. You ignore dilution, cash burn, and realistic growth. Use basic checks like earnings power, free cash flow, and balance sheet strength.
Which Is Better for You? Decision Framework by Goal
If you want day trading
Pick the market that fits your schedule and execution needs.
- Schedule. Forex runs 24 hours, five days a week. Stocks run in set sessions. News and gaps hit hardest around opens and earnings.
- Liquidity needs. Major FX pairs usually give tight spreads and steady fills. Many stocks trade wide, then slip on fast moves. Focus on high volume names if you trade stocks.
- Realistic expectations. Your edge must beat fees, spread, and slippage. Most new day traders lose money. Plan for months of practice before you size up.
- Capital. Forex lets you start smaller, but leverage can wipe you fast. Stock day trading often needs more capital for flexibility and risk control.
If you want long-term investing
Stocks fit long horizons because companies can grow cash flow over time.
- Compounding. You can reinvest dividends. You can hold through cycles. You can add on a schedule.
- Diversification. Single stocks add company risk. Use broad baskets to reduce it.
- ETFs. Index ETFs give instant spread across sectors and firms. Use them as a base. Add single stocks only when you can explain the business, the valuation, and the risk.
- Time requirement. You can run a long-term plan with less screen time. You still need basic review, earnings, and position sizing rules.
If you want diversification
Build a simple mix. Know what each sleeve does.
- Equities. Growth engine. Highest long-run return potential. Highest drawdown risk.
- FX. Tactical sleeve. Useful for short-term trades and hedges. Hard to hold long because carry can help or hurt.
- Cash. Stability and optionality. Keeps you from forced selling during drawdowns.
- Rule. Size FX smaller than equities unless you trade professionally. Use hard stops. Track total portfolio risk, not trade-by-trade confidence.
Self-assessment checklist
- Time available. Can you watch markets daily, or do you need a weekly process.
- Risk tolerance. Can you handle a 10 to 30 percent drawdown in equities. Can you handle rapid intraday swings in leveraged FX.
- Learning style. Do you learn by journaling and repetition, or by reading and slow iteration. Day trading rewards repetition. Investing rewards patience and process.
- Capital. Small accounts push you toward leverage and overtrading. More capital lets you risk less per trade and still make progress.
- Costs. For forex, spreads and overnight financing matter. Read how forex swap fees work before you hold positions for days.
Decision framework by goal
- Goal
- Better fit
- Why
- Watch-outs
- Trade intraday with flexible hours
- Forex
- 24 hour sessions, deep liquidity in majors, small position sizing possible
- Leverage, spread at news, overtrading
- Build wealth over years
- Stocks, ETFs
- Compounding, dividends, broad diversification
- Bear markets, single-name blowups, valuation risk
- Income and stability first
- Cash plus diversified ETFs
- Lower volatility, fewer forced decisions
- Inflation risk, slower growth
- Hedge travel, business, or foreign exposure
- Forex
- Direct currency exposure
- Carry costs, basis moves, broker risk
Sample starting paths, 30-day learning plan
30 days for forex
- Days 1 to 7. Learn order types, margin, leverage, and pip value. Pick 1 to 2 major pairs. Define risk per trade at 0.25 to 1.0 percent.
- Days 8 to 14. Build one simple setup. One trigger. One stop rule. One exit rule. Start a journal with screenshots and notes.
- Days 15 to 21. Demo trade only. Take 20 to 50 trades. Track win rate, average win, average loss, and max drawdown.
- Days 22 to 30. Go live with micro size. Keep the same rules. Cut size if you break rules. Review results weekly and remove one mistake at a time.
30 days for stocks
- Days 1 to 7. Choose your lane, investing or trading. Learn basic financial statements and how earnings dates move prices.
- Days 8 to 14. Build a watchlist of liquid names or broad ETFs. Define your risk rule and max position size.
- Days 15 to 21. Paper trade or backtest one strategy. For investing, draft a simple allocation and rebalancing rule. For trading, practice entries and exits around real spreads.
- Days 22 to 30. Go live small. Use limit orders when spreads widen. Review weekly. Track mistakes, not just profits.
Safety, Due Diligence, and Choosing a Broker
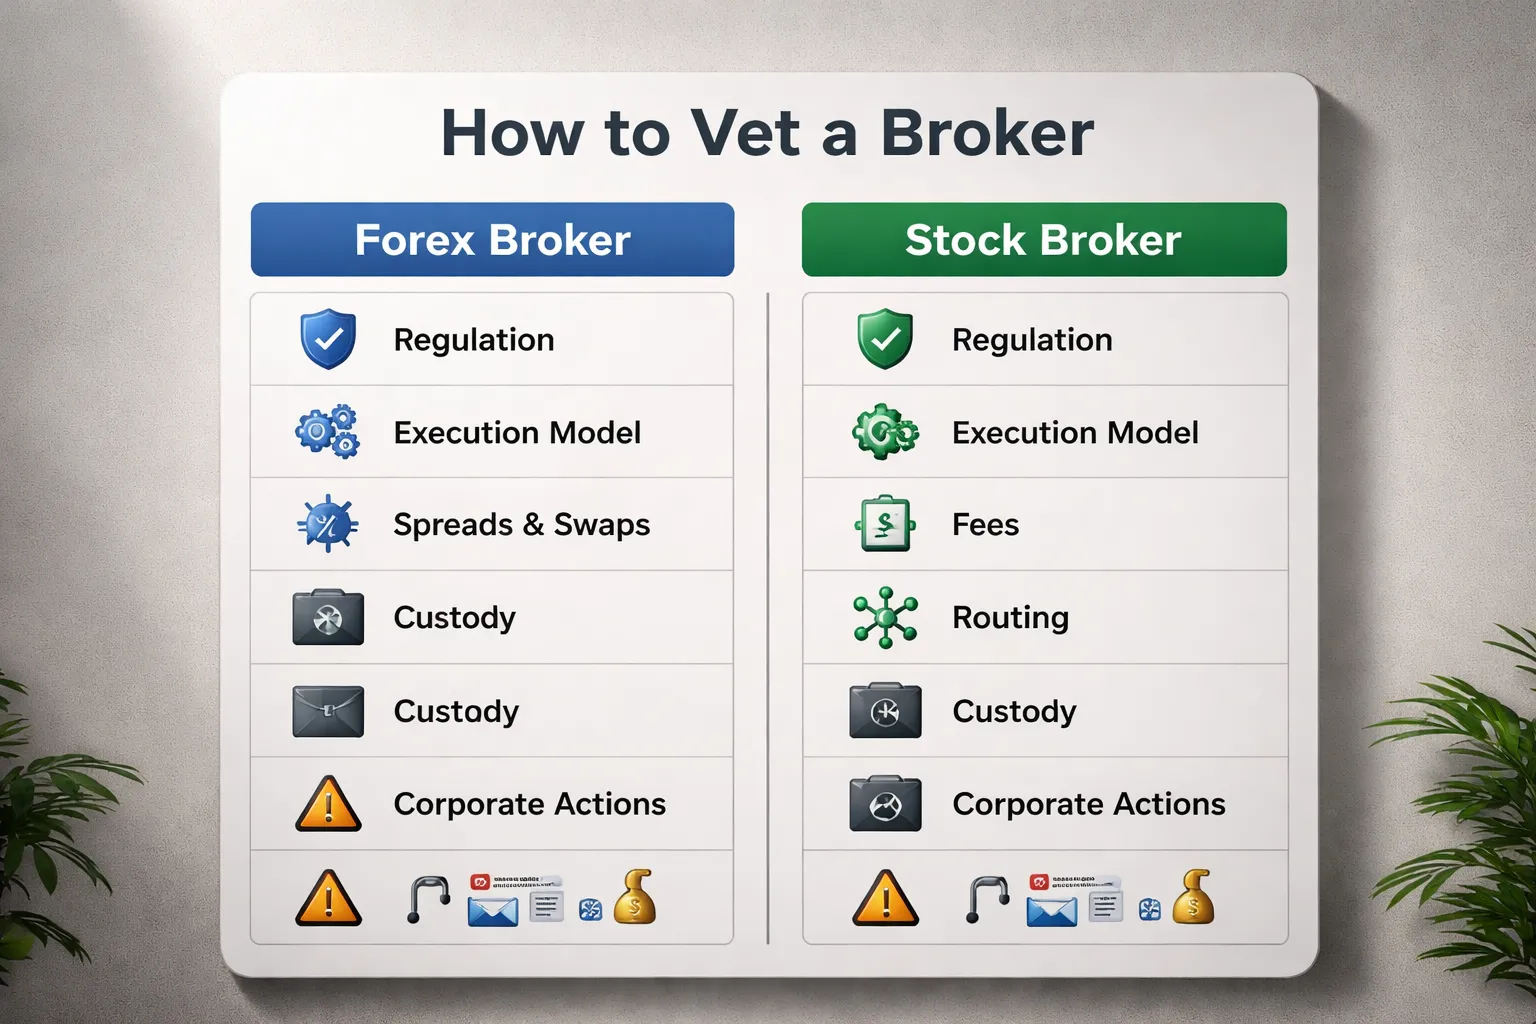
How to vet a forex broker
- Regulation and entity. Verify the exact legal entity you will trade under. Check the license on the regulator’s site, not on the broker’s footer. Match the firm name, license number, and domain.
- Client money rules. Confirm segregation, negative balance protection where applicable, and the complaint process. Read the execution and client agreement, not the marketing page.
- Execution model. Know what you are buying.
- Agency, STP, ECN style. Broker routes orders to liquidity providers, you pay spread and or commission.
- Market maker. Broker may internalize flow. This can still be fine, but you need clean fills and clear policies.
- Spreads and commissions. Compare typical spreads during your trading hours, not the “from 0.0” ad. Track your all-in cost per trade, spread plus commission.
- Swaps and financing. Swaps can dominate cost on multi-day holds. Check the swap table by pair and direction. Verify triple-swap day. Watch for wide, unstable swap rates.
- Slippage and re-quotes. Test with small live size. Measure fill quality around news and session opens. A broker that blocks trading during volatility hurts you more than a wider spread.
- Withdrawals. Run a small deposit and withdrawal test. Time it. Document fees and any “extra verification” delays.
How to vet a stock broker
- Custody and asset protection. Confirm where your shares sit, in your name or in street name. Check the investor protection scheme in your country, limits, and what it covers. Cash handling rules matter.
- Fees that hit returns. Look past headline commissions.
- Account, platform, data, inactivity, and withdrawal fees.
- FX conversion and ADR fees if you trade foreign stocks.
- Margin rates and short borrow fees if you use leverage.
- Order routing and execution. Check supported order types, market, limit, stop, stop-limit. Review price improvement stats if provided. Understand whether the broker sells order flow and what it means for your fills.
- Corporate actions. Ask how the broker handles splits, mergers, spinoffs, rights issues, tender offers, and proxy voting. Poor handling creates tax and accounting problems.
- Tax reporting. Confirm forms, cost basis tracking, dividend classification, and withholding on foreign dividends. Get clarity before you trade.
- Outages and support. Search for downtime history and incident reports. Test support response on a real question, not a sales chat.
Red flags and scams
- Guaranteed returns. Any promise of fixed profit or “no loss” signals a scam or a sales trap.
- Unverified performance. Screenshots, Telegram posts, and edited statements prove nothing. Demand audited results and full trade history. Most sellers will not provide it.
- Signal sellers with pressure tactics. Upsells, urgency, and “VIP groups” usually replace edge with marketing.
- Fake regulators and clone firms. Scammers copy real license numbers and brand names. Always use the regulator’s register and match the website domain and contact details.
- Bonus and withdrawal traps. Deposit bonuses tied to volume requirements can block withdrawals. Avoid them.
- High leverage as bait. Extreme leverage plus loose risk controls often targets beginners. Your downside scales faster than your skill.
- Payment methods that reduce traceability. Crypto-only funding, “agent” deposits, or wire instructions to unrelated companies.
- Manipulation claims as a cover. Many losses come from spread, slippage, and leverage, not conspiracies. Learn how liquidity and execution work before blaming the market, see Forex Liquidity Explained.
Demo trading and paper trading
- What they are good for.
- Learning the platform, order types, and basic workflow.
- Testing a checklist, entries, exits, and risk rules.
- Finding obvious flaws in a strategy before you pay real spreads.
- What they miss.
- Real fills, slippage, partial fills, and spread spikes.
- Swap, borrow costs, and hidden fees that show up in live trading.
- Emotional errors, revenge trades, and size creep.
- Liquidity changes around news, session opens, and market stress.
- How to use them well. Treat the demo as a rehearsal. Use your planned position size rules. Track execution assumptions. Move to a small live account fast, then measure real costs trade by trade.
Frequently Asked Questions
Which is better for beginners, forex or stocks?
It depends on your constraints. Forex offers small position sizes and low account minimums, but high leverage raises blow up risk. Stocks have lower leverage and clearer costs, but pattern day trading rules and higher share prices can limit you.
Is forex riskier than stocks?
Forex often becomes riskier because brokers offer higher leverage. A 1 percent move with 30:1 leverage can swing your account by about 30 percent before spreads and swaps. Stocks can gap on earnings, but you control leverage more.
How much money do you need to start?
Many forex brokers let you start with $50 to $500. Small accounts still face spread and swap drag. For stocks, practical starts often run $500 to $2,000 so you can diversify and avoid over sizing one position.
What is a pip in forex, and what is the stock equivalent?
A pip is a standard price increment in most currency pairs, often 0.0001. Your profit or loss depends on position size. In stocks, the equivalent is the tick, usually $0.01 per share for most US listed stocks.
Do forex traders pay commissions?
Sometimes. Many accounts price trades through the spread. Some add a commission and offer tighter spreads. Your real cost equals spread plus commission plus any overnight swap. Track it per trade, not per month.
What fees matter most in stock trading?
Focus on bid ask spread, commissions if any, and borrow fees for short selling. Watch for SEC and exchange fees on US stocks. Slippage during fast moves can exceed stated commissions, especially in small caps.
Can you trade forex 24 hours a day?
Forex runs 24 hours a day from Monday to Friday, but liquidity varies by session. Spreads often widen around rollover, news, and session transitions. Use a schedule that matches liquid hours. See forex market hours.
What leverage should you use?
Use the lowest leverage that lets you execute your plan. Many retail traders cap effective leverage at 1:1 to 5:1. Higher leverage forces tighter stops and increases margin call risk. Match leverage to stop distance and volatility.
Is day trading easier in forex than stocks?
Forex avoids pattern day trading rules in many jurisdictions and offers tight spreads in major pairs. Stocks offer more single name catalysts but can gap and halt. Ease comes from your execution, your costs, and your ability to follow a repeatable plan.
Which market is more liquid?
Major forex pairs often provide deep liquidity and consistent fills in active sessions. Large cap stocks also trade with tight spreads, but liquidity varies by ticker and time. Small caps can have wide spreads and sharp slippage.
Are profits taxed differently?
Yes, rules vary by country. In the US, stock gains usually fall under capital gains rules. Some forex products can fall under different tax treatment based on how you trade them. Confirm treatment with a qualified tax professional.
Can you trade forex and stocks on the same platform?
Some brokers offer multi asset accounts. Check instrument type, pricing model, and data quality. Confirm you can place stop orders reliably and see real spreads. Test with a small live account before you scale size.
Conclusion
Conclusion
Forex and stocks reward different strengths. Forex gives you near 24 hour access, tight liquidity in major pairs, and leverage that can cut both ways. Stocks give you company level catalysts, clearer fundamentals, and a wide range of risk profiles across sectors and market caps.
Pick the market that fits your schedule, your edge, and your risk limits. If you trade short term, prioritize execution quality, spread and commission, slippage, and stop order behavior. If you invest or swing trade, prioritize data quality, borrow costs for shorts, earnings calendars, and corporate actions.
- Start with position sizing. Define your max loss per trade and per day before you pick a setup.
- Control leverage. Use the lowest leverage that still lets your strategy work.
- Trade liquid instruments. Major FX pairs and large cap stocks usually give better fills and lower implicit costs.
- Track total cost. Measure spread, commission, swaps or financing, and slippage in your journal.
- Prove it small. Trade a small live size until your results hold up across at least 50 to 100 trades.
Your final step is simple. Write your risk rules, then backtest and forward test one strategy in one market. If you cannot define how you avoid forced liquidation, read margin call vs stop out and tighten your limits before you scale.
-
Forex Leverage Explained: How It Works, Pros, Cons & Examples
1 month ago -
Forex Market Hours & Trading Sessions Explained (Best Times to Trade)
1 month ago -
What Is a Lot Size in Forex? Lot Types + Quick Examples
1 month ago -
How to Calculate Position Size in Forex (Position Sizing Formula + Examples)
1 month ago -
What Are Pips in Forex? Definition, Examples & Why They Matter
1 month ago
-
-
- Typical Leverage Availability: Retail FX vs Equity Margin Rules
- Margin Calls, Stop-Outs, and Negative Balance Protection
- Position Sizing Frameworks: % Risk, ATR Sizing, and Notional Exposure
- Drawdowns and Compounding: How High Leverage Sabotages Consistency
- Risk Tools Checklist: Stops, Limits, Hedging, and Max Daily Loss Rules
-
- Technical analysis fit, indicators, structure, multi-timeframe
- Fundamental workflows, macro view vs company financials
- Popular forex approaches, scalping, intraday mean reversion, carry
- Popular stock approaches, swing catalysts, value or growth, dividends
- Backtesting differences, data, survivorship bias, corporate actions
-
- Which is better for beginners, forex or stocks?
- Is forex riskier than stocks?
- How much money do you need to start?
- What is a pip in forex, and what is the stock equivalent?
- Do forex traders pay commissions?
- What fees matter most in stock trading?
- Can you trade forex 24 hours a day?
- What leverage should you use?
- Is day trading easier in forex than stocks?
- Which market is more liquid?
- Are profits taxed differently?
- Can you trade forex and stocks on the same platform?
-
-
- Typical Leverage Availability: Retail FX vs Equity Margin Rules
- Margin Calls, Stop-Outs, and Negative Balance Protection
- Position Sizing Frameworks: % Risk, ATR Sizing, and Notional Exposure
- Drawdowns and Compounding: How High Leverage Sabotages Consistency
- Risk Tools Checklist: Stops, Limits, Hedging, and Max Daily Loss Rules
-
- Technical analysis fit, indicators, structure, multi-timeframe
- Fundamental workflows, macro view vs company financials
- Popular forex approaches, scalping, intraday mean reversion, carry
- Popular stock approaches, swing catalysts, value or growth, dividends
- Backtesting differences, data, survivorship bias, corporate actions
-
- Which is better for beginners, forex or stocks?
- Is forex riskier than stocks?
- How much money do you need to start?
- What is a pip in forex, and what is the stock equivalent?
- Do forex traders pay commissions?
- What fees matter most in stock trading?
- Can you trade forex 24 hours a day?
- What leverage should you use?
- Is day trading easier in forex than stocks?
- Which market is more liquid?
- Are profits taxed differently?
- Can you trade forex and stocks on the same platform?
-
Forex Lot Size Calculator: How to Use It to Size Trades Correctly
1 month ago -
How to Calculate Position Size in Forex (Position Sizing Formula + Examples)
1 month ago -
Forex Leverage Explained: How It Works, Pros, Cons & Examples
1 month ago -
Margin vs Leverage in Forex: What’s the Difference?
1 month ago -
What Is Forex Trading? A Beginner’s Guide to How It Works
1 month ago
-
Forex Leverage Explained: How It Works, Pros, Cons & Examples
1 month ago -
Forex Market Hours & Trading Sessions Explained (Best Times to Trade)
1 month ago -
Is Forex Trading Legal in the United States? Rules, Regulators & What to Know
1 month ago -
What Is a Lot Size in Forex? Lot Types + Quick Examples
1 month ago -
Forex Trading Platforms Comparison: MetaTrader vs cTrader vs TradingView
1 month ago