Fundamental Analysis in Forex Explained (What Actually Moves Prices)

Forex prices move when new information changes expectations. Rates, growth, inflation, and risk flow into yields and capital flows, then into currency demand.
Fundamental analysis is the process of linking those data points to price moves. You track what central banks signal, what the economy prints, and how markets reprice the path of interest rates.
In this guide, you will learn the core drivers that matter most, the releases that tend to move fast, and the simple chain from data to yields to FX. You will also learn how to read the market’s baseline, spot surprise risk, and avoid trading the wrong story.
If you need the tools first, start with the forex economic calendar.
Key Takeaways
Key Takeaways
- In het kort: FX moves when the market reprices the path of interest rates.
- In het kort: Focus on rate differentials, bond yields, and central bank guidance.
- In het kort: Data matters when it changes expectations, not when it looks “good” or “bad” in isolation.
- In het kort: The fastest moves come from surprises versus consensus, not the headline itself.
- In het kort: Your edge comes from knowing the baseline, then measuring surprise risk.
- In het kort: Track the chain: data, inflation and growth expectations, yields, rate pricing, FX.
- In het kort: Avoid trading stale stories, price often moves before the release.
- Central banks set the tone. Your job is to track what they want, and what the market thinks they will do next.
- Yields lead FX during policy sensitive periods. Watch the front end for rate expectations, and the curve for growth and risk signals.
- Inflation prints move pairs when they shift the timing and size of cuts or hikes. Focus on core measures and sticky components.
- Labor data moves fast because it feeds wage pressure and consumption. Watch jobs, wages, and participation, not one number.
- Growth data matters when it changes recession risk. Soft surveys can move before hard data confirms the trend.
- Risk sentiment can override rates in stress. In those periods, safe havens and funding currencies can move on flows, not forecasts.
- Always compare actuals to expectations. Use consensus, prior, revisions, and positioning clues to judge reaction risk.
- Build a simple plan for each major release. Define the baseline, map the upside and downside surprises, then decide your levels.
- If you need structure, use a calendar with consensus and history. Start with a step-by-step forex economic calendar guide.
Fundamental analysis in forex explained: what it is and why it matters
How currencies are priced as a relative story, Country A vs Country B
Forex prices move on differences, not absolutes. Every pair prices two economies at once. You trade the spread between them.
Start with the two central banks. Rate paths set the core pricing. Markets care about where policy goes next, not where it sits today.
Then map the drivers that change those paths. Inflation trends. Labor markets. Growth. Credit stress. Fiscal spending. Politics when it shifts policy risk.
Track relative change. If both countries improve, the currency with the bigger upside surprise often wins. If both weaken, the one that looks less bad often wins.
The difference between “good news” and “good for the currency”
Headline direction does not equal currency direction. What matters is how the data changes expected policy, expected growth, and risk premium.
- Good growth can lift a currency if it raises rate expectations. It can hurt if it widens deficits, boosts imports, or triggers easing later.
- High inflation can lift a currency if it forces tighter policy. It can hurt if it crushes real income and growth, or if the central bank looks trapped.
- Strong jobs can lift a currency if it keeps policy restrictive. It can fade if wages cool, participation rises, or revisions cut the story.
- Risk-off shocks can lift funding and haven currencies even with weak domestic data. Flows can dominate fundamentals in the moment.
Always grade the release against expectations and positioning. A “good” number that everyone already priced can trigger a sell-off. A “bad” number with low expectations can rally.
Time horizons, intraday catalysts vs multi-month themes
Separate what moves price today from what re-prices a trend.
- Intraday catalysts include CPI, jobs, GDP, rate decisions, press conferences, and sudden risk headlines. These change front-end rate pricing fast.
- Multi-month themes include the inflation regime, growth divergence, fiscal stance, terms of trade, and policy credibility. These shape multi-week positioning and carry demand.
Match your tools to your horizon. For intraday trades, focus on expectations, reaction function, and liquidity. For swing trades, track rate differentials, real yields, and the direction of the macro data trend.
If you trade major USD pairs, keep a pair-specific driver list. See what moves USD/JPY for a clean example of how yields, BoJ policy, and risk sentiment interact.
Common myths that confuse newer traders, and what’s actually true
- Myth: Strong data always strengthens a currency. True: Only surprises that shift the expected path matter, and only if the market is not already positioned for it.
- Myth: One indicator drives the pair. True: Markets trade the full policy mix. Inflation, jobs, and financial conditions link together through the central bank reaction function.
- Myth: The news itself moves price. True: Price moves on the gap between actual and expected, plus revisions, guidance, and what traders already own.
- Myth: Fundamentals give exact targets. True: Fundamentals define bias and scenarios. Levels come from liquidity, positioning, and technical structure.
- Myth: Fundamentals work only long term. True: Big releases drive minutes to hours, and themes drive weeks to months. You choose the horizon, then filter the noise.
What actually moves forex prices: the core drivers
Interest rate differentials, yield expectations, and carry trades
Forex prices respond to money moving toward higher expected returns. Rates set the baseline.
- Rate differential: The gap between two countries’ short-term policy rates. Wider gaps tend to support the higher-yielding currency.
- Expected path: Markets price where rates will be in 3, 6, and 12 months. A currency can rise even if the central bank holds rates, if expected future cuts get removed.
- Front end matters: FX often tracks the 2-year yield spread more than the 10-year. The 2-year reflects policy expectations.
- Carry trade: You borrow low yield, buy high yield, and collect the interest. It works best in calm markets. It breaks fast when volatility jumps and funding dries up.
- What moves price day to day: Changes in expectations, not the level. Watch rate futures, OIS pricing, and “terminal rate” repricing after data and central bank guidance.
Inflation trends and why real yields often matter more than nominal yields
Inflation changes purchasing power and central bank reaction. Real yields often drive the cleaner signal.
- Nominal yield: The stated interest rate.
- Real yield: Nominal yield minus expected inflation. Currencies tend to favor markets with rising real yields.
- Sticky inflation: Keeps rate cuts off the table. That usually supports the currency through higher expected yields.
- Disinflation: Pulls expected rates down. That can weaken the currency even if growth holds up.
- What to track: CPI trend, core inflation, wage growth, inflation expectations, and central bank credibility. Focus on the direction and surprises versus consensus.
Economic growth and productivity as long-run currency forces
Growth changes capital demand. Productivity changes the return on capital. These shape multi-month and multi-year currency trends.
- Relative growth: Faster growth can lift a currency by attracting investment and pushing yields higher.
- Productivity: Strong productivity supports profits and real wage growth without pushing inflation as much. That can support a stronger currency over time.
- External balance: Growth that widens deficits can offset the benefit. A country that must import capital can face currency pressure when financing tightens.
- What to track: GDP momentum, PMIs, employment, investment, unit labor costs, and current account balance. Compare one economy to the other in the pair.
Risk sentiment: why USD, JPY, and CHF behave differently in risk-off moves
Risk moves flows. In stress, traders cut leverage, close carry, and buy liquidity.
- USD: Benefits from global funding demand and safe collateral demand. In risk-off, USD often rises as investors hoard liquidity and repay dollar debt.
- JPY: Strengthens when carry unwinds. Japan’s low rates make JPY a common funding currency. Risk-off triggers buybacks of JPY shorts.
- CHF: Acts as a defensive currency due to stable institutions and strong external balance. It can rally in European stress and broad de-risking.
- Practical read: If equities drop and volatility spikes, expect high-beta currencies to weaken and funding currencies to strengthen. The rate story can pause in panic and resume after volatility stabilizes.
For a pair-specific breakdown, see What Moves USD/JPY? Drivers, Risk Sentiment & Rate Differentials.
Capital flows and positioning (portfolio flows, hedging, rebalancing)
Flows move price because FX must clear. Positioning changes how far price can move on the same headline.
- Portfolio flows: Bonds and equities attract foreign buyers. If they do not hedge the currency, demand lifts the currency. If they hedge, spot impact shrinks, but forward demand rises.
- Corporate hedging: Exporters sell foreign currency and buy home currency. Importers do the opposite. Large hedges cluster around known levels and dates.
- Rebalancing: End of month and quarter can trigger mechanical FX hedging. Strong equity months can create predictable hedging flows.
- Positioning: When the market crowds into one trade, you get asymmetric moves. Bad news hits harder if everyone already owns the currency. Good news pops less if the trade feels “full.”
- What to track: CFTC positioning, options risk reversals, forward points, cross-currency basis, and large moves with no new information. Those often signal flow, not fundamentals.
Central banks: the #1 fundamental catalyst in FX
Central banks: the #1 fundamental catalyst in FX
Central banks set the price of money. FX prices follow the expected path of that price. When expectations shift, currencies move fast.
Monetary policy tools that move currencies
- Policy rates. Hikes raise short-end yields and usually support the currency. Cuts do the opposite. What matters is the next 3 to 12 months, not last meeting.
- QE and QT. QE adds duration demand and pushes longer yields down. QT removes that support and can push term premia up. FX reacts through yield differentials and risk conditions.
- Forward guidance. Central banks move markets with words when they can anchor the expected path. Strong guidance can reprice the curve without an immediate rate move.
- Liquidity tools. Swap lines, repo facilities, and emergency programs reduce funding stress. That can weaken safe-haven demand and stabilize high beta currencies.
The reaction function, how markets infer the next move
You trade the central bank’s rulebook. Markets estimate it from repeated behavior.
- Inflation above target plus tight labor tends to raise hike odds.
- Growth deterioration plus easing inflation tends to raise cut odds.
- Financial stress shifts focus to stability, even if inflation stays high.
- Policymakers often react to the direction of core inflation and wages, not one CPI print.
Track what the bank says it needs to see. Then track the data that answers that. When the answer changes, the currency reprices.
Reading rate expectations with yield curves and OIS-style pricing
Spot FX often follows the front end. Your base toolkit is simple.
- 2-year yield differentials. A quick proxy for policy expectations between two countries. Trends in FX often track trends in this spread.
- Curve shape. A steeper front end can signal rising hike odds. A bull steepener can signal cut pricing. Curve moves matter more than the level.
- OIS implied rates. OIS curves price the expected policy path with less credit noise than government bills. Use them to estimate hike or cut probabilities into each meeting.
- Meeting-to-meeting repricing. Compare pricing before and after key releases. Large gaps tell you the market had the wrong forecast distribution.
| What changes | What to watch | Typical FX impact |
|---|---|---|
| Next 1 to 3 meetings get repriced | OIS meeting rate, 2-year yield | Fast move, trend can start |
| Terminal rate reprices | 1-year to 3-year curve, forward rates | Bigger directional follow-through |
| Balance sheet path shifts | Long-end yields, term premium proxies | Slower move, often via risk channel |
Communication risk, statements, pressers, minutes, and speeches
Central banks manage expectations. You need to manage headline risk.
- Statement. Look for changes in inflation language, growth assessment, and guidance. One sentence can move the curve.
- Press conference. The Q&A can reverse the first move. Traders focus on how the chair frames the next meeting and the reaction to financial conditions.
- Minutes. They reveal internal debate, not just the decision. Watch for discussion on timing, balance of risks, and what data would change views.
- Speeches. Markets reprice when a core voter signals discomfort with current pricing. Treat unscheduled remarks as volatility events.
If you trade around meetings, plan the order of impact. Statement first, then presser, then follow-up headlines. Use smaller size if your edge depends on perfect execution. Link your trade idea to a specific repricing in OIS, not to a vague “hawkish” label.
If you want a tighter event plan, use this guide on FOMC meeting preparation.
Policy divergence, why relative central-bank paths drive trends
FX is relative. You do not trade one central bank. You trade one path versus another.
- When one bank tightens while the other pauses, yield spreads widen. Trends often follow.
- When both ease but one eases faster, the faster easer tends to weaken.
- When markets price different landing points for inflation and growth, divergence persists and spot can trend for months.
Build your bias from the spread between expected policy paths. Then validate with inflation and growth surprises. When those surprises flip, assume the divergence trade can unwind fast.
Macro indicators that matter most (and how to interpret them)
Inflation releases: CPI, core CPI, and PCE
Inflation data moves FX because it changes the expected policy path. Traders care less about the level and more about the surprise versus consensus.
- CPI headline drives the first reaction. It swings on energy and food. It matters most when energy shocks feed into expectations.
- Core CPI strips food and energy. FX traders use it to judge persistence. A hot core print usually lifts yields and the currency.
- PCE matters most in the US because the Fed targets it. Core PCE often drives the medium term repricing, even if CPI made the first move.
What to watch inside the release.
- Monthly pace matters more than year over year for turning points. Traders annualize the latest 3 to 6 months in their heads.
- Services ex housing in the US often sets the tone for “sticky” inflation. Sticky equals higher for longer.
- Trimmed mean or median measures help you filter one offs. If they trend higher, the market trusts the move.
Interpretation framework.
- Hot inflation plus firm growth usually supports the currency via higher terminal rate pricing.
- Hot inflation with weak growth can split the reaction. FX may fade the move if the market shifts to recession risk.
- Cool inflation streak matters more than one print. Three soft prints can unwind a divergence trade fast.
Jobs data: NFP, unemployment, participation, wages, revisions
Labor data drives FX because central banks react to labor tightness and wage pressure. The first headline move often comes from jobs added, then the market checks wages and unemployment.
- NFP payrolls hits expectations for growth momentum. Big beat or miss moves rates first, then spot follows.
- Unemployment rate matters when it breaks trend. A rise with stable participation signals cooling demand for labor.
- Participation rate changes the story. Higher participation can lift unemployment without a weak economy. Traders often treat that as less inflationary.
- Wage growth links labor to inflation. If payrolls beat but wages cool, FX often fades the bullish move.
- Revisions can overturn the headline. Two months of downward revisions plus a decent headline still equals a soft report.
Interpretation framework.
- Strong jobs plus rising wages supports hawkish repricing and the currency.
- Strong jobs plus falling wages often caps the currency move.
- Weak jobs plus rising unemployment usually drives dovish pricing and currency weakness, unless risk off flows dominate.
GDP and leading indicators: PMIs and ISMs for turning points
GDP is a lagging summary. PMIs and ISMs lead. Use them to spot turning points before the central bank signals them.
- GDP matters when it changes the recession narrative. Markets often fade GDP if the latest monthly data points the other way.
- PMI and ISM headline track breadth. Expansion and contraction lines matter most, especially around 50.
- New orders leads the cycle. Rising new orders often comes before better payrolls and better risk sentiment.
- Prices paid flags pipeline inflation. Falling prices paid can pull down future inflation prints.
- Employment component connects surveys to jobs. Weak survey employment often precedes softer payroll trends.
Interpretation framework.
- PMIs rising while inflation cools can strengthen the currency if it lifts yields and risk appetite.
- PMIs falling fast can overpower inflation and push the market toward cuts. Spot can trend before the central bank confirms it.
Retail sales: consumer strength as a growth signal
Retail sales moves FX because consumption drives near term growth, especially in the US and UK. Treat it as a demand pulse.
- Control group matters more than the headline in the US because it feeds GDP. Know what your country’s “core” measure is.
- Real versus nominal matters. Strong nominal sales with high inflation can still mean flat real demand.
- Big revisions change the trend. You should read the prior month as much as the current one.
Interpretation framework.
- Strong retail plus hot inflation usually boosts the currency via higher rate expectations.
- Weak retail with easing inflation accelerates cut pricing and can pressure the currency.
Housing and credit: early-cycle clues
Housing and credit often turn before GDP. They matter because they react fast to rates, then feed back into growth and inflation.
- Housing starts and permits lead construction activity. Permits often turn first.
- Home sales reflect financing conditions and household confidence. Falling volumes can signal tighter conditions before layoffs show up.
- House prices and rent measures feed inflation with a lag. A turn in housing can signal future disinflation.
- Credit growth and lending standards show how fast policy transmits. Tightening standards often precedes weaker consumption and investment.
- Spreads matter. Wider corporate spreads often mean risk stress, slower growth, and a shift toward dovish pricing.
Interpretation framework.
- Housing stabilizes while inflation cools supports a soft landing view and can lift the currency if yield differentials widen.
- Credit tightens fast can kill a divergence trade. It drags growth expectations down and pulls rate paths lower.
Use these releases to map surprises to the policy path. Track the direction of surprises, not your opinion of the economy. If you need a workflow, use an economic calendar checklist so you log consensus, actual, revisions, and the rate repricing after each print.
External balances and valuation: the slow-moving forces
Trade balance and current account, when deficits matter (and when they don’t)
External balances move slowly. They still set the backdrop for multi month trends.
The trade balance is exports minus imports. The current account adds services, income flows, and transfers. You care about the current account for FX.
A deficit matters when it needs foreign funding at the same time global capital gets picky. That usually happens when rates rise, volatility rises, or growth falls.
A deficit matters less when your country offers high real yields, has strong institutions, or issues debt in its own currency. The funding stays available.
Focus on three checks.
- Size, current account as a percent of GDP. Larger gaps need constant inflows.
- Quality, stable FDI and long term investors help, hot flows hurt.
- Cycle, deficits often widen late cycle from strong domestic demand, then shrink in slowdowns.
Practical workflow. Track the 12 month rolling current account. Compare it to the 12 month change in the real effective exchange rate. When the currency rises while the external balance deteriorates, you have a tension point. It does not force an immediate reversal, but it raises crash risk when funding conditions tighten.
Terms of trade and commodity exposure (AUD, CAD, NZD, NOK)
Terms of trade means export prices versus import prices. It is one of the cleanest links between the real economy and FX for commodity currencies.
When export prices rise, the country earns more foreign currency for the same volume. Income rises. The external balance improves. The currency usually gets support.
Map each currency to its dominant export and the pricing currency.
- AUD, iron ore, coal, LNG. China demand and global construction matter.
- CAD, crude oil and refined products. US growth and pipeline constraints matter.
- NZD, dairy and agricultural exports. Global food prices and China matter.
- NOK, oil and gas. European energy balance and policy risk matter.
Do not trade the spot commodity chart alone. Use a simple checklist.
- Track the commodity in local terms, commodity price times USDFX, because many exports price in USD.
- Watch export volumes and shipping constraints, price can rise while volumes fall.
- Compare the terms of trade trend with the current account trend.
- Check whether the central bank treats the move as inflationary or growth positive, the policy reaction can flip the FX response.
If you want the inflation link, connect this with inflation and exchange rates.
Foreign debt, funding stress, and the role of USD liquidity
External debt is the slow risk that turns into a fast move.
Two cases create the worst outcomes.
- Local borrowers owe in foreign currency, usually USD.
- Short term external debt is large versus reserves.
When USD funding tightens, borrowers scramble for dollars. They sell local currency to pay USD liabilities. That can drive large depreciations even without new local data.
Use measurable stress gauges.
- FX swap basis and cross currency basis, wider stress means harder USD funding.
- Broad dollar index, a rising USD often tightens global financial conditions.
- Reserve adequacy, months of imports and short term debt coverage.
- Net international investment position, a large negative NIIP raises sensitivity to risk off moves.
Simple rule. The more a country relies on external USD funding, the more the currency trades like a risk asset in drawdowns.
Purchasing power parity (PPP) and why “cheap” currencies can stay cheap
PPP compares what money buys across countries. It gives you a long run anchor. It does not give you a trade timing tool.
A currency can look cheap on PPP for years because the market prices three things that PPP ignores.
- Rate differentials, higher yields attract capital, lower yields repel it.
- Risk premium, political risk, policy credibility, and liquidity affect required returns.
- External funding, countries that need steady inflows trade at a discount in stress regimes.
Use PPP as a filter, not a trigger. When PPP undervaluation lines up with improving external balances and a stabilizing policy path, you have a durable setup. When PPP undervaluation sits next to widening deficits and rising funding stress, the currency can stay cheap or get cheaper.
Fiscal policy, deficits, and political stability as confidence drivers
Fiscal policy sets the supply of government debt and the credibility of the macro framework.
FX cares about the deficit when it changes the inflation and rate path, or when it threatens the buyer base for the bond market.
Watch these inputs.
- Primary balance, deficit before interest costs. This shows the underlying stance.
- Debt to GDP and the maturity profile. Short maturities raise rollover risk.
- Share held by foreigners. High foreign ownership can amplify moves.
- Fiscal and monetary coordination. Markets punish pressure on central bank independence.
- Political stability. Unclear election outcomes, unstable coalitions, and policy reversals raise the risk premium.
Practical workflow. Track budget announcements, debt issuance calendars, and rating agency outlook changes. Then watch how the front end and long end of the yield curve react. If yields rise and the currency falls together, the market signals confidence loss, not growth optimism.
Geopolitics and event risk in forex
Elections, referendums, and policy uncertainty premiums
Politics moves FX when it changes the expected path of growth, inflation, and rates. You see it first in the risk premium. The premium shows up as wider bond spreads, weaker local equities, and a cheaper currency.
Track what can change fast. Fiscal rules, central bank independence, capital controls, trade policy, and energy policy. Markets price uncertainty before they price the final result.
- Watch polling trends, not headlines. Focus on probability shifts in outcome and coalition math. Large late swings raise FX volatility more than a close race that stays stable.
- Map each outcome to policy. Write down what each side implies for taxes, spending, regulation, and the central bank. If you cannot map it, you cannot price it.
- Use local rates as the lie detector. If the front end sells off and the currency drops, the market fears inflation, fiscal slippage, or policy interference.
- Use cross currency basis and CDS for stress. If funding costs spike, FX weakness can accelerate even without new domestic data.
War, sanctions, and energy shocks: transmission into FX
Geopolitical shocks hit FX through trade flows, terms of trade, and funding conditions. Energy matters because it resets inflation and growth expectations in one move.
- Energy importers. Higher oil or gas prices worsen the trade balance, raise inflation, and squeeze real incomes. The currency often weakens even if the central bank hikes.
- Energy exporters. Higher prices can support the currency through export receipts and fiscal revenue. The support fades if sanctions or production limits block flows.
- Sanctions. They reduce export earnings, limit access to funding, and force reserve usage. You often see a step change, not a gradual trend.
- Shipping and supply routes. Freight and insurance costs raise import prices. That pushes inflation up and growth down, a bad mix for most currencies.
Use data that updates fast. Oil and gas benchmarks, refinery margins, LNG and pipeline flows, and sovereign spreads. Then link it to CPI and the rate path, which you can anchor with your inflation framework from inflation and exchange rates.
Safe-haven behavior vs local currency vulnerability
Risk off does not hit every currency the same way. The market sorts currencies by liquidity, external balance, and funding dependence.
- Safe havens. Deep bond markets, strong institutions, and funding demand support them when volatility spikes. The move often comes with falling local yields and a stronger currency.
- High beta G10 and EM. Current account deficits, high external debt, and reliance on portfolio inflows raise vulnerability. You often see weaker FX and wider spreads at the same time.
- Reserve and intervention limits. Low reserves versus short term external debt increases crash risk. Watch reserve levels, forward book signals, and offshore pricing gaps.
- Commodity linkage. Terms of trade can dominate risk sentiment. If the key export price collapses, the currency can fall even on a calm global tape.
How to manage gap risk around unpredictable headlines
Geopolitics creates gaps because liquidity disappears. You manage it with position sizing, structure, and timing, not with better predictions.
- Cut leverage before known binary windows. Elections, referendums, major court rulings, sanction deadlines, peace talks, and weekend summits.
- Define your invalidation level. Place it where the thesis breaks, not where the chart looks neat. Size the trade so a gap through that level stays survivable.
- Avoid holding large positions into weekends. Many geopolitical announcements land when FX markets are closed. The open can gap past stops.
- Use options when headlines dominate. You pay premium, you cap downside. Prefer structures with limited loss if implied volatility is not extreme.
- Check liquidity conditions. Around late Friday New York, holidays, and thin Asia sessions, spreads widen and slippage rises. Reduce size or stay flat.
- Separate signal from noise. Trade only when the headline changes policy, cash flows, or funding access. Ignore commentary that does not change constraints.
Keep a simple event checklist. What can be announced, who decides it, when it hits the tape, and which assets will price it first. Use an economic calendar workflow for scheduled risk, then treat geopolitics as a separate overlay.
Supply, demand, and microstructure: why the market moves beyond data
Order flow, liquidity, and why thin markets exaggerate moves
FX prices move when someone must trade and someone else must take the other side. Data matters, but the tape follows execution. Dealers, bank algos, hedge funds, real money, corporates. Each has different urgency.
Liquidity is not constant. It clusters at round numbers, recent highs and lows, and around option strikes. When liquidity is thick, large trades clear with less impact. When liquidity is thin, small trades move price more.
- Thin conditions: Asia hours in some pairs, holidays, pre data, post data when quotes widen, late Friday, and around fix windows.
- Widening spreads: dealers protect inventory. Your stop distance needs to reflect it.
- Gaps and air pockets: price jumps between levels when no one shows size. This creates sharp candles with little follow through.
- Stop runs: clustered stops become liquidity. Price can move through a level to fill, then snap back.
Use a simple microstructure checklist. Check time of day. Check spreads. Check depth around your level. If your entry depends on tight liquidity, skip the trade when spreads expand.
Positioning and sentiment indicators (COT, options skew, risk reversals)
Positioning turns a good story into a crowded trade. Crowds create fragility. When everyone already holds the same exposure, the next surprise triggers forced exits, not new buying.
- COT reports: track net positioning in futures. Use them for extremes, not timing. Watch leveraged funds for momentum trades, watch asset managers for slower flow.
- Options risk reversals: show demand for calls versus puts. A rising risk reversal signals traders pay up for upside protection or upside exposure in that currency.
- Options skew and implied volatility: rising implied vol with one sided skew often means hedging pressure. That pressure can drive spot through hedging and delta adjustments.
Practical use. Mark historical percentiles for COT and for 1M and 3M risk reversals. If positioning sits at an extreme and the macro catalyst disappoints, expect a violent unwind. If positioning sits light and risk reversals shift, expect trend extension.
Seasonality and month or quarter-end flows
Some flows have nothing to do with data. They come from mandates and rebalancing. They can dominate spot for hours, sometimes days.
- Month-end equity hedging: when global equities rise, foreign equity exposure grows. Funds rebalance currency hedges, which can create predictable buying or selling.
- Quarter-end and year-end: larger rebalancing, tighter liquidity, and more fix related execution.
- Corporate patterns: invoice and tax cycles can create seasonal demand for specific currencies.
Track the calendar. Add month-end and quarter-end markers to your plan. Respect London 4pm fix windows if you trade intraday. Reduce size when you see flow-driven moves with no change in rates, policy, or risk.
Correlation regimes: FX vs equities, rates, and commodities
Correlations change because the dominant driver changes. In one regime, FX follows rates. In another, it follows equities and volatility. In commodity currencies, it can follow terms of trade.
Do not assume yesterday’s correlation holds today. Check a rolling 20 day and 60 day correlation between your pair and the main driver for that regime. When correlations break, reduce conviction. Your model may be out of date. For pair-specific drivers, see what moves EUR/USD.
A step-by-step framework to do forex fundamental analysis
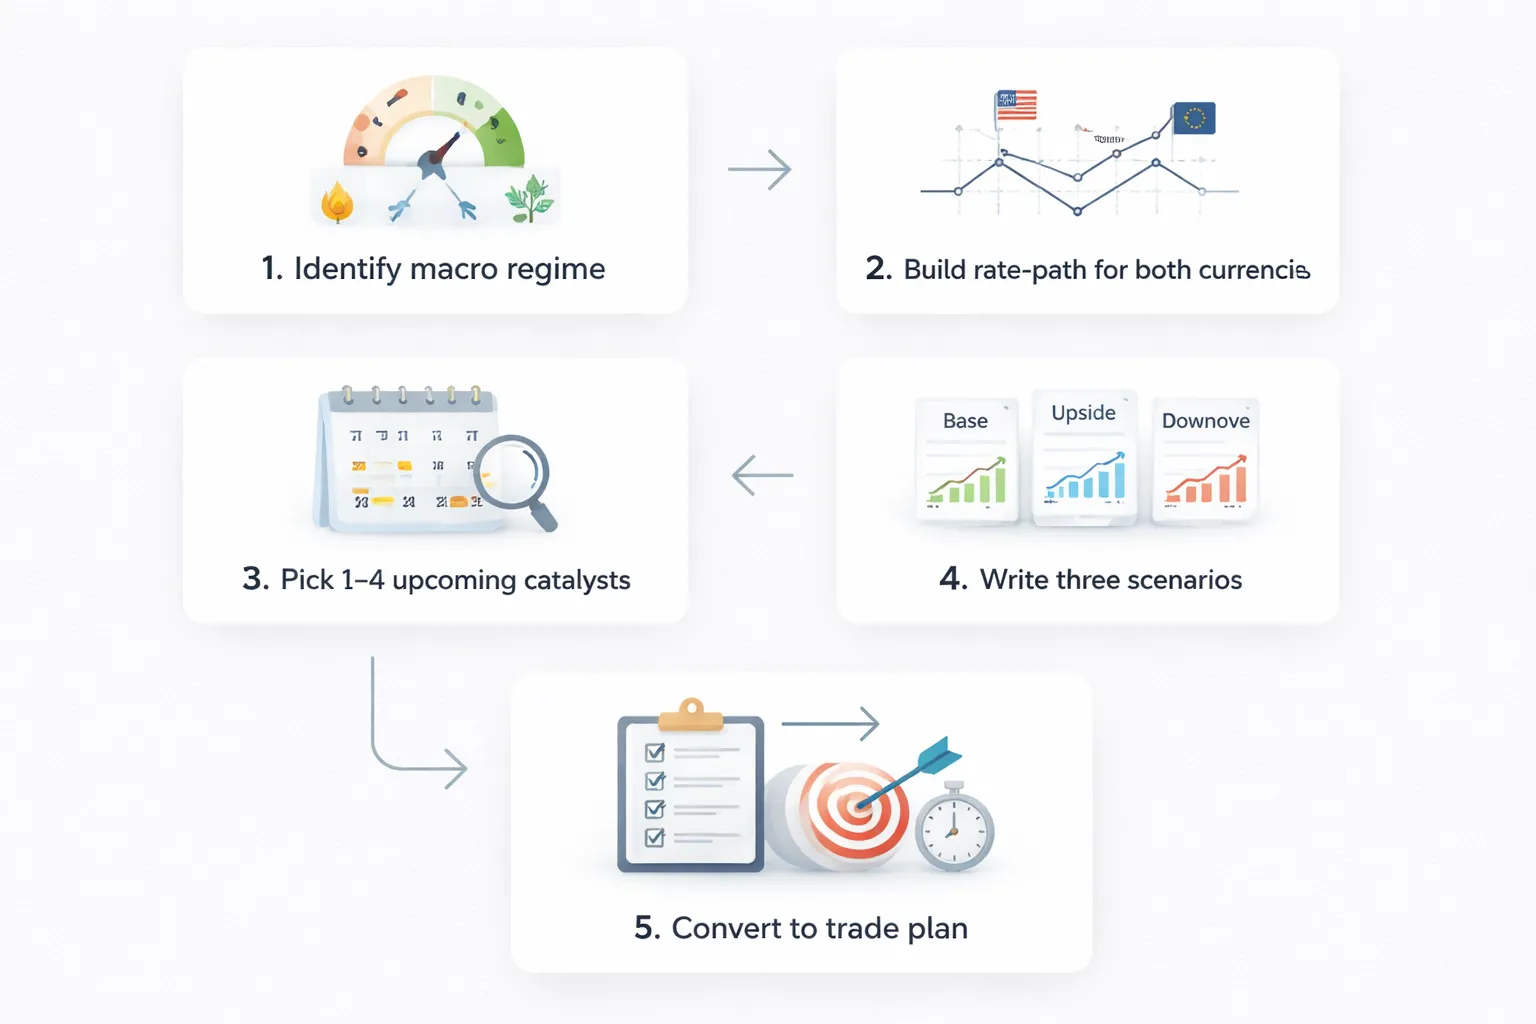
1) Start with the macro regime
Pick the regime first. Your regime sets the main driver. It also tells you which data matters most.
- Inflationary: inflation runs hot, growth holds. Markets price more hikes and higher terminal rates. FX follows rate differentials and real yields.
- Disinflationary: inflation falls, growth holds. Markets price cuts later, or a lower peak. FX follows changes in expected policy, not current rates.
- Recession: growth contracts, jobs weaken. Markets price faster cuts. FX follows safe haven flows, credit stress, and relative recession depth.
- Recovery: growth rebounds, risk appetite improves. Markets price fewer cuts or early hikes. FX follows risk sentiment, equities, and cyclicals.
Confirm the regime with a small dashboard. Use CPI and core CPI trend, unemployment rate and job growth, PMIs, and financial conditions. Then decide your main driver. Rates, risk, or commodities.
2) Build a rate-path view for both currencies in the pair
FX moves on the change in the expected path. Build a simple view for each central bank. Focus on the next 3 to 6 meetings.
- List the next policy dates for both central banks.
- Track current policy rate, last decision, and latest guidance.
- Map what the market prices for the next meetings. Use OIS where available, or front-end futures.
- Write your view in one line per currency. Example, “Bank A holds for 2 meetings then cuts 50 bps by month X.”
Then turn it into a spread view. Your pair often follows the 2 year yield spread and the expected policy differential. If your spread view and price action disagree, reduce size. The market may price a different story.
3) Identify the next 1 to 4 key catalysts on the economic calendar
Do not track everything. Pick the releases that can change the rate path or risk regime.
- Inflation prints: CPI, core CPI, services inflation, wage measures.
- Labor: jobs growth, unemployment rate, hours worked, wage growth.
- Growth: PMIs, retail sales, GDP revisions, industrial production.
- Central bank: rate decision, press conference, minutes, key speeches.
Define the market’s expected number for each catalyst. Also define the “market cares” component. Headline often matters less than the sticky parts. Use a calendar that shows consensus and prior results. For a workflow you can repeat, use this economic calendar guide.
4) Create scenarios: base case, upside surprise, downside surprise
Write three scenarios before the release. Keep them specific. Link each scenario to rates, then to the pair.
| Scenario | What changes | Rate-path impact | FX impact |
|---|---|---|---|
| Base case | Data near consensus | Little change in expected cuts or hikes | Range or trend continuation |
| Upside surprise | Inflation or jobs stronger than expected | Higher terminal rate or fewer cuts | Currency tends to strengthen if risk does not break |
| Downside surprise | Inflation cools fast or labor weakens | More cuts, earlier cuts, or dovish repricing | Currency tends to weaken, risk tone becomes key |
Add one more line. What would make you change your mind. Example, “If core services does not cool for 2 more prints, my cuts view is wrong.” This keeps your analysis honest.
5) Translate the thesis into a trade plan: bias, invalidation, timeframe
Turn your view into rules. You need bias, trigger, and a clear invalidation point.
- Bias: long or short the base currency. Tie it to your driver. Example, “Long because my 3 month rate differential should widen.”
- Timeframe: match it to the catalyst. Use hours to days for a single release, weeks for a sequence of prints, months for a full policy shift.
- Entry trigger: define what confirms your view. Example, “Buy on a repricing of 2 year spread after the decision,” or “Buy after a strong print and a hold above the pre-release high.”
- Invalidation: define what would prove your thesis wrong. Use a market level tied to the driver. Example, “If the 2 year spread stops widening and breaks last month’s low, exit.”
- Position sizing: reduce size when correlations break, when the calendar stacks multiple high risk events, or when liquidity thins.
Keep a one page log. Regime, driver, rate-path for both currencies, next catalysts, scenarios, and your invalidation. Update it after each key print. If the market reprices and your framework does not, your model needs a reset.
How to trade fundamentals without chasing the news
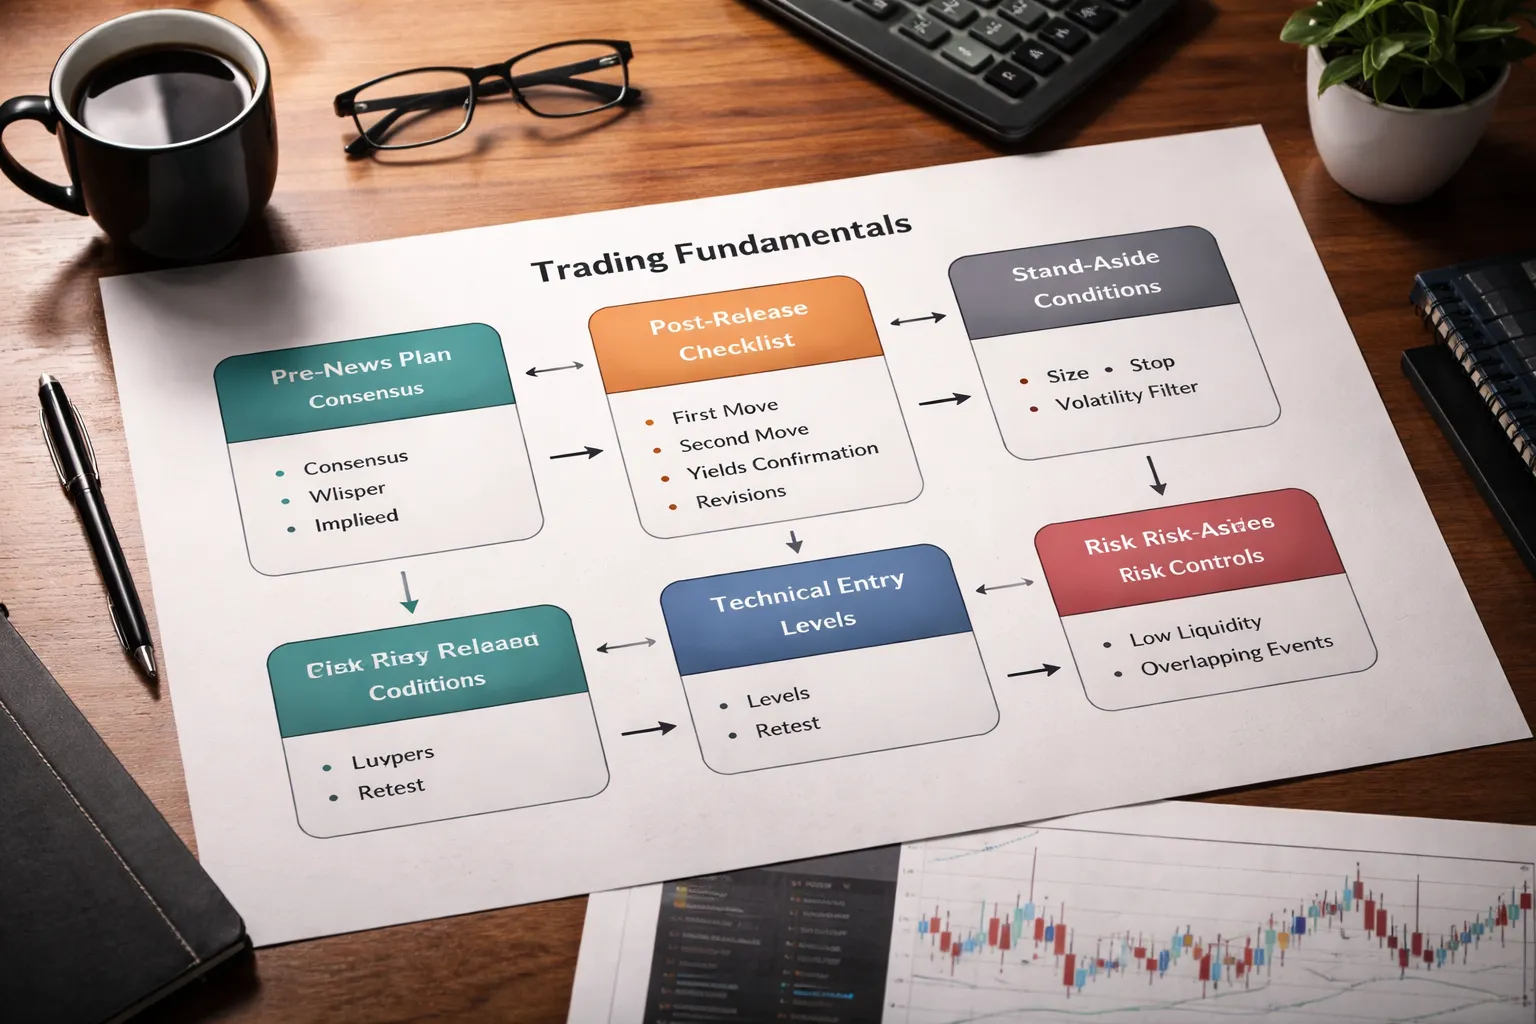
Pre-news planning, forecasts, whisper numbers, and market-implied expectations
Trade the gap between what is expected and what is priced.
Start with three numbers.
- Consensus, the published forecast.
- Whisper, what desks and feeds say is the real expectation.
- Implied, what price action suggests the market already believes.
Consensus comes from calendars. Whisper comes from positioning clues, bank previews, and how the pair trades into the print. Implied comes from rate pricing and recent trend.
Write your pre-release plan in two lines.
- Base case, what you expect, and what should happen to the rate-path.
- Surprise map, what level of upside or downside changes the next central bank step.
Focus on what matters for that release. For CPI, the market trades core, services, and the month-on-month path more than the headline. For jobs, it trades wages, participation, and revisions risk. For a central bank, it trades the statement, projections, and the press conference tone.
Set your levels before the number hits. Mark the prior day high and low, the weekly high and low, and the closest swing that would invalidate your bias.
Post-release process, first move vs second move and revision risk
Do not hit the first candle. Let the market show you what it cares about.
- First move, the headline reaction and stop run.
- Second move, the repricing after traders read the details and rates reprice.
Use a fixed checklist after the release.
- Did the detail match the headline, or contradict it.
- Did front-end yields move in the same direction as the currency.
- Did the move hold after the first 5 to 15 minutes.
- Did correlated markets confirm, such as equities, crude, or risk proxies.
Respect revision risk. Jobs, GDP, and sometimes inflation series get revised. If the series has a history of large revisions, trade smaller or wait for confirmation from the next print.
If the second move fades the first and holds, trade the fade. If the second move extends and holds, trade with it. If price whips both ways and ends flat, stand down.
Using technical levels to time entries aligned with a fundamental bias
Fundamentals pick direction. Levels pick timing.
If your macro view says buy the base currency, you still need a clean entry. Use levels that other traders defend.
- Break and retest of the pre-news range.
- Pullback to the last impulse base on the 15 minute or 1 hour chart.
- Reclaim of a daily level after a stop sweep.
Do not chase a vertical move. Wait for price to return to a level that makes your stop cheap.
Define invalidation with structure. If your bias is bullish and price closes back under the pre-news low, your thesis likely failed. If your bias is bearish and price reclaims the pre-news high, step aside.
If you need pair-specific context, link your driver sheet to the chart, such as what moves USD/JPY.
Risk management for news, position sizing, stops, and volatility filters
News trading is a volatility problem before it is a direction problem.
Size for slippage. Assume worse fills than normal. If you cannot tolerate the gap, do not trade the event.
- Position sizing, reduce size when spreads widen, when correlations break, and when multiple catalysts stack.
- Stops, place them beyond levels that matter, not at round numbers. Use a hard stop, and accept it can slip.
- Volatility filter, skip trades when the pre-event range already exceeds your normal stop distance. Your edge shrinks when the market pre-moves.
A simple rule works. If your stop must be wider than the average swing of the last five sessions to survive noise, the setup is not clean. Wait.
Do not average down during a release. Let the market settle. Add only after it confirms the second move and your levels hold.
When to stand aside, low-liquidity sessions and overlapping event risk
Many losses come from trading when liquidity is thin and reactions get distorted.
- Late Friday sessions.
- Holiday sessions in either currency.
- Asia session for pairs that need London or New York liquidity.
- Minutes before a major release when spreads widen.
Also stand aside when event risk overlaps.
- Central bank decision plus jobs data in the same week.
- Inflation print plus heavy Treasury supply and key speeches the same day.
- Geopolitical headlines that can override rate logic.
If your calendar has stacked risk, trade smaller, widen your wait time, or skip. Your job is to take the clean repricing, not every print.
Pair-specific playbooks (majors, crosses, and commodities)
EUR/USD, relative growth, ECB vs Fed pricing, risk sentiment
Trade EUR/USD as a spread trade plus a risk gauge.
- Relative growth. Watch euro area PMIs versus US ISM, payroll trend, and consumption. Faster US growth usually lifts US yields and supports USD.
- ECB vs Fed pricing. Track the front end, 2-year yields and OIS curves. EUR/USD often follows the change in the expected policy gap, not the current policy rate.
- Risk sentiment. When equities sell off hard and credit spreads widen, EUR/USD often leans lower as USD demand rises. When risk runs clean and volatility falls, EUR can catch a bid.
Playbook. If US data upgrades the Fed path and EU data stays soft, sell rallies. If US data cracks and ECB stays sticky, buy dips. If both central banks reprice the same way, expect chop.
What Moves EUR/USD? The Biggest Drivers You Should Watch
USD/JPY, yield differentials, BoJ shifts, intervention risk
USD/JPY is rates first. Then headlines.
- Yield differentials. Watch US 10-year and 2-year yields versus JGBs, plus the hedged yield for Japanese investors. A widening US yield advantage usually supports USD/JPY.
- BoJ policy shifts. Treat any change in guidance on inflation, wage growth, bond buying, or yield curve control as regime risk. The first move can be violent.
- Intervention risk. Fast upside moves raise intervention odds. The risk increases when the move looks disorderly, intraday ranges expand, and officials turn explicit.
Playbook. If US yields rise and the BoJ stays patient, stay with the trend. If Japan data forces tighter BoJ pricing, cut trend exposure fast. When officials warn and spot ramps, size down and avoid tight stops.
GBP pairs, inflation sensitivity, growth shocks, political headlines
GBP trades like a high beta rates story with political tail risk.
- Inflation sensitivity. UK CPI and wage prints can swing BoE pricing quickly. Services inflation matters more than energy swings.
- Growth shocks. UK activity data, retail sales, and PMIs hit GBP hard when the market fears recession. Watch housing and credit conditions for early stress.
- Political headlines. Budget plans, fiscal rules, and election risk can move gilt yields and GBP together. Treat surprise fiscal announcements as event risk.
Playbook. If CPI surprises higher and growth holds, buy GBP on dips, especially versus low yielders. If growth breaks and the BoE turns cautious, sell rallies. If politics drives gilt volatility, reduce leverage and widen time horizon.
AUD/USD and NZD/USD, China linkages, commodities as macro proxies
AUD and NZD price global growth, China demand, and risk.
- China linkage. Watch China PMIs, credit impulse, property signals, and policy support. Weak China data often hits AUD first.
- Commodities as proxies. Track iron ore and base metals for AUD, dairy and broad risk for NZD. You trade terms of trade and global demand expectations.
- Risk channel. When equity volatility jumps, AUD and NZD often underperform. When risk stabilizes, they rebound fast.
Playbook. If China eases policy and commodities lift, look for sustained AUD/USD strength. If China data rolls over and US yields rise, fade rallies. For NZD, respect RBNZ pricing shifts, but keep China and global risk as the main filter.
USD/CAD, oil, BoC expectations, North American growth divergence
USD/CAD is oil plus rates plus relative growth.
- Oil. Rising crude often supports CAD, but the link weakens when rate differentials dominate. Watch oil direction and volatility, not just the level.
- BoC expectations. Canada data can reprice the BoC fast, especially CPI and jobs. CAD reacts most when the market shifts the cut or hike path.
- Growth divergence. Compare US and Canada momentum. A stronger US versus Canada backdrop often lifts USD/CAD, even with firm oil.
Playbook. If oil rises and Canada data surprises higher, sell USD/CAD. If oil falls and US data beats Canada, buy USD/CAD on pullbacks. When oil spikes on headlines, treat it like event risk, not a clean macro signal.
EM FX basics, funding currencies, balance-sheet risk, carry unwind
EM FX rewards carry until it does not. You need rules.
- Funding currencies. EM carry often funds through USD, JPY, and CHF. When global yields rise or USD funding tightens, EM can gap.
- Balance-sheet risk. Watch external debt, current account, reserve cover, and fiscal credibility. Countries with high FX debt and low reserves break first.
- Carry unwind. When volatility rises, investors cut risk and buy back funding currencies. EM tends to fall together, even if local data looks fine.
Playbook. Only press carry when volatility stays low, USD funding looks stable, and local real yields stay positive. Cut fast when USD rips, credit spreads widen, or commodities dump. Avoid concentration. One headline can reprice the whole complex.
Common mistakes in fundamental analysis (and how to avoid them)
Ignoring the priced-in effect, reacting to headlines only
Prices move on surprises, not on news itself. The market trades the gap between the result and the consensus, plus the forward guidance.
- Fix: Track consensus, prior, and whisper numbers. Compare the print to expectations, not to your opinion.
- Fix: Watch the reaction function. If good data fails to lift the currency, the market already priced it in, or positioning is crowded.
- Fix: Use an economic calendar to note forecast ranges, release times, and risk windows.
Confusing absolute strength with relative strength between two economies
FX is a spread trade. You do not trade a country, you trade one economy versus another, plus the policy path in both.
- Mistake: You buy a currency because growth looks strong, but the other side looks stronger, or has higher carry, or a more hawkish central bank.
- Fix: Build a simple relative checklist for your pair. Growth momentum, inflation momentum, rate expectations, and risk conditions.
- Fix: Anchor on what matters most for that pair. For EUR/USD, rate differentials and global risk tone usually beat one-off data.
Overweighting one data point instead of the broader trend
One release rarely changes policy. Trends change policy. Policy moves currencies.
- Mistake: You treat one CPI print as a new regime, or one jobs number as a recession signal.
- Fix: Use rolling views. Three to six month momentum for inflation, jobs, and activity beats a single point.
- Fix: Separate levels from direction. A high inflation rate that keeps falling can weaken a currency if the central bank can cut sooner.
- Fix: Cross-check with policy-sensitive pricing. OIS curves, futures-implied rates, and yield spreads tell you what traders believe.
Not separating short-term volatility from long-term direction
Macro themes play out over weeks and months. Headlines and positioning drive the day-to-day noise.
- Mistake: You exit a valid thesis because one risk-off session hits your pair, or you chase a move after the spike.
- Fix: Match your holding period to your signal. If your thesis is about the next two meetings, do not trade it on a five-minute chart.
- Fix: Map event risk. Central bank days, CPI, jobs, and major geopolitics can override fundamentals for hours or days. Plan size and stops around them.
- Fix: Know your volatility trigger points. USD liquidity stress, widening credit spreads, and fast equity drawdowns can force broad FX repricing.
Skipping a clear invalidation level for the macro thesis
A macro view without an invalidation level turns into a hope trade. You need a point where you admit the market disagrees.
- Fix: Define what would prove you wrong in price and in data. Example, a break of a key swing level, plus a repricing of the next two policy meetings.
- Fix: Use a measurable trigger. A specific change in rate differentials, a shift in forward guidance, or a clear break in inflation or labor momentum.
- Fix: Pre-write your exit rules before the release. If the print beats by X and the currency still sells off, you cut. If spreads move against you, you cut.
- Fix: Keep size small enough to follow the plan. If your position size forces you to ignore invalidation, it is too big.
Pros, cons, and best use cases vs technical analysis
Where fundamentals shine: trend identification and macro catalysts
Fundamentals explain the big moves. They map the incentive structure behind flows. Rate differentials, growth gaps, inflation momentum, and central bank reaction functions drive medium to long trends.
- Trend direction. If one central bank tightens while another cuts, you get persistent carry and re-pricing. Technicals rarely explain why the trend starts or why it keeps going.
- Regime shifts. A change in forward guidance, a new inflation trend, or a labor turn can reset fair value for months.
- Catalyst selection. You can focus on the releases that matter for that pair and that regime. CPI matters more when inflation drives policy. Jobs matter more when slack drives policy.
- Filter trades. Fundamentals help you avoid fading moves that have real policy support.
Best use case. You want to hold for days to months. You need a reason that survives intraday noise.
Where fundamentals struggle: timing, noise, and multi-causal markets
Fundamentals break down at the execution layer. Prices move on relative surprises, positioning, and liquidity. Your “right” view can still lose money.
- Timing. Macro can be early. Markets can price the story weeks ahead. You can sit in drawdown while you wait.
- Noise around releases. Spreads widen. Liquidity thins. Algorithms react in milliseconds. You get whipsawed.
- Revisions and cross-currents. Data gets revised. One print helps growth but hurts inflation. Risk sentiment flips the reaction.
- Multi-causal pricing. A currency can rise on weak data if the market thinks it forces dovish policy elsewhere, or if positioning is one-sided.
Rule for survival. Trade the reaction, not the headline. If the data “should” lift the currency and it sells off, treat that as information. Follow your pre-written invalidation.
How fundamentals and technicals complement each other in practice
Use fundamentals to pick the trade. Use technicals to structure it.
- Fundamentals choose direction. You define the driver, the expected policy path, and what would prove you wrong.
- Technicals choose entry. You wait for a break, retest, or momentum expansion. You avoid random entries inside chop.
- Technicals define risk. You place stops where your setup fails, not where your pain starts. You size to that stop.
- Fundamentals define exits. You take profit into the next macro barrier, like a key meeting, CPI, or jobs report.
Practical workflow. Build a short thesis. List the next two catalysts. Write your invalidation. Then use levels to execute. If you need help mapping releases, use the forex economic calendar step-by-step guide.
Choosing tools by timeframe: scalping, swing, and position trading
| Timeframe | What moves price most | Best tool | How to use fundamentals without getting crushed |
|---|---|---|---|
| Scalping (seconds to minutes) | Liquidity, order flow, spreads, microstructure, headline speed | Technical | Avoid major releases. If you trade news, predefine max spread, max slippage, and a hard cut rule. |
| Swing (hours to days) | Risk sentiment, positioning, relative data surprises, short-term rate pricing | Mixed | Trade around catalysts. Use fundamentals for bias, technicals for entries and stops. Reduce size into event risk. |
| Position (weeks to months) | Rate differentials, policy divergence, growth and inflation regimes | Fundamental | Anchor to 2-year yield spreads and policy expectations. Add on confirmation, not hope. Exit on driver change, not on a red day. |
FAQ
What actually moves forex prices day to day?
Interest rate expectations move first. That means central bank guidance, inflation prints, and labor data. Risk sentiment matters next. Credit stress and equity swings change demand for safe havens. Flows also move price. Hedging, repatriation, and month end rebalancing can override data.
Is fundamental analysis better than technical analysis?
No. They solve different problems. Fundamentals help you pick direction and timeframe. Technicals help you time entries, place stops, and manage risk. Use fundamentals for bias. Use levels and volatility for execution. Cut size into high impact events.
Which indicators matter most for currencies?
Start with policy and inflation. Central bank rates, 2-year yields, CPI, and wage data. Add growth and jobs. PMI, GDP, unemployment, and payrolls. Watch external balance for some countries. Current account, terms of trade, and commodity prices.
How do I know if news is already priced in?
Compare the consensus to market pricing. Use OIS and futures for rate paths. Check 2-year yield reactions and implied volatility before the release. If positioning looks crowded and price stalls near key levels, the data likely sits in the price.
How do I use yield spreads in forex?
Track the 2-year yield spread between the two countries. It proxies policy expectations. Rising spread usually supports the higher yield currency. Use it for swing and position bias. Exit when the spread trend breaks or policy guidance flips.
Why does a currency drop on good data?
Expectations were higher. Or the details were weaker, like soft wages with strong headline jobs. Or the market focused on the next central bank move. Watch the rate market first. If yields fall after good data, FX often follows.
What is the best way to trade major data releases?
Plan around volatility, not opinions. Define the key level, invalidation point, and max loss before the print. Reduce size. Avoid tight stops near the spread spike. Use your economic calendar to map risk and catalysts.
Which pairs respond most to fundamentals?
USD pairs respond to global rates and risk. EUR and GBP respond to policy divergence and inflation surprises. JPY reacts to yields and risk off moves. AUD and NZD track commodities and China data. CAD tracks oil and North American growth.
How do I avoid getting chopped by headlines?
Match your holding period to the driver. Intraday trades need the next catalyst. Swings need a clear rate and growth narrative. Positions need a regime, like policy divergence. Reduce exposure when headlines drive range and yields go flat.
What data should I track each week?
Central bank speakers and meetings. Inflation and jobs releases. PMIs. Bond yields, especially 2-year. Risk proxies like equity indices and credit spreads. For commodity currencies, track oil, iron ore, and key China releases.
Do fundamentals work for short term trades?
Sometimes. Use them around scheduled catalysts. Your edge comes from surprise versus expectations and how rates reprice. Outside events, fundamentals lag price. For normal sessions, trade volatility and levels. Save your conviction for data and policy shifts.
Where do I see what the market expects?
Use the consensus estimate and the distribution of forecasts. Use rate futures and OIS for policy pricing. Watch implied volatility for event risk. One good source is an economic calendar that shows the forecast, prior, and release time.
What is one simple fundamental workflow?
Pick a driver. Rate expectations, growth, inflation, or risk. Confirm with 2-year yield spreads. Check the calendar for upcoming catalysts. Choose a pair where the narrative diverges. Use technicals to enter. Exit when the driver changes.
- Key drivers: policy expectations, yields, inflation, growth, risk, flows.
- Best anchor: 2-year yield spreads and central bank guidance.
- Execution rule: fundamentals set bias, technicals set risk.
Conclusion
Conclusion
Forex moves when rate expectations move. Everything else feeds that.
Keep your process tight. Track central bank guidance. Watch the 2-year yield spread. Read inflation and growth as inputs to the next policy step. Use risk sentiment and flows as modifiers, not as your core thesis.
- Start with the narrative: what each central bank wants, and what the market expects.
- Validate with data: 2-year yields, CPI, jobs, PMIs, credit conditions.
- Find divergence: pick pairs where the paths separate, not where both banks point the same way.
- Time the trade: use the economic calendar to avoid getting surprised by the next catalyst.
- Manage execution: fundamentals set bias, technicals set risk, position size sets survival.
- Exit clean: close when the driver changes, or when yields stop confirming your view.
Final tip. Build a simple weekly checklist and stick to it. If you want one anchor to simplify your decisions, focus on how interest rates affect currency pairs and confirm with the 2-year spread before you risk capital.
-
- Interest rate differentials, yield expectations, and carry trades
- Inflation trends and why real yields often matter more than nominal yields
- Economic growth and productivity as long-run currency forces
- Risk sentiment: why USD, JPY, and CHF behave differently in risk-off moves
- Capital flows and positioning (portfolio flows, hedging, rebalancing)
-
- Central banks: the #1 fundamental catalyst in FX
- Monetary policy tools that move currencies
- The reaction function, how markets infer the next move
- Reading rate expectations with yield curves and OIS-style pricing
- Communication risk, statements, pressers, minutes, and speeches
- Policy divergence, why relative central-bank paths drive trends
-
- Trade balance and current account, when deficits matter (and when they don’t)
- Terms of trade and commodity exposure (AUD, CAD, NZD, NOK)
- Foreign debt, funding stress, and the role of USD liquidity
- Purchasing power parity (PPP) and why “cheap” currencies can stay cheap
- Fiscal policy, deficits, and political stability as confidence drivers
-
- Pre-news planning, forecasts, whisper numbers, and market-implied expectations
- Post-release process, first move vs second move and revision risk
- Using technical levels to time entries aligned with a fundamental bias
- Risk management for news, position sizing, stops, and volatility filters
- When to stand aside, low-liquidity sessions and overlapping event risk
-
- EUR/USD, relative growth, ECB vs Fed pricing, risk sentiment
- USD/JPY, yield differentials, BoJ shifts, intervention risk
- GBP pairs, inflation sensitivity, growth shocks, political headlines
- AUD/USD and NZD/USD, China linkages, commodities as macro proxies
- USD/CAD, oil, BoC expectations, North American growth divergence
- EM FX basics, funding currencies, balance-sheet risk, carry unwind
-
- Ignoring the priced-in effect, reacting to headlines only
- Confusing absolute strength with relative strength between two economies
- Overweighting one data point instead of the broader trend
- Not separating short-term volatility from long-term direction
- Skipping a clear invalidation level for the macro thesis
-
- What actually moves forex prices day to day?
- Is fundamental analysis better than technical analysis?
- Which indicators matter most for currencies?
- How do I know if news is already priced in?
- How do I use yield spreads in forex?
- Why does a currency drop on good data?
- What is the best way to trade major data releases?
- Which pairs respond most to fundamentals?
- How do I avoid getting chopped by headlines?
- What data should I track each week?
- Do fundamentals work for short term trades?
- Where do I see what the market expects?
- What is one simple fundamental workflow?
-
How to Place a Forex Trade Step by Step (Your First Trade Explained)
1 month ago -
Forex Trading vs Crypto Trading: Which Market Is Better for Beginners?
1 month ago -
Forex Lot Size Calculator: How to Use It to Size Trades Correctly
3 months ago -
How to Calculate Position Size in Forex (Position Sizing Formula + Examples)
3 months ago -
Forex Leverage Explained: How It Works, Pros, Cons & Examples
3 months ago
-
Is Forex Trading Legal in the United States? Rules, Regulators & What to Know
3 months ago -
Forex Market Hours & Trading Sessions Explained (Best Times to Trade)
3 months ago -
Forex Trading Platforms Comparison: MetaTrader vs cTrader vs TradingView
3 months ago -
Forex Leverage Explained: How It Works, Pros, Cons & Examples
3 months ago -
What Is a Lot Size in Forex? Lot Types + Quick Examples
3 months ago