Forex Timeframes Explained: Scalping vs Day Trading vs Swing Trading

Timeframe choice controls your trade frequency, stop size, screen time, and costs. Pick the wrong one and your plan breaks fast.
This guide explains the core forex timeframes behind scalping, day trading, and swing trading. You will learn what each style targets, how long trades stay open, which charts to use, and what your typical risk profile looks like. You will also see how spreads, slippage, and swap fees hit each approach.
Forex and CFDs use leverage. Losses can exceed deposits with some brokers. Start with position sizing and risk limits, then match your timeframe to your schedule and execution speed. If you need a refresher on price formation and order execution, read how the forex market works.
Key Takeaways
- In het kort: Pick a timeframe that matches your schedule, your execution speed, and your risk limits.
- In het kort: Scalping uses very short charts, many trades, and tight stops; costs like spread and slippage matter more than your “idea.”
- In het kort: Day trading holds positions intraday; you avoid most swap fees, but you still need enough volatility and liquidity during your session.
- In het kort: Swing trading holds for days to weeks; swaps and overnight gaps matter more, and stops often need to be wider.
- In het kort: Lower timeframes increase trade frequency and decision load; higher timeframes reduce noise but raise per-trade stop distance.
- In het kort: Use fixed risk per trade and position sizing; leverage can amplify losses fast.
Key Takeaways
- Scalping: Focus on execution. Trade liquid pairs and active sessions. Measure your edge after spread, commissions, and slippage. A small cost increase can erase your expectancy when targets are small.
- Day trading: Plan around a specific market window. Close positions before rollover if you want to limit swap exposure. Track how news spikes affect fills and stop-outs.
- Swing trading: Plan for overnight risk. Expect wider stops and longer time in drawdown. Include swap fees in your backtest, especially on high rate differentials.
- Risk management: Set a max loss per trade and per day or week. Size positions from stop distance, not from how confident you feel. Use a position sizing formula you can apply every time.
- Costs and frictions: Spreads widen in thin liquidity. Slippage rises on fast moves. Swap can turn a small edge negative on longer holds.
- Time alignment: Match your trading window to the most active sessions for your pairs. Use forex market hours to choose when liquidity and volatility suit your approach.
Risk note: Forex and CFDs use leverage. Losses can exceed deposits with some brokers. Define your risk limits and position size first, then choose your timeframe.
What Forex Timeframes Are (and Why They Matter)
Timeframes vs trade duration
A forex timeframe is the time each candle or bar represents on your chart. M1 means each candle covers one minute. H1 means one hour. D1 means one day.
Your chart timeframe is not your holding period. You can hold a trade for hours while using an M5 chart for entries. You can hold a trade for days while using an H1 chart for timing.
Use the chart timeframe to control how often you see new information. Use your trade plan to control how long you stay in the market.
How timeframe changes noise, signal reliability, and false breakouts
Lower timeframes show more price swings that do not matter. You will see more “signals” and more failures. That is market noise.
Higher timeframes compress that noise into fewer candles. Levels look cleaner. Patterns form slower. Breakouts tend to need more follow-through to print on the chart.
- M1 to M15: High noise. More stop-outs. More false breakouts around obvious highs and lows.
- M30 to H4: Less noise. Fewer setups. Better structure for intraday trends and ranges.
- D1 to W1: Lowest noise. Wider stops and targets. Fewer decisions. More exposure to swaps and weekend gaps.
Match your timeframe to how many failed signals you can tolerate. If you hate frequent losses, do not force yourself into very low timeframes.
Volatility, liquidity, and session timing
The same pair behaves differently by hour because liquidity and participation change by session.
- During active sessions, spreads often tighten and price moves more smoothly.
- During quiet hours, spreads often widen and single orders can push price further.
- At news releases, volatility spikes. Slippage risk rises. Stops can fill worse than planned.
Timeframes interact with sessions. A scalper on M1 feels every slow period and every spread change. A swing trader on D1 can ignore most hourly shifts but still faces event risk from central banks and macro data.
Costs and microstructure by timeframe
Your timeframe decides how much trading costs matter. Short-term trading pays the spread and commissions more often. Long-term trading pays less often but carries positions through rollovers.
- Spread: A 1 pip spread is huge if you aim for 3 to 8 pips, and minor if you aim for 150 pips. Learn how pips translate into profit and loss in this pips guide.
- Commissions: They scale with trade frequency. They can turn a small edge negative on lower timeframes.
- Swaps: They matter more when you hold past rollover. They can dominate results on long holds, especially on high rate differentials.
- Slippage: It increases when liquidity thins or volatility jumps. It hits stop entries and stop losses hardest. It matters most when your targets are small.
- Execution: Lower timeframes need faster fills and stable spreads. Higher timeframes can tolerate slower execution but need wider risk limits.
Platform basics that reduce mistakes
Set your chart up so you do not misread time, price, or candles.
- Choose the timeframe on purpose: Confirm you are on M5, H1, or D1 before placing orders. Many errors come from trading the wrong chart.
- Set a clean default template: Use the same colors, levels, and session markers across pairs so you spot changes fast.
- Pick one candle type and stick to it: Standard Japanese candles work for most traders. If you use Heikin Ashi, remember it smooths price and can hide exact highs and lows.
- Check time zone and session: Align platform time with your schedule. Know when your broker rolls swaps and when spreads tend to widen.
- Use consistent zoom: Too much zoom makes noise look like trend. Too little zoom hides nearby structure and recent swing points.
Forex Timeframes Explained: Scalping vs Day Trading vs Swing Trading
Scalping at a glance
You trade very short moves. You enter and exit fast. You need tight spreads and clean execution.
- Typical charts: M1, M5, M15.
- Typical hold time: seconds to minutes.
- Common targets: a few pips to low double-digit pips, pair-dependent.
- Core focus: spread, slippage, and speed of fills.
- Best sessions: high-liquidity windows, London and New York overlap.
On very low timeframes, costs matter more. A 1 to 2 pip spread can erase the edge of many scalps. Track average spread during your trading hour and compare it to your average win size.
Day trading at a glance
You trade intraday swings. You close positions the same day. You aim to avoid overnight swap and gap risk.
- Typical charts: M5, M15, M30, H1.
- Typical hold time: minutes to hours.
- Common structure: session highs and lows, intraday trend, range breaks, mean reversion zones.
- Core focus: timing entries around liquidity, news, and session opens.
Day trading gives you more room than scalping, but you still pay attention to execution quality. News spikes can expand spreads and slip stops. Reduce size or step aside around high-impact releases.
Swing trading at a glance
You trade multi-day moves. You hold through pullbacks. You care more about structure than noise.
- Typical charts: H4, D1, W1.
- Typical hold time: days to weeks.
- Common structure: trend legs, major support and resistance, weekly ranges, higher timeframe breaks and retests.
- Core focus: stop placement beyond clear swing points, and patience through retracements.
Swing trades face overnight risk. You also pay swaps. Check rollover time and typical swap rates on your pair selection. Major pairs often suit swing traders better than thin markets, see major vs minor vs exotic currency pairs.
A side-by-side comparison
| Style | Typical timeframe | Trade frequency | Average stop size | Decision cadence |
|---|---|---|---|---|
| Scalping | M1 to M15 | High, many trades per session | Small, often tight and technical | Seconds to a few minutes |
| Day trading | M5 to H1 | Medium, several trades per week to per day | Medium, beyond intraday structure | Minutes to hours |
| Swing trading | H4 to W1 | Low, a few trades per month to per week | Larger, beyond daily and weekly swings | Hours to days |
Stop size depends on pair volatility and your setup. Use consistent units. Measure in pips and compare to recent average range on your chosen timeframe. If your typical stop equals noise, you will get chopped. If your stop sits past structure, you will survive normal pullbacks.
Which timeframe is “best”
No single timeframe fits every trader. Pick the one that matches your constraints.
- Time available: If you can only check charts a few times per day, avoid M1 to M5.
- Execution quality: If your broker shows wider spreads or frequent slippage at your trading hour, avoid scalping.
- Risk tolerance: If you cannot hold through overnight moves, avoid swing trading.
- Personality fit: If fast decisions cause mistakes, use higher timeframes and fewer trades.
- Backtest reality: Validate your win size versus spread and average stop size versus typical swing depth.
Choose your primary timeframe first. Then use one higher timeframe for direction and one lower timeframe for entries. Keep it stable for a few weeks, then review your logs and adjust.
Scalping Timeframes: How It Works and Who It Suits
Scalping Timeframes: How It Works and Who It Suits
Scalping focuses on small price moves. You hold trades for seconds to minutes. You take many trades. Your edge must survive spread, commissions, and slippage.
Common scalping setups by timeframe
Pick one entry timeframe. Then add one higher timeframe for direction. Keep the pair list small.
- M1 entries with M15 context: Use M15 to set bias and key levels. Use M1 to trigger entries on quick pullbacks or breaks.
- M5 entries with M15 context: Use M15 for trend and range boundaries. Use M5 for cleaner structure and fewer signals.
- Typical flow: Mark M15 high, low, VWAP, or session range. Wait for price to reach a level. Enter on M1 or M5 when momentum returns and spread stays tight.
Execution requirements: speed, order types, and avoiding slippage
- Speed: You need fast chart updates and stable connection. Delays turn good entries into late fills.
- Order types: Market orders fill fast but slip more in spikes. Limit orders control price but miss more trades. Stop orders catch momentum but can fill worse in fast moves.
- Slippage control: Avoid news minutes and thin liquidity. Use smaller size when volatility jumps. If your platform supports it, set max deviation or price tolerance. Learn the mechanics in this guide on slippage in forex.
Risk profile: small stops, high trade count, and the math of transaction costs
Scalping uses tight stops. That makes costs a larger part of each trade.
| Item | Why it matters for scalping | Practical target |
|---|---|---|
| Stop size | Small stops raise stop-out frequency | Place stops beyond a structure point, not a fixed pip number |
| Spread plus commission | Costs can equal a large share of your average win | Keep total cost well under your average take profit |
| Trade count | Costs compound across many trades | Cap daily trades to protect your expectancy |
| Expectancy check | One bad fill can erase many small wins | Track average win, average loss, and average cost per trade |
Do the math in pips. If your average take profit is 4 pips and your all-in cost is 1.2 pips, costs consume 30% of the move. If slippage adds 0.5 pips on average, costs consume 42.5%. Your strategy must beat that after losses.
Best market conditions
- High liquidity sessions: London open and the London to New York overlap often provide tighter spreads and cleaner moves.
- Tight spreads: Focus on major pairs. Avoid wide-spread crosses if your targets stay small.
- Stable volatility: You want movement without random spikes. If candles jump and retrace fast, your fills and stops degrade.
Typical pitfalls
- Overtrading: You take low-quality setups to stay active. Your average cost per day rises and your edge fades.
- Revenge trading: You increase size after a loss. Tight stops make this blow up fast.
- Strategy drift: You change rules mid-session. Your backtest no longer matches your execution.
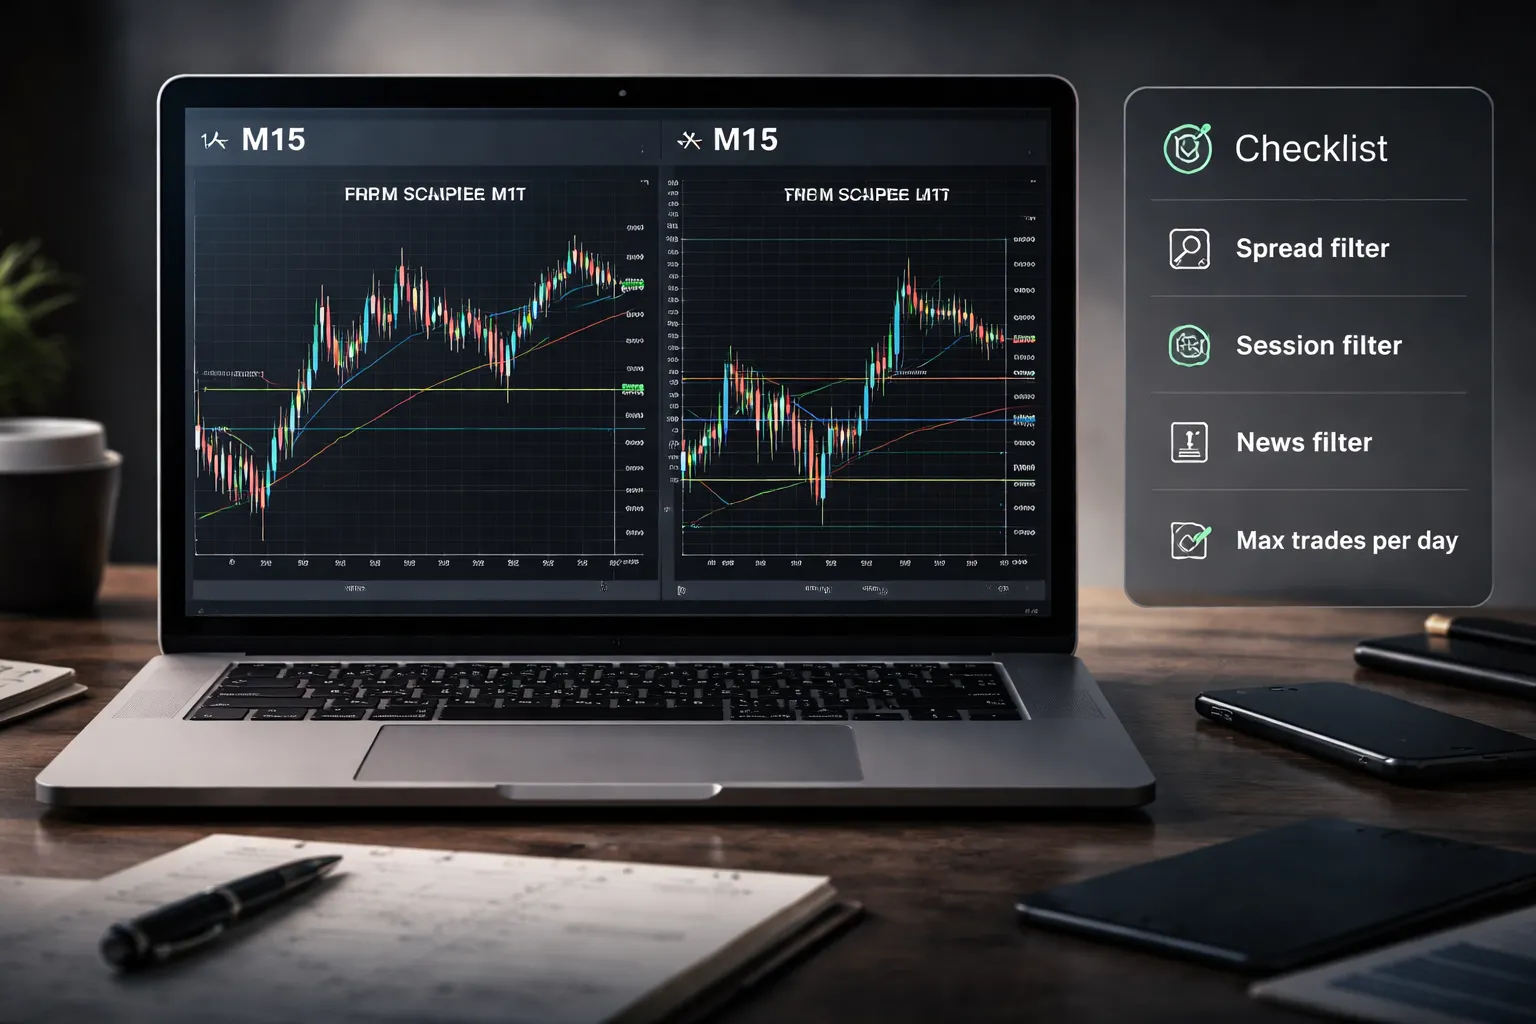
Practical scalper toolkit
- Spread filter: Trade only when spread stays below a fixed threshold for that pair and session.
- Session filter: Trade only in your best 60 to 180 minutes. Skip lunch hours and rollover.
- News filter: Block trades 5 to 15 minutes before and after high-impact releases.
- Max-trades-per-day rule: Set a hard cap, like 5 to 15 trades. Stop when you hit it.
- Daily loss limit: Stop after a set number of R losses, like 2R or 3R.
- One setup list: Define 1 to 2 entry patterns. Reject everything else.
- Execution log: Record spread at entry, slippage, time of day, and reason for entry. Review weekly.
Day Trading Timeframes: Building a Same-Day Plan
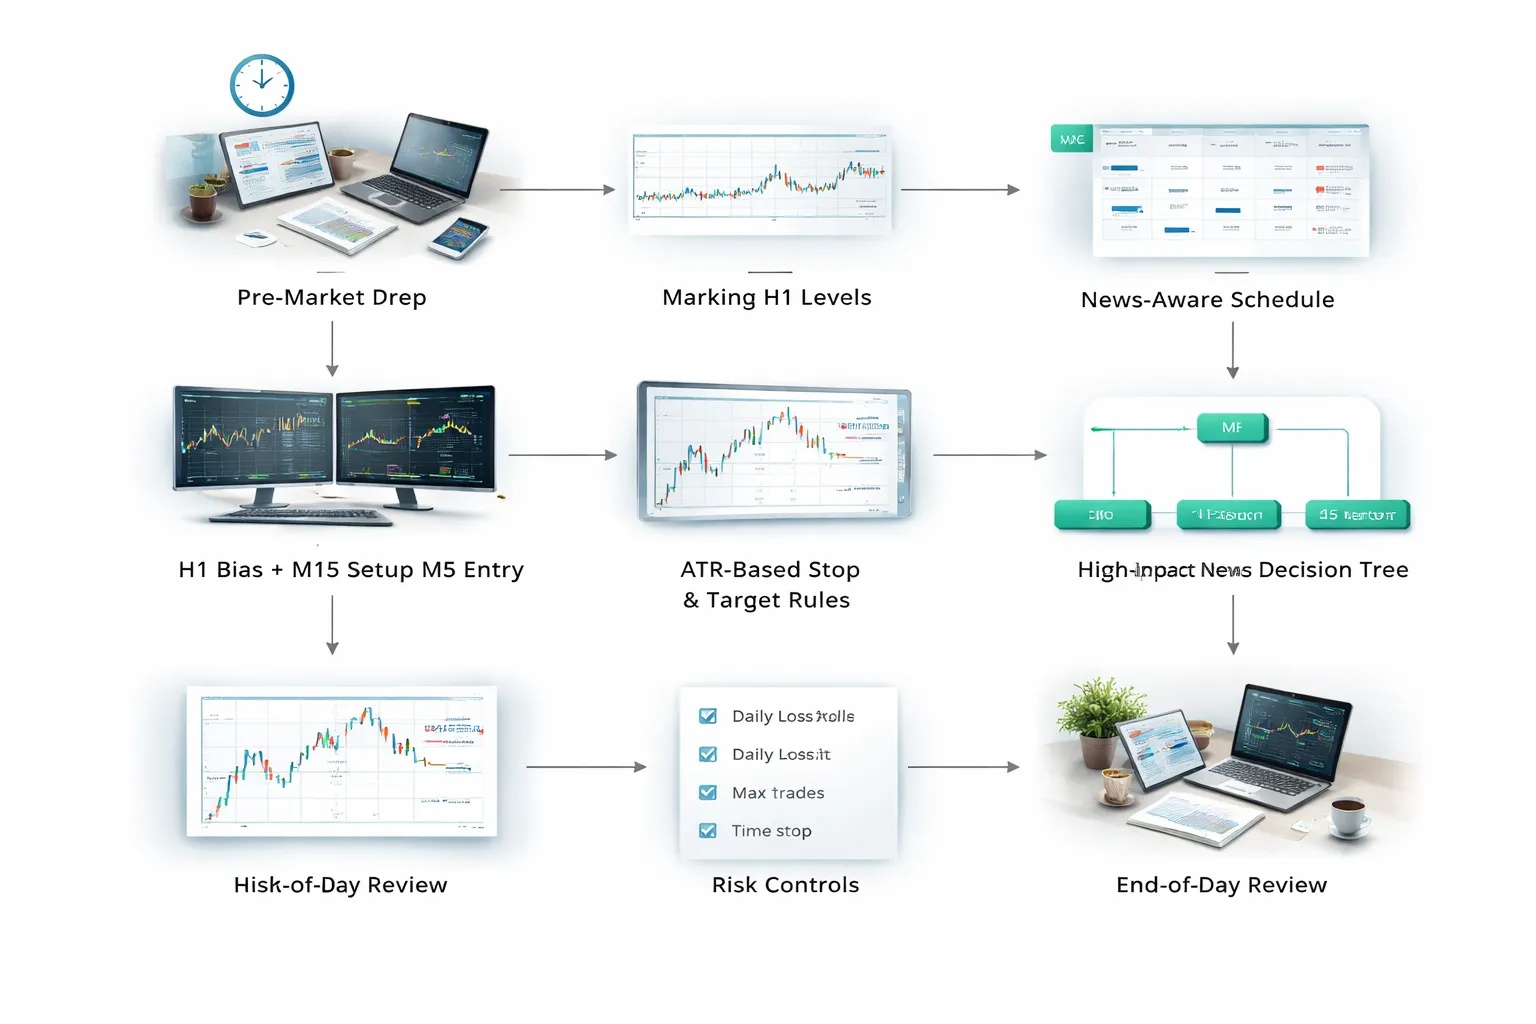
Structuring a day, prep, key levels, and a news-aware schedule
Day trading needs a same-day plan. You trade one session. You stop when the plan says stop.
- Pre-market prep, 10 to 20 minutes. Check calendar, session times, and spreads. Flag high-impact events and set no-trade windows.
- Pick 1 to 3 pairs. Choose liquid pairs with tight spreads. Skip slow pairs and wide spreads. Use a clear pair list based on major vs minor vs exotic currency pairs.
- Mark key levels on H1. Prior day high and low. Asia range high and low. London high and low. Round numbers. Unfilled gaps in structure like obvious breakout points.
- Set a schedule. Define trade windows like London open to mid-session, and New York open to lunch. Define a hard stop time. No late-day revenge trades.
Timeframe combinations that work, H1 bias plus M15 and M5 execution
Use one bias timeframe and one execution timeframe. Keep it consistent.
- H1 for bias. Identify trend, range, and key level location. Trade with the direction until H1 structure breaks.
- M15 for setup. Wait for a pullback, breakout, or rejection near your levels. You want a clean structure shift, not random candles.
- M5 for entry. Use it to time the entry and define the invalidation point. Do not take signals that only exist on M5 with no H1 context.
| Task | Timeframe | What you decide |
|---|---|---|
| Direction and context | H1 | Trend or range, key levels, risk mode |
| Setup quality | M15 | Pattern match, location, timing |
| Entry and stop location | M5 | Trigger, exact stop, first target |
Managing intraday volatility, ATR-based stops and realistic profit targets
Your stop must fit the pair’s normal movement. Use ATR to avoid stops that sit inside noise.
- Measure ATR on M15 or H1. Use a 14-period ATR as a baseline for current conditions.
- Stop sizing rule. Place the stop beyond your invalidation point, then check it against ATR. If your stop is far smaller than recent candle ranges, you will get clipped.
- Target sizing rule. Use realistic intraday targets. For many day trades, 1R to 2R is a workable range when spread and slip matter. Push for more only when the H1 has clear space to the next level.
- Adjust for volatility spikes. If ATR expands fast, reduce size, widen stop to structure, or stand aside. Do not keep the same size with bigger candles.
How to handle high-impact news, trade, reduce size, or stand aside
High-impact releases can flip price in seconds. You need one rule set.
- Stand aside. Default choice if your edge depends on clean spreads and smooth fills. Do not trade inside the first minutes of the spike.
- Reduce size. If you trade through news, cut size and widen expectations for slippage and spread expansion.
- Trade it with a specific plan. Only if you have tested rules for pre-release positioning, spike behavior, and post-release structure. Use hard stops. Accept that fills can be worse than your chart shows.
Risk controls for day traders, daily loss limits, time stops, and journaling metrics
Day trading fails when you let one day turn into a hole. Your controls must stop that.
- Daily loss limit. Stop at 2R or 3R down. No exceptions.
- Time stop. If a trade does not move within a set time, exit or cut risk. Example, 30 to 90 minutes depending on the setup and session.
- Max trades per day. Keep the cap you set. Quantity destroys focus.
- Minimum quality filter. Trade only at your levels, inside your session, with your pattern. If one condition fails, you pass.
| Journal metric | What to record | Why it matters |
|---|---|---|
| R multiple | Planned R, realized R | Shows expectancy without lot size noise |
| Time of day | Session, minute of entry | Finds your best hours and worst hours |
| Location | Level type, distance to next level | Prevents low-space trades |
| Stop reason | Structure break, ATR check | Confirms stop logic stays consistent |
| Spread and execution | Spread at entry, slippage notes | Tracks hidden costs and broker conditions |
End-of-day routine, review, screenshots, and playbook updates
Close the day the same way, every time. You build skill through review.
- Screenshot every trade. One before entry, one after exit. Include H1, M15, and M5.
- Tag outcomes. A setup win. A setup loss. A rule break. A missed trade.
- Update your playbook weekly. Keep what works. Cut what fails. Add one change at a time.
- Score discipline. Track rule breaks as a separate metric from P and L. Fix process first.
Swing Trading Timeframes: Capturing Multi-Day Moves
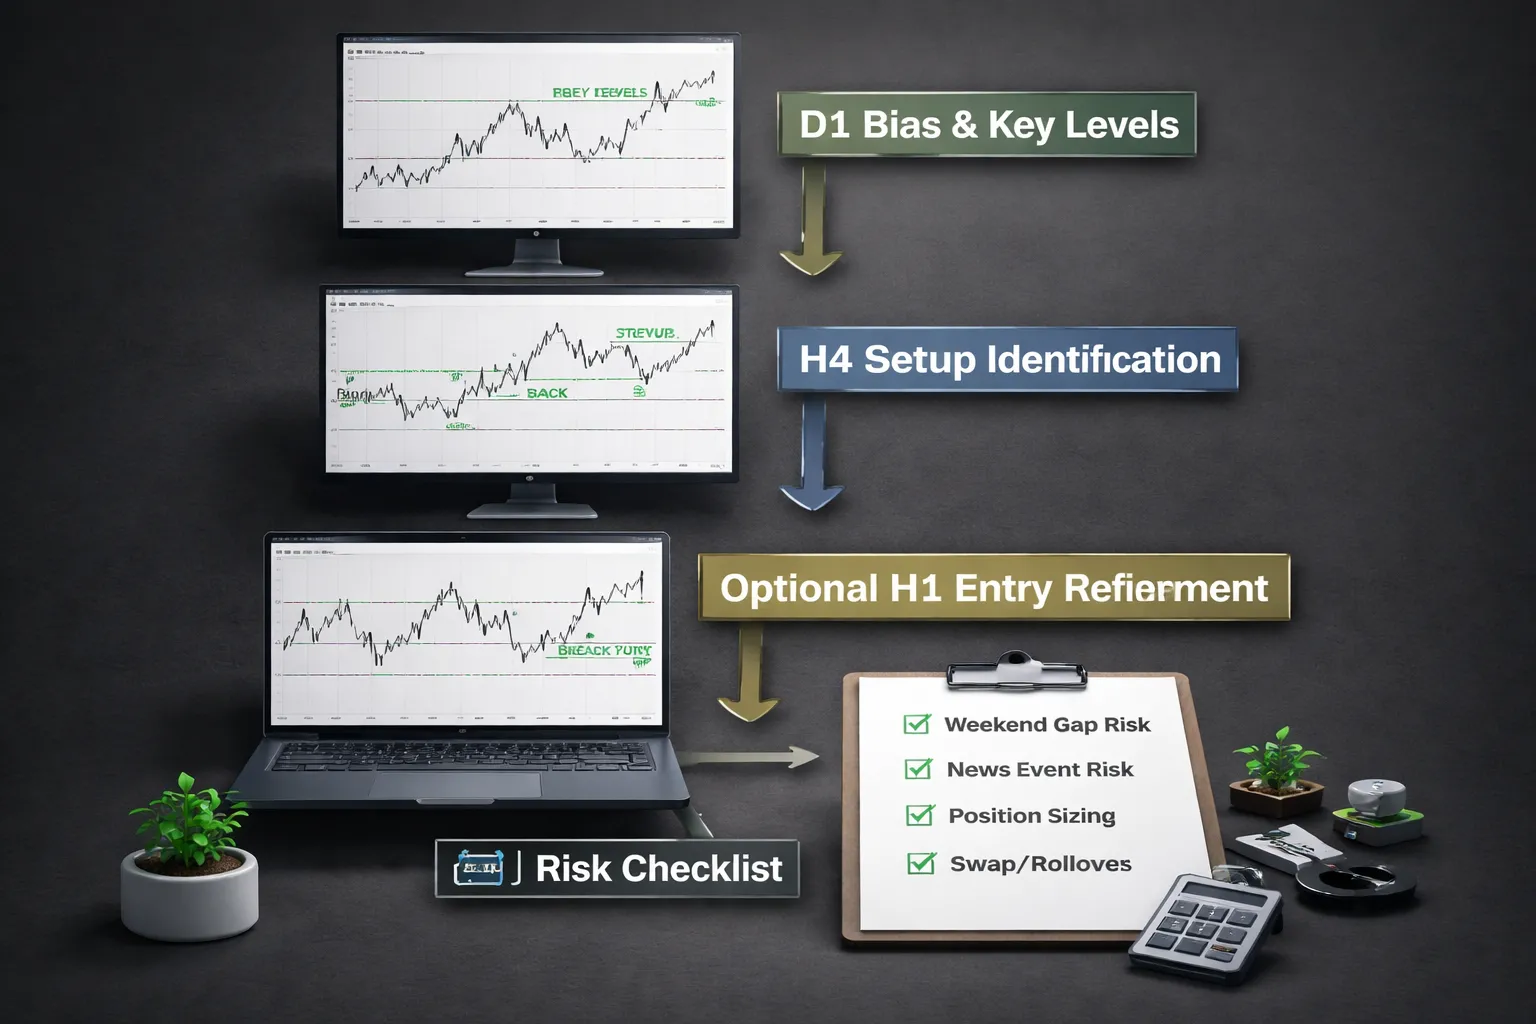
Top-down approach, D1 and H4 first
Swing trading works best when you start high and drill down.
- D1 sets the bias. Mark the trend, the last major swing high and low, and the clean zones where price reacted.
- H4 defines the setup. Identify the current leg, the pullback depth, and the key level that must hold or break.
- H1 refines entry. Use it only to improve execution, not to change the D1 or H4 plan. If H1 disagrees, you wait.
- Risk stays timeframe-based. Place stops beyond H4 structure, not a random pip count.
Holding through sessions and weekends
Swing trades live through London, New York, Asia, and often Friday close. Your risk changes when the market closes or thins.
- Gap risk. Weekend opens can jump past your stop. Treat Friday exposure as a separate decision.
- Event risk. CPI, rate decisions, and jobs data can reset price in minutes. If your stop sits inside the expected spike range, you own that risk.
- Position sizing. Reduce size when you must hold through high-impact events or over the weekend. Keep the same stop logic, change the lot size.
- Session handoffs. Liquidity shifts can trigger stop runs. Avoid moving stops tighter before major session opens just to reduce stress.
Using market structure: trend, pullback, breakout swing models
Most swing entries fit three structure models. Pick one. Execute it the same way.
- Trend continuation. Trade in the D1 direction. Enter after an H4 pullback holds structure, then price breaks the last minor swing.
- Pullback entry. Wait for a deeper retrace into a prior D1 or H4 zone. Demand a clear rejection and a defined stop behind the level.
- Breakout and retest. Let price break an H4 range, then retest the level. Enter on the retest. Avoid chasing the first candle.
Measure targets using structure, not hope. First target at the next H4 swing point. Leave the rest for the next D1 level if momentum holds.
Swap and rollover costs matter more
Over multi-day holds, fees stop being noise. They become a line item.
- Swap compounds. A small daily debit can erase a thin edge if your average win is small and your holding time is long.
- Wednesday rollover. Many brokers apply triple swap midweek. Know the schedule for your instrument.
- Pair selection. If two pairs show the same setup quality, prefer the one with lower carry cost for your trade direction.
- Execution still matters. Swap does not justify a worse entry. It just informs which trades you hold longer.
Psychology: patience, missed entries, no over-management
Swing trading pays you for waiting. It punishes you for tinkering.
- Patience. Most of the time you do nothing. You wait for price to reach your level, then you wait for the setup trigger.
- Missed entries. Missing a move is normal. Do not widen rules to avoid feeling left out. Log it and move on.
- Avoid over-management. Do not move stops to break even because you feel exposed. Use a rule, such as moving the stop only after an H4 close beyond a structure point.
- Limit screen time. Check at set intervals, such as H4 closes. Constant watching leads to early exits.
When swing trading underperforms
Swing trading struggles when the market stops offering clean expansion.
- Range-bound markets. D1 prints overlapping candles, wicks both sides, and repeated failures at the same levels. Breakouts fade fast.
- Low volatility regimes. H4 swings shrink and targets sit too close to spreads, swap, and random noise.
- What you do. Reduce trade frequency, tighten your filter, or switch to range tactics with smaller targets. If your edge relies on trend legs, you wait for volatility to return.
- Know the plumbing. Market hours, liquidity, and execution rules affect swing holds. Review the basics in how the forex market works.
How to Choose the Right Timeframe for Your Goals
Time availability audit, match your style to your schedule
Your timeframe must fit your calendar. If it does not, you will miss entries, chase price, and break rules.
- Scalping: You need uninterrupted blocks of 60 to 180 minutes. You watch the screen. You place and manage many orders. You avoid distractions.
- Day trading: You need 1 to 3 focused hours to plan and execute, plus 10 to 20 minutes to review. You can trade one session and stop.
- Swing trading: You need 15 to 30 minutes per day. You check levels, manage stops, and place alerts. You hold through sessions.
Pick the shortest timeframe you can trade without rushing. If you can only check charts at lunch and after work, you default to swing or higher timeframes.
Personality fit, stress tolerance and decision load
Shorter timeframes increase decision count. More decisions create more mistakes. You must match your timeframe to your mental bandwidth.
- If you hate fast feedback: avoid scalping. Price will tag your stop often, even with a good setup.
- If you get tired after a few decisions: avoid 1 minute and 5 minute charts. Use 30 minute, 1 hour, or 4 hour charts to cut trade frequency.
- If you need certainty: avoid holding through news and swaps. Day trading reduces overnight uncertainty. Swing trading demands it.
- If you tilt after a loss: longer timeframes help. You get fewer triggers to revenge trade.
Use a simple rule. If you cannot follow your plan for 20 trades in a row, your timeframe is too fast, or your risk is too high.
Account size realities, position sizing and minimum viable risk
Your account size sets hard limits. Spreads, stop distance, and minimum lot size decide if you can take a trade with sane risk.
- Scalping constraint: your stop often sits close to spread and slippage. If spread equals a large share of your stop, your edge collapses.
- Day trading constraint: you need enough room for your stop to sit beyond noise. If you size up to “make it worth it,” you overleverage.
- Swing constraint: stops tend to be wider. If your account is small, you may need micro lots. If your broker limits sizing, you will take too much risk per trade.
Set a fixed risk per trade, then see if you can place a stop where the setup requires. If you cannot, you must change timeframe, trade a different pair, or lower leverage. Review your broker rules in margin vs leverage.
| Timeframe choice | Main sizing pressure | What you do |
|---|---|---|
| Scalping | Spread and execution costs dominate | Use tight-spread pairs, avoid wide-spread sessions, demand clean liquidity |
| Day trading | Stop must clear intraday noise | Use realistic stops, cap daily loss, stop trading after your limit |
| Swing trading | Wide stops reduce position size | Accept smaller size, target bigger moves, reduce number of open trades |
Instrument selection, pairs that fit short vs long horizons
Pair selection matters more on lower timeframes. Costs and liquidity show up fast.
- Better for shorter horizons: major pairs with deep liquidity and low average spreads. EURUSD, USDJPY, GBPUSD often fit. You still filter by your broker’s live spreads.
- Better for longer horizons: majors and liquid crosses that trend cleanly on higher timeframes. You can tolerate wider stops. You still account for overnight swap and event gaps.
- Usually worse for scalping: exotic pairs and thin crosses. Wider spreads, more slippage, and jumpy price action increase randomness.
Do a quick cost check before you commit. Compare average spread to your typical stop size on that timeframe. If spread consumes too much of the stop, move up a timeframe or change pairs.
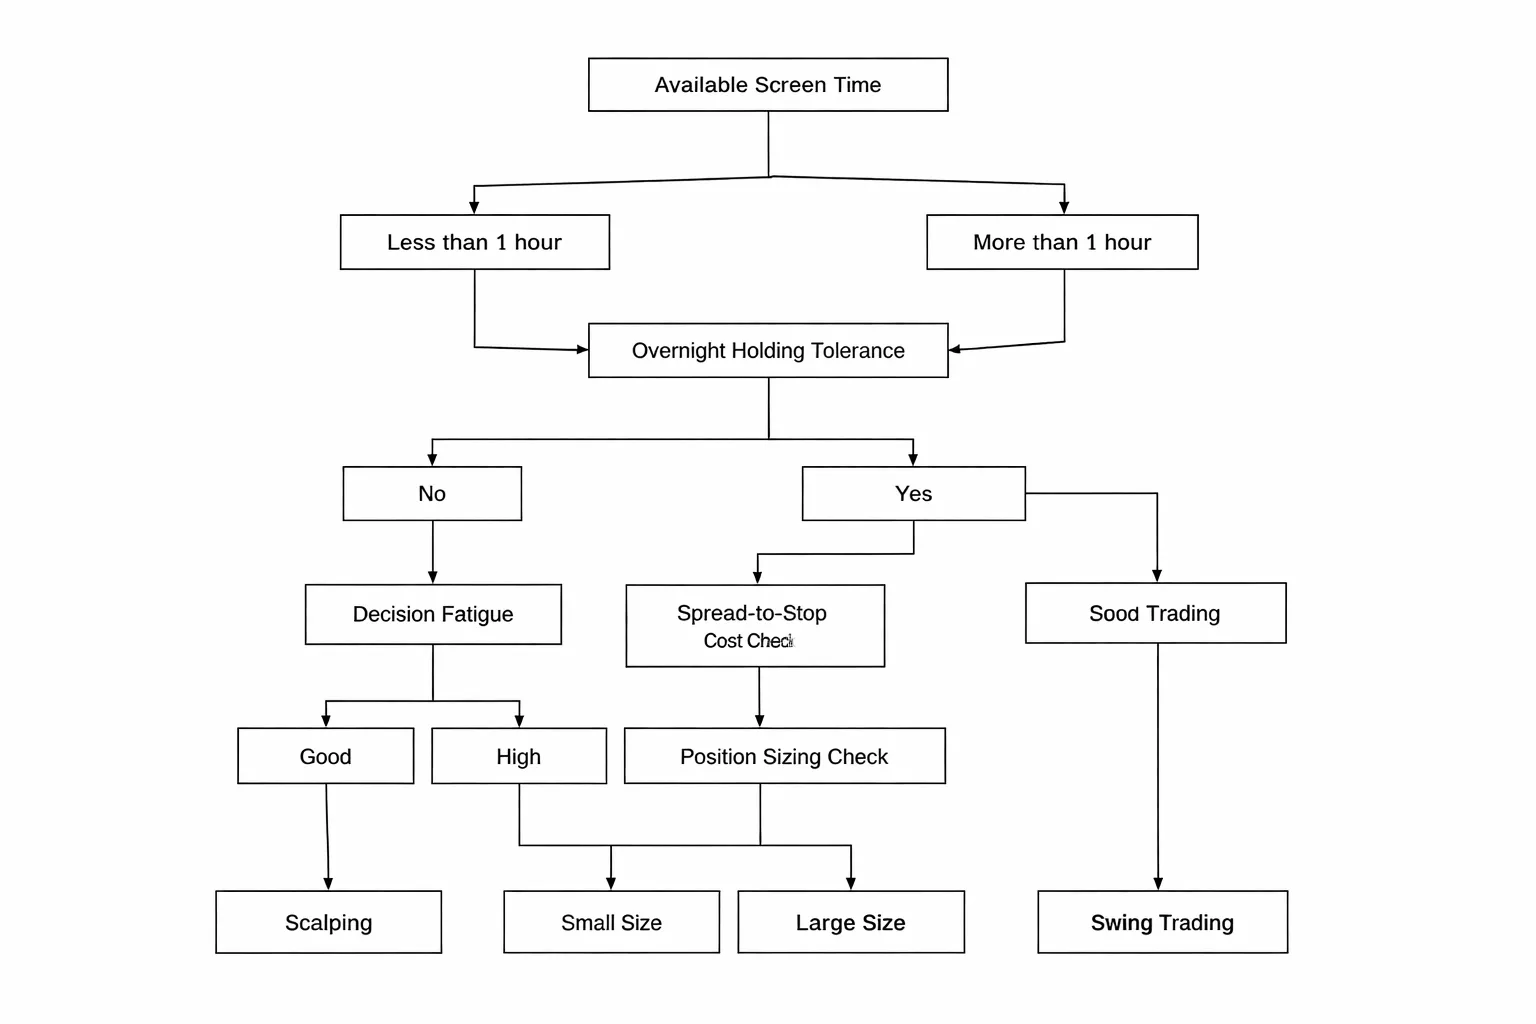
A simple decision tree to pick your best-fit timeframe in 10 minutes
- Step 1, time blocks: If you cannot watch charts for at least 60 minutes without interruption, drop scalping.
- Step 2, hold time comfort: If you refuse overnight exposure, choose day trading. If you can hold for days, keep swing trading on the table.
- Step 3, decision load: If you struggle after 5 to 10 decisions, avoid 1 minute and 5 minute charts. Start at 30 minute to 4 hour charts.
- Step 4, cost test: Open your platform. Check typical spread during your trading hours. If spread is a big fraction of your stop size, move up a timeframe or switch to a tighter-spread pair.
- Step 5, sizing test: Pick one setup. Place a logical stop beyond structure. Size the position to your fixed risk. If the size is too large for your comfort or too small to place due to lot limits, change timeframe or pair.
- Step 6, commit to one primary timeframe: Run it for 20 trades with the same rules. If you break rules, slow down. If performance improves but you feel bored, speed up one step.
Multiple Timeframe Analysis (MTA): A Step-by-Step Framework
Multiple Timeframe Analysis (MTA): A Step-by-Step Framework
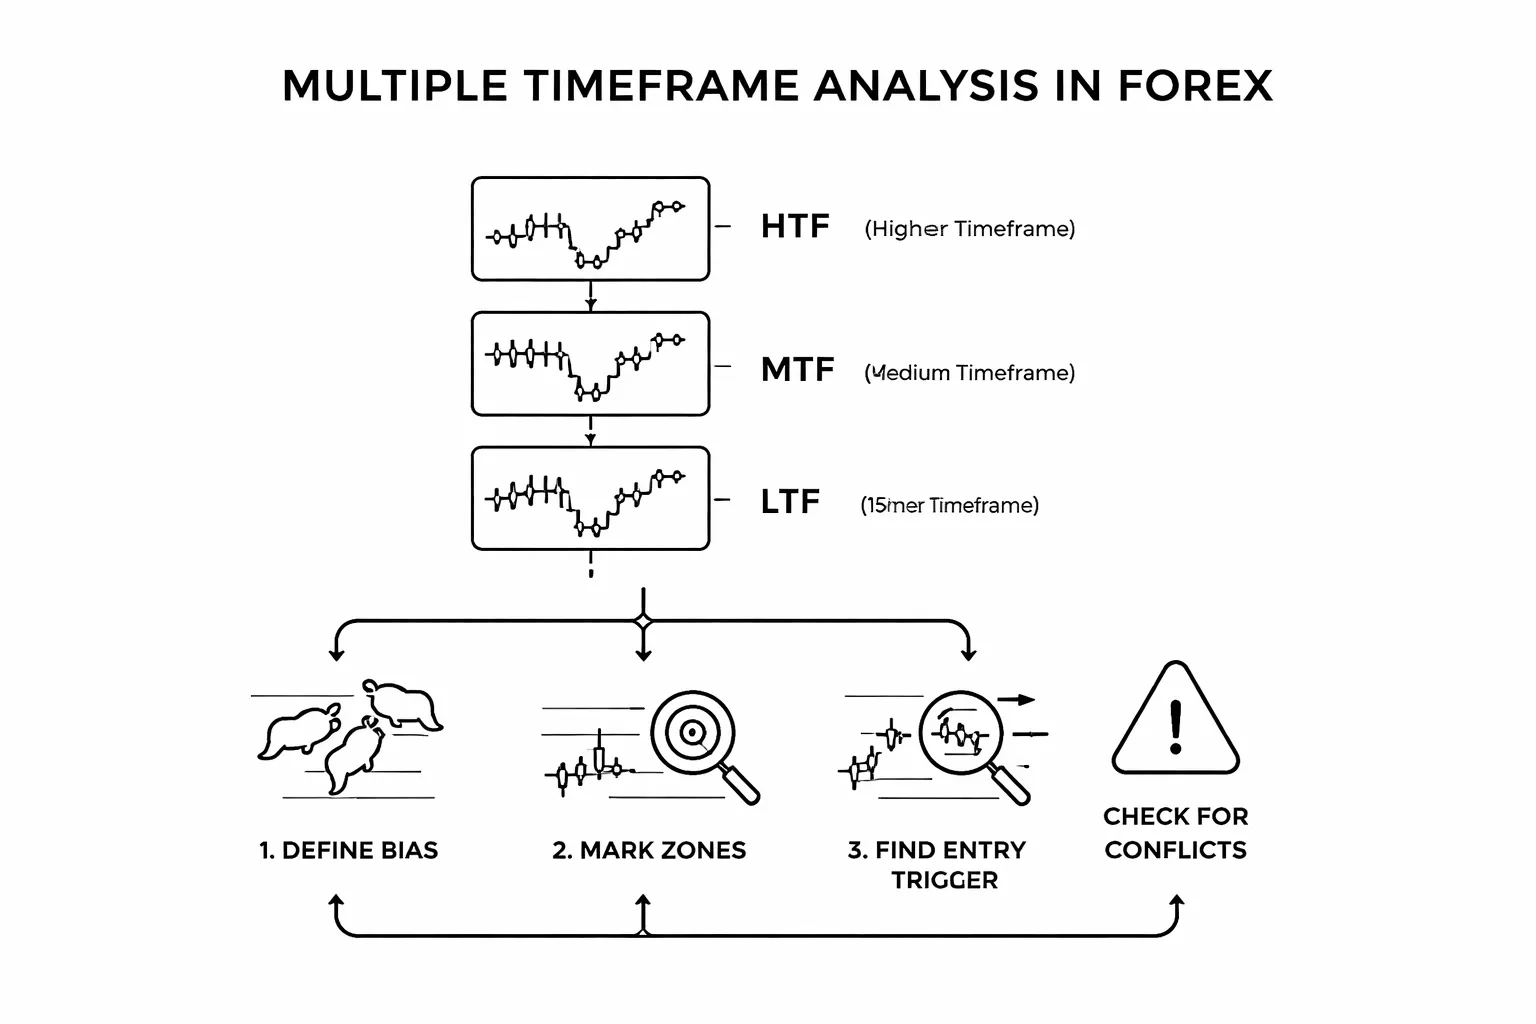
Choose a 3-timeframe stack
Use three charts. Each has one job. Keep the spacing consistent.
- Higher timeframe (HTF): direction and key levels.
- Middle timeframe (MTF): setup quality and location.
- Lower timeframe (LTF): entry trigger and stop placement.
Pick one stack that matches your trading style.
- Swing: D1, H4, H1.
- Day trading: H4, H1, M15.
- Scalping: H1, M15, M5.
Rule: the HTF should be 4 to 6 times the LTF. If you use M15 for entries, use H1 or H4 for bias. Do not mix M5 entries with D1 bias.
Define directional bias on the higher timeframe
Start on your HTF. Decide if you will trade long, short, or stand aside. Use structure first, filters second.
- Structure: mark the last clear swing high and swing low. Higher highs and higher lows means bullish bias. Lower highs and lower lows means bearish bias.
- Break test rule: treat a close beyond the prior swing as a break. Treat a retest that holds as confirmation.
- Trend filter: use one simple filter, then stop. Example, price above a 200 EMA supports long bias, below supports short bias. If structure and filter disagree, follow structure or skip.
Mark key zones, then stop
You need a few zones, not a map of everything.
- Support and resistance: use swing highs and lows that caused clear moves. Ignore minor noise.
- Supply and demand: mark the origin of an impulsive move. Use the base, not the entire trend leg.
- Liquidity areas: equal highs, equal lows, and obvious session highs and lows. These areas attract stops and often trigger runs.
Limit: 3 to 5 zones per pair on the HTF. If you need more, your timeframe is too small or your zones are too loose.
Use the middle timeframe to validate location
Drop to the MTF. You only check two things, location and space.
- Location: price sits at or near a HTF zone that matches your bias.
- Space: you have room to the next opposing zone to justify your target and risk.
If the next opposing zone sits too close, skip. If volatility makes stops huge, switch pair or stack. Pair choice affects spread and execution, review major vs minor vs exotic currency pairs before you force a setup.
Trigger entries on the lower timeframe: confirmation vs anticipation
Pick one entry style. Do not mix them trade to trade.
| Method | What you wait for | Pros | Cons |
|---|---|---|---|
| Confirmation | Break of LTF structure, then retest at your zone. | Fewer bad trades, clearer invalidation. | Later entry, smaller R multiple if you chase. |
| Anticipation | Limit order at the zone with a structure-based stop. | Best price, larger R multiple when it works. | More stops, higher need for strict filtering. |
Execution rules for both methods.
- Place your stop beyond the level that proves you wrong, not at an arbitrary pip count.
- Enter only at HTF zone alignment. No zone, no trade.
- Use one trigger. Example, break and retest, or engulf close, or rejection wick with close back inside the zone.
Avoid MTA paralysis with hard rules
MTA fails when you let any chart veto any other chart. Use fixed tie-breakers.
- One-way bias: trade only in the HTF bias direction. If HTF is neutral, you do not trade.
- Zone priority: HTF zones override LTF patterns. A clean LTF setup into HTF resistance is a skip.
- Two-signal limit: you need only two reasons, HTF bias plus zone location. Your LTF trigger is execution, not a third reason.
- Time cap: 10 minutes for analysis per session. If you cannot decide, you lack a rule.
- Conflict rule: if MTF structure contradicts HTF bias, stand aside until HTF breaks or MTF realigns.
- Journal tags: tag each trade as confirmed or anticipated. Track results separately for 20 trades each.
Risk Management by Timeframe (Position Sizing, Stops, and Targets)
Why stop-loss distance changes with timeframe, and why lot size must adapt
Your stop must sit beyond the structure your setup uses. Structure size expands as timeframe rises. So your stop distance grows.
If you keep the same lot size while widening stops, your cash risk explodes. You fix this by sizing positions from risk first, not from “how many lots feels right.”
Position size formula
- Account risk per trade ($) = Account equity x Risk %
- Stop distance (pips) = Entry to stop
- Position size (lots) = Account risk per trade ($) / (Stop pips x Pip value per lot)
Lower timeframes tend to use tighter stops, so your lot size can be larger. Higher timeframes tend to use wider stops, so your lot size must be smaller.
Fixed percentage risk vs volatility-based risk, when to use each
Fixed percentage risk keeps you consistent. You risk the same fraction of equity on every trade. It fits rule-based systems with stable stop logic.
- Use it when your stop placement stays similar across trades on the same style.
- It simplifies journaling and makes performance easier to compare.
Volatility-based risk adjusts to current conditions. It prevents you from using a stop that is too tight in high volatility or too wide in low volatility.
- Use ATR or recent average range to set stop distance.
- Example: stop = 1.5 x ATR(14) on your execution timeframe, then size the position from that stop.
- Reduce size around major news spikes if spreads widen and fills slip.
Pick one primary method per strategy. Mixing methods trade to trade creates random risk.
Risk-to-reward expectations by style, what is realistic
Expectations must match your timeframe, spread cost, and hit rate. Lower timeframes pay more “friction” per trade. Higher timeframes pay less friction but take larger stops.
| Style | Common stop size | Realistic target range | Typical R multiple profile |
|---|---|---|---|
| Scalping | Small, structure tight | Small to moderate, fast exits | Often 0.5R to 1.5R, occasional 2R |
| Day trading | Moderate, intraday structure | Moderate, same-session | Often 1R to 3R |
| Swing trading | Larger, HTF swing points | Larger, multi-day | Often 2R to 5R, sometimes more |
Do not force high R on scalps. Spread and slippage punish you. Do not accept tiny R on swings. Time and overnight risk demand payoff.
Use partials and trailing only if your backtest proves it improves expectancy. Otherwise keep exits simple, fixed target or clear structure-based exit.
Drawdown control systems, max daily or weekly loss and cooling-off rules
You need a kill switch. Timeframes change how fast you can damage the account.
- Scalping: set a strict daily loss limit. Many small losses stack fast. Cap the number of losing trades per session.
- Day trading: use a daily loss limit plus a weekly limit. You can overtrade after one bad trade.
- Swing trading: daily limits matter less. Weekly and monthly limits matter more because trades overlap and correlation bites.
Practical limits
- Max loss per day: 2R to 3R.
- Max loss per week: 5R to 8R.
- Cooling-off rule: after 2 losses in a row, stop for the day or require one full setup grade higher.
- Correlation rule: treat highly correlated pairs as one risk bucket. Do not stack full risk on EURUSD and GBPUSD in the same direction.
Also manage leverage. High leverage makes a normal stop feel safe until a gap or spike hits. Review your margin requirements and exposure, see margin vs leverage.
Backtesting and forward testing, metrics that matter
Track performance in R. It makes timeframe comparisons clean.
- Win rate: winners / total trades. High for many scalps, lower for swing systems that aim for large R.
- Payoff ratio: average win / average loss. This anchors your R:R reality.
- Expectancy: (Win rate x Avg win) minus (Loss rate x Avg loss). Positive expectancy is the goal.
- Max drawdown: peak to trough in R and in percent. Use it to set your weekly stop and your size.
- Trade frequency: trades per week. More trades need tighter process control.
Backtest to build rules. Forward test to confirm fills, spreads, and execution speed. Keep your “confirmed” and “anticipated” tags separate, then compare expectancy for each after 20 trades.
Practical Examples: One Market Move Across Three Timeframes
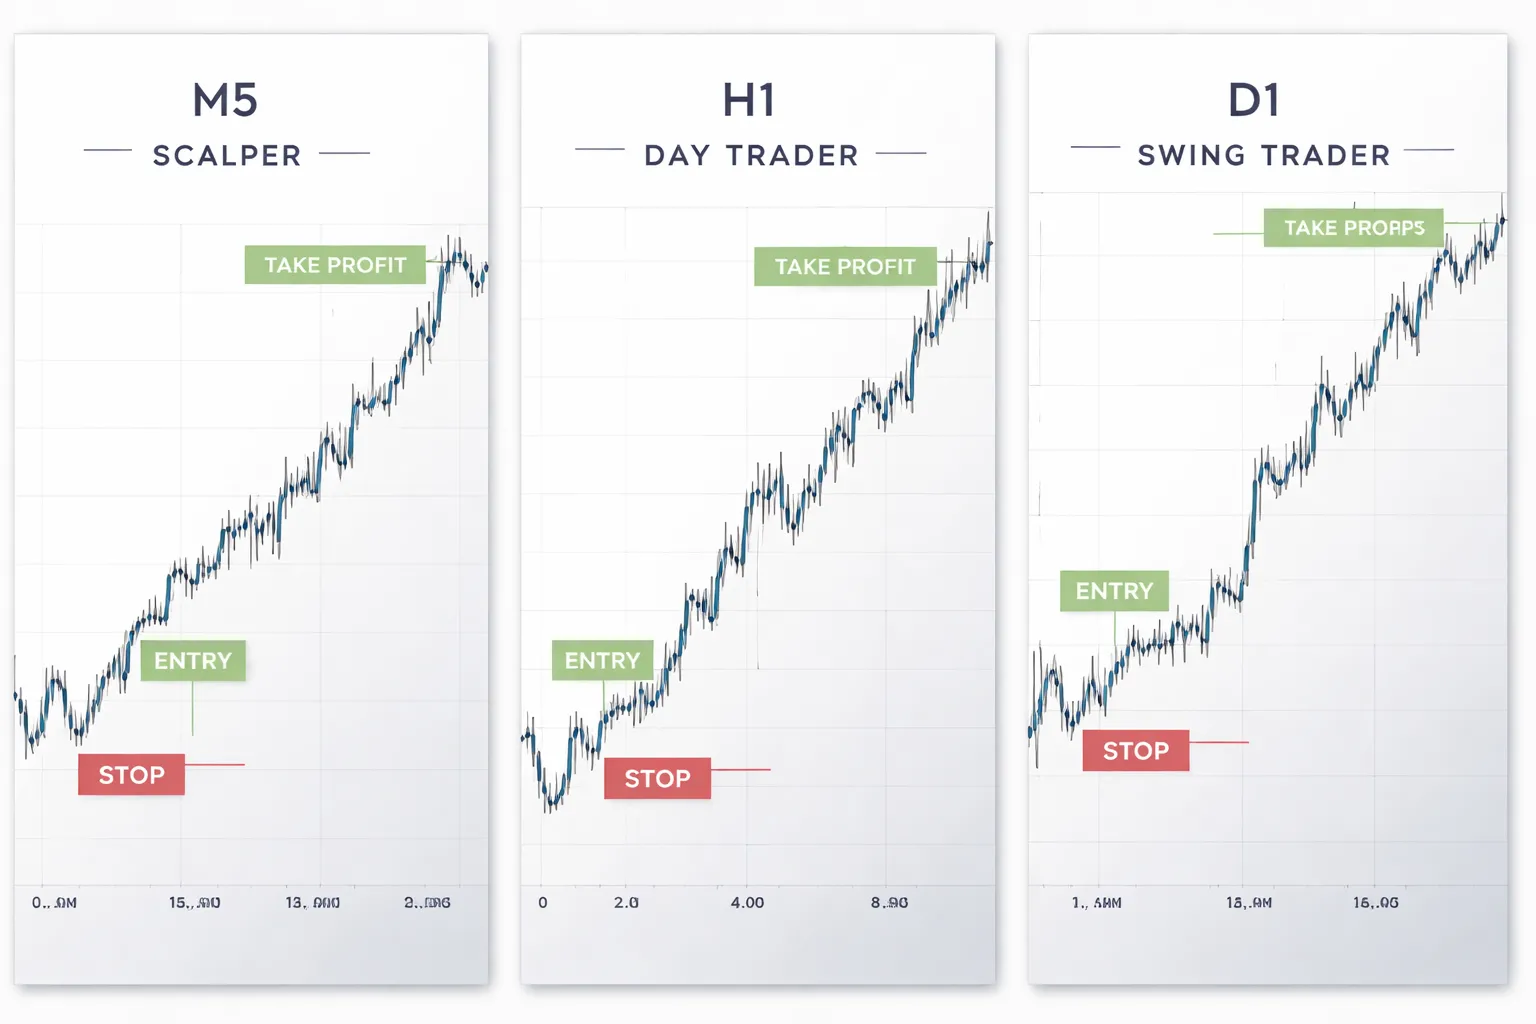
The same trend on M5, H1, and D1, what changes and what doesn’t
Assume EURUSD trends up for three days. Price moves from 1.0800 to 1.0920. That is a 120 pip move.
- What stays the same: Direction. The market makes higher highs and higher lows. The bias stays long until structure breaks.
- What changes: Noise, stop size, and decision speed.
- M5 view: Many pullbacks. Many false breaks. You need tight execution and defined cut rules.
- H1 view: Fewer swings. Cleaner levels. You can plan around the session and key hours.
- D1 view: One or two clean pushes. Pullbacks look small. You manage time risk and overnight gaps.
| Timeframe | Typical hold | Stops and targets | What matters most |
|---|---|---|---|
| M5 | Minutes | 5 to 12 pip stop, 5 to 20 pip target | Spread, slippage, fast invalidation |
| H1 | Hours | 15 to 35 pip stop, 25 to 80 pip target | Session flow, key levels, partial exits |
| D1 | Days | 60 to 150 pip stop, 120 to 400 pip target | Trend structure, swap, news, gap risk |
How a scalper might trade the move, entry logic, stop placement, and exit rules
Your job on M5 is to extract pieces of the trend. You trade the intraday swings inside the larger move.
- Context filter: Use H1 trend up. Only take longs on M5.
- Entry logic: Wait for an M5 pullback to a prior intraday support level. Enter on break and retest, or on a close back above the level.
- Stop placement: Put the stop below the pullback low, plus spread. Keep it small enough to fit your plan, usually 5 to 12 pips on a major.
- Exit rules: Take profit at the next intraday high, or a fixed R multiple. Common plan, take 1R at first target, move stop to breakeven, trail the rest behind new M5 higher lows.
- Kill switch: Stop trading after a preset daily loss, or after two execution errors. Scalping punishes sloppy fills.
How a day trader might trade the move, session plan and partials
Your job on H1 is to catch one clean leg. You trade less, but you hold longer.
- Session plan: Mark the Asian range. Mark prior day high and low. Trade the London and New York windows when range expansion happens.
- Entry logic: In an uptrend, buy the first H1 pullback that holds above a prior swing low. Confirm with an H1 close that rejects the level.
- Stop placement: Put the stop below the last H1 swing low. Leave room for normal hourly volatility, often 15 to 35 pips on EURUSD.
- Partials: Take 30% to 50% off at 1R. Move stop to entry only after price clears the last H1 swing high. Let the remainder target the prior day high, then trail under new H1 higher lows.
- Time stop: If price does not move within 2 to 4 hours, exit. Dead trades tie up margin and focus.
How a swing trader might trade the move, scaling in and out and managing overnight risk
Your job on D1 is to ride the core trend. You accept wider stops and fewer decisions.
- Entry logic: Buy after D1 confirms a higher low and breaks the prior D1 swing high. Add on the first D1 pullback that holds above the breakout zone.
- Scaling in: Start with a smaller position on the breakout. Add only after the market proves direction. Keep total risk capped at your planned R.
- Stop placement: Put the stop below the D1 higher low that defines your thesis. That can be 60 to 150 pips. Size down to keep risk fixed.
- Scaling out: Take partials into weekly resistance or at 2R to 3R. Hold a runner until D1 breaks structure.
- Overnight risk: Check the economic calendar. Reduce size or hedge ahead of major releases. Know your swap costs. Avoid over-leverage, use correct margin math; see margin vs leverage.
What to learn from the comparison, aligning tactics with context
- Same move, different problems: The scalper fights spread and noise. The day trader fights chop and timing. The swing trader fights patience, gaps, and news risk.
- Stops define the game: A 10 pip stop needs near-perfect entries. A 100 pip stop needs smaller size and stronger conviction.
- Targets must match timeframe: If you scalp, you cannot demand swing targets. If you swing trade, you cannot micromanage M5 pullbacks.
- Pick one primary execution chart: One set of rules. One set of metrics. Track expectancy, drawdown, and frequency per timeframe.
- Use higher timeframe as a filter: Let D1 or H1 set bias. Let your execution chart set entries, stops, and exits.
Common Mistakes When Switching Timeframes (and How to Fix Them)
Using the Same Stop Size on Every Chart
A fixed 10 pip stop fails when you change timeframes. Volatility changes. Market structure changes. Your stop must change too.
- Fix with ATR: Set a baseline stop using ATR for your execution chart. Many traders start around 1.0 to 2.0 ATR, then refine.
- Fix with structure: Place your stop beyond a clear swing point on your execution chart. If you cannot define structure, you do not have a stop plan.
- Fix position size: Keep risk per trade constant, then size the position to match the stop distance. Use a position sizing method that fits your account and broker.
| Timeframe shift | What breaks | What to standardize |
|---|---|---|
| M5 to H1 | Stops too tight, frequent stop outs | ATR-based stop and structure-based invalidation |
| H1 to M5 | Stops too wide, poor R multiple | Execution-level structure and tighter ATR |
Chasing Signals Without Context
When you drop to a lower chart, you see more setups. Most are noise. Without context, you trade into higher timeframe supply, demand, and trend.
- Set a bias first: Use D1 or H1 to define trend direction or range conditions.
- Mark key levels: Prior highs, lows, and obvious swing points. Keep it simple. One to three levels that matter.
- Trade only aligned setups: Take entries on your execution chart only when they match the higher timeframe bias.
Ignoring Trading Costs on Lower Timeframes
On lower timeframes, costs decide if you have edge. Spread, commissions, and slippage hit every trade. More trades means more cost drag.
- Build a cost-aware expectancy: Track average win, average loss, win rate, and average cost per trade. Subtract costs from every result.
- Set a minimum target rule: Require a minimum R multiple after costs, not before. If your typical take profit is small, costs will erase it.
- Define a max spread filter: If spread expands beyond your limit, you do not trade. This matters most around session opens and news.
If you do not understand how quotes, spreads, and execution work, read how the forex market works.
Strategy Hopping
Switching timeframes often triggers system switching. You change rules after a small losing streak. You never learn your real edge.
- Create one rules-based playbook: Define setup, entry trigger, stop placement, target logic, and exit rules.
- Lock a testing period: Run the same rules for a fixed sample size. Many traders use 50 to 100 trades per timeframe before changes.
- Change one variable at a time: If results disappoint, adjust one input, then retest. Do not rewrite the whole system.
Not Tracking Performance by Session and Timeframe
If you mix timeframes in your journal, your stats lie. If you ignore sessions, you miss where your edge appears and where it dies.
- Tag every trade: Timeframe, session, pair, setup type, and market condition.
- Track core metrics: R multiple, MAE, MFE, hold time, and cost per trade.
- Review by slice: Filter results by timeframe and session. Keep what performs. Cut what bleeds.
| Journal tag | Examples | What it reveals |
|---|---|---|
| Timeframe | M5, M15, H1, H4 | Where your setup actually works |
| Session | Asia, London, New York, overlap | When volatility supports your target size |
| Condition | Trend, range, high impact news day | Which environments create losses |
| Execution quality | limit, market, slipped | How fills impact results |
Frequently Asked Questions
What is a forex timeframe?
A timeframe is the length of each candlestick on your chart. M5 shows 5 minute candles. H1 shows 1 hour candles. Your timeframe controls how many signals you see, how long trades last, and how wide your stop and target usually need to be.
Which timeframe is best for beginners?
Start with H1 or H4. You get fewer trades and clearer structure. You also have more time to plan entries and manage risk. Avoid M1 and M5 until you can execute fast and track slippage, spreads, and news volatility without mistakes.
What timeframes do scalpers use?
Most scalpers use M1 to M5 for entries and M15 to confirm direction. Your edge must cover spread and slippage. You need tight stops, quick exits, and high liquidity sessions. Many strategies fail when spreads widen outside London and New York.
What timeframes do day traders use?
Many day traders plan on H1 and execute on M15 or M5. You aim to finish flat by session end. Your target size must match daily volatility. You need rules for news windows and for reduced movement during Asia or late New York.
What timeframes do swing traders use?
Swing traders often use H4 and D1 for structure and H1 for entries. Trades can last days to weeks. Stops usually sit beyond major swing points. You must factor swaps, weekend gaps, and high impact events that can move price beyond your stop.
Can you mix timeframes?
Yes. Use a higher timeframe to define trend and key levels. Use a lower timeframe to time entries and manage risk. Keep the stack simple, like D1 to H4 to H1, or H4 to H1 to M15. Too many charts creates conflicts.
How do you choose a timeframe that fits your schedule?
Match the timeframe to your available screen time. If you can watch charts for hours, M5 to M15 can work. If you can check a few times per day, use H4. If you can only review once daily, use D1 and accept slower feedback.
Do lower timeframes give better entries?
Lower timeframes give earlier entries, not better ones. Noise increases as timeframe drops. You also pay spread more often because you trade more. Track your average win in pips versus average spread and slippage. If the gap is small, scale up.
How do spreads affect timeframe choice?
Spread is a fixed cost per trade. On M1 to M5, it can consume most of your expected move. On H1 to D1, spread matters less because targets are larger. Learn how spread works and when it widens in this spread guide.
What is multiple timeframe analysis?
You align direction, levels, and execution. Higher timeframe sets bias and key zones. Mid timeframe shows current structure. Lower timeframe triggers the entry. Write the timeframe on every trade log. If results vary by timeframe, you have a context problem.
How many trades per day should you take on each timeframe?
There is no target count. Use a max loss per day and a max number of rule breaks. Scalpers often take many trades, day traders take a few, swing traders take fewer. Measure your expected value per trade. More trades do not fix a weak edge.
Which sessions work best for each style?
Scalping and day trading work best in London, New York, and the overlap. Swing trading cares less about the session, but entries still improve during liquid hours. Avoid forcing trades during low liquidity periods when spreads widen and moves stall.
Should you change timeframes after a losing streak?
Do not jump timeframes to chase wins. First, check tags in your journal, timeframe, session, condition, and execution quality. If losses cluster in one tag, adjust rules. Only change timeframe after at least 30 trades of data on the same setup.
Conclusion
Conclusion
Your timeframe sets your job. Scalping needs speed and tight costs. Day trading needs focus and a fixed session. Swing trading needs patience and wider stops.
Pick one primary timeframe and one setup. Trade it at the same hours. Log every trade. Make changes only from data, not emotion.
- Scalping: fewer pairs, lowest spreads, strict daily loss limit, stop trading when execution slips.
- Day trading: one session, hard cutoff time, avoid holding into news without a plan.
- Swing trading: smaller position size, wider stop, fewer decisions, accept overnight risk.
Final rule. Commit to 30 trades on one setup. Review your journal tags. Fix the single biggest leak. Then repeat. If you still need a foundation, start with what is forex trading and build from there.
-
Forex Market Hours & Trading Sessions Explained (Best Times to Trade)
4 months ago -
Forex Leverage Explained: How It Works, Pros, Cons & Examples
4 months ago -
What Is a Lot Size in Forex? Lot Types + Quick Examples
4 months ago -
How to Calculate Position Size in Forex (Position Sizing Formula + Examples)
4 months ago -
What Are Pips in Forex? Definition, Examples & Why They Matter
4 months ago
-
- Structuring a day, prep, key levels, and a news-aware schedule
- Timeframe combinations that work, H1 bias plus M15 and M5 execution
- Managing intraday volatility, ATR-based stops and realistic profit targets
- How to handle high-impact news, trade, reduce size, or stand aside
- Risk controls for day traders, daily loss limits, time stops, and journaling metrics
- End-of-day routine, review, screenshots, and playbook updates
-
- Multiple Timeframe Analysis (MTA): A Step-by-Step Framework
- Choose a 3-timeframe stack
- Define directional bias on the higher timeframe
- Mark key zones, then stop
- Use the middle timeframe to validate location
- Trigger entries on the lower timeframe: confirmation vs anticipation
- Avoid MTA paralysis with hard rules
-
- Why stop-loss distance changes with timeframe, and why lot size must adapt
- Fixed percentage risk vs volatility-based risk, when to use each
- Risk-to-reward expectations by style, what is realistic
- Drawdown control systems, max daily or weekly loss and cooling-off rules
- Backtesting and forward testing, metrics that matter
-
- The same trend on M5, H1, and D1, what changes and what doesn’t
- How a scalper might trade the move, entry logic, stop placement, and exit rules
- How a day trader might trade the move, session plan and partials
- How a swing trader might trade the move, scaling in and out and managing overnight risk
- What to learn from the comparison, aligning tactics with context
-
- What is a forex timeframe?
- Which timeframe is best for beginners?
- What timeframes do scalpers use?
- What timeframes do day traders use?
- What timeframes do swing traders use?
- Can you mix timeframes?
- How do you choose a timeframe that fits your schedule?
- Do lower timeframes give better entries?
- How do spreads affect timeframe choice?
- What is multiple timeframe analysis?
- How many trades per day should you take on each timeframe?
- Which sessions work best for each style?
- Should you change timeframes after a losing streak?
-
How to Place a Forex Trade Step by Step (Your First Trade Explained)
2 months ago -
Forex Trading vs Crypto Trading: Which Market Is Better for Beginners?
2 months ago -
Forex Lot Size Calculator: How to Use It to Size Trades Correctly
4 months ago -
How to Calculate Position Size in Forex (Position Sizing Formula + Examples)
4 months ago -
Forex Leverage Explained: How It Works, Pros, Cons & Examples
4 months ago
-
Is Forex Trading Legal in the United States? Rules, Regulators & What to Know
4 months ago -
Forex Market Hours & Trading Sessions Explained (Best Times to Trade)
4 months ago -
Forex Trading Platforms Comparison: MetaTrader vs cTrader vs TradingView
4 months ago -
Forex Leverage Explained: How It Works, Pros, Cons & Examples
4 months ago -
What Is a Lot Size in Forex? Lot Types + Quick Examples
4 months ago