How to Read Myfxbook Results: Metrics Explained (Drawdown, Gain, Risk & More)

Myfxbook can show strong gains and still hide bad risk. You need to read the metrics, not the headline.
This guide breaks down the core Myfxbook stats you will see on most verified accounts. You will learn what each metric measures, how it gets calculated in practice, and what numbers signal trouble.
We cover gain vs return, equity vs balance, drawdown types, profit factor, expectancy, win rate, average win and loss, and risk indicators like lot sizing and exposure. You will also learn how to spot common reporting traps, like short track records, high leverage, and smooth equity curves that rely on martingale or grid.
If you trade in the US, keep your account setup compliant with US forex trading rules.
In het kort:
- Start with account trust. Check track record length, verification status, and broker feed. Ignore results without proof.
- Read gain with risk. A high gain means little if the account took extreme risk to get it.
- Use equity, not balance, to judge stress. Equity shows open drawdown and real exposure. Balance hides it.
- Know the drawdown type. Focus on maximum drawdown and relative drawdown. Compare it to the gain over the same period.
- Profit factor needs context. Combine it with trade count and drawdown. One lucky streak can inflate it.
- Expectancy beats win rate. Win rate alone misleads. Expectancy, average win, and average loss show if the edge is real.
- Watch position sizing. Lot size jumps, high exposure, and high leverage signal fragile performance.
- Spot curve tricks fast. Smooth equity with deep but rare drawdowns often points to martingale or grid behavior.
- Filter for survivability. You want steady returns, controlled drawdown, and consistent sizing. Avoid systems that rely on one recovery trade.
- Stay compliant if you trade in the US. Know leverage limits, FIFO, and hedging rules. Read our guide on US forex trading rules.
What Myfxbook Results Are (and What They Are Not)
What Myfxbook Results Are
Myfxbook results are a reporting layer. They pull trade and balance data from a connected platform or broker. They turn that feed into charts and stats.
You use them to compare accounts on the same screen. You use them to spot patterns fast, like rising drawdown, unstable position sizing, or long trade holding times.
They can help you verify basic claims. They can also help you ask better questions before you copy a system or fund an account.
What Myfxbook Results Are Not
Myfxbook does not prove skill by itself. It does not guarantee the broker feed is clean. It does not guarantee the trader can repeat the performance.
Myfxbook also does not show your real risk unless you read beyond the headline numbers. A high Gain can hide fragile risk and large tail losses.
Why Myfxbook Can Mislead
- Platform limitations: Some stats depend on how the platform reports swaps, commissions, and open trades. A system can look better if costs get underreported or delayed.
- Broker feed differences: Spreads, slippage, and execution quality change results. A strategy can thrive on one broker and fail on another. Myfxbook shows what happened there, not what will happen for you.
- Strategy behaviors: Grid and martingale can show smooth growth for long periods. They can also hide risk until one move wipes months of gains. Look for expanding lot sizes, high trade count clusters, and long recovery trades.
Investor View vs Trading View
Myfxbook often shows two angles of the same account.
- Investor view: Focuses on account level outcomes. You see balance, equity, drawdown, deposits, and withdrawals. This view helps you judge if returns came from trading or from added capital.
- Trading view: Focuses on the trade list and behavior. You see position sizes, holding time, instruments, win rate, and profit factor. This view helps you judge risk habits and strategy type.
Use investor view to confirm the story. Use trading view to confirm the method.
Backtest vs Real Account vs Demo
- Backtest: A model output. It can ignore real spreads, slippage, and broker rules. Use it to understand the idea, not to trust the returns.
- Demo: Real-time logic with fake fills. It often gets better execution than live. Use it to check consistency and behavior, not performance claims.
- Real account: The highest standard. It includes real costs and real execution. Still, one real account can run in ideal conditions, with low risk, or with selective withdrawals.
The Biggest Mistake: Focusing on Gain Without Context
Gain is a result, not a risk measure. A 200 percent Gain means little if the account hit 60 percent drawdown, used extreme leverage, or relied on one recovery run.
Read Gain with these checks:
- Compare Gain to Max Drawdown.
- Check Equity vs Balance gaps. Large gaps often mean large floating losses.
- Scan lot size growth over time. Fast growth signals rising risk.
- Confirm deposits and withdrawals. A rising balance can come from added funds, not trading.
If you want a cleaner filter, start with survivability first. Then look at returns. For more safety checks, use our forex scam safety checklist.
Start Here: Account Verification, Data Integrity, and Context Checks
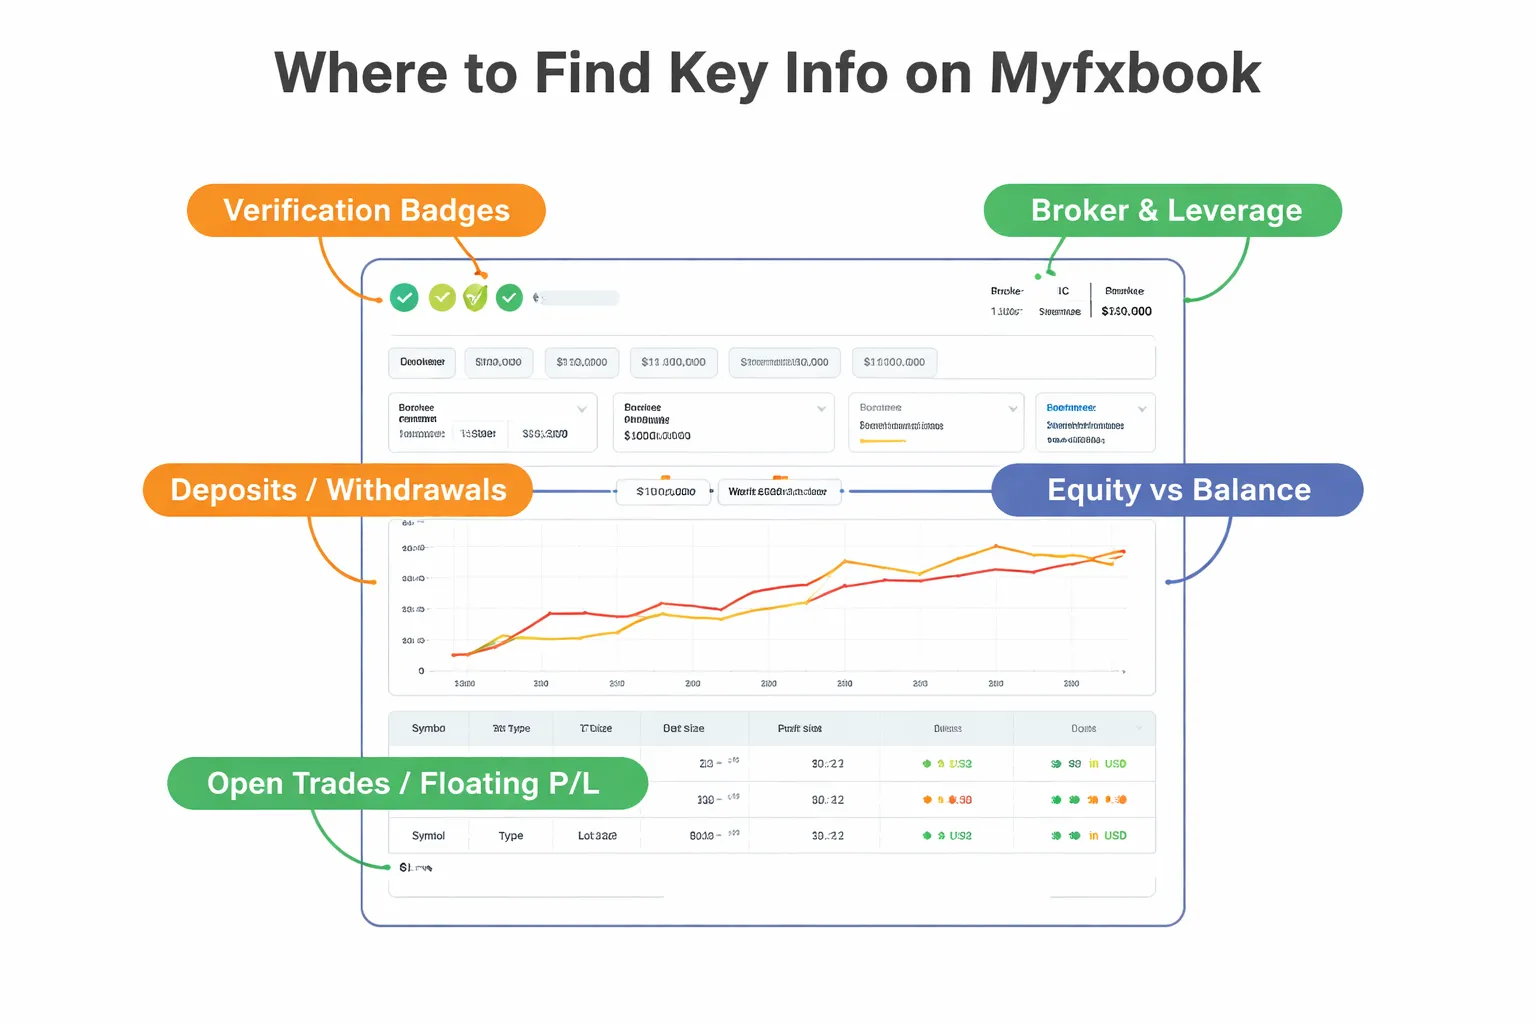
Read the Verification Badges First
Start with the badges near the top of the Myfxbook page. They tell you if the data comes from a live, controlled source.
- Track Record Verified means Myfxbook can confirm the performance history matches the broker statement. Treat this as the minimum.
- Trading Privileges Verified means the account owner proved they can place trades on that account. This reduces the chance of a copied statement or edited history.
- If you see no verification, treat every metric as self reported.
Then check the broker and platform connection method. Direct publishing from the trading platform tends to be cleaner than manual uploads.
Check Broker, Account Type, and Leverage
Risk metrics mean nothing without the setup behind them. Read the account details block before you judge gain or drawdown.
- Broker. Weak or unregulated brokers increase execution risk and pricing issues. If the broker looks unfamiliar, run a fast due diligence pass using our forex scam safety checklist.
- Account type. Demo results do not translate to real fills, spreads, and slippage. Cent accounts can hide true position size impact.
- Leverage. High leverage changes everything. A 10 percent drawdown at 1:30 does not equal a 10 percent drawdown at 1:500. High leverage often signals tighter margin for error and faster blowups.
- Currency. Account currency affects how you interpret pip value, lot sizing, and deposits.
Track Record Length and Sample Size
Short histories mislead. A clean equity curve over a few weeks can come from luck, one trend, or one news cycle.
- 1 to 3 months. Too little data. You have not seen multiple regimes, spread changes, or real drawdown cycles.
- 6 to 12 months. Better baseline. You can check if returns survive different market conditions.
- Trade count. More trades gives you a tighter read on expectancy. Very low trade counts let one outlier dominate the stats.
- Consistency. Look for repeated months, not one spike month carrying the whole gain.
Deposits and Withdrawals Distort the Charts
Myfxbook can show strong balance growth even when trading performance stays weak. Cash flows can mask risk and inflate perceived returns.
- Check the deposits line. A rising balance can come from added funds, not profit.
- Check withdrawals. Large withdrawals can make drawdown and recovery look smaller than the actual trading swings.
- Compare gain to the cash flow history. If the equity curve rises but funding also rises, you need a closer look.
Open Positions and Floating P/L
Hidden drawdown often sits in open trades. You need to see current exposure before you trust the closed trade stats.
- Check open trades and floating P/L. Large negative floating P/L means the system may carry losses and delay realization.
- Compare equity vs balance. A large gap signals underwater positions. That gap can turn into a fast drawdown if the market moves further.
- Scan if the account uses grids, martingale, or averaging down. You often see many clustered entries and rising lot sizes while equity lags balance.
Time Zone, Sessions, and News Exposure
Timing affects risk. Two accounts with the same gain can face very different execution conditions.
- Time zone. Myfxbook reports trades in a specific server time. Align it with your market view so you do not misread holding times and session behavior.
- Trading sessions. London and New York overlap brings liquidity. Off hours can bring wider spreads and more slippage. Scalpers suffer most.
- News exposure. Check if big moves cluster around major releases. High return systems sometimes rely on gap risk and spread spikes.
- Weekend holds. Holding through weekends adds gap risk. You often see it in large Monday equity jumps.
Performance Metrics Explained: Gain, Profit, ROI, and Growth Curves
Gain vs Profit: Percentages vs Currency
Gain shows performance in percent. It lets you compare systems across different account sizes. A 20 percent gain on a $1,000 account and a $100,000 account means the same return rate.
Profit shows performance in account currency. It tells you if the system produces meaningful money after spreads, commissions, and swaps.
- Use gain to compare traders and strategies.
- Use profit to judge real-world impact on your bankroll.
- Watch for accounts that show high gain but low profit because the starting deposit was tiny or the account changed size often.
ROI and What Myfxbook Actually Displays
Myfxbook gain acts like a return on equity series based on account history. It updates as balance and equity change. It is not a clean, time-weighted return like a fund report.
- If the trader adds money, percent gain can drop even if the system performs well.
- If the trader withdraws money, percent gain can jump even if performance stays flat.
- Check deposits and withdrawals before you trust any ROI number.
When you compare two accounts, favor the one with fewer cash flow events. You get a clearer read on the strategy.
Equity Curve vs Balance Curve: What Divergence Means
Balance moves only when trades close. Equity moves tick by tick with open profit and loss. The gap between them shows open risk.
- If equity stays close to balance, the trader cuts losses and closes trades often.
- If equity swings far below balance, the trader holds losing positions. You see floating drawdown and delayed pain.
- If equity spikes above balance often, the trader rides open profit and gives some back before closing.
Large and frequent divergence usually means higher exposure. It can also signal grid, martingale, or averaging behavior. Confirm by checking position sizing and trade duration.
Monthly and Yearly Breakdowns: Consistency Beats One Big Month
Monthly returns show how the system behaves across conditions. You want steady output, not one outlier month carrying the whole track record.
- Look for many green months with smaller gains.
- Flag accounts where one month creates most of the total gain. That often links to a single high-risk run.
- Check for seasonality. Some systems do well only in high volatility periods.
- Compare the worst month to the average month. A deep worst month shows fragile risk control.
Yearly results matter more than lifetime gain. A strategy can look strong after one good year and fail in the next. You want repeated performance across years.
Recovery Factor Basics: How Fast Gains Rebuild After Losses
Recovery factor compares total gain to max drawdown. Higher values mean the account recovered and grew without needing extreme drawdown.
- Low recovery factor often means the trader takes big hits and needs long runs to recover.
- High recovery factor usually means tighter drawdowns or faster rebounds.
Do not read it alone. Pair it with the equity curve. A smooth recovery with shallow equity dips signals controlled risk. A sharp recovery after a deep dip can signal a leverage spike.
Drawdown Deep Dive: The Most Misunderstood Metric
Balance drawdown vs equity drawdown, which one signals real risk
Equity drawdown shows your true risk. It includes open trades. It reflects what your account can lose before you close anything.
Balance drawdown can hide problems. It updates only after you close trades. A trader can sit on a large floating loss while balance drawdown looks fine.
- Use equity drawdown to judge survival risk and margin stress.
- Use balance drawdown to judge realized loss control and stop discipline.
- If equity drawdown stays far above balance drawdown, you rely on holding losers.
Maximum drawdown vs average drawdown, what each implies about stability
Maximum drawdown is your worst peak-to-trough hit. It measures tail risk. One bad stretch can wipe months of gains.
Average drawdown shows your typical pain. It measures consistency. It tells you what you will likely feel most months.
- Low average drawdown with a high max drawdown means rare blowups. Your system carries hidden crash risk.
- High average drawdown with a moderate max drawdown means constant stress. Your edge may depend on enduring long dips.
- Compare max drawdown to total gain. If max drawdown is close to total gain, one cycle can erase your progress.
Drawdown duration and time-to-recover, assessing psychological and capital strain
Drawdown percent tells you how deep the hole gets. Duration tells you how long you live in it.
- Long drawdowns tie up margin and limit new trades.
- Long recoveries raise the chance you change rules midstream and lock in losses.
- Short, frequent drawdowns often signal tight stops. Long, infrequent drawdowns often signal wide stops or no stops.
Track two numbers in your notes. Days in drawdown, and days to recover to a new equity high. If recovery time grows as the account grows, your sizing may scale risk faster than your edge.
Peak-to-trough math made simple, how drawdown is calculated
Myfxbook drawdown comes from the drop from a peak to a later low.
| Step | What you do | Formula |
|---|---|---|
| 1 | Mark the peak balance or equity | Peak = highest value so far |
| 2 | Find the lowest point after that peak | Trough = lowest value after peak |
| 3 | Calculate the drop | Drawdown % = (Peak - Trough) / Peak × 100 |
Example. Peak equity is 10,000. Trough equity falls to 8,500. Drawdown is (10,000 - 8,500) / 10,000 = 15%.
Practical thresholds by style, rule-of-thumb ranges
Use these as filters, not guarantees. Always judge them against trade frequency, leverage, and the equity curve.
- Scalping: equity max drawdown often stays tighter. Rule of thumb, 5% to 15%. Above that, your leverage or stop logic usually runs hot.
- Swing trading: larger stops and longer holds push drawdown higher. Rule of thumb, 10% to 25%. Above that, position sizing often needs work.
- Grid and martingale variants: equity drawdown can stay small until it does not. Rule of thumb, treat anything above 20% as a warning, and 30% to 50%+ as account-threatening in real conditions.
When you see low drawdown on a strategy built on averaging down, assume the sample missed the worst cycle. Use your safety checklist for spotting forex scams and fake gurus if the curve looks too clean for the claimed method.
Risk & Exposure: Leverage, Lot Size, Margin, and Concentration
Leverage and margin level, survivability under volatility spikes
Myfxbook does not always show true broker leverage. It does show the effect of leverage through margin use and position size.
- High margin use means low breathing room. If free margin stays thin, a normal spike can trigger a margin call.
- Watch margin level if available. Higher is safer. If it often sits near broker stop-out territory, the system survives only in calm markets.
- Look for sudden drops in margin level during news days. That signals the strategy runs close to the edge when spreads widen and slippage hits.
- Equity can be stable while margin risk grows. Floating loss plus added positions can hide the real pressure until liquidation.
Position sizing signals, average lot size, lot growth, compounding risk
Lot size tells you how the system scales risk. You care more about lot size relative to balance and equity than the raw number.
- Rising average lot size with a flat deposit history signals compounding. Gains look smooth until a large position meets a fast reversal.
- Step changes in lot size signal a risk regime change. Many accounts behave well at small size, then break when the trader increases lots.
- Lot size that grows during drawdown is a danger sign. It often means the system tries to recover losses by force.
- Check for size consistency. A system that risks a stable fraction of equity shows gradual lot changes, not bursts.
Exposure and concentration, single-pair dependency and correlated baskets
Myfxbook lets you see profit and trades by instrument. Use it to spot concentration.
- Single-pair dependency increases blow-up risk. If most profit comes from one pair, one regime shift can erase months.
- Correlated baskets act like one big position. Long EURUSD plus long GBPUSD plus short USDCHF stacks USD exposure.
- Check trade timing across pairs. Many entries at the same time across correlated pairs means one macro move can hit all positions together.
- Look for hidden concentration in JPY and gold. These often move fast in risk-off spikes and can compress margin quickly.
Risk of ruin intuition, what high leverage plus deep drawdown implies
High leverage makes drawdowns asymmetric. Recovery needs larger and larger returns as equity falls.
If you also see high exposure and thin margin, assume the next volatility spike can end the account. Smooth gains do not offset liquidation risk.
Red flags for martingale and grid, increasing lots, long holds, clustered entries
Myfxbook can reveal averaging and grid behavior even when the equity curve looks clean. Check trade list patterns.
- Increasing lots after losses. If position size rises as price moves against the trade, expect a tail-risk event.
- Clusters of entries at regular price intervals. That points to a grid. It can work until a trend runs through the grid.
- Long holding times on losing trades, short holding times on winners. That often signals loss hiding.
- Many open trades at once with similar direction. That raises margin use and correlation risk.
- Equity curve stays smooth while open drawdown swells. Treat it as a structural risk, not a temporary dip. Use your forex scam and fake guru safety checklist if the account avoids closing losses for long periods.
Trade Quality Metrics: Win Rate, Payoff, Expectancy, and Profit Factor
Why win rate alone is meaningless
Win rate shows how often a strategy wins. It does not show how much it wins when it wins, or how much it loses when it loses.
A high win rate can still lose money if losses are larger than wins. A low win rate can still make money if wins are much larger than losses.
- High win rate, low edge: Many small wins, few large losses. One loss can erase weeks of gains.
- Low win rate, real edge: Many small losses, few large wins. The winners pay for the losers.
On Myfxbook, always read win rate with average win, average loss, and payoff.
Average win, average loss, and payoff ratio
Average win is the mean profit of winning trades. Average loss is the mean loss of losing trades. Payoff ratio compares them.
Use this simple check.
- Payoff ratio = average win divided by average loss (use the absolute value of average loss).
- If payoff is below 1, your winners are smaller than your losers.
- If payoff is above 1, your winners are larger than your losers.
Interpret it with win rate. A strategy with a 70% win rate and a 0.6 payoff often relies on avoiding big losses. A strategy with a 40% win rate and a 1.8 payoff can still have a strong edge.
Also scan trade duration. If winners close fast and losers stay open for long periods, the payoff can look fine until a large loss finally prints. That ties back to loss hiding behavior covered in the prior section. If you see that pattern, use your forex scam safety checklist.
Expected payoff (expectancy) in plain English
Expected payoff tells you what the strategy has made per trade on average. It uses both win rate and win and loss size.
Think of it as your predicted profit per trade if the system keeps behaving the same way.
- Expectancy = (win rate × average win) minus (loss rate × average loss).
- Positive expectancy means you have an edge. Negative expectancy means you do not.
Do not trust expectancy on a small sample. A few trades can distort it. Look for a stable value over a large number of trades, and confirm it matches the equity curve behavior.
Profit factor for comparing strategies with different trade counts
Profit factor is total gross profit divided by total gross loss.
- Profit factor = gross profit divided by gross loss.
- Above 1 means profitable. Below 1 means losing.
Profit factor helps when two accounts have different trade counts. It normalizes results into a simple efficiency number.
Still, treat it as incomplete.
- A high profit factor with low trade count can be noise.
- A high profit factor can hide tail risk if losses stay open and rarely close.
- A moderate profit factor with high trade count can be more reliable.
Largest win, largest loss, and outliers
Largest win and largest loss expose outliers. Outliers often explain the real risk.
- If largest win makes up a big share of total profit, you have a concentration problem. One trade saved the month.
- If largest loss is far bigger than average loss, your stop discipline is weak, or the strategy uses rare blowups.
- If you see repeated small wins and one extreme loss, expect the pattern to repeat.
Match these numbers against drawdown and open trades. If the account shows small closed losses but huge open drawdown, the largest loss may not have happened yet. That is not a safety buffer. It is delayed risk.
Risk-Adjusted Performance: Sharpe, Sortino, Calmar and Friends
Sharpe Ratio, Return Per Unit of Volatility
Sharpe compares your average return to the volatility of those returns. Higher is better. It rewards smooth growth and punishes noisy equity.
On Myfxbook, Sharpe uses the account return series, not your trade logic. It cannot see hidden leverage, wide stops, or margin risk unless it shows up as volatility.
- High Sharpe often means steady position sizing and controlled exposure.
- Low Sharpe often means uneven risk, big swings, or lumpy returns.
- Sharpe can look great in short samples. Treat it as weak evidence before you have enough history.
Use Sharpe with drawdown and open floating loss. Smooth returns with rising open drawdown is not low risk. It is delayed volatility.
Sortino Ratio, Focus on Downside Risk
Sortino looks like Sharpe, but it only counts harmful volatility. It ignores upside swings.
- Use Sortino when the system has occasional strong winning days and many flat days. Sharpe can punish that upside noise.
- Trust Sortino more when you care about protecting capital, not smoothing every bump.
- Be careful if losses hide in open trades. Sortino only sees realized downside in the return series.
If Sortino is high but maximum drawdown is also high, the strategy may avoid frequent small losses and then take one large hit. That pattern will not show up well in a single ratio.
Calmar Ratio, Return Versus Drawdown
Calmar compares return to maximum drawdown. It answers one practical question. How much return did you get for the worst pain you had to sit through.
- Higher Calmar means the system earned more without deep equity damage.
- Lower Calmar means drawdown ate the edge, or leverage did the heavy lifting.
Calmar helps you compare systems with different styles. A slow system with low drawdown can beat a fast system that collapses once a year.
Do not treat Calmar as stable if the account history is short. One new drawdown can cut it in half overnight.
Standard Deviation and Stability
Standard deviation measures how spread out the returns are. Low spread often means a smoother curve. High spread often means fragile performance.
- Low standard deviation fits steady execution and consistent risk per trade.
- High standard deviation fits variable lot sizing, news spikes, martingale behavior, or holding losers too long.
Match stability metrics against trade count and time in market. A system can look stable with few trades. A system can also look stable if it holds losers open and books small wins.
How Risk-Adjusted Metrics Get Gamed
These metrics depend on the return series. You can improve the ratios without reducing real risk.
- Return smoothing by holding losses open. You book small gains and delay the loss. Volatility looks low until the exit.
- Position averaging that reduces short-term swings but builds tail risk. Ratios look fine until the blowup.
- Short history that hides full cycles. One clean quarter can inflate Sharpe, Sortino, and Calmar.
- Selective exposure by avoiding trading during known high-risk periods in the sample, then changing behavior later.
Protect yourself with cross-checks. Compare ratios to maximum drawdown, average trade duration, and open floating loss. If the ratios look strong but exposure looks hidden, treat the track record as marketing. Use the same mindset you use when you spot forex scams and unregulated brokers.
Trading Behavior Insights: Duration, Frequency, and Timing
Average trade duration, match it to the style
Myfxbook shows average trade duration and sometimes the longest and shortest holds. Use it to verify the strategy type.
- Scalping profiles usually show minutes, sometimes seconds. You should also see high trade counts and tight average win and loss sizes.
- Day trading profiles often show minutes to hours. Expect fewer trades and more sensitivity to spread and execution.
- Swing profiles tend to show hours to days. You should see wider stops, larger average trade ranges, and more exposure to gaps.
Watch for mismatches. A “scalper” with multi-day average duration often hides drawdown through long holds. A “swing trader” with a 3 minute average often depends on perfect fills that many accounts cannot replicate.
Trades per week or month, reliability vs noise
Trade frequency tells you how much data you really have.
- Too few trades makes the stats fragile. A high win rate and low drawdown can come from luck, not edge.
- Too many trades can signal overtrading. It can also inflate costs through spread, commission, and slippage.
- Look for time coverage. A solid record spans different market regimes, not one clean month.
Cross-check frequency with average duration. If trades last hours but the account logs hundreds per week, something does not add up. If trades last minutes but there are only a few per month, you cannot judge execution risk.
Best and worst trading hours, session dependency and slippage
Many Myfxbook pages show performance by hour. Use it to find dependency on one session.
- Concentrated profits in one narrow time window can mean the strategy needs specific liquidity conditions.
- Loss clusters around news times often point to spread spikes and slippage, even if the backtest looks fine.
- Quiet hours profits can signal a spread-sensitive approach. Your broker and account type will change the outcome.
If most gains come during low-liquidity hours, treat the results as execution-dependent. Small differences in spread and fill quality can flip the edge.
Holding over weekends and major news, gap risk shows up late
Myfxbook may not label weekend holds directly, but duration patterns and big single-trade losses often reveal them.
- Weekend holds add gap risk. Price can reopen far from your stop. Drawdown can jump without warning.
- News holds raise slippage risk. Stops can fail at the intended level during fast markets.
- Check large outliers. One or two extreme losses often come from gaps, not normal trading.
If you see smooth equity most of the time and then sudden deep drops, you are looking at tail risk. That risk does not average out when you increase size.
Consistency vs bursts, spot lucky streak equity curves
Use the equity curve and monthly breakdown to separate repeatable performance from a single run.
- Consistent profiles show similar monthly returns, controlled drawdowns, and no dependence on one week.
- Burst profiles show most gains in a short period, then flat or choppy results. This often matches one market condition.
- Recovery behavior matters. Fast recoveries can come from increased risk after losses, not skill.
When you see performance concentrated in a short streak, assume regression. Use the same caution you use when you spot marketing patterns in forex scam checklists.
Instrument & Strategy Breakdown: What the System Actually Trades
Profit/loss by instrument, find the real driver
Open the system page, then check Profit and the Trading tab breakdowns. You want the instrument table. Sort by net profit. Then sort by worst loss.
- One-pair dependency: If one symbol produces most profit, you are not buying a strategy. You are buying exposure to that market.
- Incidental winners: Some pairs show small profit because the system rarely trades them, or because the sample is thin. Ignore any instrument with few trades.
- Hidden blowups: A pair can look profitable but carry the biggest losing trade or the longest recovery. Check max loss and average loss per instrument, not just net profit.
- Time alignment: Compare the profit by instrument to the equity curve dates. If the equity jump matches one pair’s hot streak, treat it as a regime win.
Correlation and portfolio concentration, many pairs can be one bet
Multiple symbols do not mean diversification. Many FX pairs share the same base drivers. Risk clusters around USD, JPY, and EUR flows.
- USD cluster: EURUSD, GBPUSD, AUDUSD, NZDUSD often move together in risk-on and risk-off phases.
- JPY cluster: USDJPY, EURJPY, GBPJPY often express the same carry and volatility profile.
- Gold and risk FX: XAUUSD can correlate with USD shifts and risk sentiment, so it can stack risk instead of spreading it.
- Check position overlap: If the trade history shows many open trades at once across similar pairs, you face one macro bet with multiple tickets.
Concentration shows up as synchronized drawdowns across symbols. You see it when several pairs lose in the same hours or days.
Long vs short bias, spot the directional exposure
Go to the long and short stats if available, or scan the trade history export. Count how often the system buys versus sells on the main symbols.
- Net long bias: The system may earn in rising markets and stall or crash in falling phases.
- Net short bias: Short-heavy systems can look smooth until a trend runs hard and gaps through stops.
- Martingale disguise: A strategy can look “balanced” by flipping direction, but still add size into losses. Check if losing sequences show increasing lot size.
- Event risk: Directional bias magnifies around CPI, NFP, and central bank days. Look for oversized losses on those timestamps.
Swap and commission impact, costs can be the edge killer
Costs sit under the curve. They matter most for slow strategies, high turnover, and trades held overnight.
- Swap drag: If the system holds positions for days, swap can turn a small edge negative. This hits harder when the strategy leans into negative carry.
- Commission load: High-frequency systems can show strong gross profit but weak net profit after fees. You need net results, not theoretical fills.
- Broker dependency: A system that works on one broker’s swap and commission schedule may fail on yours. Compare your broker’s costs before you copy.
- Swap-free accounts: “Islamic” pricing often replaces swap with other fees or wider spreads. Do not assume it removes cost.
If you plan to run the same approach in the US, confirm how your trading structure and reporting work, then review Section 988 vs 1256 tax treatment before you scale.
Slippage sensitivity, why live results diverge
Myfxbook can show strong results even when execution quality does most of the work. Slippage turns small wins into losses.
- Scalping risk: Short holding times and tight targets mean a 0.5 to 2 pip slip can erase expectancy.
- News exposure: If many trades open or close near high-impact releases, expect worse fills than the backtest or demo.
- Stop and limit behavior: Stop orders slip more in fast markets. Limit orders miss fills. Both change the win rate and average win.
- Server and liquidity: VPS location, broker routing, and symbol liquidity decide your real fill quality. Myfxbook cannot normalize this across accounts.
When a system needs perfect fills to stay profitable, treat the Myfxbook curve as fragile. You want room for execution error.
Advanced Statistics and Red-Flag Detection Checklist
Short track record plus high gain, the classic risk trap
Fast growth on a short history often means one thing, your risk stayed hidden. Use these checks.
- Track record length: Under 3 months is noise. Under 12 months is unproven.
- Gain versus max drawdown: If gain looks great but drawdown already sits near 30 to 50 percent, the account runs close to the edge.
- Lots and exposure growth: Check “Lots” and position size over time. If size ramps up as equity grows, you see compounding risk, not compounding skill.
- Profit factor versus drawdown: A high profit factor with high drawdown often comes from a few big wins and many stress trades.
- Deposit and withdrawal timing: Big deposits before a run can inflate the curve. Big withdrawals after a run can hide risk taken to reach that point.
High win rate plus huge max loss, spotting negative skew strategies
Many accounts “win” often and blow up rarely. Myfxbook shows this if you know where to look.
- Win rate above 80 percent: Treat it as a warning until you check the loss tail.
- Average win versus average loss: If average loss is several times larger than average win, the strategy sells insurance.
- Largest loss trade: If the max loss wipes weeks or months of gains, you face negative skew.
- Risk of ruin signs: Look for long streaks of small wins, then one deep equity drop. That pattern matches grid, martingale, and mean reversion with no hard stop.
- Trade duration: Many short winners plus a few very long losers often signals “hold and hope.”
Equity and balance divergence patterns, floating loss concealment signals
Balance shows closed trades. Equity shows closed plus open. The gap matters.
- Frequent large equity dips with flat balance: You see floating drawdown. The account carries big open risk.
- Equity stays far below balance for long periods: Positions sit underwater and wait for a reversal.
- Sharp equity recoveries without matching balance drops: The account likely averaged down and escaped, the risk stayed real even if it did not print on balance.
- Check “Open Trades” and exposure: A system that often holds many open trades at once can mask risk until the market trends.
Step-like equity curve, copy trading latency, account interventions, or low transparency
Clean steps can happen. They also show process risk.
- Profits appear in blocks: This can come from trade copier delays, manual batch closing, or reporting gaps.
- Flat equity for long stretches, then jumps: Check if the system trades rarely, or if it hides trades during the flat period.
- Sudden step down: That can signal a forced liquidation, a margin event, or an intervention.
- Verify “Track Record Verified” and “Trading Privileges Verified”: If either fails, treat the curve as a marketing chart.
“Too smooth” returns, detecting potential data issues or controlled reporting
Real trading looks uneven. Smooth curves need extra scrutiny.
- Very low drawdown with steady monthly gains: Check if the account uses unrealized loss hiding, external hedging, or selective reporting.
- Missing bad months: Scan the monthly table. A long run of green months with no red often means the risk sits in open trades or the history starts after a reset.
- History resets: Look for balance jumps, big deposits, or broker changes that split the story into “before” and “after.”
- Abnormal slippage assumptions: If the strategy depends on tight fills, smooth results can collapse under real execution.
- Trust but verify: If anything feels off, use a broader safety process like this trader safety checklist.
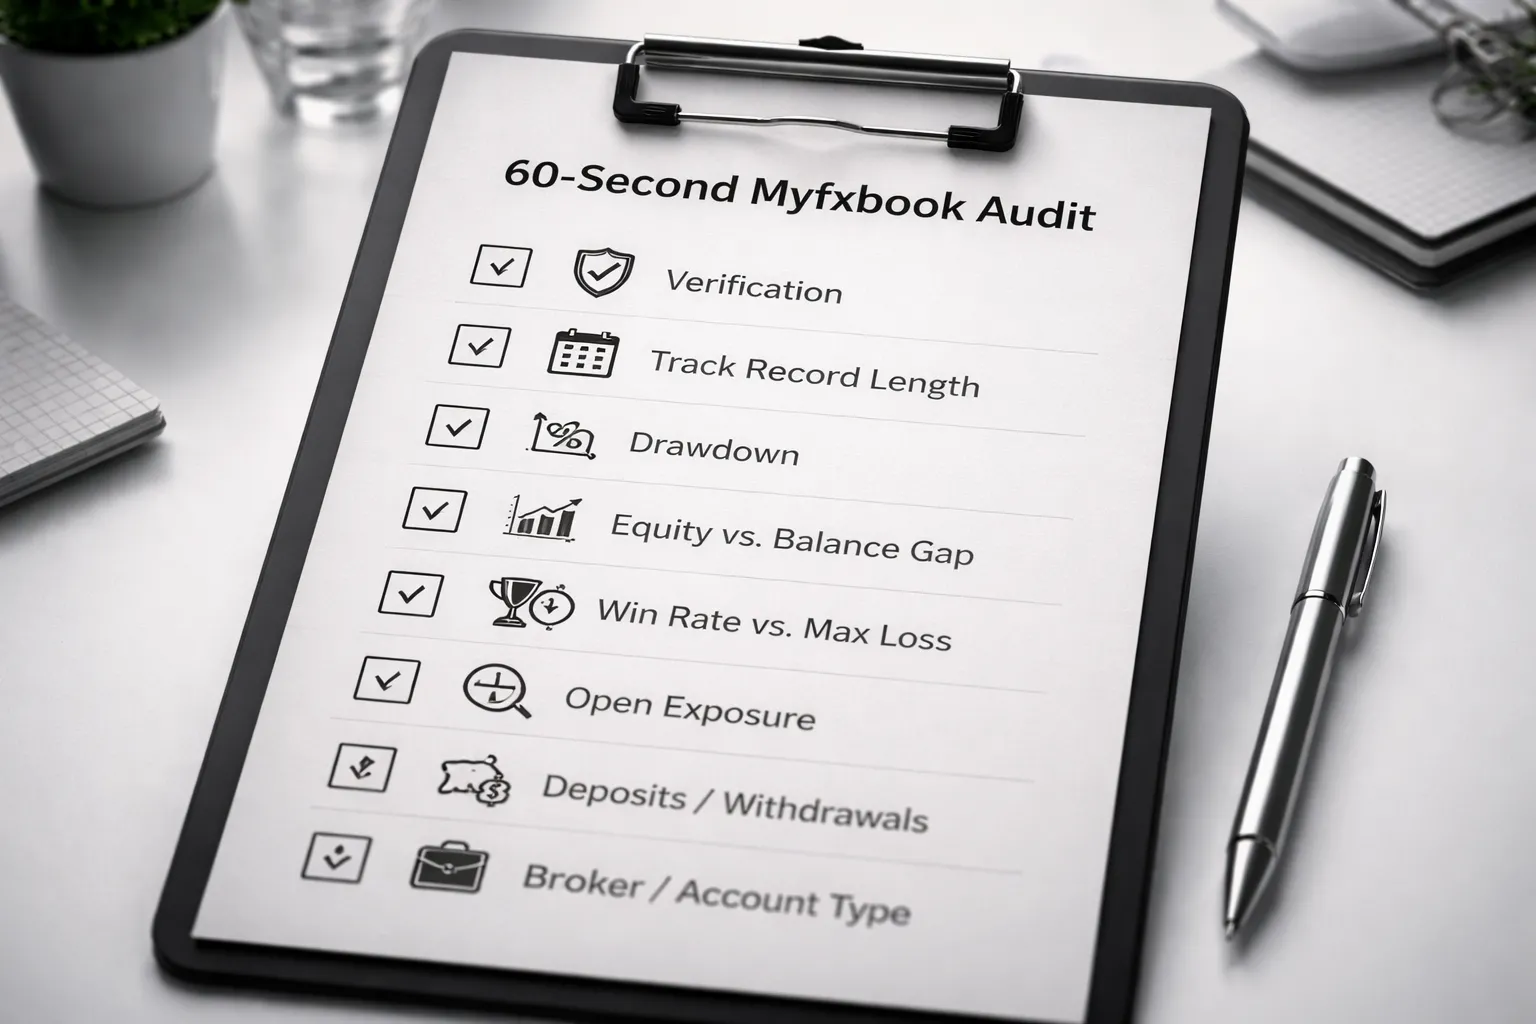
A quick 60-second audit, the must-check fields before trusting a Myfxbook link
How to Compare Two Myfxbook Accounts Fairly (A Practical Framework)

Normalize by time (different start dates)
Start with the same time window. Pick the overlapping period where both accounts traded live. Avoid comparing a 6 month track record to a 4 year one.
- Use overlapping dates: Compare only the months both accounts share.
- Convert results to monthly stats: Average monthly gain, median monthly gain, best month, worst month.
- Count trading months: An account with 3 strong months can look better than one with 24 mixed months.
- Watch for cashflow distortion: Large deposits can flatten drawdown percent. Large withdrawals can hide risk by shrinking position size.
If the overlap is short, treat the comparison as weak. Give more weight to risk and consistency than total gain.
Normalize by risk (drawdown, leverage, exposure side-by-side)
Compare return and pain in the same frame. Use drawdown, exposure, and position sizing, not gain alone.
| Metric | Account A | Account B | What you look for |
|---|---|---|---|
| Max drawdown | Lower is better. Check if it came from one event or constant bleed. | ||
| Average monthly drawdown | Shows day to day stress. Helps spot steady overrisking. | ||
| Return over drawdown | Gain means less if it required deep drawdown. | ||
| Leverage used | High leverage can inflate gains and hide fragility. | ||
| Exposure | Many open trades, large lots, or heavy symbol concentration raise tail risk. |
- Read drawdown with context: A 15% drawdown with tight exposure can beat a 10% drawdown created by a grid that never closed.
- Check concentration: If most profit comes from one pair, you compare a strategy to a market phase, not to another trader.
- Check trade duration: Long-held losers often signal averaging down. That changes your risk profile.
Consistency scoring (monthly hit rate, worst-month focus)
Build a simple scorecard. It keeps you honest when one curve looks smoother.
- Monthly hit rate: Profitable months divided by total months traded.
- Worst month: The largest monthly loss.
- Median month: More useful than average when one month spikes.
- Longest losing streak: Helps you judge psychological and capital endurance.
When two accounts show similar gain, prefer the one with a better worst month and fewer deep losing streaks. It usually holds up better when conditions shift.
Robustness signals (market regimes, volatility periods)
Look for performance across different conditions. You want proof the edge does not depend on one market mood.
- Trend vs range: Check if results collapse when the market stops trending.
- High volatility weeks: Spreads widen and slippage rises. Fragile systems break here.
- News exposure: If the account holds through major releases, expect gap risk and stop misses.
- Recovery spikes: Fast V-shape recoveries can signal martingale, grid, or leverage ramping.
Use the history tab to spot clusters. One big month can come from one event, one instrument, or one risk shift.
Decision templates (investors vs self-traders)
Pick a template that matches your goal. Use it to rank accounts the same way every time.
- If you invest in someone else: Prioritize verified real account, low to moderate drawdown, stable monthly hit rate, controlled exposure, clean deposit and withdrawal story. Add broker trust checks and basic regulatory sanity. Use this checklist to reduce fraud risk: safety checklist.
- If you copy trade: Prioritize trade frequency you can replicate, slippage tolerance, average trade duration that fits your broker, and a strategy that does not depend on perfect fills.
- If you trade your own account: Prioritize worst month, losing streak length, and margin usage. You need a system you can execute without changing risk after a drawdown.
End with one rule. You compare accounts on the same window, with the same risk lens, and with the same consistency tests. If you cannot do that, you cannot call it a fair comparison.
Common Myfxbook Misinterpretations (and How to Avoid Them)
Confusing balance with equity, why it changes the story
Balance shows closed trades only. Equity includes open profit and loss.
If equity swings far below balance, you have hidden drawdown. Myfxbook can look stable on balance while the account holds deep floating losses.
- What to check: the equity curve, not just the balance curve.
- Red flag: long flat balance periods with sharp equity drops.
- How to avoid it: judge risk on worst equity drawdown, not balance drawdown.
Assuming past performance implies future performance, regime change risk
Myfxbook reports what happened in one market regime. Your next months can trade a different regime.
Breakouts fail in ranges. Mean reversion fails in trends. Carry works until rates shift. News volatility can double.
- What to check: performance by month, worst month, and longest losing streak.
- Red flag: one perfect period drives the whole gain, the rest looks average.
- How to avoid it: compare accounts on the same dates, then stress your expectations using the worst cluster of months.
Ignoring costs, spreads, swaps, and commissions over long horizons
Costs decide if an edge survives.
A system can look strong on gross pips and weak after real trading costs. This hits hardest with high frequency trading, small targets, and long hold times with negative swap.
- What to check: average trade size versus average spread, commission per lot, and swap totals.
- Red flag: many trades with small average win, large trade count, and thin margin for error.
- How to avoid it: treat low average win per trade as fragile unless the account shows the same results across brokers and time windows.
Overvaluing a single metric, why you need a metric stack
One number can always look good. Gain can hide risk. Low drawdown can hide low sample size. High win rate can hide rare large losses.
Use a stack. You want return, risk, and consistency to agree.
- Return: gain over a fixed window.
- Risk: max equity drawdown, margin usage, worst month.
- Consistency: monthly distribution, losing streak length, average trade duration.
- Trade quality: profit factor, average win versus average loss, expectancy.
If one metric looks great and the others look weak, assume the great one misleads you. If you need a broader checklist for spotting manipulated track records, use this forex scam safety checklist.
Not accounting for capital additions and removals, the performance illusion
Deposits and withdrawals can distort the curve.
A deposit during a drawdown can shrink drawdown percent without fixing the strategy. A withdrawal after a good run can make returns look smoother than they were.
- What to check: the account history for deposits, withdrawals, and balance adjustments.
- Red flag: drawdown drops right after a deposit, or equity stabilizes only after fresh capital.
- How to avoid it: evaluate performance between cashflow events. Compare periods with stable account size.
FAQ: How to Read Myfxbook Results Metrics Explained
Why do Myfxbook gain and absolute gain differ?
Gain measures return since the first trade. Absolute gain measures return since the first deposit. If the account gets deposits after trading starts, gain can look higher than absolute gain. Check the deposit timeline before you compare accounts.
Which drawdown should you trust, balance or equity?
Use equity drawdown for risk. Equity includes floating losses. Balance drawdown ignores open risk until trades close. A strategy can show low balance drawdown and still carry large equity drawdown. If equity drawdown spikes, the account takes hidden risk.
What is a “good” drawdown level on Myfxbook?
Match drawdown to your risk tolerance and time frame. For most investors, steady returns with lower drawdown beats high gain with deep drops. Compare drawdown to average monthly gain. If one bad month can erase many good months, risk is too high.
How do deposits and withdrawals distort Myfxbook stats?
Deposits can reduce drawdown and improve recovery. Withdrawals can make the equity curve look smoother. Always review the full history. Judge performance between cashflow events. If drawdown falls right after deposits, treat the track record as unreliable.
What does “risk of ruin” mean on Myfxbook?
Risk of ruin estimates the chance your account hits a ruin threshold based on past returns and volatility. It assumes the future behaves like the past. Use it as a warning. High risk of ruin means the strategy can fail even after strong gains.
How should you read the Sharpe ratio?
Sharpe measures return per unit of volatility. Higher is better. It can look strong in short samples or during one market regime. Check the track record length and consistency. A high Sharpe with high drawdown often signals uneven risk.
What does profit factor tell you?
Profit factor equals gross profit divided by gross loss. Above 1 means the system makes money. The higher it is, the more edge the strategy shows. Still, profit factor ignores drawdown and position sizing. Pair it with equity drawdown and average loss.
Why can a high win rate still be a bad sign?
High win rate can come from small wins and rare large losses. That pattern often appears in martingale or grid systems. Check average win versus average loss. If losses dwarf wins, one streak can wipe out months of gains.
What is expectancy, and why does it matter?
Expectancy estimates average profit per trade after wins and losses. It combines win rate and payoff. Positive expectancy supports long term growth. Negative expectancy means the strategy relies on luck or increasing risk. Use it with trade count and drawdown.
What does “lots” and exposure reveal?
Lots show position size. Exposure shows how much capital sits at risk. Fast lot growth often signals compounding or risk creep. Compare lot size to account balance over time. If lots rise faster than balance, the trader may chase returns with leverage.
How do you spot a martingale or grid system in Myfxbook?
Look for many entries in the same direction, increasing lot sizes, and long holding during drawdowns. Check “largest trade,” “average loss,” and equity drawdown spikes. If recovery depends on a rebound, the strategy can fail during trends.
Does track record length matter more than gain?
Yes. A short track record can hide tail risk. Prefer accounts that cover different market regimes and enough trades. Look for stable monthly returns, controlled equity drawdown, and consistent position sizing. Verify the account type and broker quality to reduce fraud risk.
What does “verified” mean on Myfxbook?
Trading privileges verified means Myfxbook can confirm the account can trade. Track record verified means Myfxbook can confirm the history source. Verified does not prove skill or low risk. Still check broker regulation and scam signs in this safety checklist.
Conclusion
Myfxbook can help you judge performance fast, if you read the numbers in the right order. Start with drawdown and equity curve, then check gain, monthly returns, and trade sample size. Confirm the risk story with lot sizing, exposure, and worst day and worst month. Treat high gain with high drawdown as a warning, not proof.
Your final step is a simple rule. Only compare accounts on the same footing. Same time span, same leverage, same deposit scale, same strategy style. Then filter out anything that fails basic trust checks, including unverified history, broker red flags, and missing real money proof. Use this forex scam safety checklist before you follow, copy, or fund any trader.
- Risk first: max drawdown, consecutive losses, worst day and month.
- Then returns: gain, average monthly return, consistency across months.
- Then quality: trade count, time in market, profit factor, expectancy.
- Then trust: verification status, broker, account type, funding proof.
-
Is Forex Trading Legal in the United States? Rules, Regulators & What to Know
7 months ago -
Forex Taxes in the US: Section 988 vs 1256 (Complete Guide)
7 months ago -
Is Forex Trading Halal? Islamic Finance Rules Explained
7 months ago -
How to Spot Forex Scams and Unregulated Brokers (Safety Checklist)
7 months ago
-
- Balance drawdown vs equity drawdown, which one signals real risk
- Maximum drawdown vs average drawdown, what each implies about stability
- Drawdown duration and time-to-recover, assessing psychological and capital strain
- Peak-to-trough math made simple, how drawdown is calculated
- Practical thresholds by style, rule-of-thumb ranges
-
- Leverage and margin level, survivability under volatility spikes
- Position sizing signals, average lot size, lot growth, compounding risk
- Exposure and concentration, single-pair dependency and correlated baskets
- Risk of ruin intuition, what high leverage plus deep drawdown implies
- Red flags for martingale and grid, increasing lots, long holds, clustered entries
-
- Short track record plus high gain, the classic risk trap
- High win rate plus huge max loss, spotting negative skew strategies
- Equity and balance divergence patterns, floating loss concealment signals
- Step-like equity curve, copy trading latency, account interventions, or low transparency
- “Too smooth” returns, detecting potential data issues or controlled reporting
- A quick 60-second audit, the must-check fields before trusting a Myfxbook link
-
- Confusing balance with equity, why it changes the story
- Assuming past performance implies future performance, regime change risk
- Ignoring costs, spreads, swaps, and commissions over long horizons
- Overvaluing a single metric, why you need a metric stack
- Not accounting for capital additions and removals, the performance illusion
-
- Why do Myfxbook gain and absolute gain differ?
- Which drawdown should you trust, balance or equity?
- What is a “good” drawdown level on Myfxbook?
- How do deposits and withdrawals distort Myfxbook stats?
- What does “risk of ruin” mean on Myfxbook?
- How should you read the Sharpe ratio?
- What does profit factor tell you?
- Why can a high win rate still be a bad sign?
- What is expectancy, and why does it matter?
- What does “lots” and exposure reveal?
- How do you spot a martingale or grid system in Myfxbook?
- Does track record length matter more than gain?
- What does “verified” mean on Myfxbook?
-
-
- Balance drawdown vs equity drawdown, which one signals real risk
- Maximum drawdown vs average drawdown, what each implies about stability
- Drawdown duration and time-to-recover, assessing psychological and capital strain
- Peak-to-trough math made simple, how drawdown is calculated
- Practical thresholds by style, rule-of-thumb ranges
-
- Leverage and margin level, survivability under volatility spikes
- Position sizing signals, average lot size, lot growth, compounding risk
- Exposure and concentration, single-pair dependency and correlated baskets
- Risk of ruin intuition, what high leverage plus deep drawdown implies
- Red flags for martingale and grid, increasing lots, long holds, clustered entries
-
- Short track record plus high gain, the classic risk trap
- High win rate plus huge max loss, spotting negative skew strategies
- Equity and balance divergence patterns, floating loss concealment signals
- Step-like equity curve, copy trading latency, account interventions, or low transparency
- “Too smooth” returns, detecting potential data issues or controlled reporting
- A quick 60-second audit, the must-check fields before trusting a Myfxbook link
-
- Confusing balance with equity, why it changes the story
- Assuming past performance implies future performance, regime change risk
- Ignoring costs, spreads, swaps, and commissions over long horizons
- Overvaluing a single metric, why you need a metric stack
- Not accounting for capital additions and removals, the performance illusion
-
- Why do Myfxbook gain and absolute gain differ?
- Which drawdown should you trust, balance or equity?
- What is a “good” drawdown level on Myfxbook?
- How do deposits and withdrawals distort Myfxbook stats?
- What does “risk of ruin” mean on Myfxbook?
- How should you read the Sharpe ratio?
- What does profit factor tell you?
- Why can a high win rate still be a bad sign?
- What is expectancy, and why does it matter?
- What does “lots” and exposure reveal?
- How do you spot a martingale or grid system in Myfxbook?
- Does track record length matter more than gain?
- What does “verified” mean on Myfxbook?
-
-
How to Place a Forex Trade Step by Step (Your First Trade Explained)
5 months ago -
Forex Trading vs Crypto Trading: Which Market Is Better for Beginners?
5 months ago -
Forex Lot Size Calculator: How to Use It to Size Trades Correctly
7 months ago -
How to Calculate Position Size in Forex (Position Sizing Formula + Examples)
7 months ago -
Forex Leverage Explained: How It Works, Pros, Cons & Examples
7 months ago
-
Forex Trading Platforms Comparison: MetaTrader vs cTrader vs TradingView
7 months ago -
Stop Loss vs Take Profit: Differences, Examples & Best Practices
7 months ago -
Is Forex Trading Legal in the United States? Rules, Regulators & What to Know
7 months ago -
Forex Leverage Explained: How It Works, Pros, Cons & Examples
7 months ago -
Forex Market Hours & Trading Sessions Explained (Best Times to Trade)
7 months ago