How to Journal Forex Trades (What to Track + Free Template Ideas)

Your trading results come from your decisions. A forex journal shows you what you did, why you did it, and what it cost you.
This guide explains how to journal forex trades in a way you can use. You will learn what to track on every trade, which metrics matter, and how to review your data without guesswork.
- Core trade details, entry, exit, size, and risk
- Setup tags, market conditions, and execution notes
- Performance metrics like R-multiple, win rate, and drawdown
- Mistake tracking and rules to test
- Free template ideas for Google Sheets, Excel, and Notion
You will also see how position size ties into clean journal data. Use our forex lot size calculator to record size and risk in a consistent format.
Key Takeaways
- In het kort: Log every trade the same way. Consistency beats detail.
- In het kort: Track the basics, instrument, date, session, direction, entry, stop, target, exit, lot size, and result.
- In het kort: Record your risk in numbers, account size, risk percent, stop in pips, and R-multiple.
- In het kort: Tag the setup and market context, trend, volatility, news, and session type.
- In het kort: Write execution notes, order type, spread, slippage, missed entries, and rule breaks.
- In het kort: Track performance metrics you can act on, win rate, average R, expectancy, and max drawdown.
- In het kort: Log mistakes as categories. Review them weekly. Turn them into rules to test.
- In het kort: Use one template, Sheets, Excel, or Notion. Keep the fields fixed. Add columns only when you need them.
- In het kort: Tie position size to journal accuracy. Use a forex lot size calculator so size and risk stay consistent.
What a Forex Trading Journal Is (and Why It Improves Results)
What a Forex Trading Journal Is
A forex trading journal is a system you use to record each trade, then review the data to improve your decisions.
It is not a diary. It is not a place to vent. It is a feedback loop.
The Real Purpose, Process Improvement
Your goal is simple, trade better next week than you traded this week.
A journal does that by making your process visible. You stop guessing. You stop relying on memory.
- It shows what you do most. Your most common setup, session, pair, and mistake.
- It shows what pays. Your best conditions, your worst conditions, your real edge.
- It shows what to change. One rule, one filter, one sizing tweak, one behavior to cut.
How Journaling Improves Discipline, Risk Control, and Strategy Validation
Discipline improves when you know you must explain every trade in writing. You take fewer impulsive entries because you have to label them.
Risk control improves when you track planned risk versus actual risk. Most traders think they risk 1%. The journal shows the truth, especially after spreads, slippage, partials, and moving stops.
Strategy validation improves when you separate process from outcome.
- Process: setup valid, entry followed rules, stop placed correctly, size correct.
- Outcome: win or loss.
This matters because you can do a good trade that loses, and a bad trade that wins. Without a journal, those get mixed. Your rules get worse over time.
Use fixed position sizing rules and log the exact lot size, risk in pips, and risk in account percent. If you need help keeping size consistent, use a forex lot size calculator so your journal data stays clean.
Why Traders Fail Without a Journal
- Bias: you remember the wins, you explain away the losses, you protect your ego.
- Selective memory: you “felt” you followed your plan, but you cannot prove it.
- Overtrading: you take too many trades because nothing tracks frequency, time of day, or trigger quality.
- Random changes: you change rules after a small streak because you have no sample size.
- False confidence: a good month hides a weak process, then the next month takes it back.
What Good Looks Like, A Journal That Produces Decisions
A good journal does not collect more fields. It produces clear actions.
- You can name your top 3 mistake categories. You know their cost in R.
- You can list your best conditions. Pair, session, setup type, market state.
- You can set one change for next week. A rule you can follow and measure.
- You can prove the change worked. Before and after metrics over a defined sample.
If your journal cannot produce one decision you can act on, it is logging, not improving.
How to Journal Forex Trades: Step-by-Step Workflow
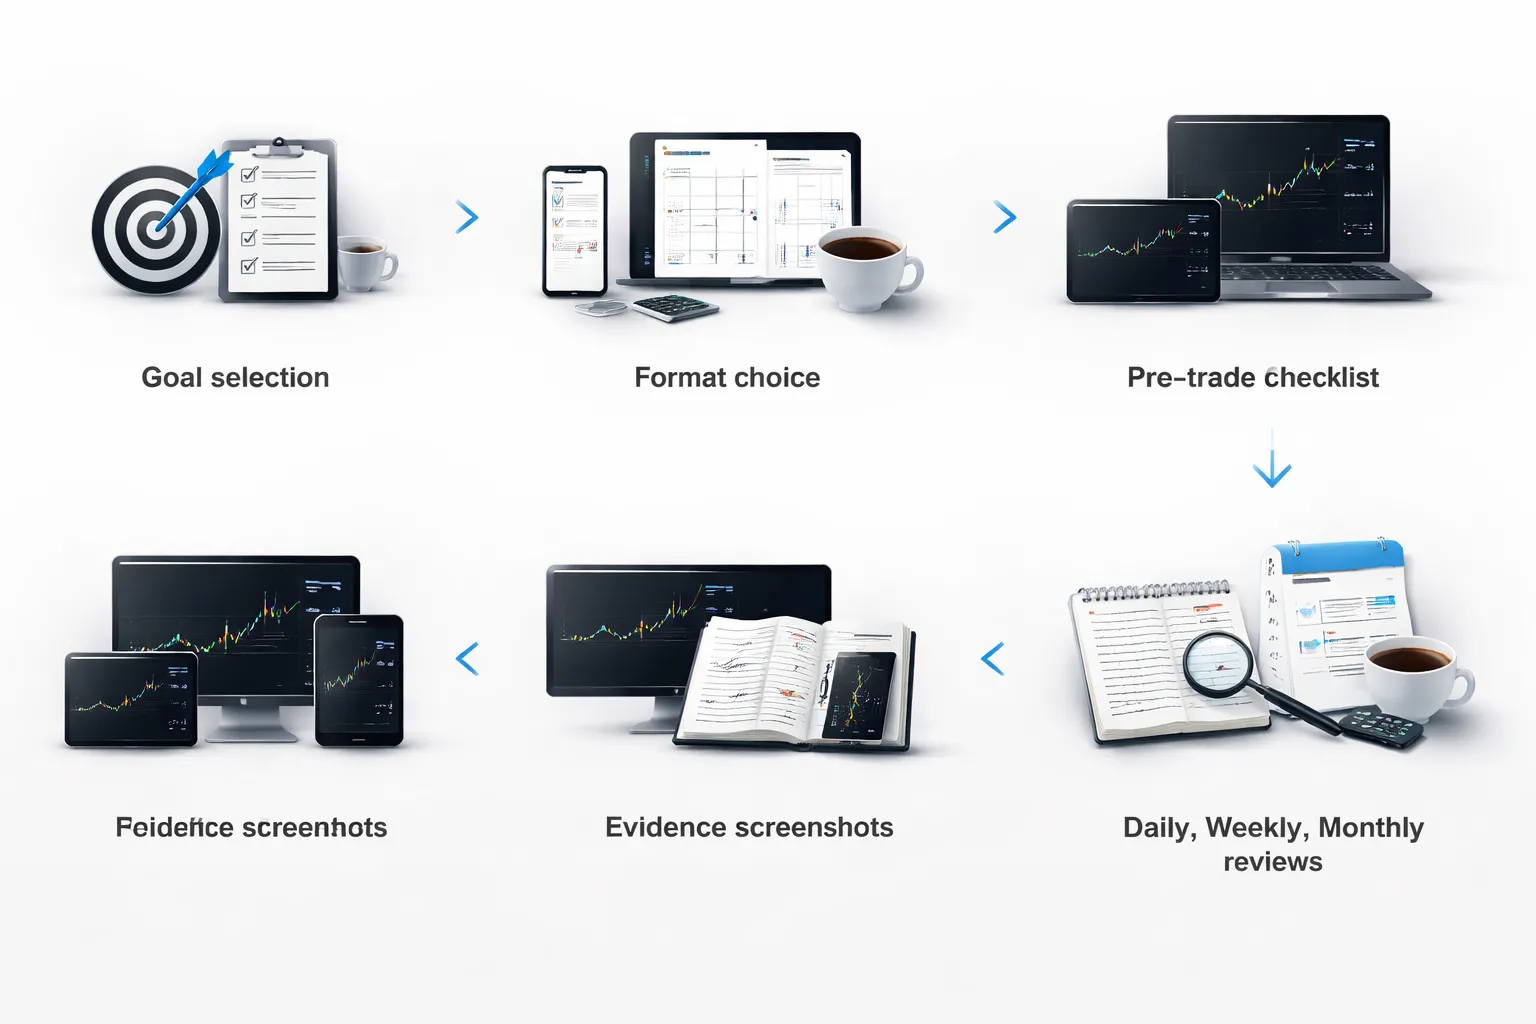
Set your goal first
Your journal needs a target. Pick one. Keep it measurable. Keep it time-boxed.
- Reduce mistakes: choose 1 to 3 mistake tags. Example, early entry, moved stop, revenge trade. Track frequency and R cost.
- Validate a setup: define one setup in one market. Example, London pullback in EURUSD. Track win rate, average R, and sample size.
- Improve risk-adjusted returns: track expectancy and drawdown. Keep risk per trade fixed. Compare periods with the same rules.
Choose a journaling format
Use the format you will fill in every trade. Speed matters. Consistency matters more.
- Spreadsheet: best for custom fields and filters. Fast reviews. Easy charts.
- App: best for automation, stats, and syncing screenshots. Less control over fields.
- Hybrid: app for imports and stats, spreadsheet for rules, tags, and review notes.
If you need help picking software, use forex trading journal tools as a shortlist and match it to your workflow.
Create a pre-trade checklist entry
Write the plan before you enter. Do it even if you skip the trade. This is where you stop impulse trades.
- Setup tag: one label. No vague names.
- Market state: trend, range, breakout, mean reversion. Pick one.
- Session: Asia, London, New York. Add overlap if it matters.
- Entry trigger: the exact condition that flips you from waiting to executing.
- Invalidation: where the idea dies. This becomes your stop logic.
- Planned stop and target: price, pips, and R multiple.
- Position size: lot size, risk in account currency, risk in R. Use your max risk per trade rule. Calculate it with a lot sizing tool if needed.
- Reason to skip: one condition that cancels the trade. Example, news in 10 minutes.
Log the trade immediately after execution
Log right after entry and right after exit. You want facts, not memory.
- Instrument and direction: pair, long or short.
- Date and time: include your platform time zone.
- Entry, stop, target: planned and actual. Record slippage and spread impact if visible.
- Order type: market, limit, stop. Add partial fills if you get them.
- Risk: planned R, actual R. Keep R as your main outcome unit.
- Execution notes: one line. Example, entered late due to hesitation.
Attach evidence
Evidence makes reviews clean. Without it, you argue with yourself later.
- Before screenshot: chart at entry. Show the trigger candle and context.
- After screenshot: chart at exit. Mark where you exited and why.
- Annotations: entry, stop, target, key levels, session high and low, structure points.
- Key events: news release, session open, liquidity sweep. Write the time.
Write a short post-trade debrief
Keep it short. Focus on expectation versus reality. Separate process from outcome.
- What you expected: one sentence. Example, break and retest then continuation to prior high.
- What happened: one sentence. Example, retest failed, price flipped and trended down.
- Did you follow rules: yes or no. If no, name the rule you broke.
- One improvement: one action for next time. Example, wait for candle close at level.
- Mistake tags: add tags only when you can define them. Do not tag emotions without a behavior.
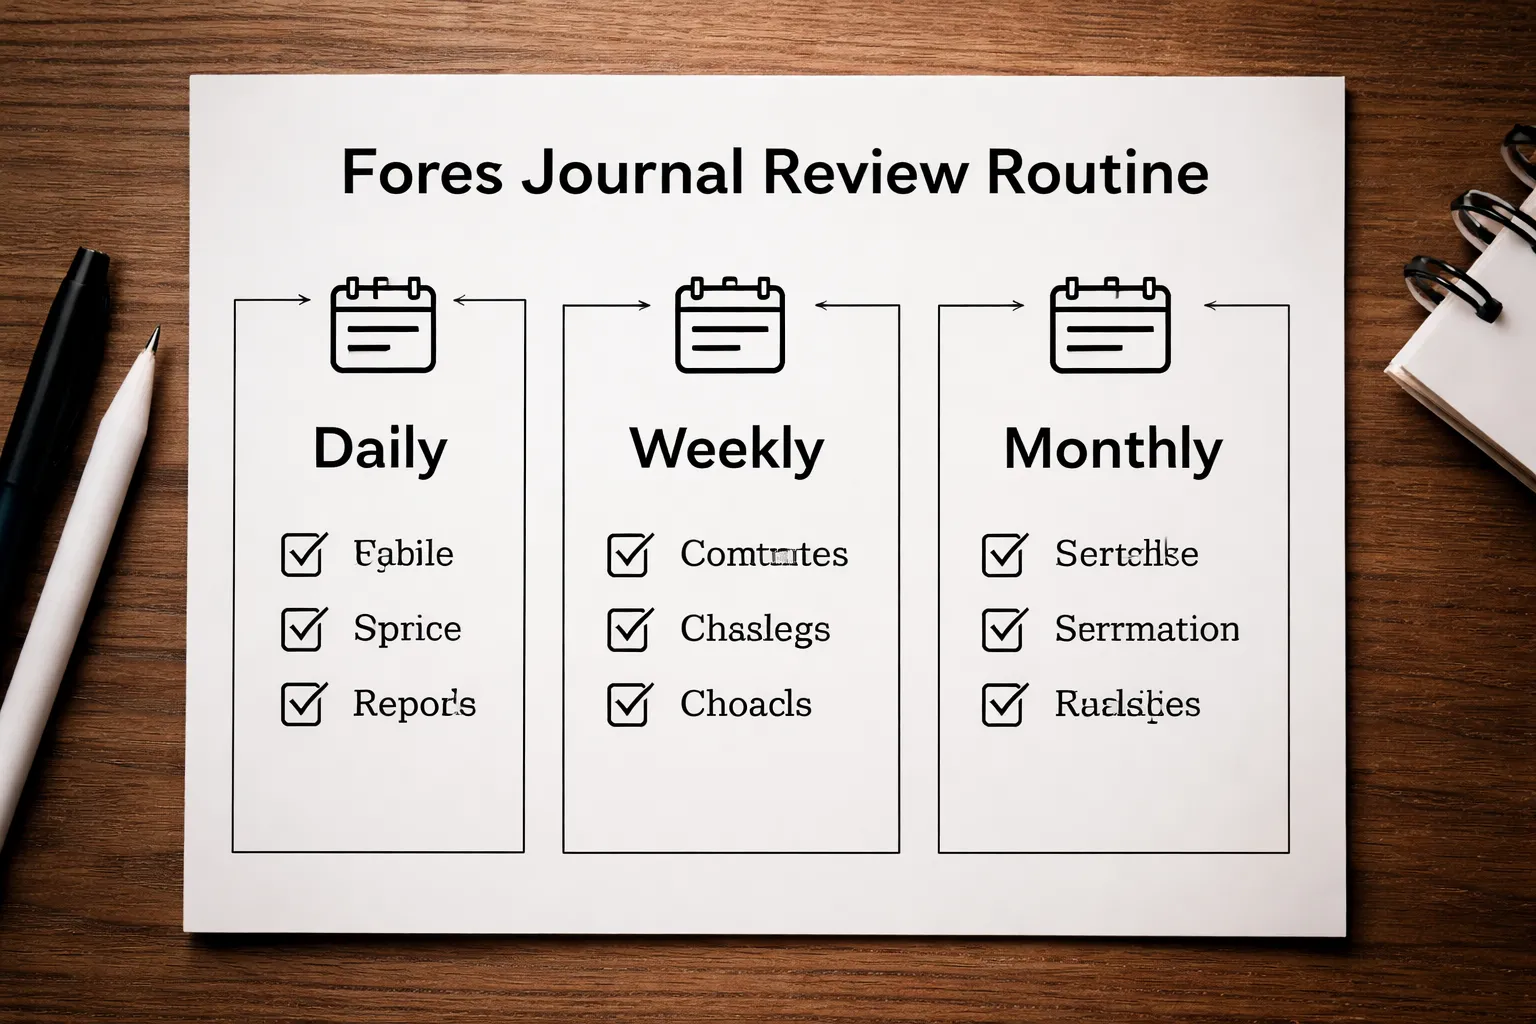
Schedule structured reviews and document changes
Reviews turn logs into decisions. Put them on your calendar. Write what you changed and why.
- Daily review, 10 minutes: check rule breaks. fix missing screenshots. confirm R math. list your top mistake of the day.
- Weekly review, 30 to 60 minutes: filter by setup and pair. compute win rate, average win R, average loss R, expectancy. rank mistakes by total R cost. pick one change for next week.
- Monthly review, 60 to 120 minutes: compare weeks. track equity curve in R. track drawdown in R. keep, pause, or refine setups based on sample size and stability.
Document changes in a simple table so you can audit results.
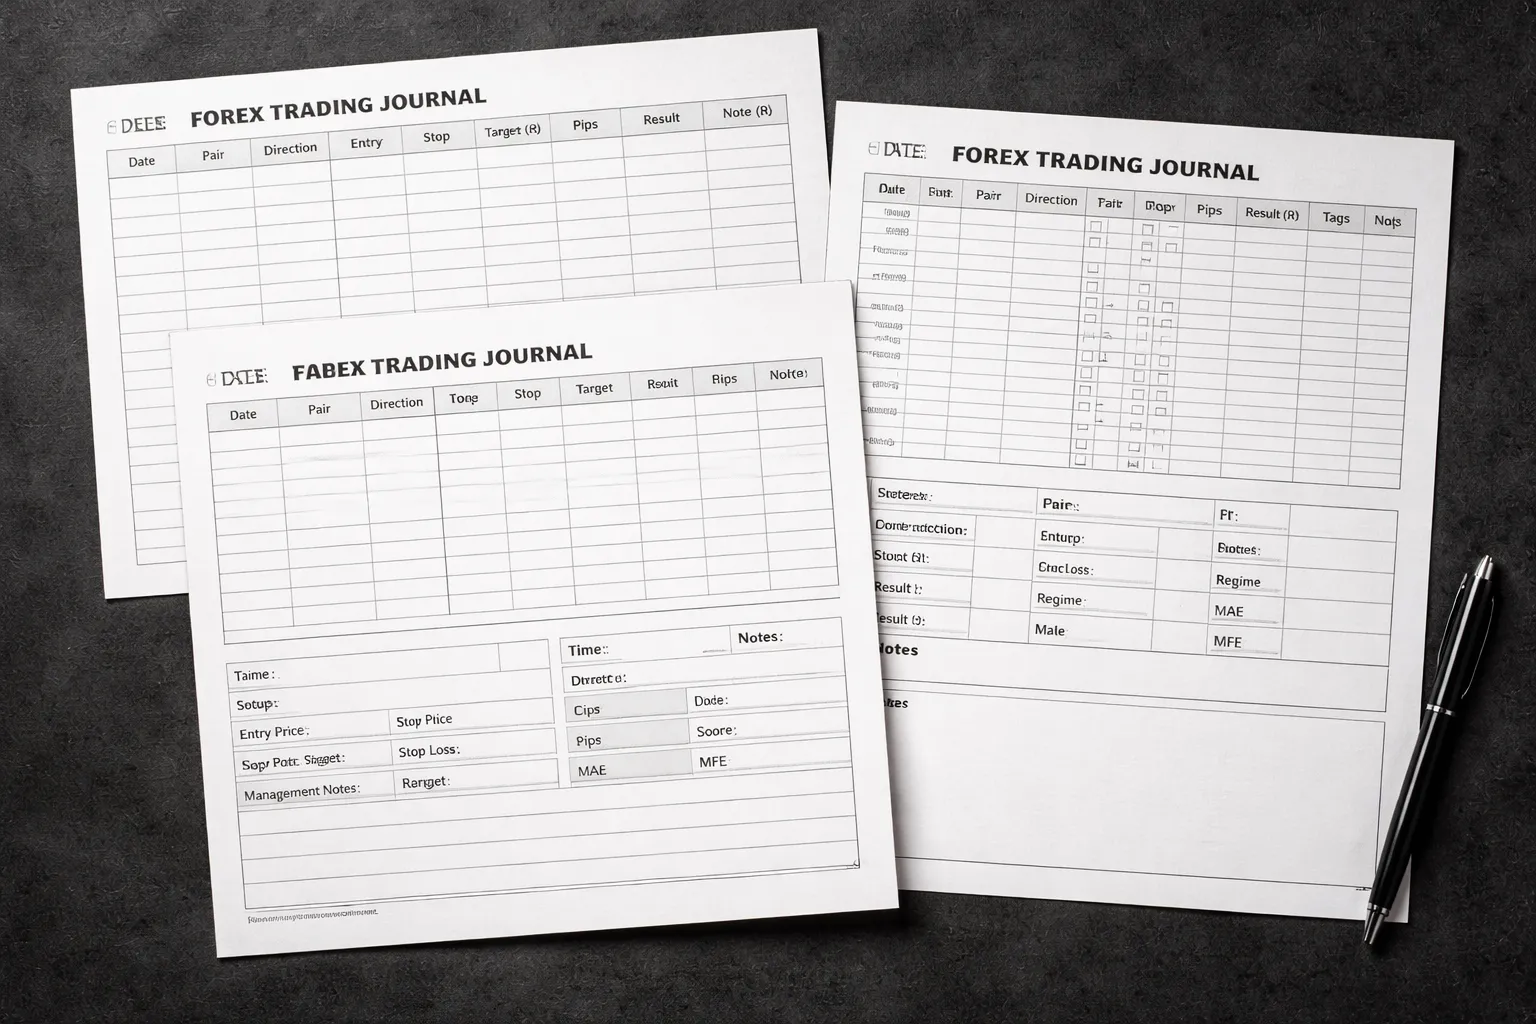
What to Track in a Forex Trade Journal (Complete Field Checklist)
Trade identification fields
These fields let you filter, audit, and group results fast. Keep them consistent.
- Trade ID, unique code you control, for example 2026-02-04-EU-01.
- Date, and time at entry and exit, include time zone.
- Pair, for example EURUSD.
- Direction, long or short.
- Timeframe, the chart you used to make the decision.
- Strategy tag, one label, no vague names.
- Setup type, breakout, pullback, range fade, news, other.
- Account, if you run multiple accounts or prop evaluations.
Execution details
Execution tells you if your edge fails, or if your fills fail.
- Order type, market, limit, stop, stop-limit.
- Entry price, planned and filled.
- Stop-loss price, planned and placed.
- Take-profit price, planned and placed.
- Position size, lots or units.
- Spread at entry, and spread at exit if it varies.
- Slippage, entry and exit, in pips and money.
- Commission, per trade.
- Swap, if held overnight.
- Broker and platform, if you compare execution sources.
Risk and money management
This is the core. If you track one block well, track this block.
- Account equity at entry, not balance.
- Risk %, planned and actual.
- Risk in money, planned and actual.
- Stop distance, in pips.
- R value, define 1R as initial risk at entry.
- Leverage used, effective leverage on the position.
- Margin used, and free margin after entry.
- Max open risk, total risk across all open trades in % and R.
- Correlation note, if you stack similar pairs, tag it.
- Position sizing method, fixed %, fixed lot, volatility based, other.
Use a sizing tool if you want the math clean. Link it to your workflow with a forex lot size calculator.
Trade management actions
Log what you did after entry. Many traders lose edge here.
- Management plan, what you intended to do after entry.
- Partial exits, price, size, and reason.
- Scale-in, price, size, and rule used.
- Scale-out, price, size, and rule used.
- Trailing stop rule, the exact trigger and step.
- Stop move log, each change with time and reason.
- Time-based exit, max hold time, and what triggered the exit.
- Hedge, if used, include size and intent.
- Manual close, the reason in one sentence.
Outcome metrics
Record results in formats you can compare across pairs and sizes.
- Exit price, planned and filled.
- Pips, gross and net.
- Profit or loss, gross and net.
- Net after costs, include spread, commission, swap, slippage.
- R-multiple, net R is the number you want for reviews.
- Holding time, minutes or hours, plus session overlap.
- MAE, max adverse excursion in pips and R.
- MFE, max favorable excursion in pips and R.
- Exit type, TP, SL, manual, time stop, trailing stop, partial sequence.
Market context
This helps you find when your strategy works, and when it fails.
- Session, Asia, London, New York, overlap.
- Volatility, low, normal, high, or ATR value.
- Trend state, trending, ranging, transition, plus your rule for it.
- Key levels, support, resistance, prior day high low, weekly levels.
- Market structure, higher highs, lower lows, break of structure, other.
- Liquidity conditions, thin, normal, news spike, holiday, roll-over.
- Distance to level, pips from entry to the nearest major level.
Fundamental and news context
News can turn a good setup into a bad trade. Track it with simple tags.
- Calendar events within window, for example 60 minutes before to 60 minutes after entry.
- Event name, CPI, NFP, rate decision, speech.
- Currency impacted, base, quote, or both.
- Expected vs actual, record the surprise direction.
- Central bank risk, scheduled or unscheduled headlines.
- News rule followed, yes or no, plus which rule.
Psychology and behavior notes
Keep it short. Focus on behaviors you can change.
- Pre-trade state, calm, tired, rushed, distracted.
- Confidence level, 1 to 5, based on your checklist, not vibes.
- Impulse triggers, FOMO, boredom, loss chasing, overconfidence.
- Rule breaks, exact rule, and what caused it.
- Process rating, did you execute your plan, yes or no.
- One improvement, one sentence for next time.
Setup quality scoring
Scoring lets you test if higher quality trades produce higher R.
- Grade, A, B, C, based on your written rules.
- Checklist score, for example 0 to 10, with named items.
- Reason for grade, 2 to 3 bullet points.
- Screenshots, pre-entry, entry, exit, and higher timeframe.
- Chart annotations, mark entry, stop, target, invalidation level.
- Would you take it again, yes or no, and why.
Mistake taxonomy with tags
Use tags so you can sort mistakes by total R cost later.
- Late entry, you entered after your trigger.
- Early entry, you front-ran confirmation.
- Moving stop, you widened risk after entry.
- Cutting winners, you exited before your rule.
- Not taking profit, you ignored target or exit rule.
- Revenge trade, you traded to win back a loss.
- Overtrading, too many trades outside your plan.
- Overleveraging, position size broke your risk rule.
- News violation, you traded into an event against rules.
- Session violation, you traded outside your allowed hours.
- Setup drift, you changed the strategy mid-trade.
Add two tag fields. One for mistake type. One for root cause, for example impatience, fear, greed, fatigue.
Complete field checklist table
Key Metrics to Calculate (So Your Journal Becomes an Analyst)
Expectancy (beats win rate)
Win rate lies. Expectancy pays. A high win rate with big losses still fails.
Expectancy (in R) formula: (Win% x Avg Win in R) minus (Loss% x Avg Loss in R).
- Track it by setup. One overall number hides edges and leaks.
- Use R, not pips. Pips ignore stop size and position size.
- Goal: positive expectancy after costs. Costs can turn a small edge negative.
R-multiples (R) to normalize every trade
R makes trades comparable. Different stops, same language.
R formula: (Exit price minus Entry price) divided by (Entry price minus Stop price), adjust sign for long vs short.
- Record planned R and realized R. You will spot early exits and stop movement.
- Build an R distribution. Count how many trades end at -1R, -0.5R, +1R, +2R.
- Use consistent risk per trade. If you do not, R still works, but your equity curve will not.
If your sizing varies, fix it first with a Forex lot size calculator.
Profit factor (PF)
Profit factor shows how many dollars you make per dollar lost.
PF formula: Gross profit divided by Gross loss.
- PF above 1.0: profitable before considering time and risk.
- Compare PF by pair and session. Many strategies only work in specific conditions.
- Watch sample size. PF swings hard with small trade counts.
Average win, average loss, payoff ratio
These numbers explain what your win rate cannot.
- Average win: mean profit per winning trade, in R.
- Average loss: mean loss per losing trade, in R.
- Payoff ratio: Avg win divided by Avg loss.
Use payoff ratio with win rate. Low win rate can still win with a high payoff ratio. High win rate can still lose with a low payoff ratio.
MAE and MFE (to tighten exits and stops)
MAE and MFE show what price did while you held the trade. They help you stop guessing.
- MAE: the worst move against you during the trade, in pips or R.
- MFE: the best move in your favor during the trade, in pips or R.
- Exit efficiency: Realized gain divided by MFE. Low efficiency means you give back too much.
- Stop efficiency: If most winners never hit -0.7R MAE, a 1.2R stop may be waste.
- Use per setup. MAE and MFE differ by pattern, pair, and volatility regime.
Drawdown (peak-to-trough) and recovery factor
Drawdown tells you how deep the hole gets. Recovery factor tells you how well you climb out.
- Max drawdown: largest equity drop from a peak to the next trough.
- Time in drawdown: how long you stay below the last equity high.
- Recovery factor: Net profit divided by Max drawdown.
Track drawdown per strategy. A strategy can show profit but still carry drawdowns you cannot trade through.
Rule adherence rate (and why it predicts your P and L)
If you do not track compliance, you cannot separate strategy performance from trader performance.
Rule adherence rate: Trades that followed your rules divided by total trades.
- Split results: expectancy for rule-followed trades vs rule-broken trades.
- Track rule categories: entry, stop placement, size, session filter, news filter, max trades per day.
- Process score: average of checklist scores. Then compare it to R outcome.
Your journal should show a simple truth. Rule breaks cost R.
Cost analysis (spread, commission, slippage) by pair and strategy
Costs decide if your edge survives. You need costs per trade, then aggregated by setup and pair.
- Spread cost: spread in pips times pip value times lot size.
- Commission: round turn commission per lot times lots.
- Slippage: (expected entry or exit minus actual) times pip value times lot size.
Calculate cost in R too. Cost in R equals total cost divided by planned risk amount. If your average winner is +0.8R and your costs average 0.2R, you just cut your edge by 25%.
Quick metric table (copy into your journal)
Templates: Free Forex Trading Journal Ideas (Spreadsheet, Notion, Print)
Simple starter template, 10 essential columns
Start with a spreadsheet. Keep it tight. Track only what you will review.
- Date and time
- Pair
- Direction (Long, Short)
- Setup (one word, your main pattern)
- Timeframe (execution timeframe)
- Entry price
- Stop price
- Target price (or planned R multiple)
- Result (R)
- Rule followed (Yes, No)
Log the trade right after exit. Use R as your main outcome. Keep pips and dollars optional.
Intermediate template with tags, scoring, and review notes
Add structure for pattern analysis. You need tags, a quality score, and a short review note.
- Session tag (Asia, London, NY)
- Market type (Trend, Range, Breakout, Pullback)
- Catalyst tag (None, Data, Speech, Event)
- Entry type (Limit, Market, Stop)
- Management tag (Static, Trail, Partial, BE move)
- Execution score (1 to 5)
- Plan clarity score (1 to 5)
- Rule breaks (dropdown list)
- Screenshot links (before, during, after)
- Review note (2 to 4 lines, what you repeat)
Keep scoring strict. A “5” means you followed your rules with clean execution, not that you made money.
Advanced template with MAE/MFE, regime tagging, and dashboards
Use this when you have at least 50 to 100 trades logged. Add data that improves decisions.
- MAE (R) and MFE (R)
- Planned R and realized R
- Cost per trade (R) (spread, commission, slippage)
- Regime (Low vol, High vol, Trend day, Range day)
- HTF bias (Bull, Bear, Neutral)
- Liquidity context (Near swing high/low, News level, Session open)
- Time in trade (minutes)
- Max adverse in pips and max favorable in pips (optional if you already track MAE/MFE)
Build a dashboard sheet that pulls from your log and updates weekly.
- Equity curve (cumulative R)
- Win rate, payoff ratio, expectancy (R)
- Max drawdown, recovery factor
- Rule adherence rate
- Performance by tag (setup, session, regime, management)
If you size positions manually, log your risk per trade in percent and lots. Use your forex lot size calculator so your R stays consistent.
Notion-style database layout
Use one Trades database and one Reviews database. Link them.
Trades database properties
- Date
- Pair
- Direction
- Setup (select)
- Session (select)
- Regime (select)
- Entry, Stop, Target (numbers)
- Risk % (number)
- Result (R) (number)
- Rule followed (checkbox)
- Rule break (multi-select)
- MAE (R), MFE (R) (numbers)
- Costs (R) (number)
- Screens (files or links)
- Review (relation to Reviews)
Views to create
- Today (filtered to current date)
- This week (group by setup, then by session)
- Rule breaks (filtered to rule followed = false)
- Top setups (sorted by average Result (R), min trade count filter)
Linked review pages
- Weekly review page with: stats, biggest mistake, best trade, one rule to enforce
- Setup playbook pages, one per setup, each linked to trades filtered by that setup
Printable one-page journal sheet for discretionary traders
Print one page per trade. Fill it in by hand. Keep it fast.
- Trade ID, Date, Pair, Session
- Bias (HTF) and reason (one line)
- Setup checklist (3 to 6 checkboxes)
- Entry, Stop, Target, Risk %
- Management plan (one line)
- Exit and Result (R)
- Rule followed (Yes, No) and which rule broke
- Post-trade note (what to repeat, what to stop)
Staple printed screenshots to the sheet if you trade discretionary and review on paper.
Screenshot library structure
Keep screenshots searchable. Use the same format every time.
Folder structure
- /Journal/2026/02/
- /Journal/2026/02/EURUSD/
- /Journal/2026/02/EURUSD/2026-02-04_EURUSD_London_L_Trade-0123/
File naming convention
- 0123_pre_H1.png
- 0123_pre_M15.png
- 0123_entry_M5.png
- 0123_manage_M5.png
- 0123_exit_M5.png
- 0123_post_notes.txt (optional)
Annotations to add
- Entry, stop, target
- Reason for entry (one short label)
- Invalidation level
- News time if relevant
- MAE and MFE on the chart if you can mark it
Dropdowns and data validation to prevent messy data
Messy inputs destroy your stats. Lock your fields.
- Use dropdowns for tags (setup, session, regime, entry type, management, rule breaks).
- Standardize direction to two values, Long, Short.
- Restrict numeric ranges. Risk % between 0 and 5. Score between 1 and 5. Result (R) between -10 and +10.
- Force required fields. Date, pair, direction, entry, stop, result (R), rule followed.
- Use consistent pair codes. EURUSD, GBPJPY, XAUUSD. Do not mix with EUR/USD.
- Separate planned vs actual. Planned R, realized R. Planned stop, actual exit.
- Add a unique Trade ID. Use date plus sequence, or a running number.
Spreadsheet tips
- Google Sheets: Data validation for dropdowns, protected ranges for formulas, conditional formatting for rule breaks.
- Excel: Data Validation lists, structured tables, slicers for tag filtering.
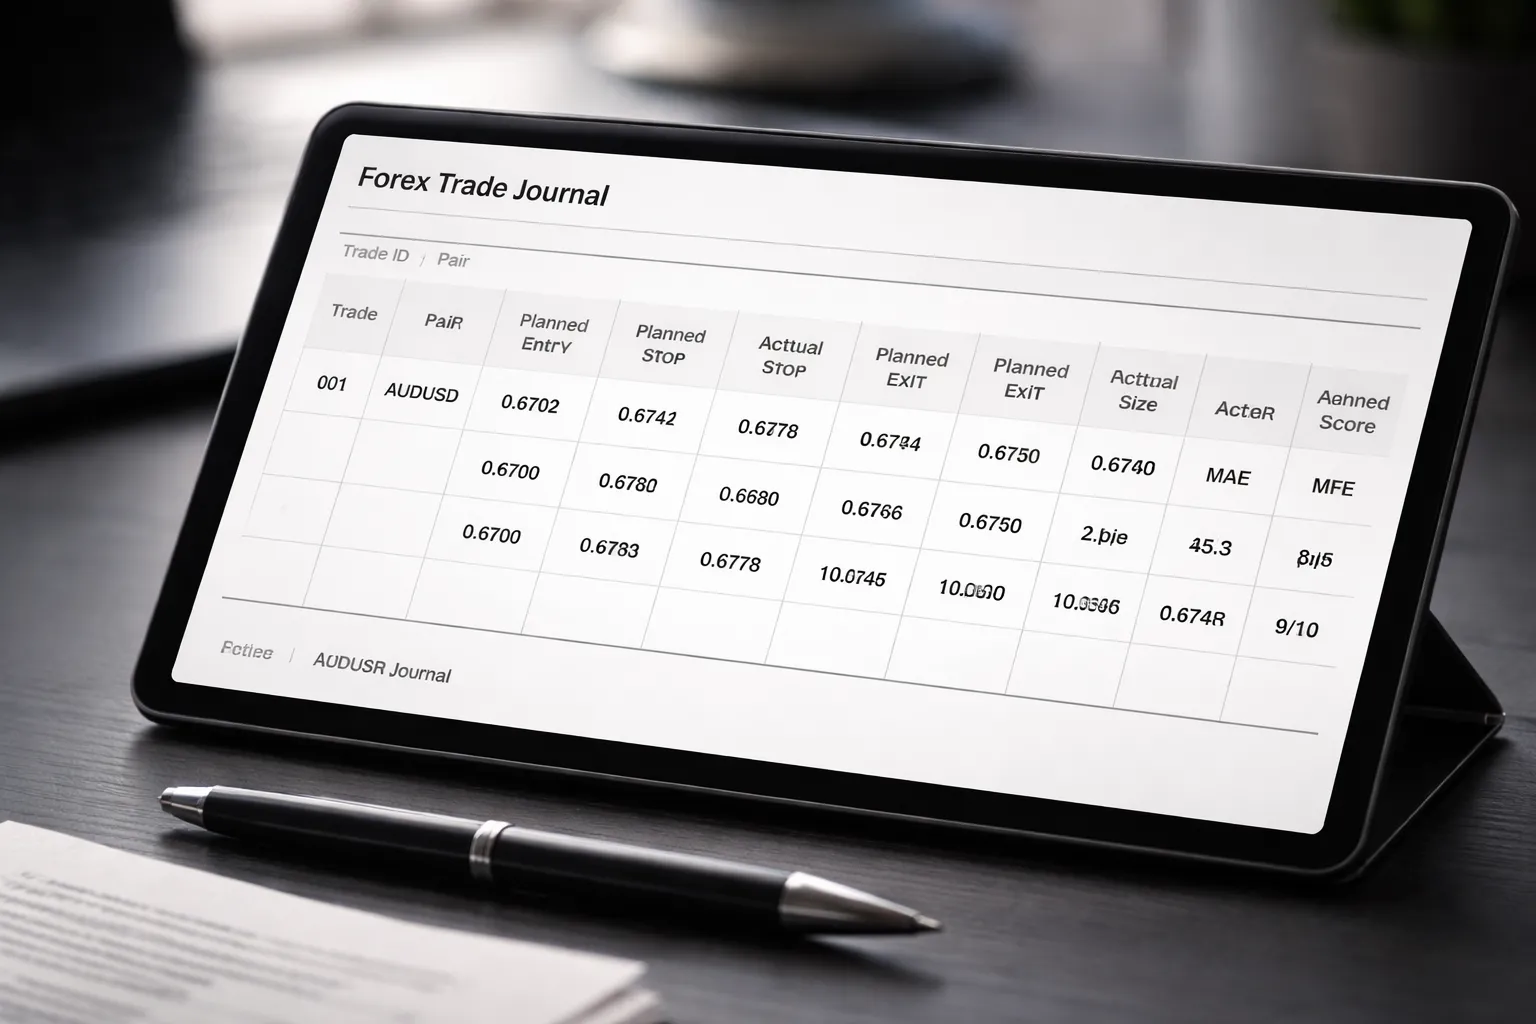
Example: A Filled-Out Forex Trade Journal Entry (Walkthrough)
Pre-trade plan example (bias, levels, invalidation, triggers)
Trade ID: 2026-02-04-01
Date: 2026-02-04
Pair: AUUSD
Session: London
Strategy tag: Pullback to level, continuation
Timeframes used: H1 for bias, M15 for setup, M5 for trigger
Market bias (planned): Bullish. Higher highs and higher lows on H1. Price above 20 EMA on H1.
Key levels (planned):
- H1 support zone: 0.6570 to 0.6576
- Previous day high: 0.6620
- Round number resistance: 0.6650
Setup idea (planned): Buy a pullback into the H1 support zone after a sweep of the prior M15 low, then reclaim.
Invalidation (planned): Close below 0.6565 on M15. If that happens, no long.
Entry trigger (planned):
- M5 breaks structure up after touching 0.6570 to 0.6576
- M5 closes back above 0.6582
- Spread at entry under 1.5 pips
Risk plan: 1R max for the trade. No add-ons.
Execution example (entry type, stop placement logic, position sizing)
Order type (planned): Buy stop above trigger candle high.
Entry (planned): 0.6583
Stop (planned): 0.6569
Stop logic (planned): Below M5 swing low inside the support zone. Keep it outside noise, but inside invalidation.
Take-profit (planned):
- TP1: 0.6607 (near prior M15 swing high)
- TP2: 0.6620 (previous day high)
Planned R: 1.0R to TP1, 2.3R to TP2
Account size: $10,000
Risk per trade: 0.5% ($50)
Stop size: 14 pips
Position size (planned): 0.36 lots (rounded down)
Use a position sizing tool to avoid manual errors. Here is a forex lot size calculator walkthrough if you need one.
Actual entry: 0.6584 (0.1 pip slippage)
Actual stop: 0.6569 (same as planned)
Actual size: 0.35 lots (rounded down one step)
Reason for variance: Broker lot step. Kept risk under $50.
Management example (when to move stop, partials, and what rules were used)
Management rules used:
- Move stop to break-even only after price reaches +1R and closes above a prior M5 swing high.
- Take partial at TP1, then trail the rest behind new M5 higher lows.
- Do not widen the stop. No exceptions.
What happened:
- Price hit +1R at 0.6598, then printed an M5 close above the swing high at 0.6600.
- Stop moved to break-even at 0.6584.
- TP1 filled at 0.6607. Took 50% off.
- For the remaining 50%, trailed stop to 0.6599 after a new M5 higher low formed.
- TP2 did not fill. Price stalled under 0.6620 and reversed.
- Remainder stopped at 0.6599.
Actual exits:
- Exit 1: 50% at 0.6607
- Exit 2: 50% at 0.6599
Rule breaks: None.
Post-trade review example (what to keep, what to change, next-time rule)
Result summary: Win, but missed full target. Managed risk. Followed the plan.
What to keep:
- Clear invalidation level on M15.
- Entry trigger based on reclaim and structure shift.
- Waited for +1R before moving stop.
What to change:
- Add a rule for TP2 when a major level sits close, use limit at the level, not beyond it.
- Tag this as “major level ahead” to filter future stats.
Next-time rule: If TP2 is a known daily level, place TP2 one to two pips before it, or take a larger partial at TP1.
Notes you would write: “Good trigger. Stop logic solid. TP2 placement too optimistic. Next time, respect the daily high as first-touch liquidity.”
How the same trade looks in R, MAE/MFE, and adherence scoring
| Planned entry | 0.6583 |
| Actual entry | 0.6584 |
| Planned stop | 0.6569 |
| Actual exit(s) | 50% at 0.6607, 50% at 0.6599 |
| 1R (price) | 14 pips |
| Planned R (to TP1, TP2) | +1.0R, +2.3R |
| Realized R | +1.06R on first half, +1.07R on second half, +1.07R total (weighted) |
| MAE (max adverse excursion) | -6 pips, -0.43R |
| MFE (max favorable excursion) | +39 pips, +2.79R |
| Adherence score | 9/10 |
| Why not 10/10 | TP2 placement did not respect the exact daily level. Plan lacked a “major level ahead” rule. |
How to use these numbers: Realized R tells you outcome. MAE tells you if your stop sits in noise. MFE tells you if you cut winners too early. Adherence tells you if results came from your process.
How to Review Your Journal to Find an “Edge”
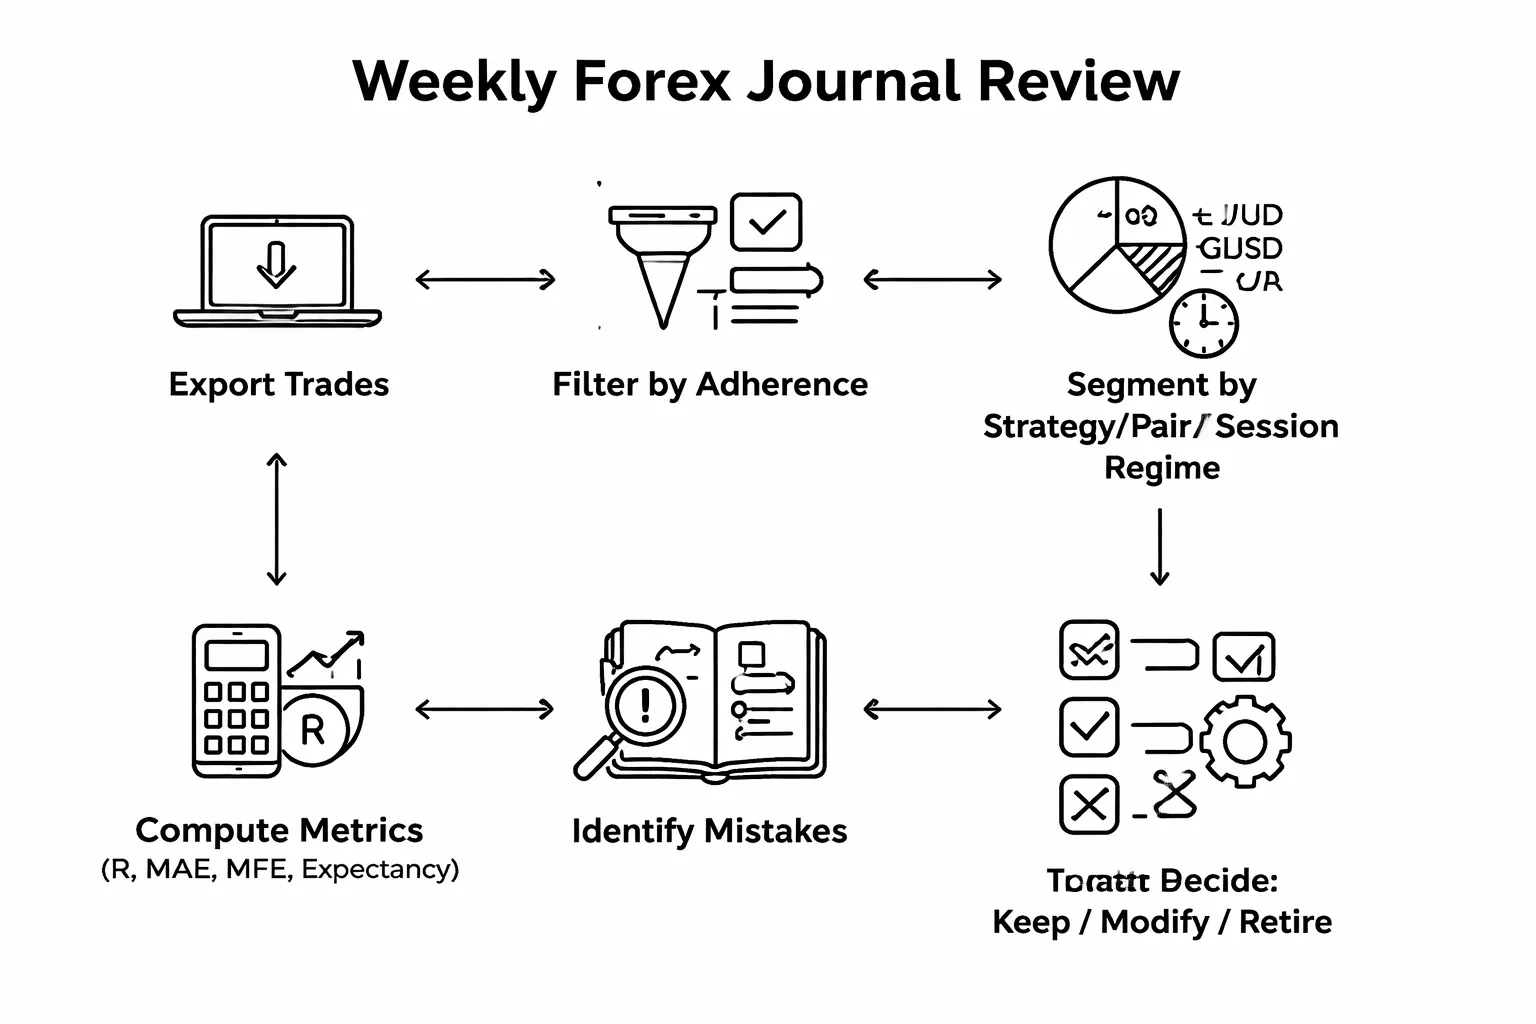
Weekly review process
Review once per week. Use the same steps every time. Keep it mechanical.
- Step 1, pull the data. Export your trades for the week. Include entry, exit, R, MAE, MFE, adherence score.
- Step 2, remove noise. Filter out trades with low adherence first. Mark them as execution errors, not strategy proof.
- Step 3, segment hard. Create slices by:
- Strategy. One setup at a time.
- Pair. EURUSD is not XAUUSD.
- Session. Asia, London, New York, overlap.
- Market regime. Trend, range, breakout, high news volatility, low volatility.
- Step 4, compute core stats per slice. Trades, win rate, average R, total R, max drawdown in R, average MAE in R, average MFE in R, adherence average.
- Step 5, write one page. What worked, what failed, one change for next week.
Finding your best conditions
Your edge often lives in constraints. Find the few conditions where your numbers improve.
- Time of day. Group trades by hour block. Track average R and adherence. Many traders perform best in one session only.
- Volatility. Tag each trade with an ATR state, high, normal, low. If your MAE spikes in high ATR, your stop logic may not fit that regime.
- Trend vs range. Add a simple tag, trending or ranging, based on your rules. Then compare:
- MFE vs realized R. Big MFE with small realized R means you exit too early for that condition.
- MAE vs stop size. MAE close to 1R often means your stop sits in noise for that condition.
- Pair behavior. Some setups work on a few pairs only. If one pair drags results, quarantine it for a month.
Separate skill from luck
Do not crown an edge off a small sample. Use minimum counts and streak awareness.
- Minimum sample per slice. Aim for 30 trades before you trust a slice. Use 50 if the setup has a low win rate and larger variance.
- Track expectancy. Expectancy in R keeps it comparable across pairs and sizing.
- Watch streaks. Log longest win streak and loss streak in each slice. If one losing streak breaks your rules, your risk per trade is too high for that strategy.
- Control for execution. Compare high adherence trades only. If the edge vanishes when adherence is high, you never had an edge. You had randomness.
Identify high-cost mistakes and create one-rule fixes
Your journal should show which mistakes cost the most R. Fix the top one first.
| Pattern you see | What it usually means | One-rule fix |
|---|---|---|
| High MAE, frequent stop-outs, then price runs | Stop in noise or entry too early | Require a close beyond the trigger level before entry |
| High MFE, low realized R | Cutting winners or moving TP too close | Lock TP1 and TP2 before entry, no edits except trailing rule |
| Low adherence on losers, high adherence on winners | Rule breaks amplify losses | No trade if any checklist item is missing, zero exceptions |
| Losses cluster around news spikes | Regime mismatch | No new entries within X minutes of red news for that currency |
Keep fixes narrow. One rule. One behavior. Add it to your pre-trade checklist. If you struggle with this step, review common forex trading mistakes beginners make and match your journal patterns to a named mistake.
Create a personal playbook from your best-performing setups
Your playbook is a short document built from your top slices. It tells you what to trade and when to stop.
- Pick your A setups. Choose the 1 to 3 slices with the best total R and stable drawdowns, based on high adherence trades.
- Write the exact conditions. Pair list, session, regime tag, volatility state, entry trigger, invalidation, stop logic, take profit logic.
- Attach proof. Link 5 to 10 screenshots of your best examples and 5 to 10 of failures with notes.
- Define the management rule. If MFE regularly reaches 3R but you realize 1R, set a fixed partial plan. If MAE stays under 0.4R, you may tighten stops.
- Add a “do not trade” list. Conditions where expectancy turns negative, like low volatility Asia range or post-news whipsaws.
When to retire or modify a strategy
Use journal evidence. Do not use feelings.
- Retire it if expectancy stays negative. Example, after 50 to 100 high adherence trades, average R is below zero in most regimes.
- Modify it if one variable breaks it. Example, it works in trend but fails in range. Add a regime filter, do not change the entry.
- Pause it if drawdown exceeds your historical band. If max drawdown is usually 8R and you hit 16R, stop trading it and review the last 20 trades for regime shift or execution drift.
- Re-test after changes. Treat modifications as a new strategy version. Track it separately until it reaches a clean sample size.
Common Mistakes When Journaling Forex Trades (and How to Fix Them)
Tracking Too Much Too Soon (Analysis Paralysis)
If you track 40 fields on day one, you stop journaling or you log junk data. You also drown in noise.
Fix it by starting with a minimum dataset. Add fields only after you use the current ones in a review.
- Keep 10 core fields: date, pair, session, setup name, timeframe, entry, stop, target, position size, result in R.
- Add 3 process fields: plan followed (yes or no), entry quality (A, B, C), exit type (TP, SL, manual, time).
- Limit tags: use 5 to 10 max, with fixed spelling.
- Use screenshots sparingly: one before, one after, only if it helps explain execution.
Inconsistent Fields and Tags That Kill Analysis
If your tags change every week, you cannot filter. If your fields move around, your stats break.
Fix it with a schema. Lock it. Version it when you change it.
- Create a dropdown list: setup, market regime, session, news context, exit type.
- Standardize names: pick one label per idea, for example “trend” and “range”, not five variants.
- Use one time standard: broker time or UTC, then stick to it.
- Track strategy versions: v1, v1.1, v2, and never mix results across versions.
Only Journaling Losers (or Only Winners)
If you only log pain trades, you learn fear. If you only log winners, you learn stories. Both create bias.
Fix it by journaling every trade, or at least a random sample that includes winners and losers.
- Set a rule: log 100 percent of trades for 30 days, then decide if you can reduce.
- Use the same fields: do not add extra notes only when you lose.
- Review by setup, not emotion: group trades by setup name and regime, then check R expectancy and drawdown.
Confusing Pips With Performance
Pips do not pay you. Risk and costs do. A 20 pip win can lose money with the wrong size, spread, or swap.
Fix it by logging results in R and money, and by recording costs.
- Record R per trade: profit or loss divided by initial risk.
- Record position size: lots, units, or contracts, plus account currency.
- Record costs: spread at entry, commission, swap, slippage if you can estimate it.
- Separate gross vs net: gross R before costs, net R after costs.
- Use correct sizing: link your sizing workflow to a forex lot size calculator so each R means the same thing across pairs.
Not Recording the Plan, So You Cannot Measure Discipline
If you do not write the plan, you cannot tell skill from luck. You also cannot quantify rule breaks.
Fix it by logging the trade idea before entry, then scoring execution after exit.
- Before entry: setup, direction, entry trigger, stop logic, target logic, invalidation rule.
- During trade: planned management steps, and what actually happened.
- After exit: plan followed (yes or no), rule broken tag, and the exact rule number.
- Track discipline metrics: percent of trades that followed plan, average R of rule breaks, top 3 repeated mistakes.
Skipping Reviews, Turning Your Journal Into a Graveyard
Logging without review changes nothing. You collect entries and repeat the same errors.
Fix it with a review schedule and a short checklist. Keep it boring. Keep it consistent.
- Daily: 5 minutes, tag errors, mark plan followed, add costs, attach screenshots.
- Weekly: count trades, net R, win rate, average win and loss in R, max drawdown, rule breaks by type.
- Monthly: results by setup and regime, time of day performance, costs impact, strategy version comparison.
- Action output: one change max per week, then track it as a new version.
Tools and Automation Options (Manual vs App-Based Journals)
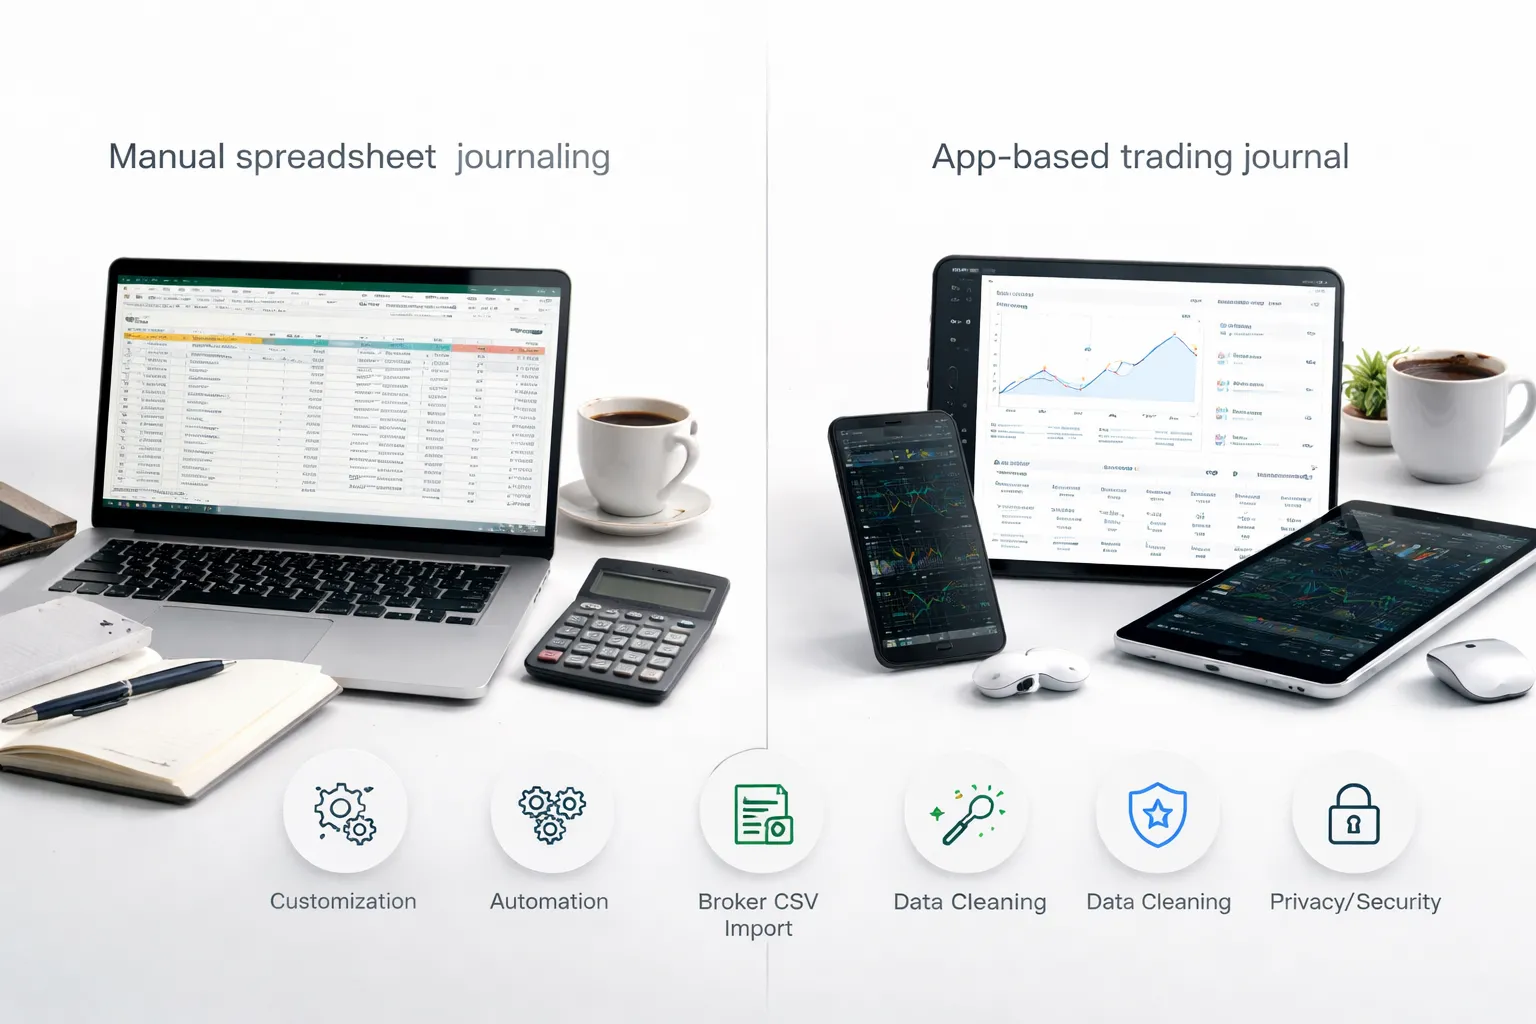
Spreadsheet Journals (Manual)
Spreadsheets give you control. You decide what to track, how to tag, and how to calculate.
- Pros: Full customization, easy to add new tags, works for any broker, low cost, you can version your strategy fields.
- Cons: More manual work, higher error risk, formulas can break, charting takes time, you need basic spreadsheet skills.
Use a spreadsheet if you want a journal that matches your plan exactly. Keep it simple at first. Add fields only when you use them weekly.
Trading Journal Apps (Automation)
Apps reduce typing. They pull trades, calculate stats, and generate charts fast.
- Pros: Automatic metrics, fast filters by symbol and setup, equity curve and drawdown tracking, screenshots and notes in one place, less spreadsheet maintenance.
- Cons: You work inside their structure, tags and fields may feel limited, some brokers do not sync well, pricing adds up, exports can be messy.
Apps work best when your framework is already stable. You know your tags. You know your rules. You just want speed and consistency.
If you want a shortlist, see trading journal tools.
Broker Export and CSV Imports (Keep Data Clean)
Most traders end up importing CSV files, even if they use an app. Data hygiene matters more than the tool.
- Standardize column names: date, time, symbol, side, size, entry, exit, stop, take profit, commission, swap, spread cost if available.
- Lock your time zone: store one time zone in your journal, note the broker server time once, do not mix.
- Store prices with precision: keep raw fills, do not round. Pip math breaks fast on JPY pairs and 5 digit pricing.
- Separate gross and net: track P and L before costs and after costs. Costs explain a lot of flat performance.
- One trade ID per position: merges and partial closes cause duplicates. Use ticket, order ID, or your own ID.
- Keep raw files: save the original export each month. If your numbers look wrong later, you can audit.
If you size positions inside your journal, keep the same risk input method every time. Use one calculator process and stick to it.
Privacy and Security for Trade Data
Your journal contains account behavior. Treat it like financial data.
- Remove account numbers: mask them before sharing screenshots or templates.
- Limit API access: prefer read-only connections. Never give withdrawal permissions.
- Use strong login hygiene: unique passwords and two-factor authentication.
- Control sharing: do not publish live account statements. Share anonymized stats only.
- Backup: keep a local copy of your data, even if you use an app.
A Practical Progression (Manual First, Then Automate)
Start manual. Prove your tracking framework. Then automate.
- Step 1: Track 20 to 50 trades in a spreadsheet. Nail your tags, rule checks, and R calculations.
- Step 2: Make weekly stats part of your routine. If you skip it, automation will not save you.
- Step 3: After your fields stop changing, move to an app or hybrid setup. Import trades, keep your tags, keep your versioning.
- Step 4: Keep one source of truth. Either the app exports to your master sheet, or the sheet stays primary and the app stays for charts.
Automation helps with volume. It does not fix unclear rules. Build the journal around your decisions first.
Building the Habit: A 10-Minute Journaling Routine for Traders
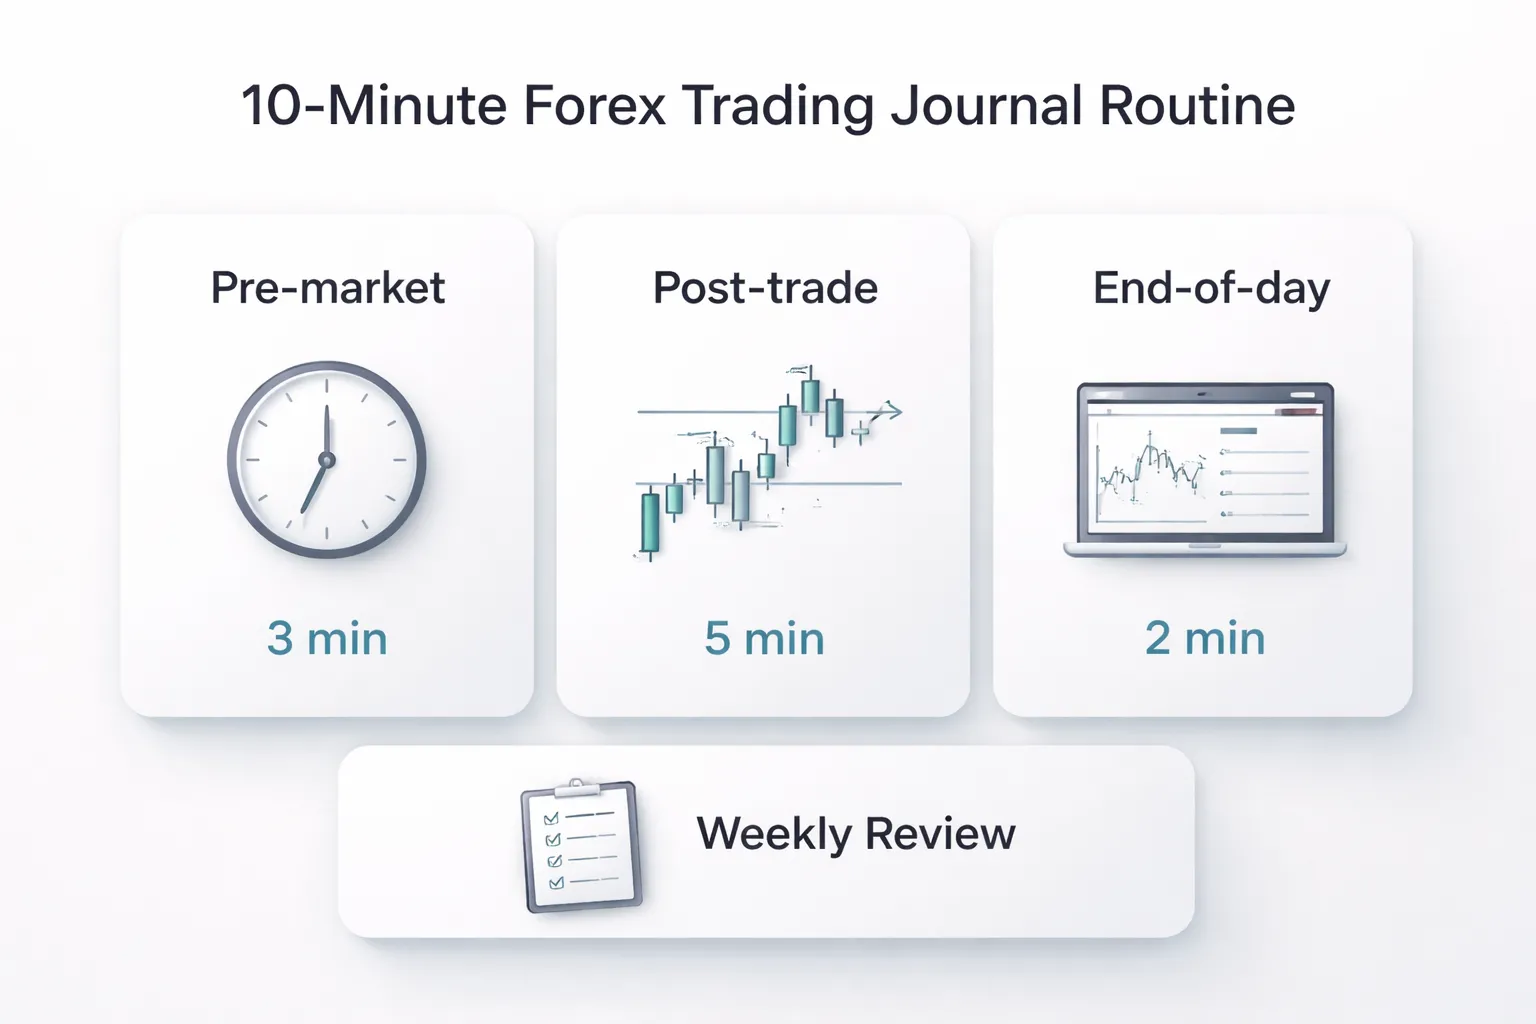
Building the Habit: A 10-Minute Journaling Routine for Traders
You do not need long writeups. You need a repeatable loop. Ten minutes per trading day is enough if you log the same items, in the same order, every time.
Pre-market (3 minutes): bias, key levels, news risk
- Set your bias: bullish, bearish, or neutral for each pair you might trade. Write one reason tied to structure or trend.
- Mark key levels: yesterday high and low, session high and low, weekly high and low, major swing points, and your planned entry zones.
- Define the invalidation: one price level that proves your bias wrong.
- Log news risk: red folder events, time, currency impacted, and what you will do, avoid trading 5 minutes before and after, reduce size, or skip.
- Write one plan line: setup you will take, setup you will ignore.
Post-trade (5 minutes): log, screenshot, one-sentence lesson
- Log the trade fast: pair, date, session, direction, entry, stop, target, exit, size, R result, and reason for entry.
- Tag what matters: setup name, timeframe, market condition, and execution quality, clean or messy.
- Add screenshots: one at entry, one at exit. Name files the same way every time, for example, 2026-02-04_EURUSD_London_breakout_Rplus1.
- Write one sentence: the single biggest driver of the outcome. Keep it factual, not emotional.
- Record rule status: followed plan, yes or no. If no, mark the exact rule broken.
End-of-day (2 minutes): quick stats and error count
- Check today’s numbers: total trades, total R, win rate, and average R. Do not interpret yet.
- Count errors: plan breaks, early exits, late entries, missed trades, revenge trades, and overtrading. Use simple tallies.
- Write one fix: one action you will apply tomorrow, like “no trades outside London session” or “move stop only at structure breaks”.
Weekly accountability: one improvement goal, one rule to focus on
- Pick one goal: one process metric, not P and L. Examples: “zero FOMO entries” or “100 percent of trades include screenshots”.
- Pick one rule: the rule that caused the most damage. Make it your only focus rule for the week.
- Review a small sample: 10 to 20 trades. Sort by tags. Identify the top 1 mistake by frequency.
- Set a threshold: a hard limit like “max 2 trades per session” or “stop after 2 errors”.
Use reminders, templates, and friction reduction to stay consistent
- Use time-based reminders: one alert before your session for pre-market, one alert after typical trading hours for end-of-day.
- Use event-based triggers: journal immediately after you close a trade. No exceptions.
- Default to templates: save a trade entry form with fixed fields and dropdown tags. Remove typing.
- Reduce steps: keep your journal open during trading, keep your screenshot tool pinned, and store screenshots in one folder.
- Set minimums: if you feel rushed, you still log outcome in R, rule status, and one sentence. Everything else can wait.
- Make compliance visible: add a weekly checkbox list for “pre-market done” and “end-of-day done”. Track streaks.
- Audit your process, not your mood: if you miss a day, fix the trigger, not your motivation.
If your journal shows repeated plan breaks, address those first. They sit behind most common Forex trading mistakes.
FAQ
What is a Forex trading journal?
A Forex trading journal is your trade log plus your process record. It tracks setup, entry, stop, target, position size, risk, result, and rule adherence. It also tracks context like session and news. Your goal is repeatable execution and measurable improvement.
Should you journal every trade?
Yes. Journal every live trade. Include partial closes and scale-ins as separate rows. If you skip “small” trades, you hide the habits that leak money. If you must reduce workload, journal fewer fields, not fewer trades.
What should you track at minimum?
- Date, pair, session
- Setup tag
- Entry, stop, target
- Position size, risk per trade
- R multiple, result
- Rule status and one sentence note
How do you track risk and position size correctly?
Log planned risk in account percent and currency. Log stop distance in pips. Log lot size. Then compute actual risk from fill price and stop. Use a position sizing tool so your journal reflects the same method every time. Use a Forex lot size calculator.
What is R multiple and why use it?
R multiple is profit or loss divided by your initial risk. If you risk $100 and make $150, that is +1.5R. It normalizes results across different position sizes. It lets you compare trades, setups, and weeks without noise.
How do you journal trades with multiple exits?
Use one trade ID. Record each exit as a line with size closed and price. Calculate weighted average exit. Keep initial stop as your risk reference for R. Note if you moved the stop, and why, as a rule check.
How do you journal missed trades?
Log them as “missed” with setup tag and timestamp. Write the reason in one sentence. Track a count per week. Missed trades often reveal process gaps like alerts, watchlist timing, or unclear triggers.
How do you journal news events and volatility?
Add two fields, “event risk” and “volatility state.” Mark high impact news within your holding window. Record spread at entry. Note abnormal slippage. This helps you separate strategy performance from execution conditions.
Paper journal or spreadsheet?
Use a spreadsheet for stats and filtering. Use paper only for pre-market planning or quick notes. If you like both, keep paper as input, then transfer key fields the same day. Do not split your core data across places.
How long should you keep a journal?
Keep it for your full trading life. For analysis, keep at least 50 to 100 trades per setup before judging edge. For execution work, review weekly. For strategy changes, review monthly, then compare before and after.
How often should you review your journal?
Do a 10 minute end-of-day check for rule breaks and data quality. Do a weekly review for setup stats and process compliance. Do a monthly review for equity curve, drawdowns, and whether your rules still fit market conditions.
What metrics matter most for improvement?
- Expectancy in R
- Win rate by setup
- Average win and average loss in R
- Maximum drawdown
- Rule compliance rate
- Time of day performance
How do you journal emotions without bias?
Use a fixed list and keep it short. Log “state” as calm, rushed, tired, angry, distracted. Then log what you did, like moved stop, chased entry, skipped plan. Treat emotions as inputs, not excuses.
What if journaling feels like too much work?
Reduce fields to the minimum set and use dropdowns. Auto-calc pips, R, and risk. Add a weekly checklist for “pre-market done” and “end-of-day done.” Fix friction points like screenshots, templates, and copy paste steps.
How do you journal if you use multiple strategies?
Tag every trade with strategy and setup. Keep rules and entry criteria in a reference sheet. Filter stats by strategy first, then by setup. Do not mix results across different risk models or trade management rules.
What if your journal shows repeated plan breaks?
Stop changing strategy. Fix the process. Identify the top two rule breaks, then add one control for each, like entry checklist, hard stop placement, or time filter. If you need examples, review common Forex trading mistakes.
Conclusion
Your journal has one job. Turn every trade into a repeatable decision process.
Track fewer fields, but track them every time. Focus on setup, risk, execution, and rule breaks. Then review on a schedule, not when you feel stuck. Weekly works. Monthly confirms the trend.
- Sort first. Filter by strategy and setup, then compare like with like.
- Measure what you control. Plan adherence, entry timing, stop placement, and position size.
- Fix process before strategy. If the same rule break repeats, add one control and test it for 20 trades.
Final tip. Build a one-page scorecard and update it after each session. If you want a clear list of recurring errors to tag in your journal, use this guide on common Forex trading mistakes.
-
-
- Expectancy (beats win rate)
- R-multiples (R) to normalize every trade
- Profit factor (PF)
- Average win, average loss, payoff ratio
- MAE and MFE (to tighten exits and stops)
- Drawdown (peak-to-trough) and recovery factor
- Rule adherence rate (and why it predicts your P and L)
- Cost analysis (spread, commission, slippage) by pair and strategy
- Quick metric table (copy into your journal)
-
- Simple starter template, 10 essential columns
- Intermediate template with tags, scoring, and review notes
- Advanced template with MAE/MFE, regime tagging, and dashboards
- Notion-style database layout
- Printable one-page journal sheet for discretionary traders
- Screenshot library structure
- Dropdowns and data validation to prevent messy data
-
- Pre-trade plan example (bias, levels, invalidation, triggers)
- Execution example (entry type, stop placement logic, position sizing)
- Management example (when to move stop, partials, and what rules were used)
- Post-trade review example (what to keep, what to change, next-time rule)
- How the same trade looks in R, MAE/MFE, and adherence scoring
-
- Building the Habit: A 10-Minute Journaling Routine for Traders
- Pre-market (3 minutes): bias, key levels, news risk
- Post-trade (5 minutes): log, screenshot, one-sentence lesson
- End-of-day (2 minutes): quick stats and error count
- Weekly accountability: one improvement goal, one rule to focus on
- Use reminders, templates, and friction reduction to stay consistent
-
- What is a Forex trading journal?
- Should you journal every trade?
- What should you track at minimum?
- How do you track risk and position size correctly?
- What is R multiple and why use it?
- How do you journal trades with multiple exits?
- How do you journal missed trades?
- How do you journal news events and volatility?
- Paper journal or spreadsheet?
- How long should you keep a journal?
- How often should you review your journal?
- What metrics matter most for improvement?
- How do you journal emotions without bias?
- What if journaling feels like too much work?
- How do you journal if you use multiple strategies?
- What if your journal shows repeated plan breaks?
-
-
-
- Expectancy (beats win rate)
- R-multiples (R) to normalize every trade
- Profit factor (PF)
- Average win, average loss, payoff ratio
- MAE and MFE (to tighten exits and stops)
- Drawdown (peak-to-trough) and recovery factor
- Rule adherence rate (and why it predicts your P and L)
- Cost analysis (spread, commission, slippage) by pair and strategy
- Quick metric table (copy into your journal)
-
- Simple starter template, 10 essential columns
- Intermediate template with tags, scoring, and review notes
- Advanced template with MAE/MFE, regime tagging, and dashboards
- Notion-style database layout
- Printable one-page journal sheet for discretionary traders
- Screenshot library structure
- Dropdowns and data validation to prevent messy data
-
- Pre-trade plan example (bias, levels, invalidation, triggers)
- Execution example (entry type, stop placement logic, position sizing)
- Management example (when to move stop, partials, and what rules were used)
- Post-trade review example (what to keep, what to change, next-time rule)
- How the same trade looks in R, MAE/MFE, and adherence scoring
-
- Building the Habit: A 10-Minute Journaling Routine for Traders
- Pre-market (3 minutes): bias, key levels, news risk
- Post-trade (5 minutes): log, screenshot, one-sentence lesson
- End-of-day (2 minutes): quick stats and error count
- Weekly accountability: one improvement goal, one rule to focus on
- Use reminders, templates, and friction reduction to stay consistent
-
- What is a Forex trading journal?
- Should you journal every trade?
- What should you track at minimum?
- How do you track risk and position size correctly?
- What is R multiple and why use it?
- How do you journal trades with multiple exits?
- How do you journal missed trades?
- How do you journal news events and volatility?
- Paper journal or spreadsheet?
- How long should you keep a journal?
- How often should you review your journal?
- What metrics matter most for improvement?
- How do you journal emotions without bias?
- What if journaling feels like too much work?
- How do you journal if you use multiple strategies?
- What if your journal shows repeated plan breaks?
-
-
Forex Lot Size Calculator: How to Use It to Size Trades Correctly
1 month ago -
How to Calculate Position Size in Forex (Position Sizing Formula + Examples)
1 month ago -
Forex Leverage Explained: How It Works, Pros, Cons & Examples
1 month ago -
Margin vs Leverage in Forex: What’s the Difference?
1 month ago -
What Is Forex Trading? A Beginner’s Guide to How It Works
2 months ago
-
Forex Trading Platforms Comparison: MetaTrader vs cTrader vs TradingView
2 months ago -
Forex Market Hours & Trading Sessions Explained (Best Times to Trade)
2 months ago -
Forex Leverage Explained: How It Works, Pros, Cons & Examples
1 month ago -
Is Forex Trading Legal in the United States? Rules, Regulators & What to Know
2 months ago -
What Is a Lot Size in Forex? Lot Types + Quick Examples
2 months ago