Forex Liquidity Explained: What It Is and Why It Matters

Liquidity decides how easily you can enter and exit a forex trade, and what it will cost you. High liquidity usually means tighter spreads and steadier fills. Low liquidity can mean wider spreads, slippage, and price gaps.
Forex liquidity is the depth of buyers and sellers in a currency pair at different prices. It measures how much you can trade without moving the market.
In this guide, you will learn what liquidity is, what drives it across sessions and news events, who supplies it, and how it shows up in spreads and execution. You will also learn simple ways to spot thin conditions before you place an order, and how to adjust your risk using position sizing.
Key Takeaways
Key Takeaways
- In het kort: Liquidity is how easily you can buy or sell a currency pair without shifting price.
- In het kort: More liquidity usually means tighter spreads and fewer execution surprises.
- In het kort: Less liquidity usually means wider spreads, more slippage, and partial fills.
- In het kort: Liquidity changes by session, overlap, news releases, and holidays.
- In het kort: You can reduce damage in thin markets with smaller size, wider stops, and fewer market orders.
- Liquidity is order depth. It is buyers and sellers at many prices, not “volume” alone.
- The London and New York overlap tends to deliver the best execution conditions on major pairs.
- Liquidity can vanish around high impact news. Spreads can widen in seconds.
- Major pairs usually stay more liquid than minors and exotics. Exotics can gap and slip more.
- Watch the spread, order execution speed, and sudden price jumps. These often signal thin conditions.
- Use position sizing to match conditions. Review lot size basics before you scale up.
- Plan entries with limits when liquidity looks weak. Avoid large market orders near session opens, closes, and rollovers.
Forex liquidity: definition and core concepts
What traders mean by “liquid” vs “illiquid” markets
Liquidity means you can buy or sell a pair fast, close to the price you see, with small spreads and low slippage.
Illiquidity means fewer available quotes and smaller order sizes at each price. Spreads widen, fills slow down, and your execution price can drift.
- Liquid conditions, tight spreads, fast fills, small slippage.
- Illiquid conditions, wide spreads, partial fills, bigger slippage, more gaps.
Liquidity vs volatility vs volume
Traders mix these terms. They measure different things.
- Liquidity is execution quality, how easily price can absorb your order.
- Volatility is price movement speed and range. High volatility can happen in both liquid and illiquid conditions.
- Volume is activity level. In spot FX you often see tick volume, not true centralized volume.
High volume often supports liquidity, but it does not guarantee it. During news, activity can spike while liquidity drops. Spreads widen and slippage rises even as price moves fast.
Market depth, order flow, and the bid-ask spread
Market depth is how much buy and sell interest sits at different prices. More depth means price can handle bigger orders with less movement.
Order flow is the stream of market orders and limit orders hitting the book. It shifts the best bid and best ask, and it consumes depth.
Bid is the best price buyers offer. Ask is the best price sellers demand. The spread is the gap between them.
- Tight spread often signals strong competition among liquidity providers and decent depth.
- Wide spread often signals weak depth, higher risk, or fewer active providers.
- Slippage rises when your order size exceeds depth near the top of book.
Liquidity risk: the hidden cost behind many trading losses
Liquidity risk is the risk that you cannot enter or exit at your expected price. You pay for it through spread, slippage, and missed fills.
- Spread cost, you start the trade negative by the spread size.
- Slippage cost, your fill comes worse than your order price, common in fast markets.
- Stop execution risk, stops can fill far from the trigger in thin conditions.
- Position size risk, larger size increases your impact and your average fill price.
Liquidity risk scales with leverage. A small execution hit can become a large account hit when your margin is thin. Review the basics of margin vs leverage before you increase size.
Why forex liquidity matters to your trading results
How liquidity influences spreads and total transaction costs
Liquidity sets your spread. High liquidity brings tighter bid and ask quotes. Low liquidity widens them.
Your real cost is spread plus execution. You pay it every time you enter and exit. That cost decides if a small edge survives.
- Spread cost: a wider spread raises your break-even point.
- Market impact: larger orders push you into worse prices when the book is thin.
- Variable spreads: brokers widen spreads when liquidity drops, often around session transitions and news.
Track it in pips and money. Example, 1 lot on EUR/USD, 1 pip is about $10. If the spread widens from 0.8 to 2.0 pips, your round-trip break-even moves by about 1.2 pips, or $12 per lot, before slippage.
Slippage and partial fills, what causes them in fast markets
Slippage happens when the next available price differs from the price you clicked. It increases when price moves fast and the order book thins.
- News spikes: quotes update faster than your order can route and fill.
- Liquidity gaps: fewer resting orders sit at each price level.
- Queue position: other orders reach the same level first.
- Order size: bigger size consumes more levels, raising your average fill price.
Partial fills show up when your broker fills part of your size at one level and the rest at worse levels, or delays the remainder. You see this more with larger tickets, cross pairs, and off-peak hours.
Stop-loss behavior in thin markets (gaps, spikes, and stop runs)
A stop-loss becomes a market order when it triggers. In thin liquidity, the market order can fill far from your stop price.
- Gaps: price jumps over levels. Your stop triggers, but no liquidity exists near the trigger.
- Spikes: a brief liquidity vacuum prints extreme prices, then snaps back. Your stop can fill at the extreme.
- Stop runs: clustered stops sit around obvious highs and lows. Fast orders sweep those levels, then liquidity returns.
Plan your risk with fill risk in mind. If your stop sits inside a thin zone, your realized loss can exceed your modeled loss. This matters most when you trade leveraged size or hold into scheduled releases.
Strategy fit, scalping and day trading vs swing trading in different liquidity conditions
Liquidity decides which styles function and which styles bleed.
- Scalping: needs tight spreads, fast fills, and stable depth. A 1 to 3 pip slip or spread jump can erase the trade.
- Day trading: tolerates some spread movement, but still depends on clean execution near key levels.
- Swing trading: handles wider spreads, but faces gap risk and stop execution risk around news and weekends.
Match your timeframe to the trading hour. Focus your active trading during the most liquid overlaps for your pair, then reduce size or widen assumptions during thin hours. If you need ideas, start with these high-liquidity, low-spread pairs.
Who provides liquidity in the forex market (and how pricing is formed)
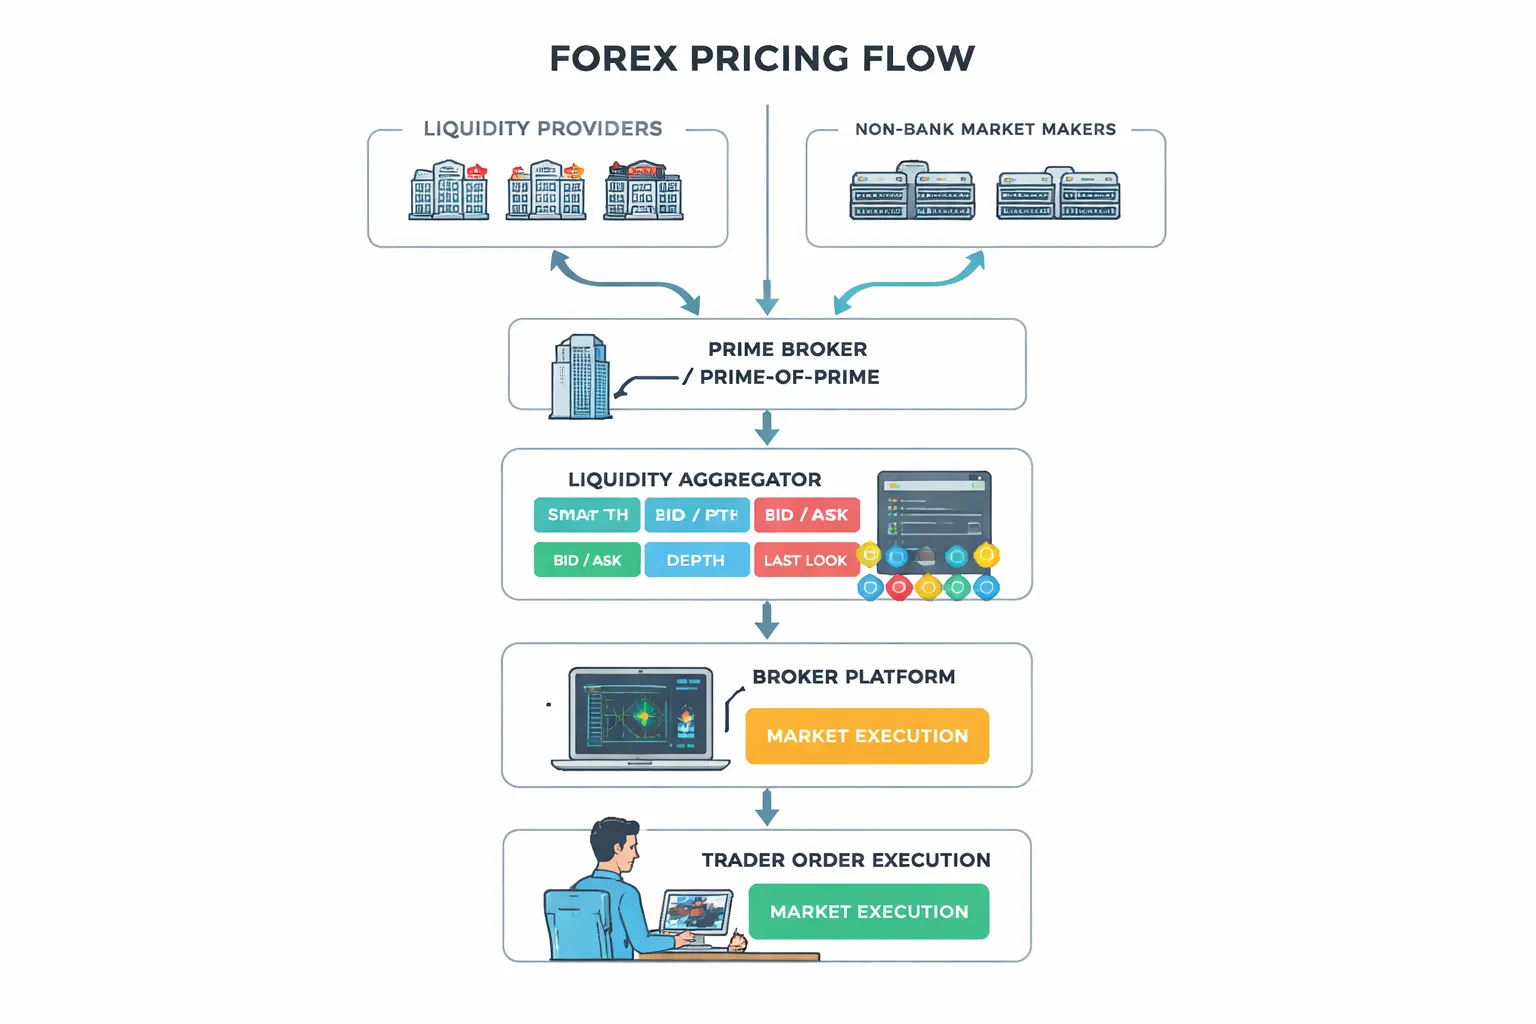
Liquidity providers explained: banks, non-bank market makers, and prime brokers
Forex liquidity comes from institutions that quote two-way prices and take the other side of trades.
- Tier-1 banks. They stream bid and ask prices to each other and to large clients. They set much of the top-of-book pricing in major pairs during liquid hours.
- Non-bank market makers. Large trading firms that quote tight prices and manage risk with hedging. They often dominate pricing in many broker feeds because they stream fast and consistently.
- Prime brokers (PB) and prime-of-prime (PoP). They provide credit lines and market access. They let brokers, funds, and prop firms trade with banks and non-banks without each client having a direct relationship.
Pricing forms from many streams at once. Each provider updates quotes based on its inventory, risk limits, volatility, and hedge costs. When volatility jumps, providers widen spreads or reduce size at each price level. You see this as thinner order books and faster price gaps.
ECN/STP vs market maker models: what it can mean for execution quality
Your broker model shapes how your order gets filled.
- ECN/STP. Your broker routes your order to external liquidity. You often see variable spreads and possible positive slippage. You can also get partial fills when size exceeds available liquidity at the top price.
- Market maker (B-book or hybrid). Your broker can fill you internally at its quoted price. Spreads can look stable in calm markets. Execution quality depends on the broker’s risk controls and how it hedges, or does not hedge, your flow.
Neither model guarantees better fills. What matters is the execution policy, the depth behind the quote, and how the broker handles fast markets. If you trade around news, your risk rises on both models because liquidity providers pull size and widen spreads.
Aggregators and smart order routing: how quotes get to your platform
Your platform rarely connects to one source. It usually connects to an aggregator that combines multiple liquidity streams.
- The aggregator receives quotes and available sizes from banks and non-banks.
- It builds a consolidated order book, ranked by best price, then by available size and fill probability.
- It uses smart order routing to split your order across venues when needed. This can reduce market impact but can increase the chance of partial fills.
The best bid and ask you see is the current top of that consolidated book. The spread reflects competition between providers, plus the broker markup if it adds one. Depth matters more than the top quote if you trade larger size. A 0.2 pip spread means little if only a small amount sits at that price.
Last look, requotes, and execution policies traders should understand
Fast execution depends on rules. You need to know these terms before you judge slippage.
- Last look. Some liquidity providers get a short window to accept or reject a trade after you hit the price. They may reject fills that look toxic to them, such as latency arbitrage. This can reduce positive slippage for you and increase rejects in fast markets.
- Requotes. Common with instant execution models. The broker refuses the fill at the requested price and offers a new price. This often happens when price moves faster than the broker’s dealing system.
- Market execution. Your order fills at the best available price when it reaches the market. You can get positive or negative slippage. You avoid classic requotes, but you still face slippage and partial fills.
- Slippage controls. Some platforms let you set a maximum deviation or use limit orders to control price. Limits reduce slippage risk but increase miss risk.
Read your broker’s execution policy and trade terms. Focus on reject rates, fill speed, and how often you see partial fills during high volatility. If you size up, do it with lot sizing that matches real depth, not the top-of-book quote. Use this lot size guide to keep your risk consistent: lot sizing.
| Term | What it means for your trade | What you usually see |
|---|---|---|
| Depth | How much liquidity sits behind the best price | Small orders fill clean, larger orders slip or partially fill |
| Variable spread | Spread expands when liquidity thins | Wider costs during news, rollover, and off-hours |
| Last look | Provider can reject after you hit the quote | More rejects, less positive slippage in fast moves |
| Market execution | Fills at best available price on arrival | Slippage, partial fills, fewer classic requotes |
What drives liquidity up or down in forex
Trading sessions and overlaps
Liquidity follows the clock. It rises when more banks, funds, and dealers quote two-way prices at the same time.
- London session: Deepest liquidity for EUR, GBP, CHF pairs. Tight spreads and better fill quality.
- New York session: Strong liquidity for USD pairs. It peaks in the first half of the session.
- London to New York overlap: The main liquidity window. Highest volume, most competing quotes, most stable depth.
- Asia session: Stronger in JPY, AUD, NZD. Thinner for many EUR and GBP crosses, unless a catalyst hits.
- Late New York: Liquidity fades. Spreads widen and slippage risk rises.
If your strategy depends on tight spreads and clean execution, align your trading and your timeframes with the most liquid hours.
Major economic releases
News can drain liquidity before it hits. Providers pull quotes or reduce size to limit risk.
- Pre-release: Depth drops, spreads widen, and fill size shrinks. You see more partial fills.
- At release: Prices gap between levels. Slippage jumps because the next available price may sit far away.
- Post-release: Liquidity returns in stages. Depth rebuilds after volatility stabilizes.
High-impact events include CPI, jobs data, central bank rate decisions, and press conferences. Expect the widest spreads in the 1 to 5 minutes around the print, but the lead-up can start earlier.
Institutional rebalancing, fixings, and option expiries
Large flows move liquidity conditions even when no headline hits. You feel it as sudden spread changes and one-way price action.
- Month-end and quarter-end rebalancing: Funds hedge currency exposure after equity and bond moves. Liquidity can thin and directional flow can dominate.
- Fixings: The 4pm London fix often concentrates large benchmark orders. You can see short bursts of volatility and uneven depth.
- FX option expiries: Large strikes can pin price near a level, then release it. Dealers hedge dynamically, which can change depth fast as spot approaches the strike.
These events do not guarantee a move, but they raise execution risk because liquidity can shift without warning.
Weekends, holidays, and rollovers
Some thin-liquidity windows show up on every calendar. Spreads widen because fewer participants quote size.
- Weekends: Market close removes continuous pricing. Weekend risk often shows up as wider spreads late Friday.
- Holidays: When London or New York runs light, depth drops across many pairs. You get worse fills on stop orders.
- Daily rollover: Liquidity often thins around the end of the trading day as books reset and swaps apply. Spreads can expand for minutes, sometimes longer.
Keep position management tighter during these windows. Use smaller order size if you must trade them.
Risk-on, risk-off, and market stress
Liquidity depends on risk appetite. When volatility spikes, providers protect themselves.
- Risk-on: More carry and growth trades. Liquidity tends to look smoother, with tighter spreads in high-volume pairs.
- Risk-off: Flight to USD, JPY, CHF. Correlations rise, price moves compress into fewer levels, and depth can vanish on crosses.
- Stress events: Banks widen spreads, cut size, or step back. You see more slippage, more partial fills, and more rejected fills under last look.
During stress, your broker can still show prices, but depth behind the quote can be thin. Assume stops fill worse and reduce leverage accordingly.
Liquidity by currency pair: majors, minors, and exotics
Liquidity by currency pair: majors, minors, and exotics
Why majors usually trade tighter, and when they do not
Majors pair the most traded currencies. They attract banks, funds, and corporates all day. That flow creates deeper order books and tighter pricing.
You usually see the best liquidity in EURUSD, USDJPY, GBPUSD, USDCHF, USDCAD, and AUDUSD. Spreads often stay low in liquid sessions. Depth also holds up better when you trade larger size.
Majors still lose liquidity when:
- Liquidity providers step back around top tier data releases.
- You trade during rollover, or late Friday, or holidays.
- Risk events trigger one way positioning and dealers widen spreads.
Your spread can look fine but fills degrade. Treat majors as liquid, not guaranteed.
Minors and crosses: common spread patterns and session sensitivity
Minors and crosses remove USD from one side. Liquidity often depends on overlap hours and regional market makers. You get good pricing when both currencies trade actively.
- EURJPY, GBPJPY often trade best during London and London to New York overlap. They can move fast, spreads can widen on spikes.
- EURGBP
- AUDJPY, NZDJPY
- CADJPY
Crosses show bigger spread jumps outside their home session. If you scalp, you feel it first. If you swing trade, you still pay it on entries, exits, and stop fills.
Exotics: wider spreads, jump risk, and practical trade sizing
Exotics include EM currencies and smaller markets. Typical examples include USDTRY, USDZAR, USDMXN, and USDTHB. Liquidity concentrates in local hours and can disappear fast.
Expect:
- Wider spreads and larger markups versus majors.
- More gaps and jump moves, especially around local policy headlines.
- More slippage and more partial fills on market orders and stops.
- Higher carry effects and larger day to day range swings in stress.
Trade smaller. Use limit orders when you can. Place stops with more room, or use smaller leverage so a bad fill does not break your risk plan. Check pip value before you size, because the same lot can mean very different dollar risk across pairs. Use a pip value calculator if you want quick numbers.
How to choose pairs based on your strategy and time zone
Match the pair to your trading window. Trade when both currencies have active participants.
- Scalping: focus on majors in their peak sessions. Avoid exotics. Avoid thin hours and rollover.
- Day trading: majors and the most liquid crosses. Prefer London and New York overlap for tighter spreads and better fills.
- Swing trading: majors and select crosses. You can trade off hours, but size for worse stops and wider spreads in gaps.
- Asia time zone: consider USDJPY, AUDUSD, NZDUSD, AUDJPY. Treat GBP and EUR crosses with caution until London opens.
- Europe time zone: EURUSD, GBPUSD, EURGBP, EURJPY tend to show strong liquidity in London.
- US time zone: EURUSD and USDJPY stay active, USDCAD often improves around US and Canada events.
| Pair group | Typical liquidity | Spread behavior | Best trading windows | Main risk to manage |
|---|---|---|---|---|
| Majors | High | Tight most of the day, widens on news and thin hours | London, New York, overlap | Slippage during data and risk events |
| Minors and crosses | Medium | Wider than majors, more session dependent | Home sessions for both currencies | Spread spikes outside core hours |
| Exotics | Low to variable | Wide, can gap, can reprice fast | Local market hours, avoid off hours | Jump risk, poor stop fills, liquidity dropouts |
How to measure liquidity as a retail trader (practical toolkit)
Using spread behavior as a real-time liquidity gauge
Your spread is your quickest liquidity read. Tight, stable spreads usually mean deep, active pricing. Wide, jumpy spreads usually mean thin liquidity.
- Track the typical spread by session. Note the median spread during London, New York, and overlap. Compare today to your baseline.
- Watch spread stability, not one print. A liquid market holds the spread steady through normal ticks. An illiquid market flickers between tight and wide quotes.
- Measure spread in pips and in cost. Convert to money for your position size. A 0.8 pip spread on 1 lot is not the same pain as 0.8 pips on 0.1 lots, but it still signals conditions.
- Expect spread expansion at known weak points. Late New York, early Asia, and holidays. Session awareness matters, use a clear schedule from forex market hours.
Depth-of-market and Level II, what you can and can’t infer in FX
FX has no single centralized order book. Your DOM shows your broker’s or venue’s view. It can help, but it cannot prove total market liquidity.
- You can infer: whether your broker has stacked quotes near price, whether available size looks thin, and whether price gaps appear between levels.
- You cannot infer: true global depth, the full set of resting orders, or the real liquidity across banks and ECNs.
- Practical use: treat DOM as an execution tool. If depth looks patchy and levels jump, reduce size or avoid market orders.
- Broker model matters: on some platforms, DOM is simulated or limited. If you cannot match DOM shifts to spread and fills, do not rely on it.
Volume proxies (tick volume) and correlation with liquidity
Spot FX does not publish consolidated volume. Tick volume counts quote updates. It often correlates with activity and liquidity, but it is still a proxy.
- Use tick volume as a relative gauge. Compare current hour versus the same hour over the last 20 sessions.
- Confirm with spread. Rising tick volume with stable spreads often signals healthy liquidity. Rising tick volume with widening spreads can signal stress or news flow.
- Compare pairs. If EURUSD tick volume rises while your cross stays flat, the cross may stay thin even if the market feels busy.
- Do not treat low tick volume as a trade signal. Treat it as a cost and execution warning.
Execution metrics to track: fill speed, slippage rate, and spread-to-ATR ratio
Liquidity shows up in your fills. Track it like performance data. Keep a simple log for 50 to 200 trades.
| Metric | How to measure | What “good” tends to look like | What it usually means |
|---|---|---|---|
| Fill speed | Time from order send to fill confirmation, in ms or seconds | Consistent and fast during active sessions | Deeper quoting and smoother routing |
| Slippage rate | (Average fill price minus requested price) in pips, track separately for buys and sells | Near zero for limit orders, small and stable for market orders | Thin top-of-book or fast price changes |
| Slippage frequency | % of trades with slippage worse than your threshold, such as 0.2 or 0.5 pips | Low and stable outside news | Liquidity gaps, latency, or broker filtering |
| Spread-to-ATR ratio | Current spread divided by ATR, use ATR(14) on your trading timeframe | Lower is better, stable is better | High ratio means costs dominate movement |
- Spread-to-ATR is your cost filter. If the spread eats a large share of typical movement, you need cleaner conditions or a different pair.
- Separate normal hours from event hours. Keep two baselines, regular sessions and high impact news windows.
- Log by pair and session. EURJPY can fill clean in London and degrade in late New York. Your data will show it.
Red flags: abnormal spread widening, frequent requotes, and inconsistent fills
Bad liquidity leaves fingerprints. You see them in the quote stream and in execution.
- Spread widens without movement. Price barely moves but spreads jump and stay wide. Liquidity pulled, risk controls tightened, or session is thin.
- Spread widens on small market orders. Your order size is small but the fill prints far from the quote. Top-of-book depth may be thin.
- Frequent requotes or order rejects. You lose control of entry price. Treat this as an execution risk, not a market skill issue.
- Asymmetric slippage. You get negative slippage often, positive slippage rarely. Track it. If the pattern persists, review broker and order type.
- Inconsistent fills at the same time of day. One day fills fast, next day fills slow, with no session change. That can signal unstable liquidity access.
- Platform “freezes” during spikes. Quotes pause, then jump. Reduce size, avoid market orders, or stand aside during those windows.
How to trade more effectively in different liquidity conditions
Timing your trades around session overlaps and known thin periods
Liquidity changes by the hour. Build your plan around the clock, not just the chart.
- Best average liquidity: London session, New York session, and the London to New York overlap. You usually get tighter spreads and faster fills.
- Thin and jumpy: late New York, the rollover window, early Asia, and most market holidays. Expect wider spreads and more stop runs on less volume.
- Pair selection matters: majors usually hold depth better than minors and exotics. If you trade thinner pairs, reduce size and avoid market orders during thin hours. See major vs minor vs exotic currency pairs.
- Keep a liquidity log: record spread, slippage, and fill time by hour and day. After 50 to 100 trades, you will see patterns you can trade around.
News-risk playbook: orders, brackets, and when to stay flat
Scheduled news can erase liquidity for seconds. Spreads can widen and price can gap between ticks.
- Tier your calendar: treat central bank decisions, CPI, jobs data, and surprise headlines as high risk. Treat second tier data as moderate risk.
- Define your rule set: stay flat X minutes before and after high risk releases, or trade smaller with hard limits. Write the rule and follow it.
- Avoid market orders into the print: you hand control of price to the market when spreads widen fastest.
- Use brackets when you do trade: enter with a predefined stop and take profit. Do not “manage” during the spike if your platform or fills degrade.
- Skip the first move if execution is unstable: wait for spreads to normalize and for quotes to update smoothly before you re-engage.
Position sizing and stop placement to reduce liquidity-related whipsaws
Low liquidity turns normal noise into stop hits. You need more room or less size.
- Size down when spreads widen: if the spread doubles, your risk rises before price even moves. Cut position size to keep the same dollar risk.
- Place stops beyond obvious levels: thin books get swept around round numbers and prior highs and lows. If your edge needs tight stops, trade only in deep hours.
- Use volatility-based distance: set stops from recent average range, not from a fixed pip number. Keep the same risk per trade.
- Plan for slippage: assume worse fills on stops during fast markets. Add a slippage buffer to your risk math.
Order types and execution tactics: market vs limit vs stop orders
Your order type decides how you pay for liquidity.
- Market orders: fastest entry, weakest price control. Use them in high liquidity windows and for small size. Avoid them in thin periods and during news.
- Limit orders: strongest price control, no guarantee of fill. Use them when spreads are wide or when you want to avoid negative slippage.
- Stop orders: they turn into market orders when triggered. Expect slippage in spikes. Do not place clustered stop entries around obvious levels during thin hours.
- Stop-loss orders: treat them as an emergency exit, not a precise price. Your stop price is not your fill price in fast markets.
- Execution tactic: when you must trade size, split entries. Two smaller fills often beat one large fill in marginal liquidity.
Backtesting with realistic costs: modeling spreads and slippage
Most backtests fail because they ignore liquidity costs. Fix that before you trust any result.
- Use time-based spreads: model spreads by session and hour. Do not use a single average spread.
- Add slippage by order type: assign larger slippage to stop orders and smaller slippage to limits. Increase slippage during news windows.
- Stress test thin periods: run a version that blocks trading during rollover and major holidays. Compare results.
- Track distribution, not just the mean: record the worst 5 percent of spreads and slippage. Those trades drive drawdowns.
- Validate with live data: compare your modeled costs to your real fills. Update the model until the gap shrinks.
| Liquidity condition | Common symptoms | What to do |
|---|---|---|
| High liquidity, normal spreads | Tight spreads, stable quotes, fast fills | Use market or limit orders, trade normal size, keep stops aligned with volatility |
| Thin liquidity, wider spreads | Slow fills, more wick noise, stops get clipped | Reduce size, prefer limit orders, widen stops or stand aside |
| News spike, unstable liquidity | Spread blowouts, gaps, heavy slippage | Stay flat, or trade small with strict brackets, avoid market orders into the release |
Broker and liquidity provider considerations (what to check before funding)
Execution model transparency, STP and ECN claims vs reality
Check how your broker routes orders. Do not rely on a badge that says STP or ECN.
- Ask if the broker is a principal or an agent. A principal can take the other side of your trade. An agent routes to external liquidity.
- Ask for the execution venue. You want to know if fills come from a pool of liquidity providers, an internal book, or a hybrid setup.
- Look for “last look” language. Last look can mean more rejects and more slippage during fast markets.
- Check order types. True market execution should allow partial fills. Instant execution with requotes often signals more dealer control.
- Verify with your own data. Run small trades at different times. Log fill time, slippage, and rejects.
Typical vs minimum spreads, how to evaluate real costs
Minimum spreads sell accounts. Typical spreads hit your P and L.
- Use average spread data. Look for a broker page that shows average spreads by instrument and session, not “from 0.0”.
- Calculate all in cost. Add spread plus commission. Compare it in pips, not marketing terms.
- Test during your trading hours. Spreads change by session, rollover, and holidays. Measure what you actually pay.
- Watch for spread floors. Some brokers widen more than peers outside peak hours. That matters if you hold trades overnight.
| What you see | What to check |
|---|---|
| “From 0.0 pips” | Average spread plus commission, by symbol, during London and New York. |
| “No commission” | Wider spread and how it behaves at rollover and news. |
| “Raw spreads” | Commission schedule, minimum trade size for that pricing, and any markup on swaps. |
Liquidity during stress, what to look for in policies and disclosures
Liquidity breaks when you need it most. Your broker’s rules decide how bad it gets.
- Execution policy. Read how they handle fast markets, gaps, and price spikes.
- Requote and reject rules. Check when they can reject an order, and how they define “off market” prices.
- Stop and limit handling. Confirm if stops trigger on bid, ask, or last price. Confirm if limit orders can get price improvement.
- Maximum slippage settings. Some platforms let you cap slippage. If the broker disables it, note that.
- Trade protection language. “Price filtering” and “liquidity protection” often means discretionary fills.
If you want a deeper breakdown of slippage mechanics and how to track it, read this guide to slippage in forex.
Regulation, segregation of funds, and conflicts of interest
Liquidity and execution do not matter if you cannot trust custody and reporting.
- Regulator and entity. Verify the exact legal entity you will fund. A brand can have multiple entities with different rules.
- Segregated client money. Confirm segregation, where funds sit, and what happens in insolvency.
- Negative balance protection. Check if it applies to your entity and your instruments.
- Dealing desk disclosure. If the broker internalizes flow, you face a direct conflict. That does not always mean “bad”, it means you need tighter standards on fills and disputes.
- Complaint and audit trail. You want clear trade logs, timestamps, and a process for execution complaints.
Questions to ask support before you fund
- Do you publish slippage stats by symbol and time of day, split into positive and negative slippage.
- What is your fill policy for partial fills, rejects, and requotes.
- Do you use last look, and if yes, what is the typical hold time.
- What trading restrictions apply, scalping, news trading, EAs, hedging, and minimum stop distance.
- What happens at rollover, typical spread widening, swap calculation method, and any swap markups.
- Can you provide execution reports with timestamps, requested price, filled price, and liquidity venue tags.
Common misconceptions about forex liquidity
Forex is always liquid
Liquidity depends on time, pair, and venue. It changes by the minute.
- Session overlap boosts depth. London and New York hours usually bring more quotes and bigger available size.
- Rollover drains depth. Around the daily reset, spreads can widen and fills can slow.
- News can remove bids and offers. Liquidity providers pull or reprice quotes when risk spikes.
- Some pairs stay thin. Exotic and some minor pairs often show less depth and larger gaps. See major vs minor vs exotic currency pairs.
If you trade size, you need to think in available volume, not just “market is open”.
Tight spread means safe
A tight quoted spread can hide weak liquidity. You only learn the truth when you hit the market with a real order.
- The spread can be tight, but the top of book can be small. You get partial fills or instant slippage when you trade more than the displayed size.
- Spreads can widen after you click. Fast markets reprice between request and fill, especially on market orders.
- Some brokers smooth quotes. They can show stable spreads, then apply last look, rejects, or requotes when volatility jumps.
- Look past spreads. Track fill price vs requested price, average slippage in pips, reject rate, and execution time. A tight spread with poor fills costs you more.
More leverage solves costs
Leverage does not reduce spread or slippage. It increases the damage when liquidity worsens.
- Bigger position size hits more levels. You consume more liquidity, so your average fill price moves against you.
- Small adverse moves become large account swings. A short liquidity gap can push you toward forced liquidation.
- Stops can slip. In thin conditions, your stop triggers, but the fill can land far from your level.
- Higher leverage raises margin pressure. It reduces your buffer when spreads widen at rollover or during news.
If you rely on high leverage, you rely on stable liquidity. That is a fragile plan.
Slippage is broker manipulation
Slippage has normal causes. Broker misconduct also exists. You need to separate market structure from bad practices.
- Normal slippage comes from price movement and limited depth. Quotes update, your order arrives, the best price is gone.
- Slippage can be positive or negative. If you only see negative slippage, that is a red flag.
- Last look changes outcomes. Some venues let liquidity providers accept or reject after seeing your order. That can increase rejects or worse fills in fast markets.
- Execution rules matter. Check how the broker handles market orders vs limit orders, stop orders, news trading, and rollover conditions.
- Ask for proof. Execution reports with timestamps, requested price, filled price, and venue tags help you spot patterns.
Judge slippage with data over many trades, not single events.
FAQ
What is forex liquidity?
Forex liquidity is how easily you can buy or sell a currency pair at stable prices. High liquidity means many active orders at multiple price levels. You get tighter spreads, fewer gaps, and more consistent fills. Low liquidity means fewer orders and more price jumps.
How can you tell if a pair is liquid?
Check average spread, spread at rollover, and spread during news. Track your fill speed and slippage in pips across 100 plus trades. Compare London and New York hours vs late session hours. Use a simple log with timestamp, pair, order type, and result.
Why does liquidity change during the day?
Liquidity follows where banks and large firms trade. It rises during London and the London New York overlap. It drops after New York and before Asia. Holidays reduce participation. News events can pull quotes and widen spreads even when volume rises.
Does high volume always mean high liquidity?
No. Volume can spike during news while liquidity drops. Many providers widen spreads or reduce size. You may see fast moves, thin order books, and more slippage. Focus on spread, available depth, and fill quality, not headline volume.
How does liquidity affect spreads?
More competing quotes tighten spreads. Less competition widens spreads. Spreads also widen when providers see higher risk, like during news, rollover, or unstable pricing. Track your typical spread by session and avoid placing market orders in your worst windows.
How does liquidity affect slippage?
Low liquidity increases the chance your order hits a worse price because fewer orders sit near the current quote. Slippage rises with market orders, larger size, and fast markets. Limit orders control price but can miss fills. Measure slippage in pips, then adjust timing and size.
What is market depth and why does it matter?
Market depth shows how much size you can trade at each price level. More depth means less price impact for your order. Low depth means a modest order can move price and cause multiple fills. Ask your broker if they offer depth of market data for your account type.
Which pairs have the most liquidity?
Major pairs usually lead, like EUR/USD, USD/JPY, and GBP/USD. They trade across all sessions and attract more institutional flow. Liquidity still varies by time and event risk. Do not assume a major pair stays liquid during rollover or major news.
How do I pick a broker if liquidity matters?
Prioritize execution transparency. Ask about liquidity sources, routing, and how they handle rejects. Review statistics on average spread, speed, and slippage. Request execution reports with timestamps. Test with small size across sessions, then scale only after you see stable results.
How should I size trades in low liquidity?
Reduce position size and avoid market orders when spreads widen. Split entries into smaller orders if your platform supports it. Place limits at planned levels and accept missed trades. Always compute costs in pips so you can compare sessions and brokers.
Learn how spread and slippage translate into pips so you can track liquidity costs with one metric.
Conclusion
Liquidity controls your real trading costs. It moves spreads. It drives slippage. It decides whether your stop fills at your price or a worse one.
Trade with liquidity, not against it. Focus on active sessions. Avoid thin hours, holidays, and major news seconds if you cannot handle fast fills. Use limit orders for entries. Use wider stops only if your risk plan allows it. Cut size when spreads widen.
Track liquidity with one number. Measure the all-in cost in pips for each trade, spread plus slippage. Log it by pair, session, and broker. Drop the times and pairs that bleed pips.
If you do not know your pip cost, you do not know your edge. Use a pip value calculator so every decision ties back to pips and risk.
-
Forex Market Hours & Trading Sessions Explained (Best Times to Trade)
4 months ago -
Forex Leverage Explained: How It Works, Pros, Cons & Examples
4 months ago -
What Is a Lot Size in Forex? Lot Types + Quick Examples
4 months ago -
How to Calculate Position Size in Forex (Position Sizing Formula + Examples)
4 months ago -
What Are Pips in Forex? Definition, Examples & Why They Matter
4 months ago
-
- Using spread behavior as a real-time liquidity gauge
- Depth-of-market and Level II, what you can and can’t infer in FX
- Volume proxies (tick volume) and correlation with liquidity
- Execution metrics to track: fill speed, slippage rate, and spread-to-ATR ratio
- Red flags: abnormal spread widening, frequent requotes, and inconsistent fills
-
- Timing your trades around session overlaps and known thin periods
- News-risk playbook: orders, brackets, and when to stay flat
- Position sizing and stop placement to reduce liquidity-related whipsaws
- Order types and execution tactics: market vs limit vs stop orders
- Backtesting with realistic costs: modeling spreads and slippage
-
- What is forex liquidity?
- How can you tell if a pair is liquid?
- Why does liquidity change during the day?
- Does high volume always mean high liquidity?
- How does liquidity affect spreads?
- How does liquidity affect slippage?
- What is market depth and why does it matter?
- Which pairs have the most liquidity?
- How do I pick a broker if liquidity matters?
- How should I size trades in low liquidity?
-
-
How to Place a Forex Trade Step by Step (Your First Trade Explained)
2 months ago -
Forex Trading vs Crypto Trading: Which Market Is Better for Beginners?
2 months ago -
Forex Lot Size Calculator: How to Use It to Size Trades Correctly
4 months ago -
How to Calculate Position Size in Forex (Position Sizing Formula + Examples)
4 months ago -
Forex Leverage Explained: How It Works, Pros, Cons & Examples
4 months ago
-
Is Forex Trading Legal in the United States? Rules, Regulators & What to Know
4 months ago -
Forex Market Hours & Trading Sessions Explained (Best Times to Trade)
4 months ago -
Forex Trading Platforms Comparison: MetaTrader vs cTrader vs TradingView
4 months ago -
Forex Leverage Explained: How It Works, Pros, Cons & Examples
4 months ago -
What Is a Lot Size in Forex? Lot Types + Quick Examples
4 months ago