Forex Market Manipulation: Myths vs Reality (What Traders Should Know)

Forex manipulation claims spread fast. They also cost you money if you trade on fear instead of facts.
Forex is a decentralised market. Prices come from many banks, brokers, and venues. That structure makes some tactics possible, but it also makes full market control hard. Most events traders call “manipulation” come from liquidity gaps, news shocks, and stop runs around obvious levels.
You will learn what manipulation means in FX, who can move price and when, and which “myths” fail under real market structure. You will also learn the patterns that trap retail traders, the data points that confirm or reject a manipulation claim, and the risk controls that limit damage when price spikes. You will leave with a practical checklist you can apply on your next trade.
Key Takeaways
- In het kort: Most “manipulation” you see in FX is liquidity seeking and stop runs around obvious levels, not a secret cartel moving price all day.
- In het kort: Price moves most during session opens, major news, and large option expiries. Thin liquidity makes spikes worse.
- In het kort: Big players can move price short-term. They still need liquidity. They cannot control direction for long without fresh flow.
- In het kort: You should label a move as manipulation only with evidence, sudden spread widening, abnormal slippage, clear time trigger, and fast mean reversion after stops clear.
- In het kort: Common retail traps are false breakouts, wick sweeps of prior highs and lows, and stop clusters near round numbers and session highs and lows.
- In het kort: Your defense is process, not predictions. Trade liquid hours, avoid obvious stops, size smaller near news, and use hard risk limits.
- In het kort: Position sizing matters more than being right. Use a fixed risk per trade and calculate size before you enter. See position sizing.
What “Forex Market Manipulation” Actually Means (and What It Doesn’t)
A practical definition for retail traders: intent, ability, measurable impact
Most traders use “manipulation” as a synonym for “a move I did not expect.” That is not useful.
Use a stricter definition. Call it manipulation only when three things line up.
- Intent. A participant tries to move price to a level that benefits their position.
- Ability. They can control enough order flow, liquidity, or information to influence execution.
- Measurable impact. You can see abnormal prints, abnormal spreads, abnormal slippage, or an abnormal deviation from comparable venues or correlated pairs.
If you cannot point to all three, treat it as normal price action under stress, low liquidity, or news.
Market microstructure basics: liquidity, spreads, slippage, and why price jumps happen
FX prices move because available liquidity changes. Liquidity is not a constant pool. It appears and disappears.
- Liquidity. How much you can buy or sell near the current price without moving it much.
- Spread. The cost of crossing from bid to ask. Spreads widen when liquidity providers pull quotes or demand more compensation.
- Slippage. The gap between your expected fill and your actual fill. Slippage rises when price moves faster than available quotes.
Price jumps when the order book thins. One market order can sweep multiple levels. A cluster of stops can do the same. During rollovers, session opens, and high impact news, liquidity providers widen spreads or step back. Your chart then prints fast candles and long wicks. That can look like a “hunt.” Often it is just thin liquidity meeting forced orders.
If you want the mechanics behind spread changes, read what spread means in forex.
The difference between price discovery and malicious behavior
Price discovery is the market searching for the next level where buyers and sellers agree.
It includes breakouts, failed breakouts, wick sweeps, and retests. It includes stop runs. Stops are liquidity. They sit as market orders waiting to trigger.
Malicious behavior is different. It uses deceptive or illegal tactics to mislead other participants or to distort a reference price.
- Price discovery examples. A fast move through a prior high during London open, spreads widen, stops trigger, price snaps back when liquidity refills.
- Malicious examples. Coordinated collusion to push a benchmark fix, spoofing on venues where it is possible, or manipulating a thin synthetic price feed.
As a retail trader, you rarely get proof of malicious intent from a chart alone. You can observe impact, you cannot observe motives.
Why the FX market is harder to manipulate than many traders think
Spot FX is large, fragmented, and competitive. That raises the cost of forcing price.
- Size. Daily turnover sits in the trillions of dollars. Moving a major pair for long requires sustained capital and risk.
- Fragmentation. There is no single exchange tape. Liquidity sits across banks, ECNs, prime brokers, and internalizers. Forcing price on one pool does not guarantee control elsewhere.
- Competition. Many professional firms arbitrage discrepancies fast. If one venue prints an off market price, others trade against it.
Manipulation risk rises at the edges. Thin hours. Exotics. Illiquid crosses. Broker specific pricing. This is why pair selection and trading hours matter. Majors in active sessions give you tighter spreads, deeper liquidity, and cleaner fills. For pair context, see major vs minor vs exotic currency pairs.
Bottom line. Most “manipulation” you feel is liquidity shifting, not a person targeting you. Your edge comes from trading where liquidity is stable, planning for spread and slippage, and keeping risk fixed.
Myths vs Reality: The Most Common Claims Traders Make
Myth: “Banks move price just to hit my stop”
Large players do not see your specific stop on most retail platforms. They see aggregate flow. They see liquidity.
Stops tend to cluster. They cluster above recent highs, below recent lows, and around round numbers. That creates liquidity pools. Price often moves into these areas because that is where orders sit and where size can execute.
What you experience as a “stop run” usually looks like this.
- Price approaches a known level with many resting orders.
- Liquidity thins right at the level, spreads can widen.
- A fast push triggers clustered stops, adding market orders to the move.
- Price snaps back once that pocket of liquidity clears.
Practical takeaway. Place stops where the trade idea breaks, not where most traders place them. Keep position size fixed so a wider stop does not force excess leverage. If you do use tight stops, trade only when liquidity is thick and spreads stay stable.
Myth: “Every spike is manipulation”
Many spikes come from volatility clustering. Volatility stays low, then compresses, then expands. The expansion often hits during news, session opens, and major level breaks.
Common drivers that create “spikes” without any illegal intent.
- Scheduled news, rate decisions, inflation prints, employment data.
- Session transitions, especially Asia to London, London to New York.
- Order book gaps in thin conditions, holidays, late Friday, early Monday.
- Stop clusters and breakout orders triggering at the same time.
Practical takeaway. Mark the economic calendar. Expect wider spreads and slippage around high impact releases. Reduce size, widen stops, or stay flat. Track your fills so you know when your broker’s execution degrades in fast markets. See slippage in forex for ways to reduce it.
Myth: “Brokers control the interbank market”
Your broker does not control the global FX price. The interbank market runs on many venues and many liquidity providers.
A broker can still affect your outcome.
- What a broker can influence. Your spread, your commissions, your swaps, your execution speed, and how it routes or internalizes orders.
- What a broker cannot influence. The global market direction, macro driven trends, and multi venue pricing across banks and ECNs.
Know the two common models.
- Market maker. The broker may take the other side of your trade. It can still hedge exposure. Conflicts exist, but regulation and competition limit obvious abuse.
- STP or ECN style routing. The broker routes orders to liquidity providers. You still face spread changes, rejections, and slippage in fast moves.
Practical takeaway. Judge a broker by data you can verify. Compare spreads during active sessions. Record slippage during news. Check execution policy, minimum distance for stops, and whether it uses last look. If fills worsen only when you trade larger size, your problem may be liquidity access, not “manipulation.”
Myth: “Indicators reveal the manipulators”
Most indicators lag. They summarize past price. They do not reveal intent.
Traders often label any losing setup as “smart money” activity because an indicator signaled late.
Use indicators for what they do well.
- Define trend and momentum so you avoid fighting strong directional flow.
- Measure volatility so you size trades and set stops with realistic ranges.
- Standardize entries and exits so you can test and refine a plan.
Do not use indicators as proof of illegal behavior. Use them as tools for consistency.
Reality check: when “unfair” does not equal “illegal”
FX can feel unfair because it is competitive and fast. That does not make it criminal.
“Unfair” usually means one of these is true.
- You traded during thin liquidity and paid a large spread.
- You traded through news and got slippage.
- Your stop sat in a common cluster near an obvious level.
- You used too much leverage and normal noise hit your risk limit.
Illegal manipulation exists. It tends to involve deception, collusion, or false orders intended to mislead other participants. Retail charts rarely give you enough evidence to prove it in real time.
| Claim | Reality | What you should do |
|---|---|---|
| “Banks hit my stop.” | Price seeks liquidity where orders cluster. | Place stops at invalidation points, avoid obvious clusters, size for wider stops. |
| “Every spike is manipulation.” | Volatility clusters around news, opens, and breaks. | Plan for calendar risk, reduce exposure in fast conditions, track slippage. |
| “My broker controls the market.” | Your broker controls execution terms, not global price. | Audit spreads and fills, understand the execution model, use regulated firms. |
| “Indicators expose manipulators.” | Indicators lag and cannot show intent. | Use indicators for structure and volatility, not conspiracy detection. |
| “Unfair equals illegal.” | Most pain comes from microstructure and risk mistakes. | Trade liquid hours, keep risk fixed, treat costs as part of the system. |
Who Could Manipulate FX (and Under What Conditions)?
Large dealers and liquidity providers, incentives and constraints
Top-tier banks and non-bank liquidity providers make prices and manage inventory. They earn from spread capture, internalization, and hedging efficiency. They lose if they hold the wrong risk when the market moves.
They can influence short-term price when liquidity thins and when client flow hits one side. That influence usually comes from normal microstructure, not a plan to target your stop.
- What they can do: widen spreads, reduce quote size, pull quotes, reprice fast, hedge aggressively after filling client flow.
- When it shows up: rollover, holidays, news seconds, late Friday, around major fix windows, during sudden risk-off moves.
- What limits them: competition across venues, prime brokerage credit limits, risk limits, surveillance, and the need to keep flow from large clients.
True manipulation requires intent and deceptive actions. Dealers face strong oversight in major centers. They still have room to act when liquidity is low and reporting is slow.
Institutional asset managers and hedgers, execution pressure around benchmarks
Asset managers, pension funds, corporates, and real-money accounts trade for portfolio rebalancing and hedging. They often execute at benchmark times to match index rules or reduce tracking error.
The key condition is predictable timing. The most watched window is the WM/Reuters 4pm London fix. Concentrated orders can move price into and through the window, even without illegal conduct.
- What they can do: create one-way demand, split orders across venues, use algorithms that chase liquidity near a benchmark.
- How it can hurt you: short bursts of trending price, then mean reversion after the window passes.
- What to watch: fix windows, month-end, quarter-end, large option expiries, major index rebalances.
If you trade intraday, treat benchmark windows as high slippage risk periods. Liquidity can look normal, then vanish.
High-frequency and algorithmic participants, speed advantages vs illegality
HFT and systematic firms compete on speed, routing, and inventory control. They arbitrage small price gaps across venues and timeframes. They can react in microseconds. You cannot.
Most of what you feel comes from adverse selection. You hit a quote, then price moves because faster firms updated first.
- What they can do: fade stale quotes, pick off slow streams, amplify short-term volatility during data releases.
- What crosses the line: spoofing and layering, wash trading, collusive messaging, manipulating reference rates.
- When it matters most: low latency venues, fast news, thin books, and around predictable liquidity pockets.
Speed is not illegal. Deception is. You protect yourself by avoiding the first seconds of major releases and by trading deeper liquidity sessions.
Retail brokers (market maker vs ECN/STP), where conflicts can occur
Your broker controls pricing, execution, and risk handling. The conflict risk depends on the model.
- Market maker: the broker may take the other side of your trade and manage exposure. Conflicts can arise through wider spreads, asymmetric slippage, and aggressive dealing rules during volatility.
- ECN/STP: the broker routes to external liquidity and earns via markup or commission. Conflicts shift to routing quality, last look exposure, and liquidity tier selection.
Bad outcomes often look like manipulation but come from rules and costs. Slippage, re-quotes, off-market fills, and stop execution depend on liquidity, order type, and venue.
You reduce broker risk by using regulated firms, reading execution policies, and understanding how liquidity and pricing work. Use this reference for structure, how FX pricing and execution works.
Social-media and signal-group actors in thin markets, coordinated rumor dynamics
Most major FX pairs resist retail-driven manipulation. Depth is too large. Thin conditions change that.
Microcap “FX-like” products, exotic pairs, and off-hours CFDs can move on coordinated messaging. So can minor pairs during holidays and late sessions. Rumors can push price when order books are shallow and spreads widen.
- What they can do: coordinate entries, spread false headlines, trigger momentum orders, then exit into the move.
- Best conditions for them: low volume hours, wide spreads, limited transparency, high leverage, low-quality venues.
- Your defense: avoid thin sessions, avoid exotics until you can measure costs, ignore “stop hunt” narratives, size positions so slippage does not break your risk.
| Actor | Real edge or leverage | Conditions that increase impact | What you do |
|---|---|---|---|
| Dealers and LPs | Inventory control, pricing access | Thin liquidity, news, fix windows | Trade liquid hours, expect wider spreads in stress |
| Asset managers and hedgers | Size, predictable benchmark timing | Fix, month-end, rebalances | Avoid benchmark bursts or reduce size |
| HFT and algos | Speed, cross-venue arbitrage | First seconds of releases, fragmented liquidity | Skip the initial spike, use limits when possible |
| Retail brokers | Execution control, dealing rules | High volatility, low liquidity, weak regulation | Choose regulation, read execution terms, test fills |
| Social groups | Coordination, rumor spread | Thin markets, exotics, off-hours | Stay in liquid pairs, ignore hype, cap risk |
Where Manipulation Risk Is Higher: Times, Places, and Instruments
Thin liquidity windows
Manipulation risk rises when fewer real orders sit in the book. Spreads widen. Stops sit closer to price. Small flows move the market more.
- Rollover (end of New York day). Liquidity drops, many brokers widen spreads, and swaps post. You see more spikes and stop runs. Trade smaller or skip this window if your strategy does not need it.
- Holidays. Banks and corporates step back. Market depth thins even if price still moves. Treat “open” markets as low quality markets. Use wider stops or do not trade.
- Late Friday. Liquidity drains before the close. Dealers reduce risk into the weekend. You can get sharp moves with no follow through. Avoid holding new positions unless you plan for weekend gaps.
- Session transitions. Liquidity shifts as regions hand off. The Tokyo to London overlap is often thin. The London open can whip because orders hit at once. Wait for spreads to normalize before you enter.
High impact events
Big releases create real price discovery. They also create the best cover for bad execution, stop runs, and slippage. The issue is not a secret cabal. The issue is speed, fragmented liquidity, and widened spreads.
- CPI and inflation data. One number can reprice rate expectations fast. Liquidity pulls before the release, then returns in bursts. Use limit orders if you must trade, or wait 2 to 10 minutes for the spread and spread-to-volatility to settle.
- NFP. You often get a first spike, then a reversal, then the real move. Stops near obvious levels get hit first. Reduce size, widen risk limits, or sit out.
- Central bank decisions and press conferences. The statement moves price, then the Q&A can flip it. If you trade it, plan two separate volatility waves. Do not add risk during the press conference unless you accept fast drawdowns.
- Surprise headlines. Geopolitics and unscheduled policy comments create gaps and broken liquidity. Your stop may fill far away. Keep leverage low if you hold positions through headline risk.
Fixings and benchmarks (WM/Reuters)
Fixings concentrate flow at specific times, especially the 4pm London fix. Asset managers and index trackers often need benchmark rates. That creates predictable demand to buy or sell near the fixing window.
- Why it matters. When many participants execute at the same time, price can swing as liquidity providers adjust. That move can look like manipulation, even when it is forced execution.
- Why it mattered historically. Past enforcement cases showed traders sharing client flow and coordinating around fix windows. Rules tightened, but the fixing still concentrates orders. The structure, not the conspiracy, creates the risk.
- What you should do. If you trade intraday, track fixing times and avoid placing tight stops right before them. If you must trade, use smaller size and accept wider variance in fills.
Crosses and exotics vs major pairs
Liquidity protects you. Majors usually have deeper markets, tighter spreads, and more competing liquidity providers. Crosses and exotics often do not.
- Majors. EUR/USD, USD/JPY, GBP/USD, USD/CHF often absorb large flows with less impact. You still see stop runs, but they need more volume to work.
- Crosses. Pairs like GBP/JPY or EUR/AUD can move fast because they inherit liquidity and volatility from two legs. Spreads can widen hard during news and session changes.
- Exotics. Pairs like USD/TRY or USD/ZAR can gap, reprice, or face sudden liquidity withdrawal. Local rules, capital controls, and fewer market makers add risk. Many brokers also apply wider markups and higher margin.
- Practical rule. If your edge depends on tight execution, stay in majors during liquid sessions. If you trade crosses or exotics, cut size and widen your risk limits. Use a position sizing plan you can repeat.
Crypto-style “pump and dump” vs FX reality
Classic pump and dump needs a thin market, a crowd that follows hype, and control over supply. That model fits many small tokens. It rarely fits major FX pairs.
- What is comparable. You can see coordinated rumors, short term squeezes, and stop runs in thin FX conditions. You also see influencer style hype in some retail communities around exotics and illiquid crosses.
- What is not comparable. No small group can “corner” EUR/USD for long. The market is too deep and too competitive. Big moves usually need real catalysts like rates, policy, or risk shocks.
- What you should watch. If the move happens in a thin window, on low depth pairs, with wide spreads, treat it as fragile. Do not chase. Cap your risk and demand clean execution terms from your broker.
For context on why FX structure differs from other markets, see forex vs stock trading differences.
Common Price Behaviors Mistaken for Manipulation (with Better Explanations)
Stop-runs and liquidity grabs, why sweeps happen near obvious highs and lows
Price often trades through the last swing high or low, then snaps back. Many traders call this a stop hunt. In most cases, it is order flow.
- Stops cluster at obvious levels. Retail and systematic traders place them in similar spots, just beyond highs, lows, and round numbers.
- Limit liquidity sits after the break. Bigger traders need counterparties. The cleanest pool sits where stops trigger and breakout orders fire.
- Dealers manage inventory. When client flow hits one side, liquidity providers widen or step back, then re-enter at better prices.
What you do. Treat obvious levels as liquidity zones, not lines. Size smaller into them. Wait for spread to normalize before you act. If your broker shows depth, watch how quickly it refills after the sweep.
False breakouts, breakout traders, mean reversion, and trapped positioning
Many breakouts fail because the first break attracts the same crowded trade. Price then runs out of new buyers or sellers.
- Breakout entries create one-way flow. Stops and stop entries add to the push. That push ends when the orders finish.
- Mean reversion strategies fade extremes. Real money and short-term funds often sell strength and buy weakness, especially in ranges.
- Trapped traders fuel the reversal. Late breakout buyers exit when price returns inside the range. Their exits add to the move back.
What you do. Define your breakout condition in advance, close and hold above the level, not a brief tick through it. If the candle closes back inside the range and spreads stay wide, treat it as exhaustion, not confirmation.
Long wicks and gap-like moves, spread widening and quote updates
Spot FX does not trade on one central exchange. Your chart prints from a stream of quotes. That creates spikes that look like gaps or wicks.
- Spreads widen when liquidity drops. Session changes, rollovers, and risk events reduce available quotes. A wider spread prints a longer wick.
- Quote updates arrive unevenly. A fast jump can reflect a new best bid or ask, not real volume through every price.
- Different feeds print different highs and lows. One broker may show a wick that another broker never prints.
What you do. Check the spread at the time of the wick. Compare the move across at least one other feed. If the wick only exists on one broker and coincides with a spread blowout, do not treat it as a market signal.
News spikes and whipsaws, repricing risk vs engineered moves
High-impact news forces a fast repricing. Liquidity providers protect themselves first. That creates sharp spikes and reversals.
- Quotes pull before data hits. Many providers reduce size or widen spreads because they cannot hedge during the release.
- Price jumps to the next liquidity pocket. If no one quotes in the middle, the next executable price can sit far away.
- Two-way whipsaws come from uncertainty. Algorithms react to headlines and revisions, then humans confirm, then hedgers rebalance.
What you do. Treat scheduled releases as execution risk, not pattern risk. Use hard limits, not market orders. If you must trade news, trade smaller and assume slippage. Make sure your broker terms cover re-quotes and negative slippage handling.
Correlation breaks between pairs, temporary dislocations and re-hedging flows
Pairs that usually move together can diverge for minutes or hours. Traders call it manipulation. Most of the time it is flow and hedging.
- Cross hedging distorts legs. EURUSD and USDJPY flows can move EURJPY even if one leg lags for a while.
- Real money rebalancing hits one pair. A large fix order, hedge roll, or options hedge can push a single pair off its usual path.
- Liquidity differs by pair and time. A major pair can hold tight spreads while a related cross gets thin and jumps.
What you do. Monitor the time window and session. If the break happens in a thin session, expect noise. If it happens during a major data release or a large risk event, expect re-hedging. Learn how liquidity shifts across sessions using this guide on forex liquidity.
How to Identify Forex Market Manipulation Myths vs Reality (A Trader’s Framework)
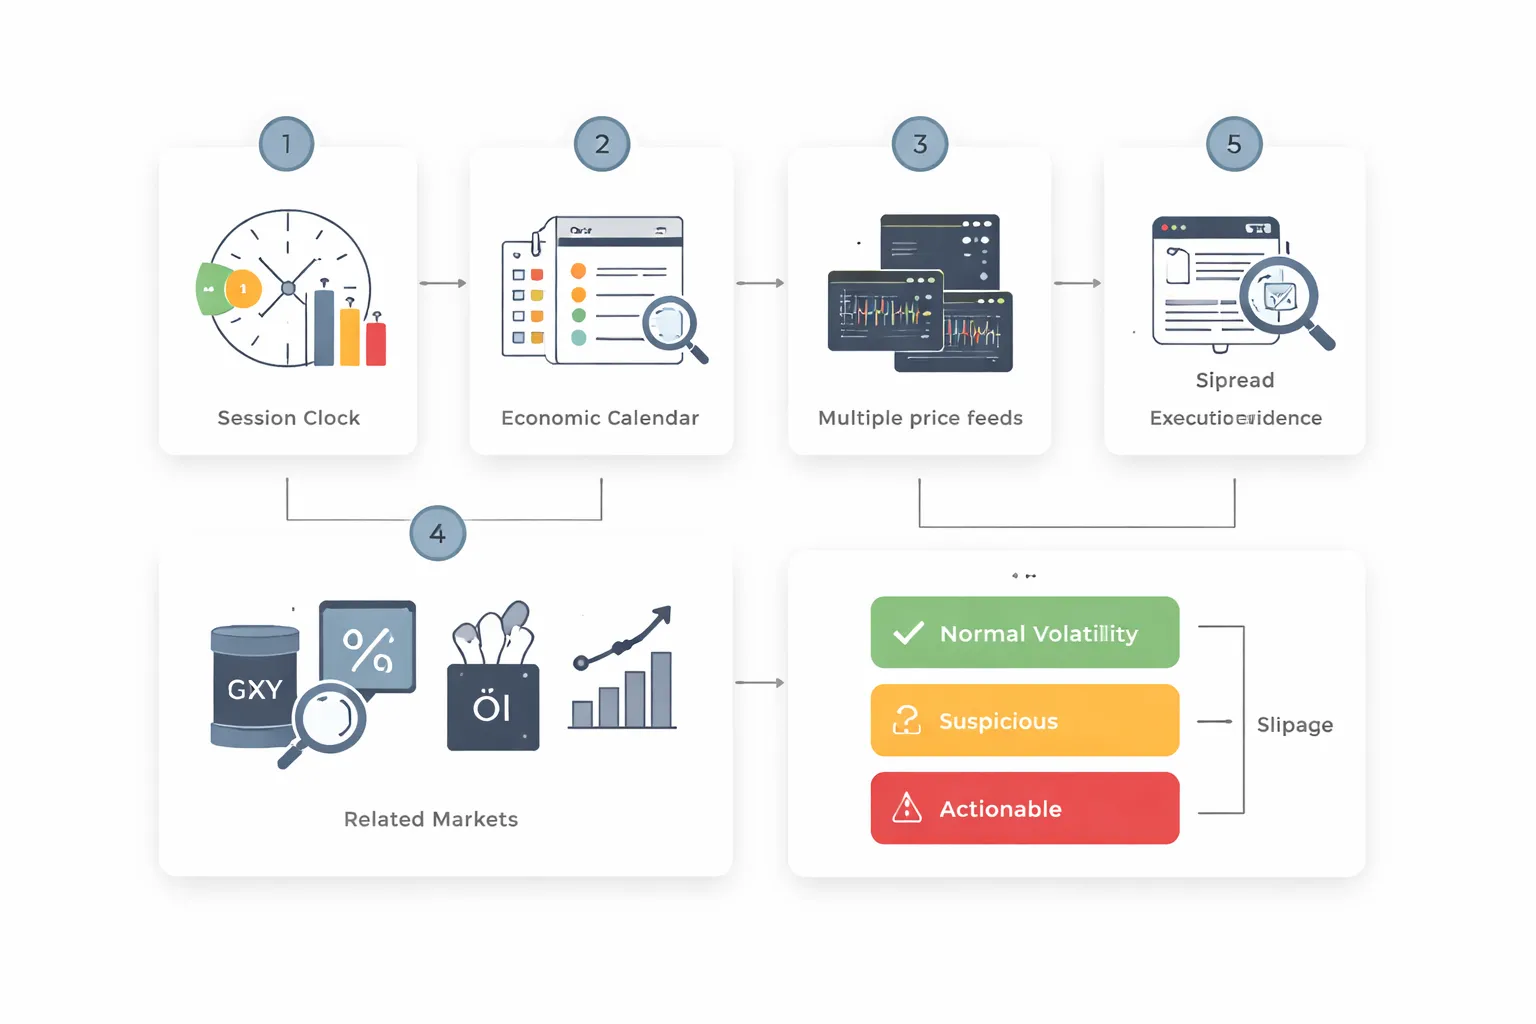
Step 1: Check the context
Start with conditions, not candles. Most “manipulation” claims fail here.
- Session and hour. Liquidity changes fast around roll, London open, New York open, and late US.
- Calendar risk. Red news, central bank speakers, auctions, and data revisions create gaps and whipsaws.
- Liquidity state. Holidays, pre weekend, post fix, and thin Asian hours widen spreads and distort prints.
- Positioning pressure. Watch obvious highs, lows, and clustered stops near round numbers. Stops exist, price will trade them.
- Market microstructure. Options expiries, the London fix window, and month end rebalancing can drive flows without “rigging.”
Step 2: Validate the move across sources
You need proof that the move exists in the market, not just in your broker feed.
- Check at least two feeds. Compare your broker to another broker, TradingView, or a paid institutional feed if you have it.
- Look for timing agreement. A real move hits most feeds within seconds. A single feed spike points to bad ticks or thin quoting.
- Compare multiple timeframes. A one minute spike that vanishes on five minute and fifteen minute often signals a transient quote issue. Use a timeframe that matches your holding period, see forex timeframes explained.
- Check bid and ask. Many screenshots hide the spread. A “stop hunt” can be a spread expansion that only hits the ask or bid.
Step 3: Compare related markets
Forex rarely moves alone. Cross checks cut through stories.
- DXY and broad USD pairs. If EURUSD spikes, look at GBPUSD, AUDUSD, USDJPY, and DXY. A USD driver usually shows up across the board.
- Rates. US 2Y and 10Y yields often lead USD. A yield jump explains many “random” breaks.
- Risk proxies. Check S and P futures, Nasdaq, and VIX behavior during the move. Risk off can hit high beta FX fast.
- Commodities. CAD tracks oil more than traders admit, AUD and NZD react to commodities and China risk. If oil moves hard, USDCAD can follow without any stop hunt story.
- Crosses and legs. If EURGBP moves, validate EURUSD and GBPUSD. Cross leg lag can create temporary distortions that look engineered.
Step 4: Inspect execution evidence
Separate price behavior from broker execution. Traders often confuse the two.
- Spread at the moment of entry and exit. Record the spread when you place orders, not after.
- Slippage direction. One bad fill means little. Repeated negative slippage on market orders, with limited positive slippage, signals asymmetric execution.
- Requotes and rejects. Log frequency during normal hours and during news. Many issues cluster in predictable windows.
- Order type. Stops and market orders suffer most in fast markets. Limits can reduce slippage but increase missed fills.
- Fill quality by venue. Compare the same setup on demo versus live, and across brokers. A pattern across brokers points to market conditions. A pattern only on one broker points to execution rules.
- Measure the move in pips. You cannot evaluate “big” or “small” without a pip baseline, see what pips mean in forex.
Step 5: Separate sweep behavior from sustained trend
Most “hunts” look like a sweep. Real trend leaves evidence after the sweep.
- Define the sweep. Price runs a prior high or low, triggers stops, then snaps back.
- Run a follow through test. Track the next 15, 30, and 60 minutes. A real repricing holds above or below the level and builds structure.
- Watch the retest. If price breaks, retests, and continues, you saw a regime shift or liquidity repricing. If it fails and returns to range, you saw a liquidity probe.
- Check volatility decay. After news, volatility often spikes then compresses. Compression after the sweep supports “normal volatility,” not a campaign.
A simple scoring rubric you can use
Score each line. Total the points. Act based on the range.
| Check | 0 points | 1 point | 2 points |
|---|---|---|---|
| Context | Liquid session, no events | Minor event or transition hour | Red news, fix, expiry, thin market |
| Cross source validation | Move matches across feeds | Small timing or size mismatch | Only your feed shows the spike |
| Related markets confirm | Rates, DXY, peers align | Mixed confirmation | No confirmation anywhere |
| Execution evidence | Normal spread and fills | Wide spread or slippage once | Repeated asymmetric slippage, rejects, abnormal spread |
| Follow through | Holds and trends | Chops and rebalances | Sweeps then fully mean reverts |
- 0 to 3 points: Normal volatility. Treat it as market structure and risk management.
- 4 to 6 points: Suspicious. Reduce size, widen filters, avoid market orders in fast conditions, collect more samples.
- 7 to 10 points: Actionable. If the issue is feed or execution, document it and change venue or settings. If the issue is market conditions, stand down around the window.
Red Flags That May Indicate Broker-Side Issues (Not ‘The Market’)
Abnormal spread behavior vs peers during calm conditions
Start with spreads. Spreads move. They should not break reality when the market stays quiet.
- Compare with at least one peer broker on the same pair, same session, same account type. Record the typical spread range for both.
- Watch “calm windows” like mid-session, no major news, normal liquidity. Spreads should stay stable.
- Flag repeated spread spikes that hit your broker but do not show on peers. One spike means little. A pattern means something.
- Flag spread widening that targets your risk points like stops and breakout entries, while the mid price barely moves.
- Check if spread behavior matches the broker’s model. A market maker can widen more. An ECN-style feed should track the street closer.
If you need a refresher on spread mechanics, review what a spread is in forex.
Frequent stop-outs with no comparable prints elsewhere
Stop-outs happen. The red flag is a stop-out price that does not exist on other feeds.
- Log the exact stop-out price and the exact time down to the second.
- Check multiple independent charts and tick sources if you have them. Look for the same low or high.
- Flag “single-broker wicks” where your broker prints a spike, takes your stop, then snaps back, while peers never touch that level.
- Separate bid and ask effects. Many stops trigger on bid, many buys fill on ask. A stop can trigger without a candle “looking close” on mid charts.
- Count frequency. One event can be data noise. Three similar events in a month on the same pair is a signal.
Slippage asymmetry, worse on entries and exits but never positive
Slippage should cut both ways over enough trades. If it only hurts you, treat it as a venue problem until proven otherwise.
- Measure slippage in pips for every market order and every stop order fill.
- Track “expected price” at click time for entries, and at trigger time for stops. Use timestamps.
- Flag one-sided outcomes. You get negative slippage in fast moves, but you never get price improvement in your favor.
- Flag slippage that increases with size beyond what the book should justify for that pair and time.
- Separate limit vs market behavior. Limits should not slip. If limits fill worse than your limit price, treat it as an execution issue.
Platform anomalies, freezes, off-market quotes, delayed price updates
Tech failures look like manipulation when you only see the result. You need to separate platform faults from price action.
- Freezes during volatility only on your platform. Your chart stops, price jumps, orders fail, then you see a fill far away.
- Delayed updates. Your feed lags peers by seconds, especially around session opens and news.
- Off-market quotes. Your broker prints levels that do not exist on any other feed you track.
- Order errors that cluster like requotes, “off quotes,” or rejected orders at the same times each day.
- Server time and data gaps. Missing ticks, missing candles, or duplicated ticks in the history.
When this happens, stop trading. Switch to limit orders if you must trade. Reduce your lot size until the feed looks normal.
What to document immediately
Do this in real time. Do not rely on memory. Support teams act faster when you show clean evidence.
- Screenshots of the chart, the order ticket, and the trade history. Capture bid and ask if your platform shows it.
- Timestamps with timezone. Record broker server time and your local time.
- Tick data for the window, at least 2 minutes before and after the event. Export if possible.
- Trade logs including order type, requested price, fill price, slippage, spread at fill, and any error messages.
- Peer comparisons. Screenshot a second broker or an independent chart at the same timestamp.
| Red flag | Fast check | What it points to |
|---|---|---|
| Spread spikes in calm market | Compare with one peer feed in the same minute | Pricing policy, feed quality, broker risk controls |
| Stop-out wick only on your broker | Match the low or high on two other sources | Bad ticks, off-market pricing, execution venue issue |
| Slippage always negative | Record 30 fills and count positive vs negative | Execution model, latency, internalization practices |
| Freezes and delayed updates | Check if peers keep moving while you stall | Platform stability, routing, server overload |
How to Protect Yourself: Practical Trading and Risk Controls
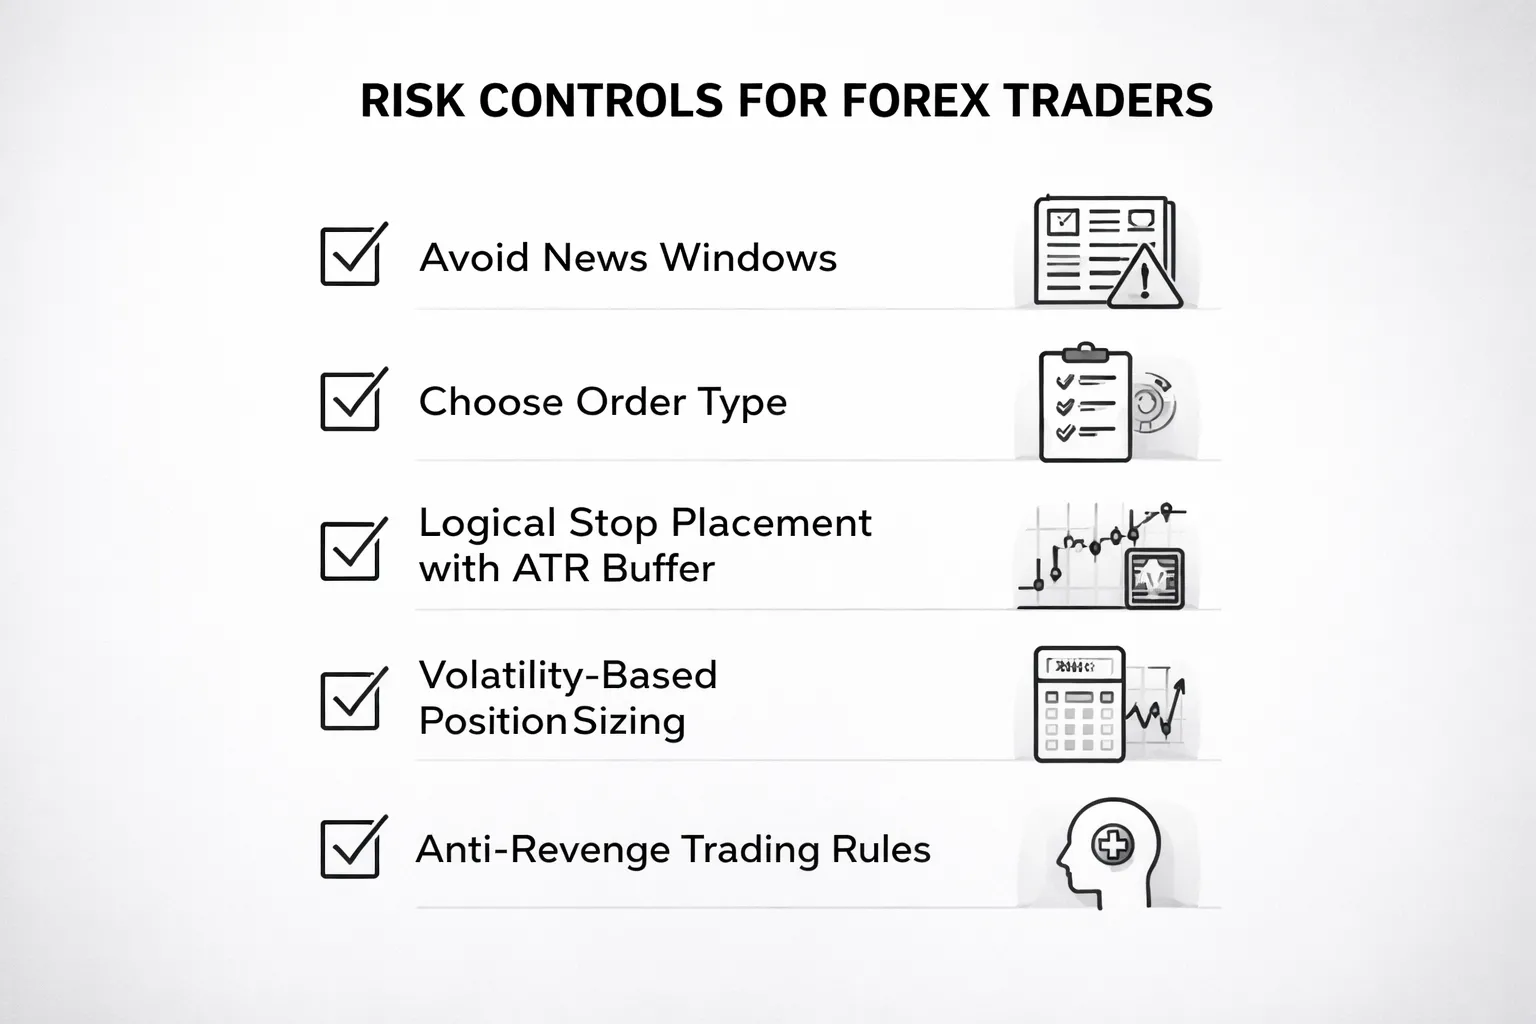
Avoid High-Risk Windows: When Not to Trade (and Why)
Most “manipulation” complaints come from thin liquidity and fast repricing. You can avoid a lot of damage by choosing when you trade.
- Minutes around top-tier news: Nonfarm Payrolls, CPI, central bank rate decisions, and press conferences. Spreads widen. Quotes gap. Stops trigger at worse prices.
- Session handovers: The minutes around London open and New York open. Liquidity can look deep, then vanish for a few seconds.
- Late Friday and holiday calendars: Liquidity drops. Stops sit close. One sweep can print a large candle.
- After large one-way moves: You face sharp pullbacks and stop runs as liquidity refills.
Set a rule. If spread exceeds your normal level by 2x, you do not trade. If platform latency spikes, you do not trade. If news hits in the next 10 minutes, you do not trade.
Order Selection: Market vs Limit vs Stop-Limit (Common Pitfalls)
Your order type decides your fill quality. Use the one that matches your goal.
- Market orders: You get filled. You do not control price. Use them only when execution matters more than entry price, and only in normal spreads.
- Limit orders: You control price. You may not get filled. Use them for planned entries at levels, and for taking profit.
- Stop orders: You trigger into momentum. You accept slippage. Use them for breakout plans, but size smaller and expect worse fills.
- Stop-limit orders: You cap slippage, but you can miss the trade. Use them when you would rather miss than get a bad fill. Avoid them when price can gap.
Common failure mode. You place a stop in a fast market, get slipped, then blame “stop hunting.” The real issue is you used a marketable trigger in a low-liquidity moment.
Stop Placement: Beyond Obvious Liquidity Pools, Without Widening Risk Blindly
Obvious stops cluster at round numbers, prior highs and lows, and clean trendline touches. Price often trades through those levels to fill orders, then reverses.
Move your stop based on structure and volatility, not fear.
- Use invalidation: Place the stop where your trade idea breaks. If price reaches that level, you want out.
- Avoid “equal low” magnets: If you buy above a double bottom, do not park the stop 1 pip below the equal lows. Put it beyond the next structure that would force a trend change.
- Use a volatility buffer: Add a buffer based on recent ATR or average candle size. If your stop sits inside normal noise, you will churn.
Do not widen risk to “hide” the stop. Keep the stop logical, then adjust position size so your account risk stays fixed.
Position Sizing for Volatility Regimes (ATR-Based and Event-Based)
Use fixed risk per trade. Change size, not discipline.
- Pick a risk limit: Example, 0.25 to 1.0 percent of equity per trade, based on your strategy and drawdown tolerance.
- Size from stop distance: Larger stop means smaller position. Smaller stop means larger position.
- ATR-based adjustment: If ATR rises 50 percent versus your baseline, cut position size so your typical stop still costs the same account risk.
- Event-based adjustment: On CPI or rate days, trade half size, or do not trade. Volatility can jump and spreads can widen without warning.
| Market condition | What changes | Your control |
|---|---|---|
| Normal liquidity | Stable spreads, stable fills | Use normal size, normal orders |
| High volatility | Wider ranges, more slippage | Reduce size, use wider stops, favor limits |
| News spike | Gaps, spread blowouts | Stand aside, or cut size hard with strict rules |
Alerts and Checklists: Stop “Manipulation” Revenge Trades
Revenge trading turns one bad fill into a drawdown. Use controls that fire before you click.
- One-trade reset rule: After a stop-out, wait 10 to 30 minutes before any new entry on the same pair.
- Daily loss limit: Example, stop for the day at 2R or a fixed percent. No exceptions.
- Three-point entry checklist: Trend context, level, trigger. If one is missing, you skip.
- Execution check: Spread normal, platform responsive, no news in the next 10 minutes. If one fails, you skip.
- Alert-based execution: Set price alerts at your levels. Do not stare at ticks. React to your plan, not to noise.
Track your fills and spreads per session. When you see repeat issues, you can separate market behavior from broker behavior. Learn how pricing and execution work before you change brokers or strategies, using this guide on how the forex market works.
Real Cases and What They Teach Traders (Without Conspiracy Thinking)
Historic benchmark and fixing controversies, what happened and why it mattered
The clearest real world FX manipulation cases center on benchmarks, not random retail stop hunts.
For years, major banks helped set daily benchmark rates used by funds, corporates, and index products. The most known example involved the WM/Reuters 4pm London fix. Traders at multiple banks shared order details, coordinated timing, and pushed prices during the short fixing window to improve their own fills and client book results.
Authorities treated this as manipulation because it targeted a defined process with predictable timing and large captive flow. The harm came from small price moves applied to huge notionals. A few pips mattered.
- Why it worked: concentrated liquidity and attention in a narrow time window.
- What changed: stronger controls on chat, surveillance, and execution practices around fixes.
- What it did not prove: that every spike on your chart reflects coordination against retail traders.
Regulation and enforcement, how authorities define manipulation in FX
Regulators look for intent and a mechanism that can move price or distort a benchmark, not for a price move that looks unfair.
Common elements in enforcement actions include:
- Intent evidence: messages, recorded calls, documented plans, or repeated conduct tied to a goal.
- Market impact: measurable effect on price, spread, or benchmark output during a defined window.
- Deception: misleading other participants, abusing confidential client information, or trading to create a false impression of supply and demand.
- Control failures: weak supervision, poor conflicts management, or lack of surveillance on sensitive periods.
This is why most retail claims fail the legal standard. A chart pattern shows price. It does not show intent, coordination, or deception.
What retail traders can learn, evidence standards and realistic expectations
Use the same discipline regulators use. Separate frustration from proof.
- Log your conditions: time, session, pair, spread, slippage, news status, and order type.
- Compare across venues: check a second price feed for the same timestamp. Look for outlier prints, not normal variance.
- Focus on repeatability: one bad fill proves little. Ten similar events in the same conditions is a signal.
- Know the high risk windows: major data releases, session opens, thin rollover periods, and fix windows. Expect wider spreads and jump risk.
- Use execution rules: avoid market orders in thin moments. Use limit orders at planned levels. Set maximum slippage where your platform allows it.
Also set expectations about what you can control. You cannot control interbank flows. You can control position size, order type, and timing. Start with liquidity and execution mechanics, using this guide on forex liquidity.
Why a single chart rarely proves manipulation, the proof problem explained
A retail chart compresses a complex market into a few candles. You lose most of the context you need to prove wrongdoing.
These gaps block reliable conclusions:
- No view of the order book: you do not see resting liquidity, cancellations, or true depth across venues.
- No counterfactual: you do not know where price would have traded without the event.
- No intent data: you cannot infer coordination from a wick or a fast move.
- Feed differences: OTC pricing varies by liquidity provider, broker markup, and filtering rules. Small spikes can be local.
- Normal microstructure: stops cluster near obvious levels. Price often trades through them during volatility because liquidity sits there.
Treat a suspicious move as a hypothesis. Then test it with logs, time comparisons, and repeat observations. If you cannot test it, you cannot trade it.
Tools and Data Sources to Improve Your Read on FX Moves
Economic calendars and real-time news squawks
Start with the calendar. Log the event time, currency, and expected impact. Then write down the consensus forecast and the prior number.
Focus on the surprise. Surprise equals actual minus consensus. A big surprise can justify a fast move with no “manipulation” needed.
- Match time stamps. Align your chart time zone, broker server time, and the calendar release time. A one minute mismatch creates fake patterns.
- Separate headline from details. Inflation, jobs, and rate decisions often move twice, first on the headline, then on components and revisions.
- Watch for linked releases. A payroll number can get reversed by wages, unemployment rate, or prior revisions.
- Use a squawk for speed. A good squawk prints the number and flags “beats” or “misses” within seconds. That helps you classify a spike as news driven.
If you cannot name the catalyst and the surprise size, treat the move as uncertain, not rigged.
Volatility and liquidity proxies you can measure
You do not have a consolidated tape in spot FX. You can still measure conditions that make spikes more likely.
- ATR. Track 14 period ATR on your trading timeframe. If price moves one to two ATR fast, that is a volatility regime shift, not proof of a hunt.
- Spreads. Record typical spread by session. A spike that happens with a spread blowout often signals thin liquidity, not intent.
- Session stats. Track average range for Asia, London, and New York. Many “mystery” breakouts happen at session handoffs and fixes. Use a session guide like Forex market hours and trading sessions.
- Tick activity. Use tick volume as a proxy. Rising tick activity during a break supports real participation. Flat tick activity with a sharp wick can mean a local quote event.
Build simple baselines. Your goal is to know what “normal” looks like for that pair and time.
Multi-broker price comparison to cut false alarms
Many manipulation claims come from single feed prints. Fix that with comparison.
- Compare at least two feeds. Use your broker, a second demo broker, and a third reference like a major charting platform feed.
- Check bid and ask. A “stop run” wick might exist on the ask but not the bid, or the other way around. That matters if your stops sit on one side.
- Look for commonality. If the spike shows on most feeds, the market moved. If it shows on one feed, treat it as local pricing.
- Log spread and execution. If you got slipped, record the spread at the moment and any requote or rejection. That data beats screenshots.
This step alone removes many fake narratives. You stop blaming the market for a broker specific quote.
Commitment of Traders and positioning indicators
COT helps with context. It does not time entries.
- Use it for regime. Extreme net positioning can warn you about crowded trades and sharp reversals.
- Respect the delay. COT reports lag. Price can move far before the update hits your screen.
- Pair it with price. Treat COT as a filter for your bias, not a trigger for your click.
- Know what it covers. COT reflects futures positioning, not the entire spot market. Use it as a proxy, not a map.
Positioning tools work best when they keep you out of bad trades, not when they push you into new ones.
Journaling templates that separate myth from reality
You cannot “detect manipulation” from memory. You need records. Use a template and fill it fast.
After 20 to 50 similar cases, patterns appear. You will see which moves repeat around news, which happen in thin hours, and which come from your feed.
Frequently Asked Questions
Is forex market manipulation common?
Large banks can move price for short periods, but they rarely target you. Most “manipulation” claims come from thin liquidity, news spikes, and broker pricing differences. Track the same move across multiple feeds before you label it manipulation.
Do brokers hunt stops?
Some brokers widen spreads or slip fills in fast markets. That can hit stops. It is not the same as a coordinated “hunt.” Compare bid and ask wicks across brokers, log spread at fill, and review slippage versus normal conditions.
What is a liquidity grab?
Price pushes into obvious highs or lows, triggers clustered orders, then reverses. You will see fast candles and long wicks. It often happens near session opens, key levels, and news. Learn the role of forex liquidity.
How do you tell normal volatility from manipulation?
Check the calendar, time of day, and liquidity. If spreads widened across brokers and major pairs moved together, it is likely normal volatility. If only your broker shows the wick, suspect feed issues or broker execution.
Can retail traders get targeted?
Institutions do not see your personal stop. They see order flow and common technical levels. If you place stops at obvious swing points, you join the crowd. Use position sizing that survives noise and avoid stops at the exact level everyone uses.
What data should you collect when you suspect manipulation?
Save screenshots, time, pair, and session. Record bid and ask. Note entry, stop, target, size, fill price, slippage, and spread at fill. Check if other brokers show the same move. Log your expected outcome and what changed.
Does regulation prevent forex manipulation?
Regulation helps, but it does not remove conflicts or bad execution. It mainly improves reporting, capital rules, and dispute processes. Your protection still comes from broker selection, realistic stop placement, and tracking your execution quality over time.
Are stop hunts illegal?
Targeting client orders can be illegal if it involves fraud or abusive execution. Most “stop hunts” are simply price moving through pooled liquidity. Focus on what you can prove, like spread spikes, rejected orders, and off-market pricing.
What is the most common retail mistake with “manipulation”?
You blame the market instead of your plan. You ignore spread, timing, and liquidity. You use tight stops in thin hours. Fix your process. Trade during liquid sessions, reduce size around news, and journal 20 to 50 cases to find patterns.
Conclusion
Conclusion
You will see fast moves, spread jumps, and ugly fills. Most of it comes from liquidity, news, and how brokers route orders. Real manipulation exists, but you will not trade it well by guessing intent.
Trade what you can measure. Time, spread, slippage, and execution quality. Track it per session and per pair. Treat every “hunt” claim like a case file, not a story.
- Trade liquid hours. London and the London and New York overlap reduce random spikes.
- Widen risk buffers in thin markets. Use wider stops or smaller size when spreads expand.
- Mark red-flag events. High-impact news, rollovers, and session opens.
- Log execution. Screenshot spread, record requested price, filled price, and any rejection.
- Compare brokers. If one feed shows repeated off-market prints, move your capital.
Final tip. Build a simple “execution score” for your last 50 trades. Include average spread at entry, slippage in pips, and fill rate. If the score worsens in specific hours or pairs, stop trading there. If you want to understand the root cause, start with forex liquidity.
-
Forex Market Hours & Trading Sessions Explained (Best Times to Trade)
4 months ago -
Forex Leverage Explained: How It Works, Pros, Cons & Examples
4 months ago -
What Is a Lot Size in Forex? Lot Types + Quick Examples
4 months ago -
How to Calculate Position Size in Forex (Position Sizing Formula + Examples)
4 months ago -
What Are Pips in Forex? Definition, Examples & Why They Matter
4 months ago
-
-
- Large dealers and liquidity providers, incentives and constraints
- Institutional asset managers and hedgers, execution pressure around benchmarks
- High-frequency and algorithmic participants, speed advantages vs illegality
- Retail brokers (market maker vs ECN/STP), where conflicts can occur
- Social-media and signal-group actors in thin markets, coordinated rumor dynamics
-
- Stop-runs and liquidity grabs, why sweeps happen near obvious highs and lows
- False breakouts, breakout traders, mean reversion, and trapped positioning
- Long wicks and gap-like moves, spread widening and quote updates
- News spikes and whipsaws, repricing risk vs engineered moves
- Correlation breaks between pairs, temporary dislocations and re-hedging flows
-
- Avoid High-Risk Windows: When Not to Trade (and Why)
- Order Selection: Market vs Limit vs Stop-Limit (Common Pitfalls)
- Stop Placement: Beyond Obvious Liquidity Pools, Without Widening Risk Blindly
- Position Sizing for Volatility Regimes (ATR-Based and Event-Based)
- Alerts and Checklists: Stop “Manipulation” Revenge Trades
-
- Is forex market manipulation common?
- Do brokers hunt stops?
- What is a liquidity grab?
- How do you tell normal volatility from manipulation?
- Can retail traders get targeted?
- What data should you collect when you suspect manipulation?
- Does regulation prevent forex manipulation?
- Are stop hunts illegal?
- What is the most common retail mistake with “manipulation”?
-
-
- Large dealers and liquidity providers, incentives and constraints
- Institutional asset managers and hedgers, execution pressure around benchmarks
- High-frequency and algorithmic participants, speed advantages vs illegality
- Retail brokers (market maker vs ECN/STP), where conflicts can occur
- Social-media and signal-group actors in thin markets, coordinated rumor dynamics
-
- Stop-runs and liquidity grabs, why sweeps happen near obvious highs and lows
- False breakouts, breakout traders, mean reversion, and trapped positioning
- Long wicks and gap-like moves, spread widening and quote updates
- News spikes and whipsaws, repricing risk vs engineered moves
- Correlation breaks between pairs, temporary dislocations and re-hedging flows
-
- Avoid High-Risk Windows: When Not to Trade (and Why)
- Order Selection: Market vs Limit vs Stop-Limit (Common Pitfalls)
- Stop Placement: Beyond Obvious Liquidity Pools, Without Widening Risk Blindly
- Position Sizing for Volatility Regimes (ATR-Based and Event-Based)
- Alerts and Checklists: Stop “Manipulation” Revenge Trades
-
- Is forex market manipulation common?
- Do brokers hunt stops?
- What is a liquidity grab?
- How do you tell normal volatility from manipulation?
- Can retail traders get targeted?
- What data should you collect when you suspect manipulation?
- Does regulation prevent forex manipulation?
- Are stop hunts illegal?
- What is the most common retail mistake with “manipulation”?
-
How to Place a Forex Trade Step by Step (Your First Trade Explained)
2 months ago -
Forex Trading vs Crypto Trading: Which Market Is Better for Beginners?
2 months ago -
Forex Lot Size Calculator: How to Use It to Size Trades Correctly
4 months ago -
How to Calculate Position Size in Forex (Position Sizing Formula + Examples)
4 months ago -
Forex Leverage Explained: How It Works, Pros, Cons & Examples
4 months ago
-
Is Forex Trading Legal in the United States? Rules, Regulators & What to Know
4 months ago -
Forex Market Hours & Trading Sessions Explained (Best Times to Trade)
4 months ago -
Forex Trading Platforms Comparison: MetaTrader vs cTrader vs TradingView
4 months ago -
Forex Leverage Explained: How It Works, Pros, Cons & Examples
4 months ago -
What Is a Lot Size in Forex? Lot Types + Quick Examples
4 months ago