What Moves EUR/USD? The Biggest Drivers You Should Watch

EUR/USD moves when the market reprices growth, inflation, and interest rates in the US and the Eurozone. Most days, it comes down to one thing, the gap between what traders expect the Fed to do and what they expect the ECB to do.
This guide breaks the pair into the drivers you can track in real time. You will learn which data releases hit EUR/USD hardest, which central bank signals matter, and how risk sentiment and capital flows can override domestic numbers.
You will also get a simple checklist for what to watch before high impact events, including how rate expectations shift around Fed days. Use it with interest rate examples to connect the headlines to price.
Key Takeaways
- In het kort: EUR/USD tracks the Fed and ECB rate path first. Everything else is secondary.
- Watch rate expectations, not headlines. Use OIS pricing, front-end yields, and rate differential moves.
- Fed days and ECB days can reprice months of expectations in minutes. Focus on the statement, projections, and press conference tone.
- Inflation and jobs data move EUR/USD most when they change the next central bank step. Look at CPI, core inflation, wage growth, and US payrolls.
- Risk sentiment can override domestic data. Equities, credit spreads, volatility, and energy shocks can drive fast USD and EUR flows.
- Track Eurozone energy and terms of trade. They hit growth, inflation, and external balances, which feed back into ECB expectations.
- Use capital flow signals. Watch Treasury demand, European bond spreads, and repatriation during stress.
- Before high-impact events, map scenarios. Base case, upside, downside, then link each to rate pricing and likely EUR/USD direction.
- Use an economic calendar to rank events by impact and avoid surprises.
EUR/USD basics: what the pair represents and why it moves
Base vs quote currency, how to read EUR/USD
EUR/USD quotes how many US dollars you pay for 1 euro.
EUR is the base currency. USD is the quote currency.
- If EUR/USD rises, the euro strengthens and the dollar weakens.
- If EUR/USD falls, the euro weakens and the dollar strengthens.
Example: EUR/USD at 1.0800 means 1 euro costs $1.08. A move to 1.0900 means the euro gained about 0.93% versus the dollar.
Most platforms quote EUR/USD to 4 or 5 decimals. One pip is usually 0.0001. From 1.0800 to 1.0810 equals 10 pips.
Why EUR/USD leads global FX
- Liquidity. Banks, funds, and corporates trade it all day. That depth absorbs large orders with less price impact.
- Tight spreads. Competition and volume push transaction costs down, especially during London and New York hours.
- Benchmark status. Many risk models, hedges, and macro views start with the dollar and the euro area. That keeps EUR/USD at the center of pricing.
- Clean rate narrative. The pair often tracks the gap between expected Fed policy and expected ECB policy. Rate pricing flows through fast.
Time horizons, what tends to matter when
| Horizon | What usually drives EUR/USD | What to watch |
|---|---|---|
| Intraday | Data surprises and rate repricing. Positioning and liquidity pockets around key levels. | US payrolls, CPI, ISM, Fed speakers, ECB speakers, Eurozone inflation. Front-end yield moves, 2-year spread shifts, options expiries. |
| Multi-week | Trend in growth and inflation gaps, and how markets price the next 1 to 3 central bank meetings. | OIS curves, 2y to 5y yield differentials, PMIs, wage data, energy prices, Euro area periphery spreads. |
| Multi-month | Cycle-level policy divergence, recession risk, and global capital flows. Risk-on versus risk-off regimes. | Real yield differentials, balance of payments trends, US fiscal and deficit narrative, global stress indicators, reserve and hedging flows. |
If you want the core framework behind these moves, read fundamental analysis in forex.
The biggest driver: interest rate differentials and monetary policy expectations
How yields and yield curves transmit into FX
EUR/USD trades like a relative price of money. Rate expectations change that price fast.
- Carry and relative returns. When US short rates price higher than Euro rates, USD assets offer more yield. All else equal, that pulls flows toward USD and pressures EUR/USD lower. When the spread narrows, EUR/USD tends to lift.
- Hedging costs. Big investors often hedge currency risk. Higher US rates usually raise the cost to hedge USD exposure back into EUR. That can reduce demand for unhedged US assets and shift allocation. Watch how hedged yields compare, not just headline yields.
- Curve shape and growth risk. FX reacts most to the front end. A jump in 2-year yields often signals a higher expected policy path. A steepening or re-steepening can signal stronger growth and looser financial conditions. A deep inversion can signal recession risk and future cuts. Each regime changes how EUR/USD trades.
- Real yield differentials. Nominal yields can rise because inflation expectations rise. Real yields strip that out. If US real yields rise versus Euro real yields, USD tends to outperform.
If you want a clean, example-driven framework, read how interest rates affect currency pairs.
Fed vs ECB reaction functions
The same inflation print can move EUR/USD in opposite ways depending on what each central bank cares about most at that moment.
- Fed. Markets focus on jobs, wages, and services inflation. A hot US CPI matters most when it feeds into sticky core inflation or tight labor data. If growth looks resilient, the market tends to price a higher terminal rate or fewer cuts. USD strengthens.
- ECB. Markets focus on core inflation, wage deals, and financial fragmentation risk across member states. If inflation runs hot but growth looks fragile, traders may doubt how far the ECB can hike. That can cap EUR strength even on strong Eurozone inflation.
- Asymmetry matters. The Fed can tolerate a stronger dollar. The ECB watches how tighter policy hits credit and spreads. That changes how each bank signals its next steps.
What to monitor
Track what traders price, not what central banks said last meeting.
- OIS curves. Use USD OIS and EUR OIS to see expected policy paths. Focus on the spread between the two curves at 3 months, 1 year, and 2 years.
- 2-year yields. The US 2-year minus Germany 2-year spread is a fast proxy for front-end divergence. It often leads EUR/USD on data days.
- Terminal rate pricing. Watch the implied peak policy rate in each curve and how it shifts after CPI, payrolls, and wage data. Changes in the expected peak can move EUR/USD even if the next meeting looks unchanged.
- Real yields. Track real rate spreads using inflation-linked benchmarks or implied real rates. If US real yields rise on tighter policy expectations, EUR/USD usually struggles.
Policy divergence regimes
EUR/USD responds most when one bank tightens while the other eases, or when one stays restrictive longer.
- Fed tighter, ECB looser. The front-end spread widens in favor of USD. EUR/USD often trends lower. Rallies tend to fade unless Europe growth surprises higher.
- ECB tighter, Fed looser. The spread narrows or flips toward EUR. EUR/USD often trends higher. Pullbacks tend to find buyers when the market keeps pricing ECB persistence.
- Both tightening. Relative growth and risk sentiment decide the winner. If the US economy looks stronger, USD can still lead even with similar hikes.
- Both easing. The market shifts to who cuts first and who cuts more. Faster US cuts can weaken USD, but risk-off stress can still support USD as a funding and liquidity currency.
Forward guidance and communication risk
FX moves on the gap between what you expected and what the central bank signals next.
- Speeches. A single comment on “restrictive for longer” or “data dependent” can reprice the front end. Track the speakers that move markets, not every headline.
- Minutes. Minutes can reveal internal disagreement. More division raises uncertainty and can steepen rate volatility. EUR/USD often follows the volatility impulse.
- Press conferences. The Q&A can change the reaction. Listen for pushback on market pricing and for hints about balance sheet policy.
- Dot plot equivalents. The Fed has the dot plot. The ECB relies more on staff projections and narrative. Treat both as guidance, not commitment. The market cares about how guidance shifts the OIS curve the next morning.
Inflation dynamics: when CPI moves EUR/USD and when it doesn’t
Headline vs core vs services inflation, what markets price most
EUR/USD reacts to inflation when it changes the expected rate path. The market prices the parts of CPI that central banks watch for persistence.
- Headline CPI moves most when energy or food shocks change the medium-term inflation story, or when they feed into expectations. One-off oil moves often fade fast.
- Core CPI matters more because it strips volatile items. A clean core surprise can shift front-end rates and hit EUR/USD.
- Services inflation often carries the most weight. Services tie to wages and demand. Sticky services can keep cuts priced out, or bring hikes back into the curve.
In the US, core services ex shelter and wage-sensitive categories tend to drive the narrative. In the euro area, services and negotiated wages matter most once energy noise settles.
Inflation surprises vs inflation levels, why expectations shifts matter more
The level of CPI matters less than the gap versus expectations. EUR/USD trades the change in the expected policy path, not the print in isolation.
- Big surprise, even at a lower inflation level, can move EUR/USD because it forces a repricing of the next few meetings.
- High but in line often does little. The market already paid for it through OIS and futures positioning.
- Revisions can matter as much as the headline. A small beat with upward revisions can extend the move.
Your checklist on release day is simple. Watch the consensus, the prior, and the rate-implied probability change for the next meeting. If the OIS curve barely shifts, EUR/USD often mean-reverts.
Use an economic calendar to track consensus and prior prints, and to plan around high-impact CPI releases.
Real rate channel, linking breakevens and real yields to EUR/USD
Inflation affects EUR/USD through real yields and rate differentials.
- If inflation rises and nominal yields rise more than inflation expectations, real yields rise. That tends to support the currency with the higher real yield.
- If inflation rises but markets treat it as temporary, breakevens rise while real yields do not. FX reaction often stays muted or fades.
- If inflation falls and real yields fall faster in one region, the currency can weaken even if growth looks fine.
Track the US and euro area real yield proxies and the 2-year rate spread. EUR/USD often follows the front-end spread when CPI changes the expected policy path. When CPI only shifts breakevens, the move tends to be smaller.
Second-round effects, wages, shelter, and services as persistent drivers
EUR/USD moves more when CPI signals persistence. Second-round effects keep policy restrictive for longer.
- Wages drive services inflation. If wage growth stays high, cuts get pushed out. EUR/USD then reacts through the rate differential.
- Shelter can dominate US core. If shelter inflation stays firm, markets worry about a higher terminal rate or slower cuts.
- Services ex energy matters in the euro area. Sticky services plus strong negotiated wages can keep the ECB cautious, even when headline falls.
Focus on the components that central banks cite in speeches and minutes. When CPI confirms that story, EUR/USD tends to trend. When CPI contradicts it for one month, the move often reverses on the next data point.
Growth and labor-market momentum: the data that changes the narrative
Growth and labor-market momentum: the data that changes the narrative
Inflation sets the destination. Growth and jobs set the speed.
When growth and labor data stay firm, markets price fewer rate cuts or a higher peak. The dollar tends to gain. When growth and jobs roll over, markets price faster cuts. EUR/USD tends to lift.
Your edge comes from tracking the few releases that central bankers cite, and that rate markets reprice within minutes.
Top US releases to watch
- Nonfarm Payrolls (NFP). Focus on the three-part read: payrolls level, unemployment rate, and earnings. A strong payroll print with stable or falling unemployment keeps the Fed cautious. Weak payrolls plus a rising jobless rate pushes markets toward cuts. For tactical setups, see our Non-Farm Payrolls guide.
- Unemployment rate and participation. Watch whether unemployment rises because layoffs increase, or because participation jumps. The first hits the dollar harder. The second can soften wages without a hard slowdown.
- Average hourly earnings. This matters when the Fed talks about “wage inflation” and services. Higher earnings growth supports the view that inflation stays sticky. That usually supports USD through higher front-end yields.
- ISM Manufacturing and ISM Services. The new orders and prices paid components move rates. A drop in new orders signals slowing demand. A jump in prices paid revives inflation risk. Services ISM often has the cleaner signal for US demand.
Top Eurozone releases to watch
- PMIs. Treat the services PMI as the main growth pulse. It ties to domestic demand and wages, which the ECB watches. The new orders subindex leads turns in activity.
- Ifo (Germany). It can move EUR when it confirms a trend in PMIs. The expectations component matters more than current conditions.
- GDP. Markets react most when GDP changes the “soft landing vs recession” narrative. Revisions can matter as much as first prints if they shift the trend.
- Employment and unemployment. The ECB cares about labor tightness because it feeds wages and services inflation. A stable labor market gives the ECB room to stay restrictive.
- Inflation expectations surveys. Watch measures the ECB references, including consumer and professional forecasts. Rising expectations make it harder for the ECB to signal quick cuts, even if headline CPI falls.
Soft data vs hard data: when it leads, when it misleads
Soft data includes surveys like PMIs, Ifo, and confidence. It turns first. FX reacts fast because it front-runs policy changes.
Hard data includes payrolls, retail sales, industrial output, and GDP. It confirms or rejects the survey story. When hard data catches up, trends in EUR/USD usually extend.
- Soft data leads early in a cycle turn, when businesses and consumers change behavior before it hits official prints.
- Soft data misleads when the shock is temporary, or when financial conditions loosen and offset weak sentiment. In those phases, PMIs can look recessionary while jobs and spending stay firm.
- Hard data dominates when central banks say they need “evidence” in realized activity and wages. One strong jobs print can erase weeks of weak surveys.
Surprise indexes: why they track FX trends
EUR/USD often trends when one region keeps beating expectations and the other keeps missing. That is what surprise indexes summarize.
The Citigroup Economic Surprise Index works because FX prices the gap between outcomes and forecasts, not the level of growth. Positive surprises push yields up and cuts out. Negative surprises do the opposite.
- Track the US vs Eurozone surprise spread. A rising US advantage tends to support USD. A rising Eurozone advantage tends to support EUR.
- Use it as a trend filter. When the surprise spread runs in one direction for weeks, fade trades fight the macro tape.
- Watch for inflection points. When the spread stops improving and rolls over, EUR/USD often shifts from trend to range, or reverses on the next major data catalyst.
| Release | What to focus on | Typical EUR/USD impact |
|---|---|---|
| US NFP | Payrolls, unemployment, earnings together | Strong set supports USD, weak set supports EUR |
| US ISM Services | New orders, prices paid | Hot prices or strong demand supports USD |
| Eurozone PMIs | Services and new orders | Improving services supports EUR, deterioration pressures EUR |
| Germany Ifo | Expectations | Confirmation move, can extend EUR trend |
| Eurozone employment | Tightness and persistence | Tight labor market supports EUR via slower ECB cuts |
| Surprise indexes | US vs Eurozone spread | Persistent spread often equals persistent FX trend |
Risk sentiment and safe-haven behavior
USD as a global reserve and funding currency
In stress, the USD often rises. That can push EUR/USD lower.
Two mechanics matter.
- Funding squeeze. A lot of global borrowing sits in USD. When risk rises, lenders pull back. Borrowers buy USD to repay or roll debt. That demand lifts the dollar.
- Cash preference. Big funds hold USD for liquidity. In drawdowns, they raise cash fast. They sell risk assets and park in dollars and short-dated US bills.
Practical rule. If markets talk about dollar funding stress, you should assume downside pressure on EUR/USD until that stress fades.
Equities, volatility, and credit as quick proxies
You need fast gauges for risk sentiment. Use three.
- S&P 500. A strong equity tape often aligns with a softer USD and higher EUR/USD. A sharp equity selloff often does the opposite.
- VIX. A rising VIX often signals hedging demand and tighter financial conditions. That usually supports USD versus EUR.
- Credit spreads. Watch US investment grade and high yield spreads. Widening spreads often mean funding risk. That tends to lift USD and pressure EUR/USD.
How to use them. Look for confirmation. A falling S&P 500 plus rising VIX plus widening spreads usually points to EUR/USD downside risk.
Cross-asset correlations you should track
EUR/USD does not always trade for the same reason.
- Risk-asset regime. Correlation with equities tightens. Headlines, positioning, and broad risk flows drive the move. In this regime, S&P 500 direction often matters more than small data surprises.
- Rates regime. Correlation with yield differentials tightens. Fed and ECB expectations drive the move. In this regime, your focus should shift back to front-end rates and the US minus Germany 2-year spread.
Your job is to identify the regime. If EUR/USD and S&P 500 move together for several sessions, treat it like a risk trade. If EUR/USD tracks yields and repricing of cuts or hikes, treat it like a rates trade. For the rates side, see how interest rates affect currency pairs.
Tail-risk episodes and liquidity dynamics
In tail-risk, microstructure can overpower fundamentals.
- Margin and deleveraging. Losses force funds to cut risk. They sell liquid positions first. That can mean selling EUR and buying USD fast.
- Hedging demand. Option hedging can create one-way flow. Delta hedges add to spot moves when volatility jumps.
- Liquidity gaps. Thin liquidity around major headlines can cause outsized candles. Stops cluster at round numbers. When they trigger, EUR/USD can cascade.
What you should watch in real time. Spikes in VIX, sudden spread widening, and large intraday moves in US front-end yields. If you see all three, assume EUR/USD can overshoot, even if the macro story looks unchanged.
Energy, commodities, and terms-of-trade shocks (a key EUR-specific gap)
Why oil and gas shocks can hit EUR via trade balance and industrial costs
Europe imports a large share of its energy. When oil or gas prices jump, Europe pays more to the rest of the world. That can widen the Eurozone trade deficit and pressure the euro.
Energy also sets the cost base for industry. Higher input costs hit margins, production, and investment. Growth expectations fall. Rate cut expectations rise. EUR/USD often follows.
The US produces more of its own energy and exports energy products. That makes the US terms of trade less fragile in energy spikes. This gap matters most when the shock is large and fast.
Natural gas and European power prices, transmission to inflation and growth expectations
For EUR, natural gas often matters more than crude. Gas drives European power prices. Power prices feed into producer costs and consumer bills.
- Inflation channel: Higher gas and power lift headline inflation. They can also lift core inflation over time via services and goods pass-through.
- Growth channel: Higher energy costs act like a tax on households and firms. Demand slows. Industrial output can drop.
- Policy channel: If markets read the shock as growth-negative, they price a more dovish ECB path, even if headline inflation rises.
You should treat this as a rates story and a balance of payments story at the same time. If Eurozone front-end yields fall while energy spikes, EUR/USD usually struggles.
When commodities dominate: geopolitics, supply shocks, and shipping disruptions
Some weeks, commodities beat data releases. This happens when the market trades supply risk.
- Middle East risk: Crude can gap on conflict headlines. That can hit EUR via imported inflation and weaker terms of trade.
- Russia and European energy flows: Any threat to supply, storage, or pipeline infrastructure can reprice TTF quickly.
- Shipping disruptions: Red Sea or canal constraints can lift freight and energy costs. That pressures European import prices and delivery times.
- Weather and outages: Cold snaps, LNG terminal outages, and low wind can spike power prices and gas demand.
In these regimes, you should expect EUR/USD to react to commodity charts before it reacts to second-tier Eurozone data.
How to track it: Brent, TTF gas, and Eurozone trade balance trends
Track three prices and one macro series. Focus on direction, speed, and whether the move persists for more than a few sessions.
- Brent crude: A clean proxy for global energy stress. Watch for gaps and large daily ranges.
- TTF natural gas: The key Europe-specific trigger. Sudden spikes often show up in EUR rates and EUR/USD fast.
- European power prices: German baseload and other benchmarks signal stress in the real economy channel.
- Eurozone trade balance: Deterioration after an energy spike confirms a terms-of-trade hit.
| What you watch | What it often signals | Typical EUR/USD bias |
|---|---|---|
| Brent up fast, risk tone stable | Imported inflation risk, higher input costs | Soft EUR, unless ECB reprices hawkish |
| TTF up fast, EU front-end yields down | Growth fear dominates, dovish ECB pricing | EUR negative |
| Energy up, Eurozone trade balance worsens | Terms-of-trade shock confirmed | EUR negative, more persistent |
| Energy down, trade balance improves | Relief on imports and industry costs | EUR support |
Use an economic calendar to line up Eurozone trade balance releases with energy moves. If the data prints weaker after a sustained TTF or Brent rally, treat it as a confirmation, not a surprise.
Trade balances, current account, and capital flows
Current account fundamentals
The current account tracks trade in goods and services, plus income and transfers. A surplus means the Eurozone brings in more foreign currency than it sends out. That flow can support EUR over time.
A deficit does the opposite. It raises the economy’s need for external funding. It can pressure EUR when funding costs rise, or when foreign investors step back.
Do not treat a surplus as an automatic EUR rally signal. Markets price it in when it persists. EUR can still fall if rate spreads move against it, or if risk sentiment turns.
What to watch.
- Eurozone trade balance. This is the fastest read on the goods side of the current account.
- Energy prices. The Eurozone imports energy. A sustained rise in TTF or Brent often worsens the trade balance with a lag.
- Terms of trade. When import prices rise faster than export prices, the external balance deteriorates. That tends to hurt EUR and often lasts.
Use an economic calendar to line up Eurozone trade balance releases with energy moves. If the data prints weaker after a sustained TTF or Brent rally, treat it as a confirmation, not a surprise.
Portfolio flows, bonds vs equities, and hedging costs
Portfolio flows drive day-to-day FX. They respond to yields, risk, and hedging costs.
- Bond flows. Higher US yields often pull global fixed income into USD assets. That can weigh on EUR/USD, even if Eurozone data holds up.
- Equity flows. Strong US equity performance can attract foreign inflows into the US. That supports USD. Strong Eurozone equity inflows can support EUR, but they often come with currency hedging.
- Hedging costs. When short-term rate differentials widen, FX hedges get expensive. That changes behavior. Some investors hedge more and dampen spot moves. Others leave positions unhedged and increase spot sensitivity.
Your checklist.
- Track yield spreads and front-end rates first. They set the baseline for hedging costs.
- Separate spot moves driven by rates from moves driven by flows. A EUR rally with heavy EUR selling in hedged forwards can fade.
- Watch issuance and hedging activity around large corporate and sovereign deals. Those flows can hit EUR/USD in narrow windows.
If you want the rate leg in more detail, use this guide on how interest rates affect currency pairs.
Repatriation and reserve management
Large institutions move size. Their flows can override data for a session, or for a week.
- Repatriation. Eurozone corporates and investors bring profits home. That creates periodic EUR demand. The timing often clusters around reporting cycles, tax dates, and stress periods.
- Reserve management. Central banks and sovereign funds rebalance across USD, EUR, and other reserves. These shifts move slowly, but the execution can come in lumps and push spot.
- Real money vs fast money. Real money tends to buy dips and sell rallies. Fast money tends to chase momentum. Know which one dominates the tape.
Practical read.
- If EUR/USD moves without a clear data catalyst, check for auction weeks, large corporate issuance, and known rebalancing windows.
- If the move holds into the close and repeats the next day, treat it as real money, not noise.
Seasonality and timing
Calendar effects matter because flows cluster. You need to know when they hit.
- Month-end and quarter-end rebalancing. Asset managers rebalance back to target weights. If US equities outperform, they often need to sell USD exposure, or hedge it. That can lift EUR/USD near month-end fixings.
- Dividend season. Dividends create predictable cross-border income flows. US dividend payments to foreign holders can create USD outflows. Eurozone dividend flows can support EUR when repatriated.
- Fixing windows. Large orders concentrate around major fixings. Liquidity thins and moves can look oversized.
Your execution rule. Reduce position size around month-end and quarter-end fixings if you cannot map the flow. Wait for the next session if the move comes from a single window.
Fiscal policy, debt dynamics, and fragmentation risk in the Eurozone
Bond spreads as a EUR barometer, BTP-Bund spread and fragmentation risk
In the Eurozone, sovereign spreads often trade like an FX risk premium.
Your cleanest dashboard is the Italy 10-year BTP minus Germany 10-year Bund spread. When the spread widens fast, markets price higher fragmentation risk. EUR/USD tends to weaken because investors demand more compensation to hold Eurozone risk.
- Watch the speed, not the level. Sudden widening matters more than slow drift.
- Track the back end. 10-year spreads usually carry the macro signal. 2-year moves can be more policy driven.
- Scan redenomination language. Headlines about “exit,” “parallel currency,” or “debt restructuring” can hit EUR even before spreads gap.
Practical rule. If BTP-Bund widens and Eurozone equities sell off at the same time, treat EUR rallies as fragile until spreads stabilize.
EU fiscal rules, stimulus, and issuance, supply and sustainability
Fiscal policy hits EUR through bond supply and debt credibility. More issuance can push yields up, but it can also widen spreads if investors doubt the path.
- Rules and enforcement. Looser interpretation of EU fiscal rules can lift growth expectations near term, but it can also raise spread risk for high-debt countries.
- Joint EU issuance. Larger EU-level programs can support EUR if they improve cohesion and create deeper “safe” euro assets. They can pressure EUR if they come with political conflict or weak governance.
- Supply calendar. Heavy auction weeks can widen spreads on poor demand. Watch bid-to-cover, tail size, and indirect bidder share.
What to do. When you see large net issuance plus weak auction metrics, assume higher EUR risk premia. Reduce leverage into key auctions and major budget votes.
US fiscal outlook and Treasury issuance, when it moves USD via yields and term premium
US fiscal dynamics matter for EUR/USD because they can lift Treasury term premium. Higher term premium often supports USD through higher real yields and wider rate differentials.
- Refunding and issuance mix. More coupon issuance relative to bills can pressure the long end and lift term premium.
- Deficit headlines. Large deficit projections can push yields up even without a Fed shift.
- Risk channel. If yields rise because markets fear fiscal sustainability, you can see risk-off behavior that supports USD as a safe haven.
Your filter. Check whether USD strength comes with rising US real yields and a steeper curve. If yes, treat it as fiscal and term premium, not a simple growth story. For the rate link in plain terms, use this guide on how interest rates affect currency pairs.
ECB tools and backstops, how anti-fragmentation measures change FX pricing
The ECB can cap fragmentation risk even when it hikes or keeps policy restrictive. This matters for EUR because it compresses spreads and reduces tail risk.
- PEPP reinvestment flexibility. The ECB can tilt reinvestments toward stressed markets. This often steadies spreads during volatility.
- TPI and conditional support. The Transmission Protection Instrument aims to counter “unwarranted” spread widening, but it depends on policy compliance. Markets react to how credible and usable it looks.
- Signaling. Clear ECB language that it will not tolerate disorderly spreads can reduce EUR downside risk even before any buying starts.
Execution rule. If spreads widen on politics, wait for the ECB response window. If the ECB signals a backstop and spreads stop widening, EUR/USD often stabilizes. If the ECB stays vague and spreads keep widening, avoid catching EUR dips.
Geopolitics and political events: when headlines become price drivers
Elections, coalition risk, and policy uncertainty in major member states
EUR/USD reacts when politics changes the expected path for growth, budgets, and the ECB. You see it fastest in bond spreads, especially the gap between Italian BTP yields and German Bund yields. Wider spreads signal higher redenomination risk and higher funding stress. That usually pressures EUR.
Focus on three inputs. Election odds, coalition math, and the first 30 days of policy signals. Markets price the direction before laws pass.
- Fiscal stance. Bigger deficits and confrontations with EU fiscal rules tend to widen spreads. EUR/USD often weakens if spreads trend wider for several sessions.
- Institutional friction. Talk of ignoring EU budget constraints or challenging court rulings raises tail risk. That hits EUR risk premium even if macro data stays stable.
- Reform momentum. Credible pro growth reforms can tighten spreads and support EUR. Watch implementation plans, not campaign slogans.
Practical checklist. Track the 10 year BTP Bund spread, Italy 2 year yields, and EUR bank equity performance. If all three deteriorate together, treat it as a regime shift, not noise.
Sanctions, conflicts, and security shocks: channels into energy, trade, and risk sentiment
Geopolitical shocks move EUR/USD through three channels. Energy prices, trade flows, and global risk sentiment. Europe imports energy. The US produces more of it. That asymmetry matters.
- Energy channel. A shock that lifts oil or European gas prices raises Europe’s import bill and inflation uncertainty. If the market expects growth damage alongside higher prices, EUR can fall even if inflation rises.
- Trade channel. Disruptions to shipping lanes and sanctions slow export volumes and raise input costs. That hurts Eurozone manufacturing margins and growth expectations.
- Risk channel. In broad risk off moves, USD often benefits from safe haven demand and higher USD funding preference. EUR/USD tends to drop when equities sell off and credit spreads widen.
Execution rule. Separate the first move from the second. The first move is headline risk. The second move comes when energy curves reprice and European growth forecasts get cut. You trade the second move with more confidence.
US political risk: tariffs, trade policy, and global growth implications
US politics can move EUR/USD even when the event sits outside Europe. Tariffs, industrial policy, and fiscal outlook change global growth and inflation expectations. That changes Fed pricing and USD demand.
- Tariffs. Broad tariffs can lift near term US inflation expectations. If markets think the Fed stays tighter for longer, USD can strengthen and EUR/USD can fall. If tariffs look like a growth shock that forces future cuts, the USD reaction can fade.
- Global growth hit. Europe is trade sensitive. If policy raises recession odds in the US or China, Eurozone growth expectations often fall. That can pressure EUR even if the shock starts in Washington.
- Fiscal policy uncertainty. Large spending plans can lift US yields and support USD. Debt ceiling stress can create short USD funding squeezes that also support USD in the near term.
What to watch. Treasury yields, inflation breakevens, and Fed funds futures. If yields rise and cuts get priced out, treat it as USD supportive until data breaks the narrative.
Event-risk playbook: how to think in scenarios rather than predictions
Trade politics with scenarios. You do not need to predict outcomes. You need a plan for how EUR/USD reprices if key variables change.
| Scenario | Market signals to watch | Typical EUR/USD bias | What you do |
|---|---|---|---|
| Contained political noise | BTP Bund spread stable, ECB messaging steady, equities flat | Mild or no impact | Fade extreme intraday spikes, keep risk small |
| Euro area fiscal stress | Spreads widen for days, banks underperform, EUR rates volatility rises | EUR downside | Wait for ECB backstop signal, avoid buying dips until spreads stop widening |
| Energy shock centered in Europe | European gas and oil up, Eurozone PMIs and confidence down | EUR downside | Sell rallies if growth revisions turn negative |
| US policy drives higher yields | UST yields up, Fed cuts priced out, USD funding tightens | EUR/USD lower | Respect trend, use pullbacks to enter with defined stop |
| Risk off shock with global selloff | Equities down, credit spreads wider, VIX up | USD up, EUR/USD down | Reduce leverage, prioritize liquidity, avoid bottom picking |
Keep one framework. Politics moves price when it changes rates, spreads, or growth expectations. If you need a refresher on how to map those inputs into a trade, use this guide on fundamental analysis in forex.
Central bank operations beyond rates: liquidity, QT/QE, and swap lines (often missed)
QE, QT, and the balance sheet, the term premium channel
Rates set the front end. The balance sheet hits the long end.
QE compresses term premium. It can cap US yields even when growth holds up. That can soften the USD and lift EUR/USD, even if the Fed stays hawkish on short rates.
QT does the opposite. It increases duration supply that private buyers must absorb. It can steepen real yields and support the USD. EUR/USD can fall even without a big change in the policy rate path.
- Watch the direction: are holdings rising or shrinking.
- Watch the pace: a faster runoff matters more than a slow glide path.
- Watch composition: MBS versus Treasuries at the Fed, and APP versus PEPP reinvestment at the ECB.
- Watch the signal: taper, reinvestment tweaks, and runoff caps often move markets more than a single hike.
Dollar funding stress, cross currency basis and swap line signals
EUR/USD trades like a funding pair in stress. When USD funding gets tight, the USD tends to rise. EUR/USD tends to fall.
The cleanest market price of this is the EUR/USD cross currency basis. A more negative basis usually means higher USD funding pressure for non US banks and real money. That pressure can force hedging, asset sales, and dollar buying.
- Cross currency basis: track EURUSD basis in 3M and 1Y. A sharp move more negative often lines up with EUR/USD downside.
- Swap lines: Fed swap line usage and the cost versus market funding. Rising usage is a stress flag.
- FIMA repo and foreign official demand: spikes can signal a scramble for dollars or collateral.
Swap lines do not cut rates. They can still move EUR/USD because they change the price and availability of USD liquidity offshore.
Banking system liquidity and collateral, why FX moves during stress
During stress, FX reacts to plumbing. Liquidity and collateral decide who must sell and who can hold.
If funding markets seize, banks and leveraged funds reduce balance sheet usage. They cut positions. They hoard high quality collateral. That behavior tends to favor the USD.
- Repo stress: higher GC repo and SOFR volatility can tighten conditions fast.
- Collateral scarcity: richer Treasury specials can pull cash into USD assets and support the dollar.
- Margin dynamics: wider haircuts and higher margin calls force deleveraging, often negative for EUR/USD.
This is why EUR/USD can drop on days with no major data. The driver sits in funding and collateral, not the calendar.
What to watch, balance sheets and funding market indicators
| Driver | What to track | Typical EUR/USD bias when it tightens |
|---|---|---|
| Fed QT or Treasury duration supply | Fed SOMA holdings, QT caps, Treasury refunding size and tenor | Down |
| ECB reinvestment and liquidity | APP and PEPP holdings, reinvestment guidance, excess liquidity | Mixed, depends on relative US tightening |
| USD funding stress | EUR/USD cross currency basis, FRA OIS, SOFR spreads | Down |
| Swap line and backstop usage | Fed swap line usage, FIMA repo usage | Down first, then stabilizes if backstops expand |
| Broad liquidity conditions | OIS, repo rates, bill demand, money market fund flows | Down |
If you want a simple way to connect these signals to a trade plan, use this guide on fundamental analysis in forex.
How to build a simple EUR/USD driver dashboard (practical framework)
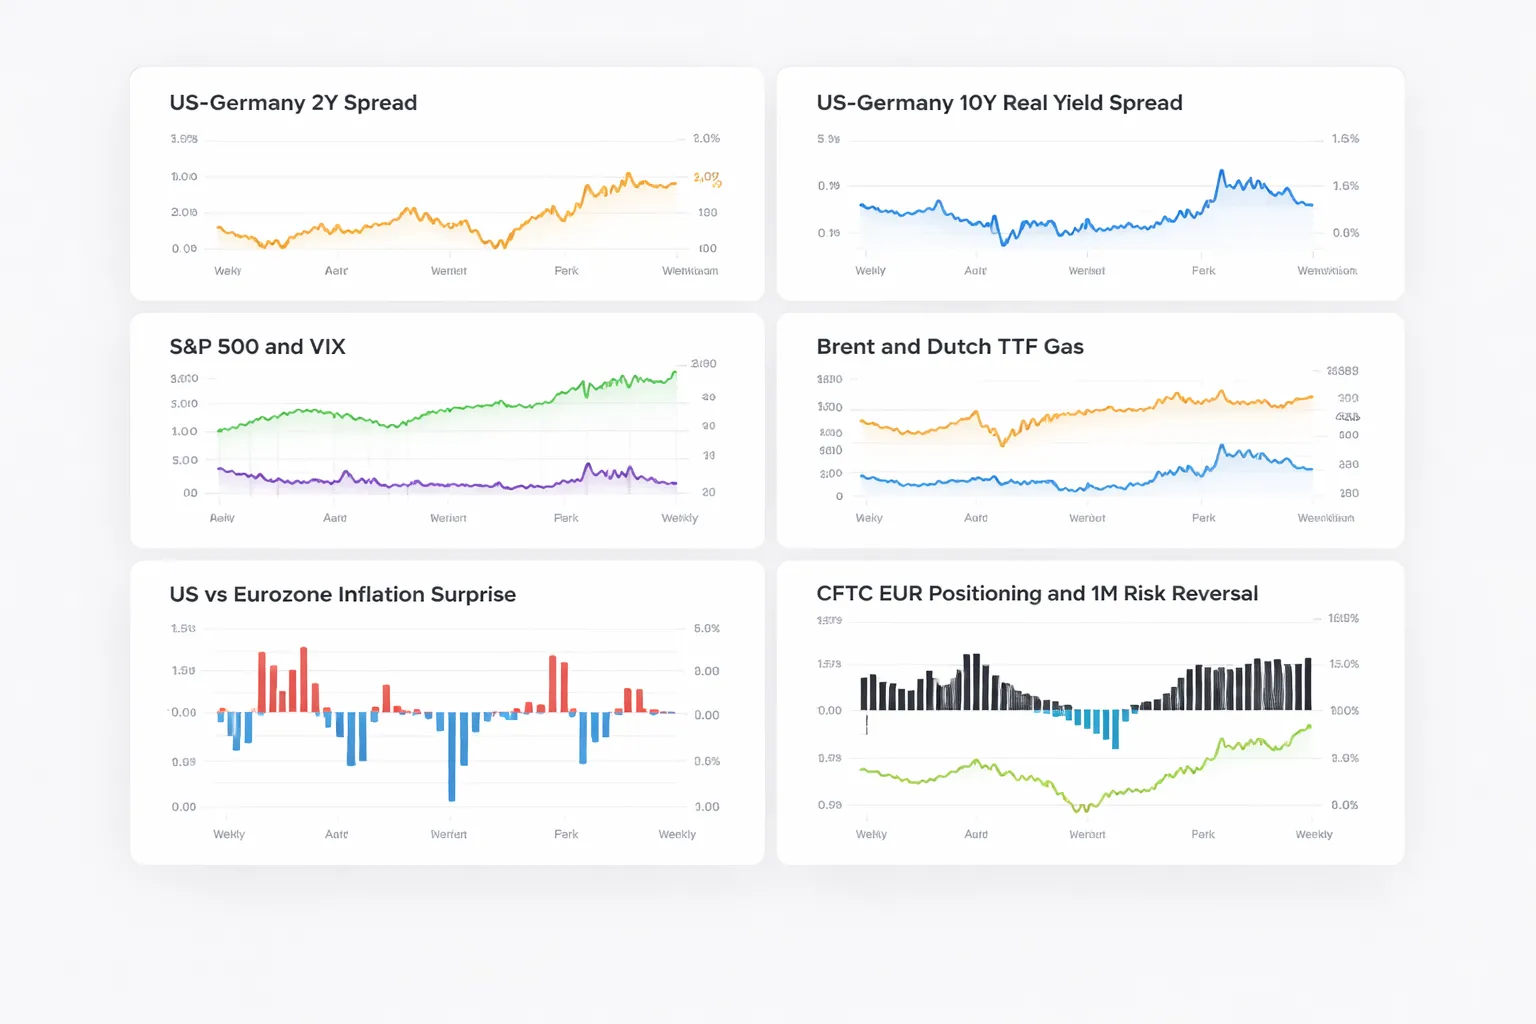
A 6-indicator checklist for weekly monitoring
You do not need 20 charts. You need six that update cleanly and cover the main EUR/USD transmission channels. Check them once a week, then check key releases on your calendar.
- 2-year rate spread (US minus Germany). Use UST 2Y and Schatz 2Y. This is your front-end policy proxy.
- 10-year real yield spread (US minus Germany). Use 10Y TIPS real yield and Euro real yield proxy if available. If not, track nominal 10Y spread plus inflation swap spread. This captures growth and real-rate support for the USD.
- Risk regime. Use S&P 500 plus VIX, or a simple risk index you trust. EUR/USD often trades as pro-risk when funding stress stays calm.
- Energy shock proxy. Track Dutch TTF gas and Brent crude. Europe terms of trade still matter when energy trends break.
- Relative inflation surprise. Track US CPI surprise index versus Eurozone HICP surprise index. Inflation surprises move the policy path, not last month’s level. For the core link, use this guide on inflation and exchange rates.
- Positioning and hedging pressure. Use CFTC EUR futures net positioning plus a simple proxy like 1-month EUR/USD risk reversals. This tells you when the market sits offside.
Mapping drivers to regimes: rates-led vs risk-led vs energy-led markets
Your dashboard works when you tag the regime first. Then you weight indicators, you do not average them.
| Regime | What you see | What tends to drive EUR/USD | How to weight your dashboard |
|---|---|---|---|
| Rates-led | 2Y spread trends for weeks, central bank repricing dominates headlines | Front-end yield spread, real yield spread, inflation surprises | Rates 60%, risk 20%, energy 10%, positioning 10% |
| Risk-led | Equities gap, volatility spikes, credit widens, funding talk returns | Risk proxies and liquidity conditions, then rates | Risk 50%, rates 30%, positioning 15%, energy 5% |
| Energy-led | TTF or Brent breaks trend, Europe growth narrative shifts fast | Energy prices, Euro growth expectations, then ECB pricing | Energy 45%, rates 35%, risk 10%, positioning 10% |
Tag the regime with two checks. First, what changed most over the last two weeks. Second, which chart explains most of the daily swings. Then follow that driver until it stops working.
Interpreting conflicting signals: which driver typically wins and why
Conflicts happen every week. You need a tie-break order. Use this hierarchy and adjust only when stress rises.
- Front-end rates usually win when the market reprices the next three to six meetings. EUR/USD tracks policy expectations because cash can move fast.
- Risk wins when volatility and funding conditions change. In stress, investors demand USD liquidity and reduce EUR exposure. Spreads matter less than access to dollars.
- Energy wins when Europe’s terms of trade shift. Large energy moves change the growth and inflation mix in the Eurozone, then the ECB path follows.
- Positioning wins at turning points. If the market sits crowded, a small catalyst can trigger a large unwind. Watch this when your top driver looks “right” but price refuses to follow.
Operational rule. If rates signal EUR strength but risk deteriorates fast, treat the move as fragile. If risk improves but rates reprice toward higher US front-end yields, expect rallies to fade. If energy spikes against Europe, do not ignore it even if rates still look supportive.
Common mistakes: overreacting to single prints, ignoring revisions, and missing positioning
- Overreacting to single prints. One CPI or PMI rarely changes the trend by itself. Wait for confirmation in rates pricing. If the 2Y spread does not move, the market did not believe the print.
- Ignoring revisions and base effects. Eurozone data revisions and seasonal noise can flip the story later. Track the revision pattern, not just the first release.
- Missing positioning. CFTC extremes and one-sided options skew can turn good news into a sell-the-fact move. If EUR longs sit stretched, demand a stronger catalyst to push EUR/USD higher.
- Mixing timeframes. Do not use a daily headline to override a multi-week rates trend unless liquidity stress rises. Align your dashboard to your holding period.
Pros, cons, and risks of trading EUR/USD based on fundamentals
Benefits of trading EUR/USD with fundamentals
- Clear macro catalysts. Rates, inflation, and growth surprises can move EUR/USD for days, not minutes. Focus on what changes the ECB Fed path, not the headline.
- Deep liquidity. EUR/USD trades around the clock with large, continuous flow. You get cleaner fills than most pairs, even when liquidity thins outside London and New York.
- Relatively tight spreads. Costs usually stay low in liquid sessions. That helps if you scale in, scale out, or trade around a core view.
Limitations you must expect
- Whipsaws around data. The first move often fades when details hit, revisions print, or positioning forces profit taking. Trade the path shift, not the first spike.
- Shifting correlations. EUR/USD can track rate spreads one month, then trade like a risk proxy the next. Recheck what matters now, use rolling windows, not last quarter's playbook.
- Narrative risk. Markets compress many facts into one story. The story can flip fast on one central bank phrase, one fiscal headline, or one geopolitical event. Your model can stay right while price trades wrong for longer than your horizon.
Risk management essentials for fundamentals traders
- Size for volatility. Build position size from expected daily range, not conviction. Use ATR or recent realized vol, then set size so a normal move does not force a bad exit.
- Place stops where the thesis breaks. Use levels tied to the driver, like a rate spread regime change, a policy repricing, or a clear failure after the key data. Avoid stops at obvious round numbers during event weeks.
- Run an event calendar. Know the next CPI, payrolls, PMI, ECB, and Fed events, plus auctions and key speeches. Do not hold full risk through tier one releases unless your edge comes from that event. Use an forex economic calendar to map the week.
- Set volatility expectations before you enter. Check implied vol and the expected move into events. If pricing implies a big range, demand a bigger catalyst and wider risk limits, or cut size.
- Plan the invalidation time. Fundamentals can take time to pay. Decide how long you give the trade to work, if the driver does not intensify, exit or reduce.
FAQ
What is the single biggest driver of EUR/USD?
Rate differentials. Track expected ECB versus Fed policy paths, not just spot rates. Watch OIS curves, 2-year yields, and changes in first-cut or first-hike pricing. When those shift fast, EUR/USD can trend for days.
Which events move EUR/USD the most?
ECB and Fed decisions, CPI, and top-tier jobs data. Add key PMIs and wage prints. Focus on surprises versus consensus, plus revisions. Use a forex economic calendar to see clustering and plan around the highest-impact releases.
Why does EUR/USD jump on CPI and jobs data?
Because those prints change rate expectations. A hot CPI or strong jobs report can push yields up and support USD. A soft print can pull yields down and lift EUR. The reaction depends on whether the data changes the next meeting.
Does risk sentiment move EUR/USD?
Yes. In risk-off moves, USD often benefits from safe-haven demand and funding flows. In risk-on phases, EUR can outperform if Europe data holds and the Fed looks closer to easing. Track equities, credit spreads, and VIX for regime shifts.
How does energy affect EUR/USD?
Europe imports energy. Higher energy prices can hurt the Eurozone trade balance and growth, and lift inflation risk. That mix can pressure EUR. Watch Brent and European gas, plus spillover into inflation expectations and ECB pricing.
What role do bond yields play?
Yields transmit policy expectations into FX. EUR/USD often reacts to changes in US-German 2-year and 10-year spreads. Focus on the move, not the level. A fast widening in favor of the US usually supports USD.
How important are Eurozone versus US growth surprises?
Very. Growth surprises change capital flow expectations and central bank paths. Track PMIs, retail sales, and industrial production. Watch relative surprise indices and whether data shifts recession or re-acceleration pricing. Relative growth matters more than absolute growth.
Why does EUR/USD sometimes ignore big headlines?
Markets pre-price information. If positioning already reflects the headline, the move fades. Also, one driver can dominate. If rate pricing stays stable, geopolitical news may not stick. Check yield spreads and implied volatility to gauge real repricing.
How can you prepare for event risk in EUR/USD?
Map the week, set expected range, then size risk to volatility. Check implied vol and the expected move into the event. Define your invalidation time. If the driver does not intensify after the release, reduce or exit.
What is the best time to trade EUR/USD?
Liquidity peaks during London and the London-New York overlap. Spreads tighten and follow-through improves. The highest slippage risk often hits at data release times. If you trade news, use predefined orders and smaller size.
Which data sources should you watch weekly?
- Rates: OIS curves, 2-year yields, US-German spreads.
- Inflation: US CPI, Eurozone HICP, wage data.
- Growth: PMIs, payrolls, ISM.
- Risk: S&P 500, VIX, credit spreads.
Conclusion
Conclusion
EUR/USD moves on two forces first, the rate gap, and second, risk mood. Start with US German 2 year spreads and OIS pricing. Then confirm with CPI and wage prints, PMIs, and payrolls. Use equities, VIX, and credit spreads as your risk filter.
Keep your process simple. Build a weekly dashboard. Track the trend in spreads, and the next two data releases that can change them. Trade smaller into event risk. Add size only after pricing and spreads settle in London and the New York overlap.
If you want to go deeper on one core driver, read inflation and exchange rates.
- Base case: spreads drive direction.
- Catalysts: inflation, wages, and growth surprises shift rate expectations.
- Filter: risk on supports EUR, risk off supports USD.
- Execution: avoid big size at the release, trade after the first repricing.
-
Fundamental Analysis in Forex Explained (What Actually Moves Prices)
4 months ago -
How Interest Rates Affect Currency Pairs (With Real Examples)
4 months ago -
How to Trade Forex News (NFP, CPI, FOMC) Without Getting Wrecked
4 months ago -
Inflation and Exchange Rates Explained (Why Currencies Rise or Fall)
4 months ago -
Economic Calendar for Forex: How to Use It (Step-by-Step)
4 months ago
-
-
- Why oil and gas shocks can hit EUR via trade balance and industrial costs
- Natural gas and European power prices, transmission to inflation and growth expectations
- When commodities dominate: geopolitics, supply shocks, and shipping disruptions
- How to track it: Brent, TTF gas, and Eurozone trade balance trends
-
- Elections, coalition risk, and policy uncertainty in major member states
- Sanctions, conflicts, and security shocks: channels into energy, trade, and risk sentiment
- US political risk: tariffs, trade policy, and global growth implications
- Event-risk playbook: how to think in scenarios rather than predictions
-
- What is the single biggest driver of EUR/USD?
- Which events move EUR/USD the most?
- Why does EUR/USD jump on CPI and jobs data?
- Does risk sentiment move EUR/USD?
- How does energy affect EUR/USD?
- What role do bond yields play?
- How important are Eurozone versus US growth surprises?
- Why does EUR/USD sometimes ignore big headlines?
- How can you prepare for event risk in EUR/USD?
- What is the best time to trade EUR/USD?
- Which data sources should you watch weekly?
-
-
- Why oil and gas shocks can hit EUR via trade balance and industrial costs
- Natural gas and European power prices, transmission to inflation and growth expectations
- When commodities dominate: geopolitics, supply shocks, and shipping disruptions
- How to track it: Brent, TTF gas, and Eurozone trade balance trends
-
- Elections, coalition risk, and policy uncertainty in major member states
- Sanctions, conflicts, and security shocks: channels into energy, trade, and risk sentiment
- US political risk: tariffs, trade policy, and global growth implications
- Event-risk playbook: how to think in scenarios rather than predictions
-
- What is the single biggest driver of EUR/USD?
- Which events move EUR/USD the most?
- Why does EUR/USD jump on CPI and jobs data?
- Does risk sentiment move EUR/USD?
- How does energy affect EUR/USD?
- What role do bond yields play?
- How important are Eurozone versus US growth surprises?
- Why does EUR/USD sometimes ignore big headlines?
- How can you prepare for event risk in EUR/USD?
- What is the best time to trade EUR/USD?
- Which data sources should you watch weekly?
-
How to Place a Forex Trade Step by Step (Your First Trade Explained)
2 months ago -
Forex Trading vs Crypto Trading: Which Market Is Better for Beginners?
2 months ago -
Forex Lot Size Calculator: How to Use It to Size Trades Correctly
4 months ago -
How to Calculate Position Size in Forex (Position Sizing Formula + Examples)
4 months ago -
Forex Leverage Explained: How It Works, Pros, Cons & Examples
4 months ago
-
Is Forex Trading Legal in the United States? Rules, Regulators & What to Know
4 months ago -
Forex Market Hours & Trading Sessions Explained (Best Times to Trade)
4 months ago -
Forex Trading Platforms Comparison: MetaTrader vs cTrader vs TradingView
4 months ago -
Forex Leverage Explained: How It Works, Pros, Cons & Examples
4 months ago -
What Is a Lot Size in Forex? Lot Types + Quick Examples
4 months ago