TradingView for Forex: How to Use It (Charts, Alerts & Layouts)
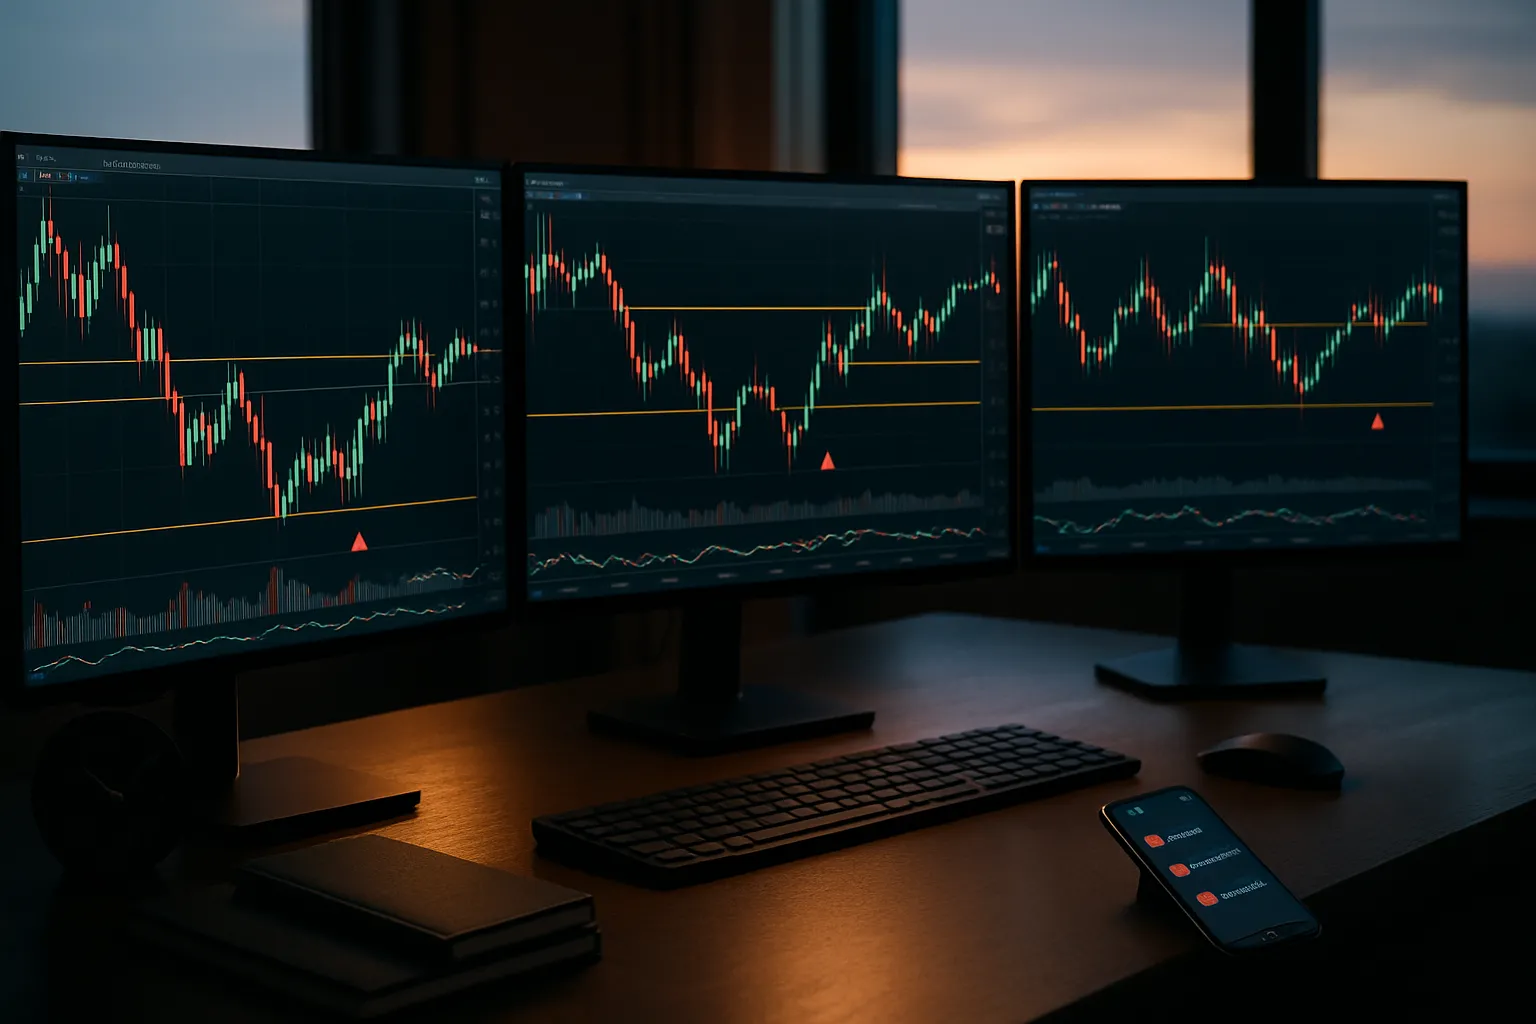
TradingView gives you fast forex charts, clear price levels, and alerts that fire when your rules hit. This guide shows you how to use it for daily analysis and trade planning.
You will learn how to set up forex charts, pick the right symbol and session, and build clean layouts for different pairs and timeframes. You will also learn how to create alerts for price, trendlines, and indicators, and how to manage them so you do not miss signals. If you trade on another terminal, you can compare your workflow against MetaTrader vs cTrader vs TradingView.
Key Takeaways
- In het kort: Use the right forex symbol and data feed first. Your chart means nothing if the quote source differs from your broker.
- Set your time zone and session settings. Match them to your trading hours so you read candles and daily closes correctly.
- Build one clean layout per use case. Example, a layout for majors on H1, another for entries on M15, another for swing on D1.
- Keep indicators minimal. Add only what changes your decision, remove the rest.
- Use alerts to offload monitoring. Set price level alerts, trendline alerts, and indicator alerts, then test them once.
- Name and group alerts by pair and timeframe. You cut noise and you spot what matters fast.
- Save templates for charts and indicators. You speed up setup when you add new pairs.
- Track and clean your alert list weekly. You avoid stale signals and duplicate triggers.
- If you execute in another terminal, map your workflow. Use TradingView for analysis and alerts, then place orders where you trade, compare with cTrader vs MetaTrader.
What TradingView Does for Forex Traders (and What It Doesn’t)
Charting vs trading execution, know the split
TradingView helps you analyze forex. It does not control your broker account by default.
You use it to read price, mark levels, test ideas, and run alerts. You still need a broker or trading terminal to execute trades, manage margin, and handle funding.
If you trade inside TradingView, you still trade through a connected broker. TradingView stays the interface, your broker stays the counterparty.
When you can trade forex directly from TradingView
You can place forex trades from TradingView when your broker supports TradingView integration and you connect your live or demo account.
- Supported broker required. If your broker is not on the TradingView broker list, you cannot execute from TradingView.
- Account type matters. Some brokers support certain regions, entities, or account types only.
- Feature set varies. Order types, partial closes, trailing stops, and reports depend on the broker connection.
If you need a clear side by side view of execution platforms, use this TradingView vs MetaTrader vs cTrader comparison.
When you cannot trade forex from TradingView
- Your broker does not integrate with TradingView. You can still chart, but you must execute elsewhere.
- You trade via a prop firm or bridge setup. Many funded accounts run through MT4, MT5, or cTrader only.
- You need broker specific tools. Some platforms bundle depth of market, advanced order management, or risk controls that TradingView does not provide for your account.
Common forex use cases that TradingView handles well
- Multi pair analysis. Scan pairs fast, keep clean watchlists, and compare correlated markets.
- Clean chart workflows. Save layouts, templates, and drawing sets per pair or per strategy.
- Alerts. Run price, indicator, and condition alerts, then act in your execution platform.
- Backtesting. Use bar replay for manual testing, and Pine strategies for rules based tests.
- Sharing and review. Publish ideas, keep private notes, and journal screenshots with timestamps.
Limitations you need to plan around
- Spreads differ from your broker. TradingView forex charts often use aggregated or synthetic feeds. Your broker spread can widen at rollover, news, and low liquidity. Build triggers with buffers, not exact pip precision.
- Swap and rollover are not on the chart. TradingView does not apply your broker swaps, commissions, or financing to candles. Your P and L can diverge from what the chart suggests, especially on holds across rollover.
- Broker pricing differences. Two brokers can show different highs, lows, and closes on the same minute. That changes stop placement, fills, and whether an alert triggers. Always confirm key levels on your execution feed.
- Latency and alert delivery. Alerts fire after the condition registers on TradingView servers. They can arrive late during fast markets. Use hard stops on the broker side, and treat alerts as prompts, not protection.
- No guarantee of fills. Even if you trade through a connected broker, TradingView cannot force pricing, execution speed, or slippage. Those sit with your broker and your connection.
Setting Up TradingView for Forex: Account, Data, and Core Preferences
Choosing a plan, free vs paid
Pick a plan based on four limits, alerts, indicators, layouts, and charts. Everything else is secondary for forex chart work.
- Alerts. Free plans cap how many alerts you can run at once. Paid plans raise the cap. If you trade multiple pairs and timeframes, you will hit the free limit fast.
- Indicators per chart. Free plans allow fewer indicators on a single chart. Paid plans increase the count. If you stack tools like MA, VWAP, ATR, sessions, and a custom script, you may need a paid tier.
- Layouts. Layouts control how many charts you can view and save in one workspace. Free is fine for one pair at a time. Paid helps if you monitor several pairs, higher timeframes, and a separate execution chart.
- Charts per layout. More charts per layout matters for top down analysis. One chart forces constant symbol and timeframe switching. Multiple charts reduce mistakes.
If you already execute on MT4, MT5, or cTrader, treat TradingView as your analysis and alert layer, and keep execution rules inside your broker platform. This matters more than plan level features. See the platform comparison if you want to split charting and execution on purpose.
Pick the correct forex symbol and source
Forex symbols in TradingView come from different feeds. The feed changes your chart.
- FX: Aggregated quotes. Good for general analysis and broad levels. It may not match your broker candle for candle.
- OANDA, FXCM, FOREX.com, and other brokers: Broker sourced pricing. Better for alignment with your execution account when you use that broker.
- Why it changes your chart. Different feeds can shift the high, low, and close. Small differences matter near stop levels, session highs, and breakout triggers. Your backtests and alerts can also fire at different times.
Rule. Analyze and alert on the same feed you use to execute. If you cannot, at least keep your feed consistent across every chart and timeframe.
Quick workflow. Use the symbol search, type your pair, then pick the source from the results list. Do not assume the first result matches your broker.
Timezone, session breaks, and weekend candles
These settings change what you see, especially on lower timeframes and on daily candles.
- Timezone. Set the chart timezone to match your trading routine. Many traders use New York close logic for daily candles. Others use their local time to align with work hours. Pick one and keep it fixed.
- Session breaks. Some feeds print cleaner transitions between sessions. Others show continuous flow. Session boundaries affect how you mark Asia range, London open, and New York open.
- Weekend candles. Some data sources print small Sunday candles. Others merge them into Monday. Sunday candles can distort daily patterns and indicators that use daily closes.
| Setting | What it impacts | What to do |
|---|---|---|
| Timezone | Daily candle close, session timing, alert timing | Pick one timezone and stick to it across all charts |
| Weekend candles | Daily structures, gaps, indicator values | Use a feed that matches your broker, avoid mixing feeds in analysis |
| Session view | Range marking, open volatility windows | Use the same session logic in templates and layouts |
Build a clean default chart
Start with clarity. Reduce anything that hides price.
- Candles. Use standard candles or Heikin Ashi, but do not mix them across layouts. Heikin Ashi changes closes and can mislead alerts that depend on real closes.
- Scales. Use a right scale. Keep it visible. Use log scale only for long term charts, it rarely helps on intraday forex.
- Theme and colors. Use a high contrast background, then keep bullish and bearish candle colors consistent across every chart. Consistency reduces misreads when you switch pairs.
- Visibility settings. Turn off visual noise you do not use, like indicator titles, values, or background fills, unless they drive a decision. Keep the crosshair and OHLC readout visible.
- Price line. Keep last price line on. Use it for fast context, not for entries.
Goal. When you open any pair, you should see trend, key levels, and current price in under two seconds.
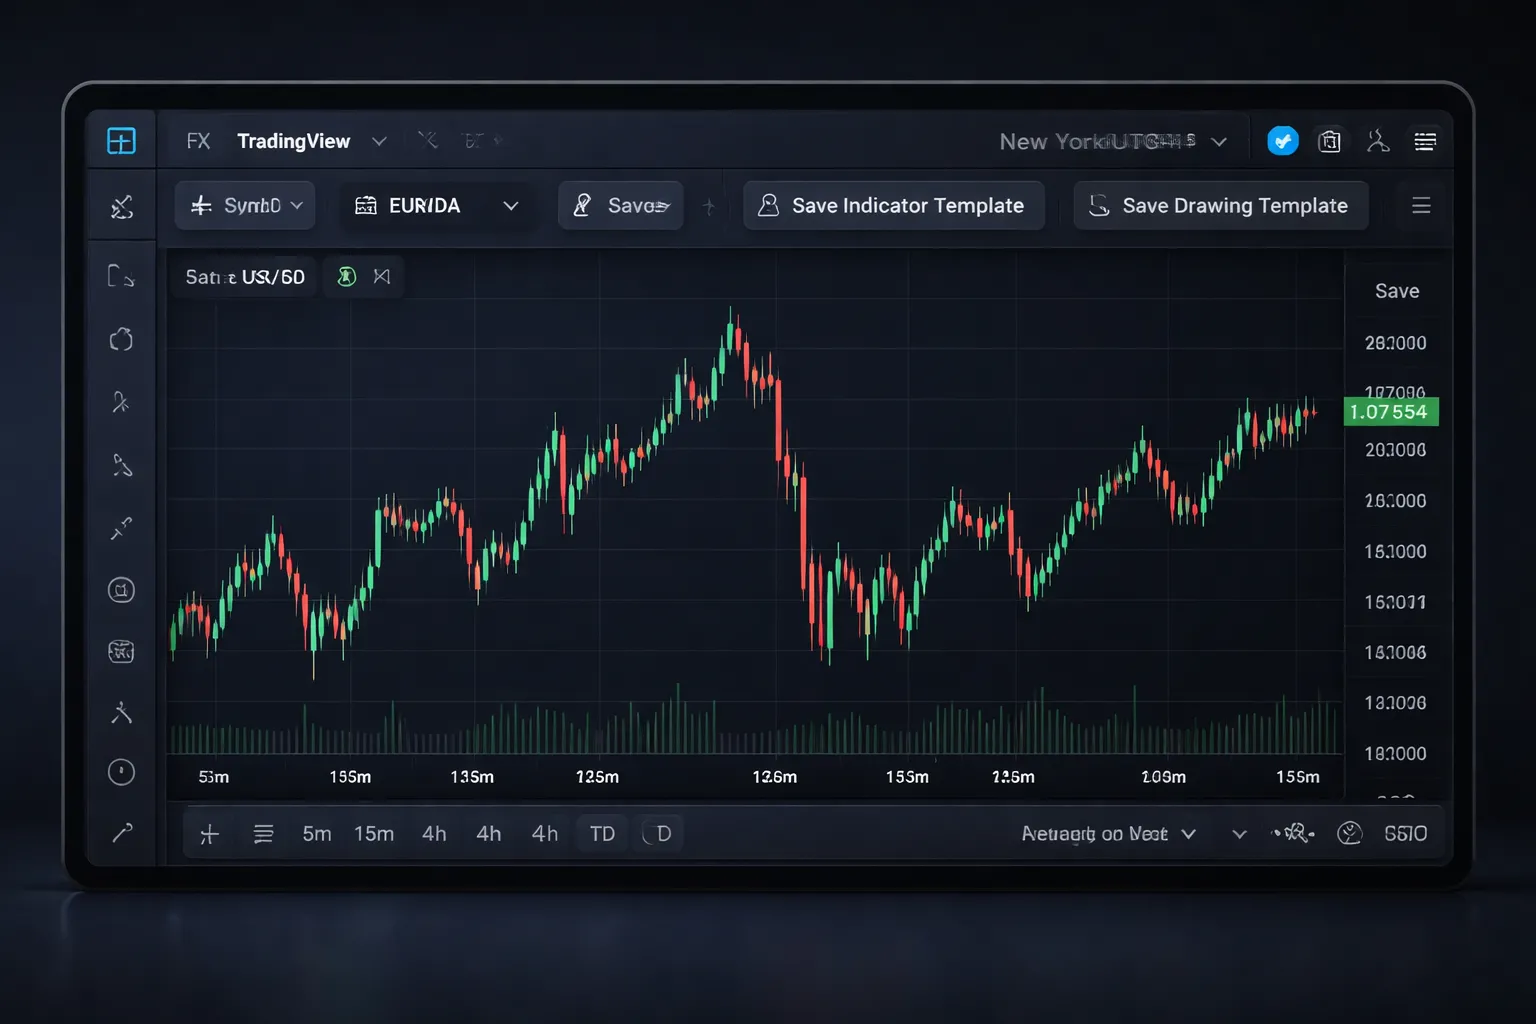
Save your first template, layout vs indicator vs drawing
TradingView saves chart setups in three different buckets. Use each one on purpose.
- Chart layout. Saves your workspace. This includes symbol slots, chart count, timeframes, and which indicators sit on each chart. Use layouts for your routine, like one layout for London session pairs and one for swing charts.
- Indicator template. Saves your indicator stack and settings. Use it to apply the same tools to any new chart fast.
- Drawing template. Saves styles for drawings, like line color, thickness, fib settings, and label format. Use it to keep support and resistance clean across charts.
Rule. Build one clean indicator template and one clean drawing template first. Then build layouts around them. This keeps your charts consistent and reduces setup errors.
Navigating Forex Charts: Timeframes, Tools, and Price Action Basics
Selecting Timeframes: Analysis vs Entries
Use higher timeframes to set direction and levels. Use lower timeframes to time entries.
- Weekly and Daily: Mark major swing highs and lows. Mark trend direction. Find clean support and resistance.
- 4H and 1H: Refine zones. Track structure shifts. Spot range breaks that matter.
- 15m and 5m: Trigger entries. Define invalidation. Avoid using these charts to pick the main bias.
Workflow: start on Daily, drop to 4H for context, then use 15m to execute. Keep the same symbol and session hours across charts. Do not mix a 5m entry plan with a daily stop size. Match your stop and target to the timeframe you trade.
Candles, Heikin Ashi, and Bars
Chart type changes what you see. It also changes what you miss.
- Candles: Best default for forex. You see opens, highs, lows, and closes. You see wick rejection and momentum.
- Bars: Same data as candles. Cleaner when you mark levels. Useful on crowded charts.
- Heikin Ashi: Smooths swings. Helps you hold trends and filter noise. It can mislead entries and stops because prices are averaged. Do not place precise orders off Heikin Ashi alone.
Rule: use candles or bars for execution and risk levels. Use Heikin Ashi as a trend filter, then confirm on candles.
Price Action Basics You Should Read Fast
- Trend: higher highs and higher lows, or lower highs and lower lows.
- Range: repeated highs and lows with failed breaks.
- Break and retest: price breaks a level, returns to it, then continues.
- Wicks: long wicks at a level often signal rejection. Confirm with the next candles.
Stay consistent. If you mark a level on the Daily, respect it on the 15m. Do not redraw levels just to fit the lower timeframe.
Drawing Tools That Matter in Forex
Use fewer tools. Use them the same way on every pair.
- Horizontal line: key for daily highs and lows, swing points, and round numbers.
- Ray: same as a line but extends right. Best for levels you want to project forward.
- Trendline: connect at least two clean swing points. Use the third touch as validation.
- Parallel channel: map trend structure and pullback zones. Works well on steady pairs.
- Rectangle: mark supply and demand zones, Asia range, and overlap ranges.
Keep drawings objective. Anchor to obvious pivots. If you need to force it, skip it.
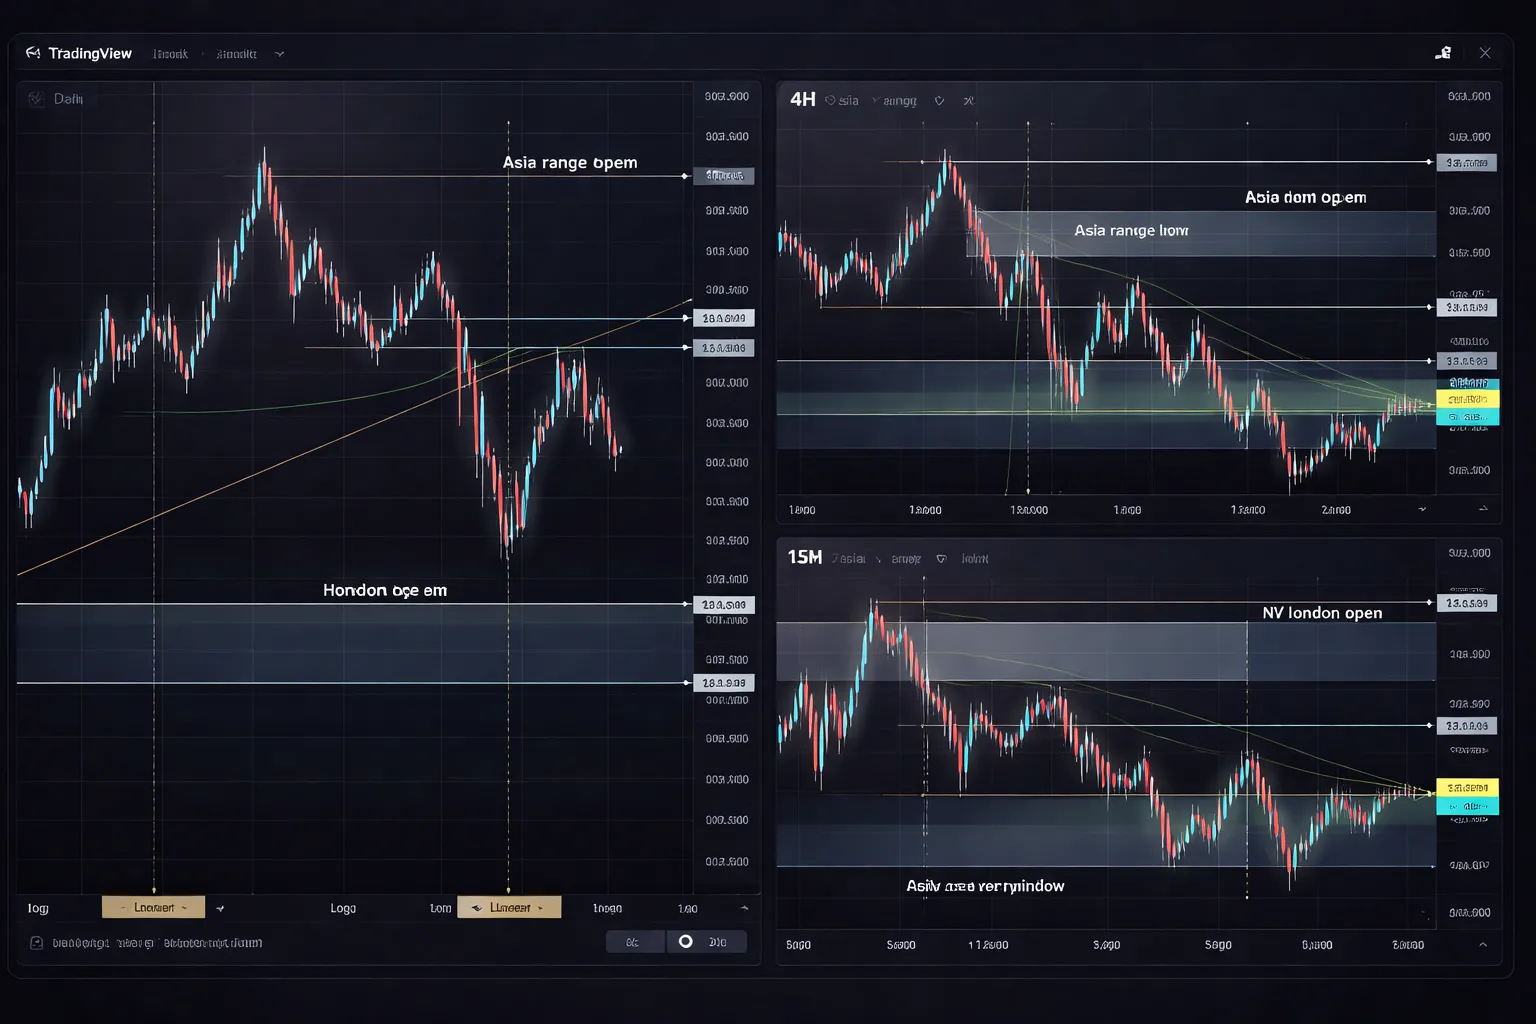
Marking Sessions and Key Levels
Forex moves with liquidity windows. Mark the levels that traders defend when volume rises.
- Asia range: mark the high and low from Tokyo hours. Many days break this range during London.
- London open: watch for a fakeout then continuation. Mark the first 30 to 60 minutes high and low if you trade intraday.
- London and New York overlap: often the highest liquidity. Expect faster breaks and deeper pullbacks.
- Daily open: useful bias line for intraday. Track price above or below it.
- Previous day high and low: common targets and reversal areas.
- Weekly open: helps filter chop early in the week.
Set alerts on these levels instead of watching every tick. If you also use other platforms, compare how they handle session settings in this forex trading platforms comparison.
Chart Scales: Linear vs Log and When to Use Each
Most forex pairs work fine on linear scale. Use log scale when you analyze large multi year moves or big percentage swings.
- Linear: equal price distance looks equal on the chart. Best for intraday and swing trading in normal ranges.
- Log: equal percentage moves look equal. Helps when a pair trends for years or doubles in price.
Rule: do not switch scales mid analysis. Your trendlines and channels will shift. Pick one per timeframe and keep it consistent in your layout.
Indicators for Forex on TradingView: Practical, Minimalist Stacks
Core Trend Tools: Moving Averages, Market Structure, Higher Highs and Lower Lows
Start with price. Add one trend filter. Keep the chart readable.
- Market structure first: mark the last swing high and swing low on your main timeframe. You trade in the direction of higher highs and higher lows, or lower highs and lower lows.
- One or two moving averages: use them as a filter, not a signal factory.
- Clean defaults: 20 EMA for short-term trend, 50 EMA for medium trend, 200 SMA for regime. You do not need all three on one chart.
- Use closes: judge trend by candle closes relative to your MA. Wicks create noise.
- Multi-timeframe context: set structure on a higher timeframe, execute on a lower one. Keep the scale rule consistent per timeframe.
Minimal stack for trend context: price, structure lines, 20 EMA or 50 EMA. That is enough for most forex charts.
Volatility and Risk Context: ATR, ADR, Realistic Targets
Forex pairs move in ranges. Volatility tells you what is realistic today.
- ATR: use ATR(14) on your execution timeframe to size stops and avoid placing them inside normal noise.
- Practical stop check: if your stop is far smaller than current ATR, you will get tagged often. If it is far larger, your position size usually needs to drop.
- ADR: use ADR to gauge typical daily travel. It helps you avoid targets that require an above-average day.
- Target realism: if price already moved close to its ADR, expect slower continuation. Favor tighter targets, or wait for a pullback.
Momentum and Mean-Reversion Tools: RSI, Stochastic, Divergence Cautions
Use oscillators for context. Do not use them to override structure.
- RSI: use RSI(14) as a regime read. In uptrends, RSI often holds above 40 to 50. In downtrends, it often caps near 50 to 60.
- Stochastic: use it for timing inside ranges. It works best when price respects clear support and resistance.
- Overbought and oversold: treat them as “strong momentum” in trends, and “stretch” in ranges.
- Divergence: keep it as a warning, not an entry. Divergence can persist while price keeps trending.
- Filter rule: only take mean-reversion signals when structure shows range behavior. Lower highs and higher lows, or repeated rejections at clear levels.
Minimal stack for momentum: RSI only. Add stochastic only if you trade ranges often.
Volume in Forex: What TradingView Volume Represents, Safer Alternatives
Spot forex has no central exchange volume. Most TradingView forex volume is broker feed tick volume, or a proxy tied to that data source.
- What it is: count of price updates, or activity on that broker feed. It can track relative activity, but it is not total market volume.
- What to avoid: volume-based indicators that assume centralized volume, like classic accumulation models, without verifying the data source.
- Safer alternatives: tick volume on the same symbol and broker, currency futures volume as a proxy (like 6E for EUR, 6J for JPY), and volatility tools like ATR when you need an activity gauge.
- Consistency rule: if you use tick volume, keep the same broker feed in your layout. Switching feeds changes the series.
Build Indicator Templates per Strategy, Avoid Overfitting
Templates keep you consistent. Minimal stacks reduce curve-fitting.
- Trend-following template: price, structure lines, 50 EMA, ATR(14), optional RSI(14) for regime check.
- Ranging template: price, support and resistance, RSI(14) or stochastic, ATR(14) for stop realism. Skip multiple MAs.
- News-aware template: same as your main template, plus session markers. Do not add indicators to “predict” spikes.
- Limit inputs: avoid stacking similar tools. Two momentum indicators often tell you the same thing.
- One change at a time: if you adjust a setting, log the reason and measure results over a fixed sample. Do not optimize by feel.
- Keep it portable: your setup should work across majors. If it only works on one pair and one month, you overfit.
If you need a platform comparison before you commit to a workflow, see our forex platforms comparison.
Forex Layouts on TradingView: Multi-Chart Workflows That Actually Work
Multi-timeframe grid: 1D, 4H, 1H, 15m for one pair
Use this layout when you trade one pair and you need context plus timing.
- 1D: Market bias. Mark weekly highs and lows. Mark major swing points. Decide if you want to buy, sell, or stand aside.
- 4H: Structure and levels. Draw the current range. Mark last higher low or lower high. Note trend breaks.
- 1H: Setup chart. Define the trigger zone. Track session highs and lows. Confirm momentum shift with one tool, not three.
- 15m: Execution timing. Place entry and stop. Manage the first reaction. Avoid redrawing levels here.
Keep the same symbol across all four charts. Lock the crosshair and sync time. Your eye should move top to bottom, then back up before you click.
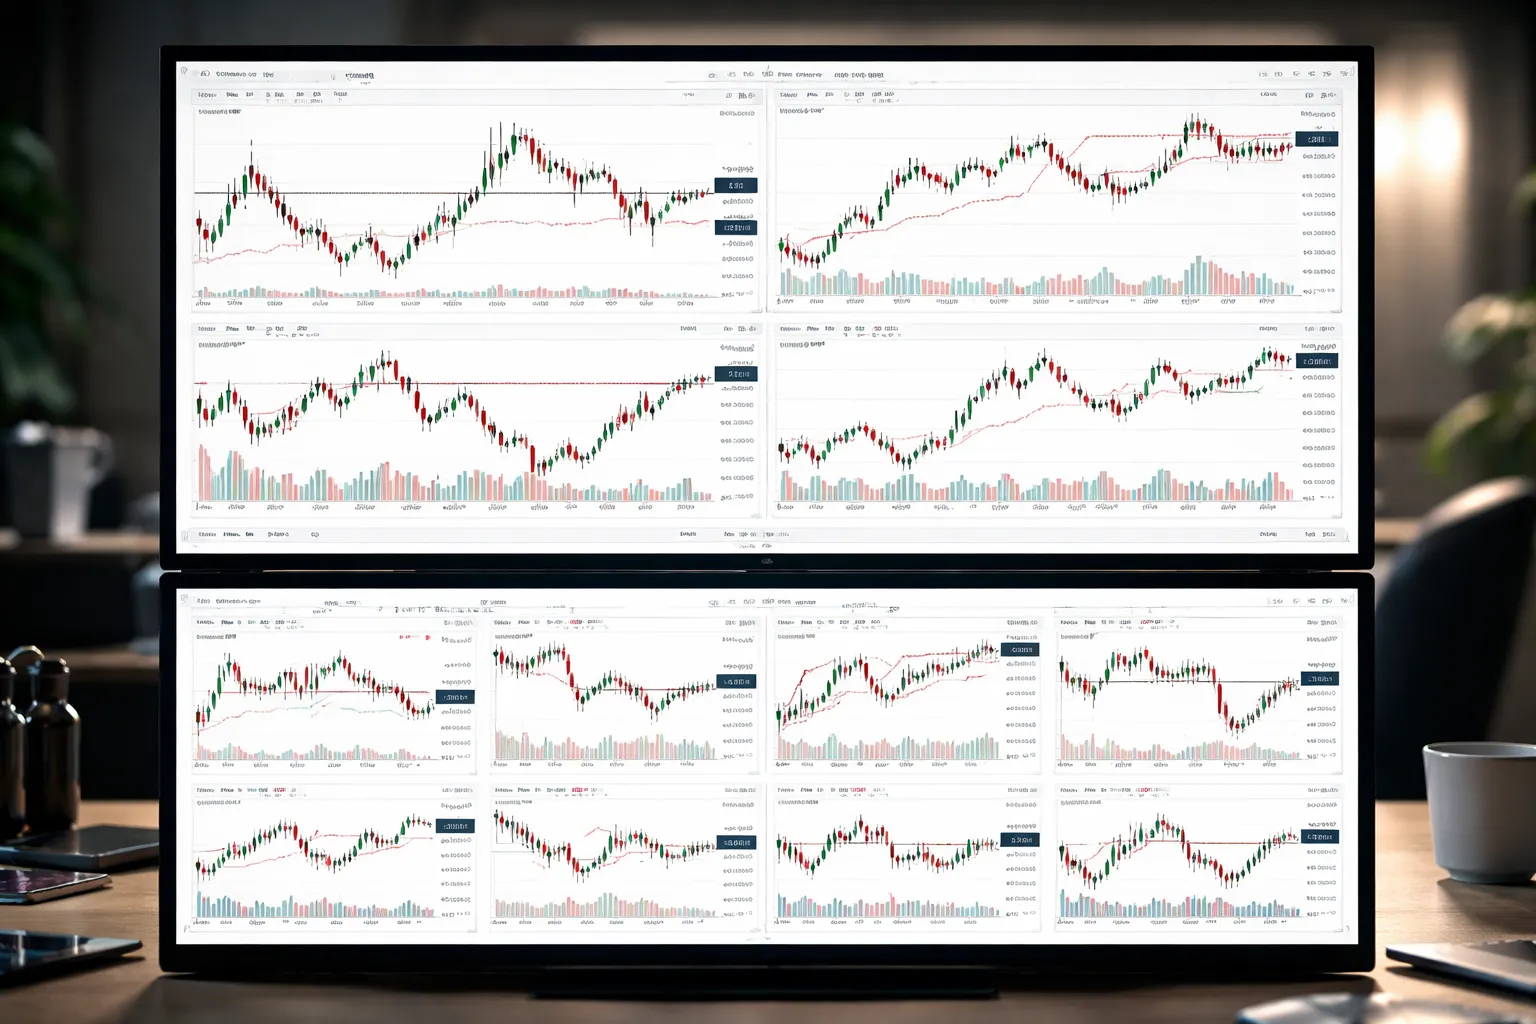
Multi-pair monitoring: majors, minors, and correlation pairs
Use this layout when you scan and rank pairs before you commit.
- Core block: 6 to 8 majors you trade most. Keep the same timeframe on all tiles, usually 1H or 4H.
- Secondary block: 4 to 6 minors you trade less. You want quick confirmation, not deep analysis.
- Correlation block: Put linked pairs next to each other. Example sets, EURUSD with USDCHF, AUDUSD with NZDUSD, GBPUSD with EURGBP.
Use one consistent template. Same candles, same indicators, same session shading. If one tile looks different, you waste time checking settings instead of price.
Top-down workflow: analysis chart, execution chart, review chart
Separate thinking from clicking. This cuts mistakes.
- Analysis chart: Higher timeframe, 4H or 1D. Levels, trend, key zones. No entry signals. No alerts.
- Execution chart: Lower timeframe, 5m to 15m if you day trade, 1H if you swing. One trigger method. Trade tools visible.
- Review chart: Same timeframe as execution. Add your entry and exit markers. Add screenshots. Log what you saw, not what you felt.
If you also execute in MetaTrader, keep the TradingView execution chart as your decision screen and use MT4 or MT5 for order placement.
Saving, duplicating, and syncing layouts across devices
- Save after every structural change: Timeframes, number of panes, and chart templates. Do not save after random zooming.
- Duplicate before experiments: Make a copy, test for a fixed sample, then promote the winner. This keeps your main layout stable.
- Sync with intent: Use the same layout names on desktop and mobile. Keep a mobile version with fewer panes and thicker drawings.
- Template discipline: Change indicators in the template, not per chart. Per-chart edits cause silent drift.
Naming conventions and organization that prevent clutter
Bad naming creates duplicate layouts and broken routines. Use a strict format.
| Layout name | What it means |
|---|---|
| FX MTF EURUSD D4H1H15 | One-pair grid for EURUSD, four timeframes, fixed order. |
| FX Scan Majors 4H | Multi-pair scan set, all tiles on 4H. |
| FX Exec NY 15m | Execution chart for the New York session, 15m trigger. |
| FX Review Week | Review layout for post-trade notes and screenshots. |
- Prefix by asset class: Start all forex layouts with FX. Your layout list stays sortable.
- Include timeframe in the name: You stop opening the wrong grid.
- Limit active layouts: Keep 3 to 5. Archive the rest with an OLD prefix.
- One purpose per layout: Scan, analyze, execute, review. Do not mix them.
Creating Forex Alerts: Price, Indicator, and Drawing-Based Setups
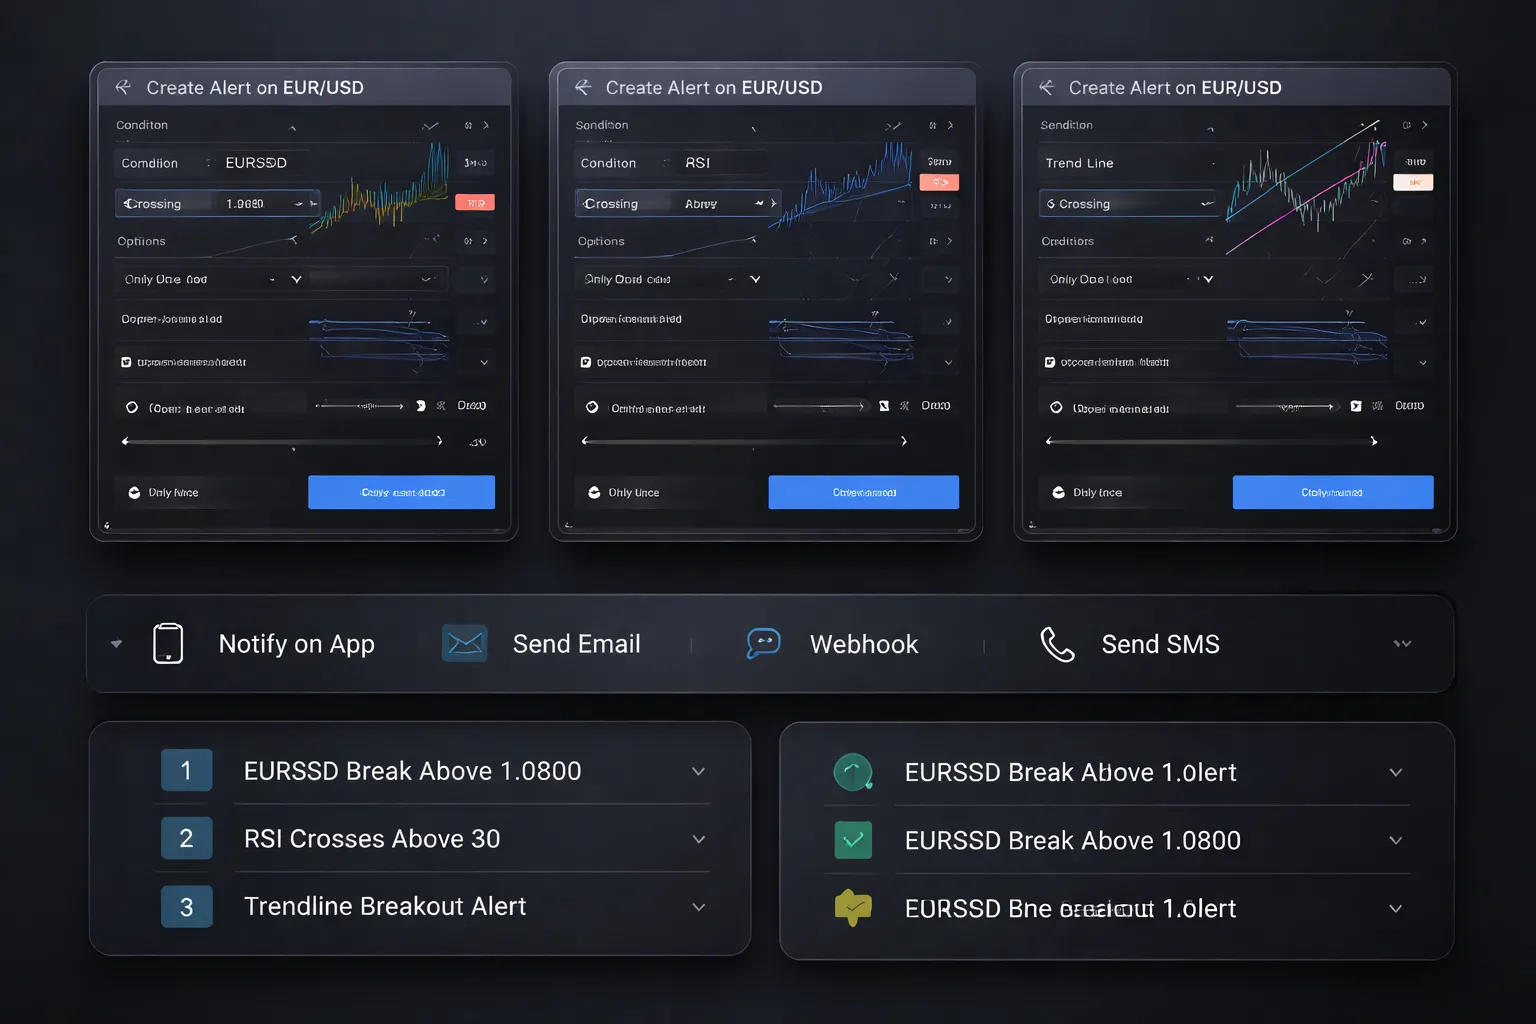
Price alerts, crossing, touching, and percent moves
Use price alerts for key levels. Highs, lows, session ranges, and prior day levels. You get the signal without watching the screen.
- Crossing a level: Use when you want confirmation. Example, EURUSD crosses above 1.0900. This cuts false pings from near misses.
- Touching a level: Use when you want the first tag. Example, GBPUSD touches the London high. Good for limit order workflows and reactions at supply or demand.
- Percent moves: Use to catch momentum days. Example, alert when USDJPY moves 0.50 percent from today’s open. Best when you trade volatility expansions and you do not care about the exact price.
Keep price alerts tied to levels you can explain in one line. If the level does not change your plan, delete the alert.
Indicator alerts, conditions, confirmations, and spam control
Indicator alerts work best as filters. Use them to confirm price, not replace it.
- Condition alerts: RSI crosses above 50. MACD histogram flips positive. Moving average slope turns up.
- Confirmation alerts: Combine indicator logic with structure. Example, alert on a 20 EMA cross only on the execution timeframe, and only near a marked support zone.
- Spam control: Indicators can fire often. Reduce noise by using crosses instead of “greater than.” Use higher timeframes for trend filters, and lower timeframes for entries.
If an indicator alert triggers more than once per session and you do not act on it, tighten the rule or remove it.
Trendline and horizontal line alerts for breakouts
Drawing-based alerts let you track breakouts and holds without staring at charts.
- Horizontal line alerts: Mark the range high, range low, prior day high, and prior week low. Set an alert on the line. This works well for clean breakout levels.
- Trendline alerts: Draw the trendline with two clean anchors. Set the alert on the line. This catches trend breaks and pullback failures.
- Refine with timeframe: Keep the drawing on the timeframe you trade. A line from the daily chart can trigger too early if you execute on 5 minutes.
Update drawings when structure shifts. Old lines create false urgency.
Alert delivery options, app, email, SMS, and webhook
- App notifications: Best for active trading. Fast, visible, and easy to act on.
- Email: Best for slower swing setups and audit trails. Use it when you want a record you can search.
- SMS: Best for critical levels when you step away from screens. Use sparingly to avoid alert fatigue.
- Webhook: Best for automation and routing. Send alerts to a trade journal, a Discord channel, or your execution stack. If you compare platforms, see MetaTrader vs cTrader vs TradingView.
Match delivery to urgency. High urgency, push or SMS. Low urgency, email.
Alert hygiene, naming, expiration, and a clean list
Your alert list is a tool. Keep it small and current.
- Name alerts with a pattern: FX, pair, timeframe, level, and intent. Example, “FX EURUSD H1 1.0900 Break” or “FX GBPJPY M15 TL Break.”
- Add an expiration: Use end of day for intraday levels. Use end of week for swing levels. Expired alerts remove clutter.
- One alert per idea: If you need five alerts to manage one setup, your level work is messy.
- Review weekly: Delete alerts tied to invalidated structure, old ranges, or finished trades.
- Archive logic, not alerts: Save your rule set in a note. Rebuild alerts when the level returns. Do not hoard.
Building a Repeatable Forex Trading Routine Inside TradingView
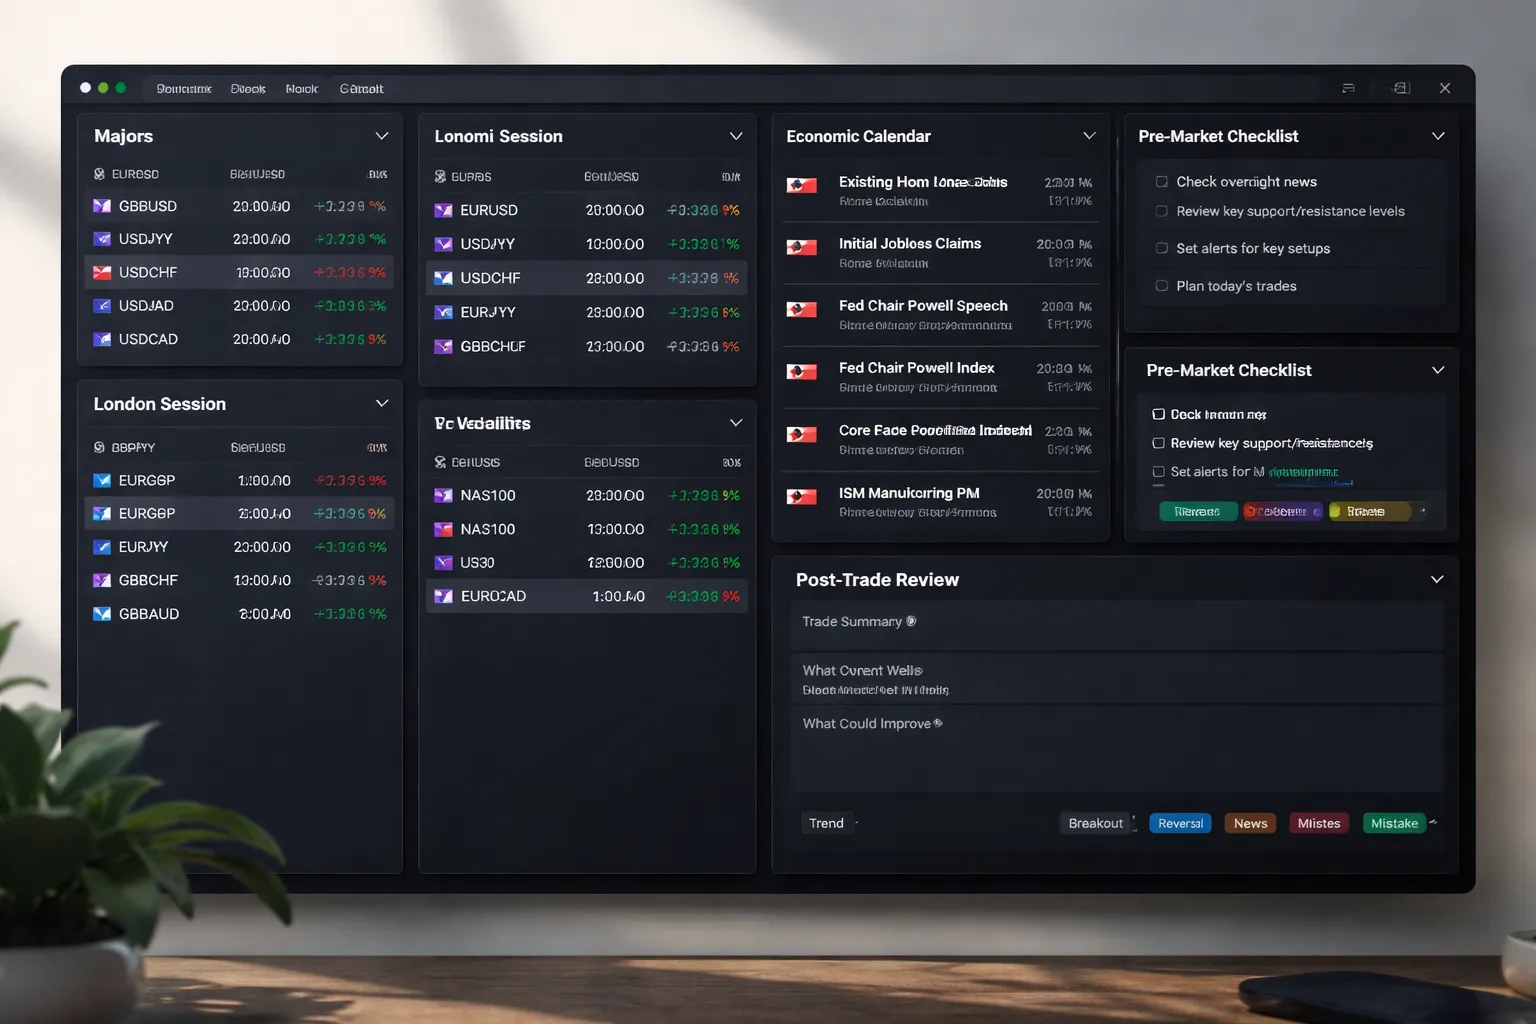
Creating Watchlists for Forex
Your routine starts with clean lists. Build three. Keep each list under 12 pairs.
- Majors list: EURUSD, GBPUSD, USDJPY, USDCHF, USDCAD, AUDUSD, NZDUSD. Add EURJPY and GBPJPY if you trade JPY crosses.
- Session list: Create one for your hours. London, New York, Asia. Put pairs that move in that session. Example, London, EURUSD, GBPUSD, EURGBP, GBPJPY. New York, USDCAD, USDJPY, XAUUSD if you trade it. Asia, AUDUSD, NZDUSD, AUDJPY.
- Volatility list: A short list for movement. Use it when you need range expansion. Include GBPJPY, EURJPY, GBPUSD, XAUUSD if applicable. Remove pairs that go quiet for weeks.
Use the same sort order every day. It reduces scanning time. It also reduces missed pairs.
Using the Economic Calendar and News
Trade the chart, but respect the calendar. Filter by currency, then focus on high-impact events.
- For EUR pairs, filter for EUR events. Keep ECB rate decisions, CPI, PMI, GDP, and major speeches.
- For USD pairs, keep FOMC, CPI, NFP, retail sales, GDP, and major speeches.
- For GBP pairs, keep BoE decisions, CPI, employment, GDP, and speeches.
- For JPY pairs, keep BoJ decisions, CPI, GDP, and interventions related headlines.
Set a rule you follow every time.
- No new trades inside your defined event window, example, 15 minutes before to 15 minutes after high-impact news.
- Widened spreads and fast candles do not count as valid breaks for structure.
Pre-market Checklist
Run the same checklist before you place any order. Keep it short. Write it in a note and reuse it.
- Bias: Mark your directional bias per pair as bullish, bearish, or neutral. Base it on your higher timeframe structure.
- Key levels: Mark the closest swing high and low. Mark the current range high and low. Mark any unfilled imbalance or prior day high and low if you use them.
- Upcoming events: Note the next high-impact event time for the pair’s currencies. If it is close, cut position size or stand down.
- Risk limits: Set your max risk per trade and max loss for the day. Stop trading when you hit either limit.
Store this checklist in TradingView. Pin it. Do not negotiate with it.
Post-trade Review
Your edge comes from review. Do it the same way after each trade, and again at week end.
- Screenshots: Save two. One at entry with your thesis and levels. One at exit with outcome and what changed.
- Notes: Log setup type, timeframe, session, reason for entry, stop placement logic, target logic, and event context.
- Tagging: Use simple tags so you can count outcomes. Examples, breakout, pullback, range, trend, news, late-entry, early-exit.
Review tags weekly. Drop the tags that do not help decisions. Keep the ones that show repeatable wins and repeatable mistakes.
Using TradingView Ideas Responsibly
Ideas can help with awareness. They can also push you into confirmation bias. Use a strict filter.
- Validation: Check if the idea matches your timeframe, session, and pair. Reject ideas that ignore upcoming high-impact events.
- Confirmation bias control: If you already have a bias, do not search for ideas that agree with it. Scan both directions, then return to your plan.
- Risk management first: Never copy position size, leverage, or stops. You do not know the creator’s account size, limits, or tolerance.
- Execution rule: Use ideas to generate a watch item, not a trade. Your trade only triggers when your levels and alerts confirm your setup.
If you need a separate execution platform, compare your options in this Forex platforms comparison.
Risk Management Tools: Position Sizing, R:R, and Scenario Planning
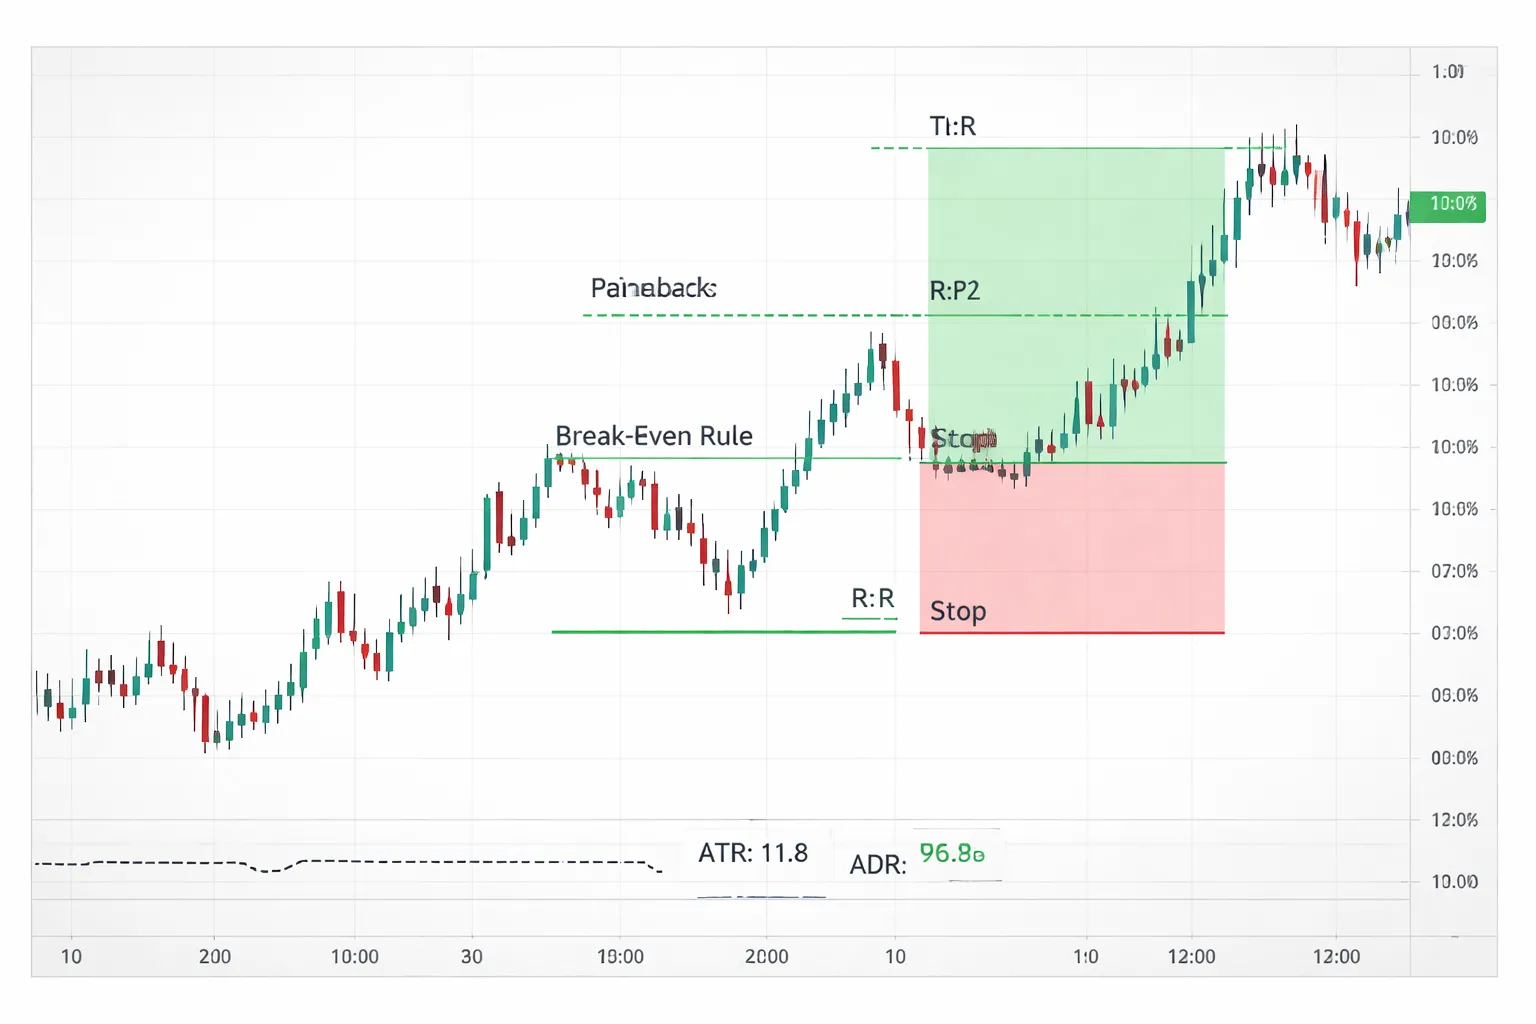
Plan the trade with the Long/Short Position tool
Use TradingView’s Long Position and Short Position tools to map the trade before you touch size.
- Set your entry at the price level that matches your setup.
- Set your stop where your idea fails, not where loss feels small.
- Set your target at the next logical level, not an arbitrary multiple.
- Read the tool’s outputs, risk in points, reward in points, and R:R.
- Save the tool with your preferred colors and text so every chart uses the same format.
Keep the rule simple. If your stop location is unclear, you do not have a trade.
Position sizing for forex: pip value, account currency, leverage
TradingView helps you visualize the stop distance. You still need to convert that distance into cash risk and lot size.
- Step 1: Set a fixed risk per trade. Example, 0.5% or 1% of your account.
- Step 2: Measure stop distance in pips. Use your Long/Short tool, or measure from entry to stop.
- Step 3: Estimate pip value in your account currency. For most USD-quoted majors, 1 standard lot is about $10 per pip. For JPY pairs, pip size differs. Your broker contract specs decide the exact value.
- Step 4: Calculate position size. Position size (lots) = cash risk ÷ (stop pips × pip value per lot).
- Step 5: Check margin impact. Leverage changes required margin, not your stop size. If margin is tight, you will get forced out at the worst time.
If your account currency differs from the quote currency, your pip value shifts with the exchange rate. Treat pip value as a moving input, not a constant.
Set realistic stops and targets with ATR and ADR
Stops and targets must fit the pair’s normal movement. Use ATR and ADR as context.
- ATR shows average movement per candle length. Use it to judge if your stop sits inside normal noise for your timeframe.
- ADR shows typical daily range. Use it to check if your target needs an unrealistic daily move to hit.
- If your stop is far below recent ATR norms, your size must shrink or your setup does not fit.
- If your target requires most of the ADR after the pair already moved, expect lower odds and slower fills.
Use ATR and ADR to avoid fantasy trades. Then anchor final levels to structure, swing points, and session highs and lows.
Manage multiple positions and partial exits with levels and annotations
TradingView will not manage your orders unless you trade through an integrated broker. It can still keep your plan clean.
- Add horizontal rays for entry, stop, first target, and final target.
- Label each level with the intended action, for example, “TP1 50%”, “Move stop to BE after TP1”.
- Use different colors for risk levels versus profit levels. Keep it consistent across layouts.
- If you scale in, annotate each add with size, trigger, and new blended stop logic.
- If you trail stops, mark the trail rule on the chart, for example, “trail below last swing low”, not “trail tighter”.
When you run multiple pairs, use a single template. Your process must stay the same when you feel pressure.
Common mistakes that break risk control
- Moving stops emotionally. Decide the invalidation level first. If price hits it, you exit. Do not widen the stop because you want to be right.
- Ignoring spread and commissions. Your stop triggers on bid or ask depending on direction. A tight stop that looks safe on the chart can still get clipped by spread.
- Not accounting for news. High impact releases can jump through stops and targets. Plan around the calendar, or reduce size, widen structure-based stops, or stay flat.
If you execute on MetaTrader, align your chart plan with your order ticket and contract specs. See this MetaTrader 4 vs MetaTrader 5 breakdown.
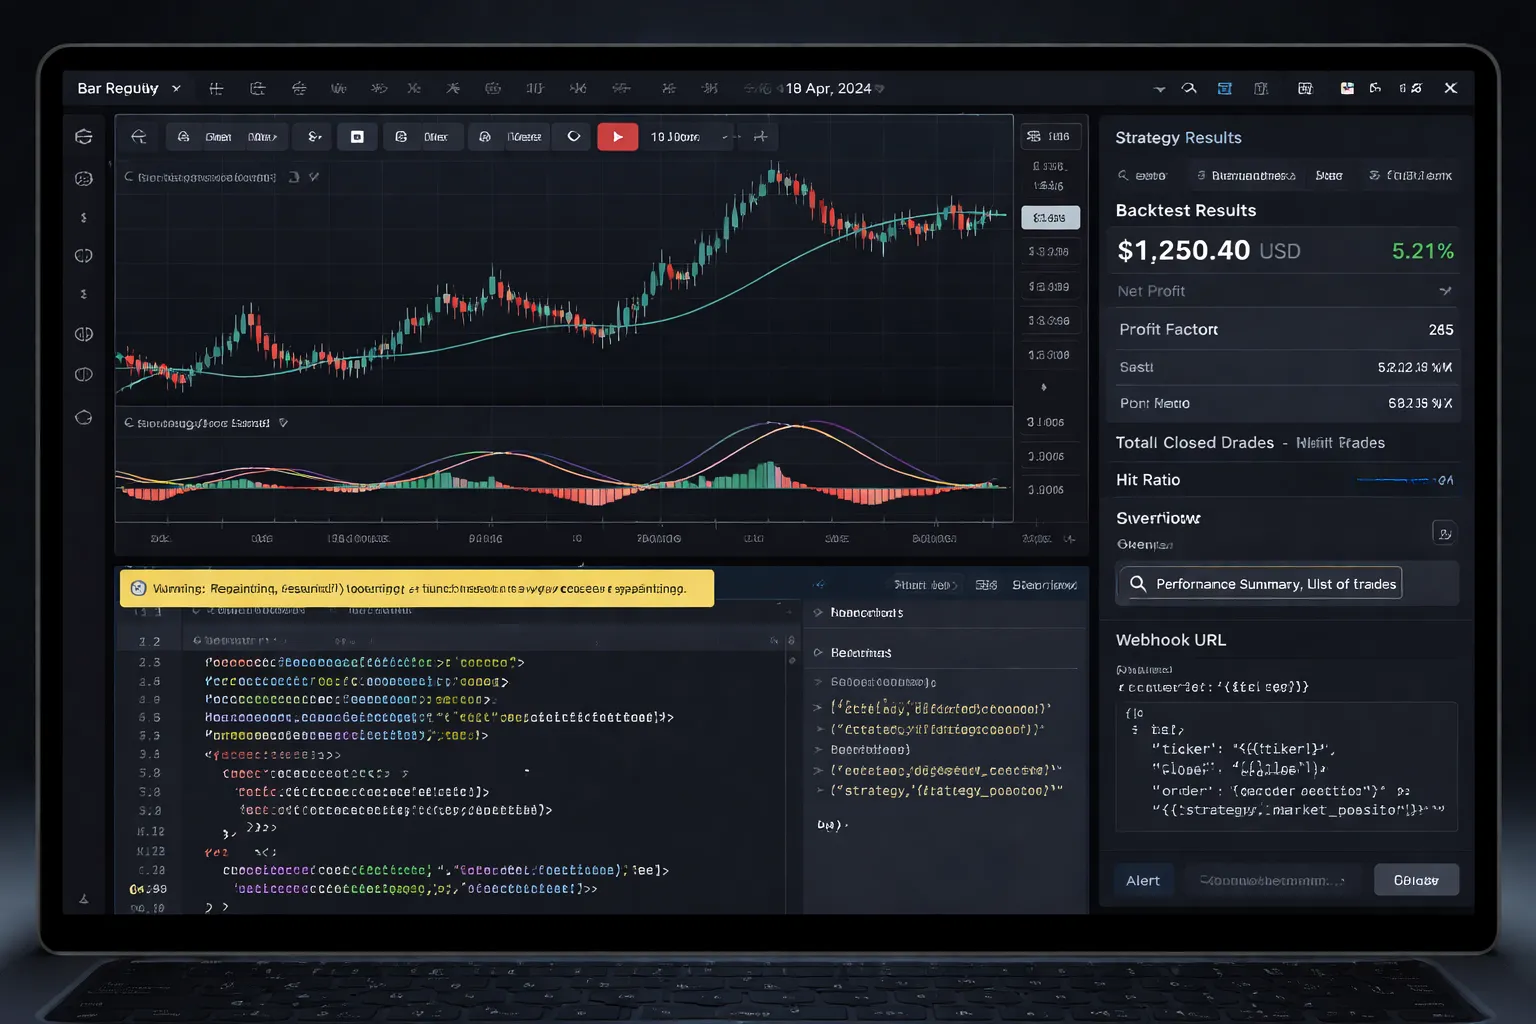
Advanced Features (Optional): Backtesting, Pine Script, and Automation
Replaying the market to practice without hindsight bias
Use Bar Replay to practice execution on real candles, at real speed.
- Pick your pair and timeframe, then scroll back to a clean area with no major gaps.
- Click Bar Replay, set the starting candle, then press Play.
- Mark your levels before price reaches them. Do not move them later.
- Log each trade idea. Include entry trigger, stop location, target, and invalidation.
- Run the replay at 1x speed for decision practice. Speed up only for scanning.
Bar Replay helps you train process. It does not prove you can fill at the same price live. Forex spreads, swaps, and slippage still matter.
Strategy Tester basics for forex, what it can and can’t validate
TradingView backtests can validate logic. They do not validate real execution.
- Good for: rule consistency, signal frequency, rough drawdown shape, regime sensitivity, and parameter stress tests.
- Weak for: broker spreads per session, variable slippage, partial fills, requotes, and platform-specific execution rules.
- Risk for forex: results can look clean if your test ignores spread. A few tenths of a pip can flip expectancy for scalping systems.
Use conservative assumptions. Add spread and slippage in your script settings if available. Avoid optimizing until you lock rules. Optimization can fit noise fast.
If you execute on MetaTrader, treat TradingView tests as research, then validate with broker data and execution constraints. Use this MetaTrader 4 vs MetaTrader 5 comparison to match your workflow.
Using Pine Script indicators safely
Pine Script gives you custom indicators and strategies. It also creates new ways to fool yourself.
- Demand transparency: read the code. If you cannot, use scripts from known authors with clear logic notes.
- Watch for repainting: some scripts change past signals when new candles form. Avoid signals that depend on future data.
- Check for lookahead: scripts can accidentally reference incomplete higher timeframe data. Confirm how they handle HTF calls.
- Confirm bar state: alerts should trigger on confirmed bars if your rules require close-based confirmation.
- Validate inputs: keep inputs minimal. Too many knobs encourages curve fitting.
Run a simple test. Compare signals on live candles versus historical candles. If the past looks perfect but live signals shift, the script repaints or your settings differ.
Webhooks and integrations, alerts to bots or journals
TradingView alerts can push events outside the platform through webhooks. You can connect them to automation layers or logging tools.
- Send alert payloads as JSON to a webhook endpoint.
- Route the payload to a trade bot, a risk gateway, or a journal entry.
- Include fields you can audit. Symbol, timeframe, direction, trigger price, stop, target, strategy ID, and timestamp.
- Use a “confirm then execute” design. Let the webhook create a pending order request, then require a second validation step.
- Log every alert, even rejected ones. You need an audit trail.
Do not treat alerts as guaranteed fills. Forex execution depends on your broker, liquidity, and risk rules. Build failure handling. Timeouts, duplicates, missed alerts, and data delays happen.
Version control for templates and layouts
Protect a working setup. Iterate without breaking it.
- Create a stable baseline layout. Name it with a version tag, like “FX Layout v1.0”.
- Duplicate before changes. Test new indicators, colors, and alerts in the copy.
- Keep a simple change log. Date, what changed, and why.
- Standardize presets. One alert template, one risk label set, one drawing style pack.
- Roll back fast. If performance drops or charts get noisy, return to the baseline.
Apply the same idea to scripts. Save versions and lock inputs. Small edits can change signals and invalidate your notes.
Pros, Cons, and Common Pitfalls When Using TradingView for Forex
Strengths
- Usability. You can build clean layouts fast. Templates, favorites, and watchlists reduce clicks.
- Charting depth. You get strong drawing tools, multi-timeframe views, and flexible scaling. You can compare pairs and overlay symbols.
- Alerts. You can run price, indicator, and strategy alerts. You can route them to app push, email, and webhooks.
- Community. You can scan public ideas and scripts to pressure test your own view. Treat it as research, not signals.
- Cross-device workflow. Your layouts, watchlists, and alerts sync across desktop and mobile. You can review setups anywhere without rebuilding charts.
Weaknesses
- Broker and data-feed differences. Your TradingView chart can differ from your broker chart. Small OHLC differences can change levels, pattern breaks, and backtest results.
- Spread visibility. Most TradingView charts show mid or last price. Your fills depend on bid and ask. Spreads widen at rollover, news, and low-liquidity hours.
- Execution constraints. TradingView execution depends on the broker integration. Order types, partial fills, hedging, FIFO rules, and advanced trade management may not match your broker platform. For execution-heavy workflows, compare it with MetaTrader vs cTrader vs TradingView.
Common pitfalls
- Over-indicator stacking. You add three trend tools, two oscillators, and a filter. They confirm each other because they measure the same input. Keep one tool per job. Trend, momentum, volatility, risk. That is enough.
- Changing settings mid-analysis. You adjust lengths, sources, and timeframes until the chart agrees. You lose repeatability. Lock inputs for a full week of trading. Change only after you review results.
- Inconsistent symbols. You mix FX spot, CFDs, and broker-specific tickers. You mark levels on one symbol and trade another. You must standardize the exact symbol used for analysis and the exact symbol used for execution.
- Time zone and session drift. Your day open and close can shift with chart settings and broker server time. That changes daily candle structure. Align chart time with your trading plan and keep it fixed.
Verify your analysis against your broker before you trade
- Match the instrument. Use the same product type, spot vs CFD, and the same ticker as your broker.
- Check bid and ask. Confirm spread at entry time. If TradingView shows only one price, open your broker quote window and record bid, ask, and spread.
- Confirm key levels. Recheck the swing high, swing low, and your trigger candle on the broker chart. Look for different wicks and closes.
- Validate the trigger rule. If your plan uses candle close, confirm the close on the broker platform. If it uses intrabar breaks, confirm live price behavior on the broker feed.
- Recalculate position size. Use your broker contract specs. Verify pip value, minimum lot, and margin. Do not assume a TradingView tool matches your account terms.
- Dry-run order placement. Place a demo order with your exact stop and target. Confirm order types, stop distance limits, and how the platform handles modifications.
Security and account best practices
- Use 2FA. Enable app-based 2FA. Store backup codes offline.
- Lock down devices. Use a strong device passcode. Enable full-disk encryption. Keep OS and browser updated.
- Audit active sessions. Sign out of old browsers and devices. Remove anything you do not recognize.
- Control script risk. Use trusted scripts only. Review what a script does before you run alerts on it. Prefer open-source scripts you can read.
- Limit sharing. Keep layouts private if they include account-related notes or levels you consider sensitive. Avoid posting screenshots with visible watchlists and alert names.
Frequently Asked Questions
Is TradingView free for forex charts?
Yes. The free plan covers forex charts, watchlists, and basic indicators. Limits apply to alerts, indicators per chart, and saved layouts. If you need more alerts and layouts, upgrade to a paid plan.
Can you trade forex directly from TradingView?
Yes, if your broker supports TradingView trading. Connect your broker in the Trading Panel, then place orders from the chart. If your broker does not integrate, use TradingView for analysis and execute trades on your broker platform.
Why does my forex price differ from my broker?
Data sources differ. TradingView often shows a broker feed or a composite feed, while your broker shows its own quotes. Spreads and session settings can also change the look. Use the same symbol source as your broker when possible.
What is the best chart type for forex?
Use candlesticks for most trading. Use Heikin Ashi for trend filtering, not for precise entries. Use line charts for quick structure checks. Keep one default and switch only when you need a specific view.
How do you set alerts for forex levels?
Right-click the price level, then select Add Alert. Choose condition, expiration, and notification method. Use “Once Per Bar Close” to reduce noise. Name alerts with pair, timeframe, and level so you can manage them fast.
Can TradingView alerts trigger trades?
TradingView alerts do not place trades by default. You can route alerts through webhooks to your own execution system, if you know the risks and your broker allows it. Test with a demo first and log every event.
How do you build a clean forex layout?
Use one chart for entries and one for higher timeframe bias. Add a watchlist, alerts panel, and economic calendar if you trade news. Save the layout, then lock it. Keep indicator count low to protect chart speed.
How do you sync layouts across devices?
Save your layout to the cloud. Use the same TradingView account on desktop and mobile. After edits, save again. If you share a device, sign out when done and avoid saving sensitive notes in shared layouts.
What time zone should you use for forex charts?
Use the time zone that matches your trading plan. Many traders use New York for session structure. Consistency matters more than the specific zone. Keep the same zone across all layouts to avoid mismatched levels and sessions.
How do you add forex sessions to the chart?
Open chart settings, then enable sessions. Use the Sessions or Session Breaks options, depending on your template. If you trade London and New York overlap, mark those hours and keep your session settings consistent.
How do you manage multiple pairs fast?
Use watchlists and keyboard shortcuts. Link symbol and timeframe across charts in a layout. Create a template with your core indicators. Save one layout for majors and one for crosses to reduce scanning time.
Does TradingView support pip values and position sizing?
It shows price movement and lets you measure ranges. Pip value and margin depend on your broker and account currency. Use your broker calculator or a position size tool. Confirm contract size for each pair before risking money.
Should you use TradingView or MetaTrader for forex?
TradingView works well for charting, alerts, and multi-device layouts. MetaTrader often wins for broker coverage and execution tools. Choose based on your broker and workflow, see TradingView vs MetaTrader vs cTrader.
Conclusion
Use TradingView as your forex command center. Build one clean layout per strategy. Save it. Sync it across devices.
- Charts: Use one timeframe for bias, one for entries, one for risk. Keep indicators to what you can act on.
- Alerts: Alert on levels and conditions you trade. Add a clear message with pair, timeframe, and your planned action.
- Layouts: Lock drawings, name every layout, and keep a watchlist for each session or system.
- Execution: Place trades where your broker tools work best. If you need deeper broker support, compare platforms in TradingView vs MetaTrader vs cTrader.
Final tip. Standardize your process. Same pairs, same layouts, same alerts, same risk rule. You cut mistakes and you trade faster.
-
-
- Core Trend Tools: Moving Averages, Market Structure, Higher Highs and Lower Lows
- Volatility and Risk Context: ATR, ADR, Realistic Targets
- Momentum and Mean-Reversion Tools: RSI, Stochastic, Divergence Cautions
- Volume in Forex: What TradingView Volume Represents, Safer Alternatives
- Build Indicator Templates per Strategy, Avoid Overfitting
-
- Is TradingView free for forex charts?
- Can you trade forex directly from TradingView?
- Why does my forex price differ from my broker?
- What is the best chart type for forex?
- How do you set alerts for forex levels?
- Can TradingView alerts trigger trades?
- How do you build a clean forex layout?
- How do you sync layouts across devices?
- What time zone should you use for forex charts?
- How do you add forex sessions to the chart?
- How do you manage multiple pairs fast?
- Does TradingView support pip values and position sizing?
- Should you use TradingView or MetaTrader for forex?
-
-
-
- Core Trend Tools: Moving Averages, Market Structure, Higher Highs and Lower Lows
- Volatility and Risk Context: ATR, ADR, Realistic Targets
- Momentum and Mean-Reversion Tools: RSI, Stochastic, Divergence Cautions
- Volume in Forex: What TradingView Volume Represents, Safer Alternatives
- Build Indicator Templates per Strategy, Avoid Overfitting
-
- Is TradingView free for forex charts?
- Can you trade forex directly from TradingView?
- Why does my forex price differ from my broker?
- What is the best chart type for forex?
- How do you set alerts for forex levels?
- Can TradingView alerts trigger trades?
- How do you build a clean forex layout?
- How do you sync layouts across devices?
- What time zone should you use for forex charts?
- How do you add forex sessions to the chart?
- How do you manage multiple pairs fast?
- Does TradingView support pip values and position sizing?
- Should you use TradingView or MetaTrader for forex?
-
-
Forex Lot Size Calculator: How to Use It to Size Trades Correctly
2 weeks ago -
How to Calculate Position Size in Forex (Position Sizing Formula + Examples)
2 weeks ago -
Forex Leverage Explained: How It Works, Pros, Cons & Examples
2 weeks ago -
Margin vs Leverage in Forex: What’s the Difference?
2 weeks ago -
What Is Forex Trading? A Beginner’s Guide to How It Works
3 weeks ago
-
Forex Leverage Explained: How It Works, Pros, Cons & Examples
2 weeks ago -
Is Forex Trading Legal in the United States? Rules, Regulators & What to Know
3 weeks ago -
Spread vs Commission: Which Forex Account Type Is Cheaper?
3 weeks ago -
What Are Pips in Forex? Definition, Examples & Why They Matter
3 weeks ago -
How to Calculate Position Size in Forex (Position Sizing Formula + Examples)
2 weeks ago