Forex Market Structure Explained: Higher Highs, Lower Lows & Trend Shifts

Market structure tells you who controls price right now. Bulls print higher highs and higher lows. Bears print lower lows and lower highs. When that sequence breaks, the trend shifts.
This guide shows you how to read market structure on any forex chart. You will learn how to label swing highs and swing lows, confirm an uptrend or downtrend, and spot the first signs of reversal. You will also learn the difference between a simple pullback and a real break in structure, so you stop chasing moves late. Use these rules to plan entries, set stops beyond key swings, and avoid trades that fight the current order flow.
If you also need risk rules to match your structure reads, start with position sizing in forex.
- In het kort: An uptrend holds when price prints higher highs and higher lows.
- In het kort: A downtrend holds when price prints lower lows and lower highs.
- In het kort: Mark swing highs and swing lows first, your structure read depends on clean swing points.
- In het kort: A pullback stays inside the current structure, a break in structure takes a prior swing level.
- In het kort: Confirm a trend shift when the last protected swing fails, then watch for a new sequence to form.
- In het kort: Place stops beyond the swing that defines your trade idea, not at random pip distances.
- In het kort: Use consistent risk per trade and size your position from your stop distance, see position sizing in forex.
What Market Structure Means in Forex (and Why It Matters)
What market structure means in forex
Market structure is the sequence of swing highs and swing lows on your chart. It tells you what price has done, and what it must break to change state.
You use structure to label three things. Swings, legs, and trend state.
Swings, legs, and trend state in trading terms
Swing high: a peak where price pushes up, then pulls back. It becomes a level that must break for price to keep that bullish sequence.
Swing low: a trough where price sells off, then bounces. It becomes a level that must break for price to keep that bearish sequence.
Leg: the move from one swing point to the next. Swing low to swing high is an up leg. Swing high to swing low is a down leg.
Trend state: the current swing sequence.
- Bullish structure: higher highs and higher lows.
- Bearish structure: lower lows and lower highs.
- Range state: swings overlap and neither side can take and hold prior swing levels.
In practice, you track the last protected swing. In an uptrend, that is the most recent higher low that held. In a downtrend, that is the most recent lower high that held. When that level breaks, the prior trend loses control.
How market structure differs from indicators
Structure comes from price. Indicators come from price, then apply a formula. That adds delay.
Most indicators confirm after the swing already printed. Structure defines the level that would confirm or invalidate your idea before the next move finishes.
- Structure gives you exact invalidation points, prior swing highs and lows.
- Structure gives you trade location, entries near the swing that defines your risk.
- Structure keeps your stop placement logical, beyond the swing that would prove you wrong.
This matters more in liquid pairs where moves can run fast and mean reversion can be sharp. Pair behavior changes with spreads and session liquidity, see best forex pairs to trade.
Where traders go wrong
- Hindsight marking: you mark swings after the move looks obvious. You then assume you could have traded it. Fix this by using one swing rule and applying it in real time, not after the fact.
- Overfitting: you keep changing what counts as a swing, or you switch timeframes until structure matches your bias. Fix this by choosing one execution timeframe and one higher timeframe for context, then keep the same swing definition for both.
- Random chop: you try to force a trend label inside overlap. In chop, price breaks small swings and snaps back. You get stopped repeatedly. Fix this by treating overlap as range state, reduce size, widen filters, or wait for a clean break and hold beyond a major swing.
The Building Blocks: Swing Highs, Swing Lows, and Impulse vs Pullback
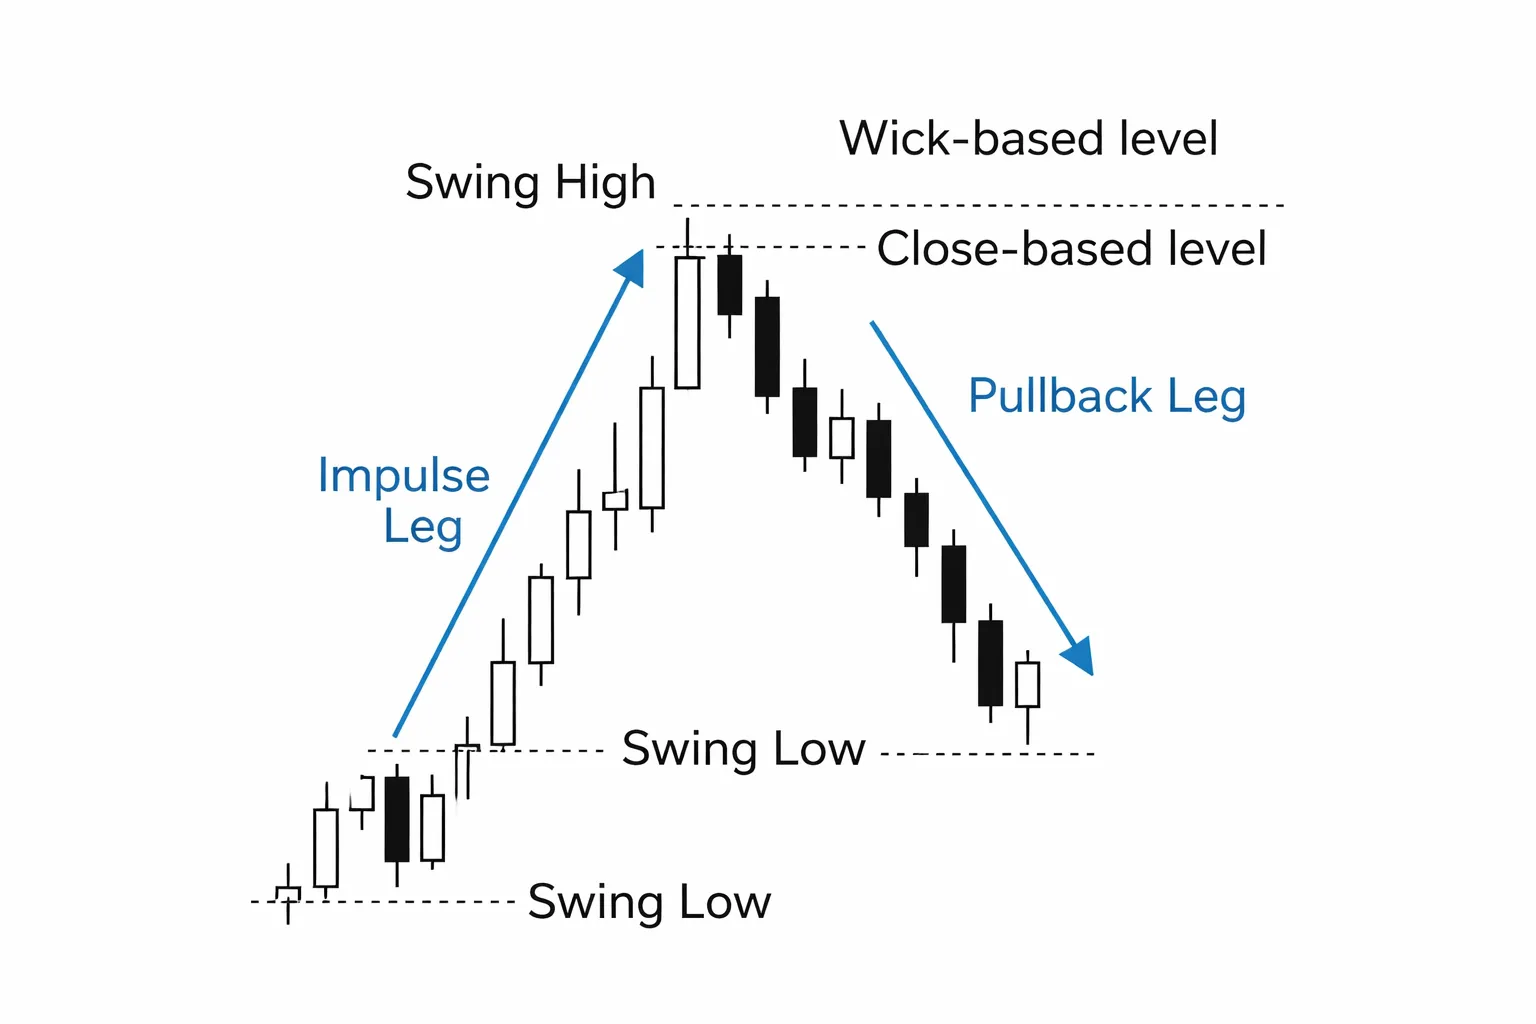
Swing Highs and Swing Lows: Your Structure Anchors
A swing high is a local peak. Price pushes up, then fails to push higher and turns down.
A swing low is a local trough. Price pushes down, then fails to push lower and turns up.
You use swings to label structure. Higher highs and higher lows need clean swing points. Lower highs and lower lows need the same.
Pick one rule set and stay consistent across your execution timeframe and your higher timeframe context.
How to Identify a Swing Point: Fractal vs Close-Based Rules
You have two practical ways to mark swings. Fractal rules mark the turning point itself. Close-based rules confirm the turn with a break.
- Fractal approach (pivot-based). Mark a swing high when a candle high has at least two lower highs on each side. Mark a swing low when a candle low has at least two higher lows on each side. This gives you earlier swing points, but you will revise more in fast markets.
- Close-based approach (break-and-confirm). Only confirm a swing high after price closes below a prior minor swing low. Only confirm a swing low after price closes above a prior minor swing high. This reduces false labels in chop, but it reacts later.
Use fractals when you need earlier mapping for entries and stops. Use close-based rules when you keep getting trapped by overlap and fake breaks.
| Rule type | What you mark | Strength | Cost |
|---|---|---|---|
| Fractal (2-left, 2-right) | Local pivot high or low | Earlier structure map | More re-draws in volatility |
| Close-based confirmation | Swing confirmed after a close breaks the counter-swing | Fewer false turns in chop | Later signals, wider structure stops |
Impulse vs Pullback: What Each Leg Tells You
Structure shifts happen inside legs. You need to separate the push from the correction.
- Impulse leg. Price moves away from the last swing with speed and clean candles. You see less overlap, more distance, and fewer deep retraces. This often signals stronger participation and commitment in that direction.
- Pullback leg. Price retraces part of the impulse and prints overlap. You see smaller bodies, more mixed candles, and more back and forth. This often signals profit-taking, mean reversion, or weaker follow-through.
Use impulses to define the active trend direction. Use pullbacks to locate the next decision point, usually near prior swing levels.
A practical filter, measure impulse strength by distance and time. A strong impulse covers more pips in fewer candles than the prior leg. A weak impulse grinds, overlaps, and fails to extend beyond the prior swing.
Which Candles Count: Wicks vs Bodies
Decide what you will treat as the true swing level. Use one method for analysis and one for execution if needed.
- Wick-based swings. Use the extreme high or low. This captures the full auction range and usually maps where stops and liquidity sit. It helps when you place structure invalidation beyond the true extreme.
- Body-based swings (close-based levels). Use closes or candle bodies to define breaks. This reduces noise from single spikes. It helps when the market prints long wicks and snaps back into range.
Use wicks to place your invalidation line. Use closes to confirm breaks and trend shifts. If your broker spread widens during news, wick breaks become less reliable on lower timeframes. Keep that in mind when you set triggers and stops, and review your spread at the time you trade.
Stay consistent. If you call a break on wicks, then you must also define your swing points on wicks. If you confirm on closes, then your swing confirmation must also use closes.
Bullish Structure: Higher Highs and Higher Lows (HH/HL)
What qualifies as a valid HH and a valid HL
A bullish structure prints higher highs (HH) and higher lows (HL). You do not label an HH or HL until price confirms the swing.
Valid Higher High (HH)
- Price breaks above the prior swing high that defined the last up-leg.
- Confirm the break using your rule, wick break or candle close. Keep the same rule across the chart.
- After the break, price must show follow-through, then pull back. If it snaps back under the prior high and holds there, treat it as a failed break, not an HH.
Valid Higher Low (HL)
- Price pulls back after an HH and holds above the prior swing low.
- Confirm the low only after price leaves the low and breaks the most recent minor swing high inside the pullback. This reduces false HL labels in choppy ranges.
- If price closes below the prior swing low that protected the trend, the HL fails. Your bullish sequence breaks.
Define your swing points first. Use the same timeframe and the same confirmation method. If spreads widen or execution slips, wick-based labels degrade fast. Review your execution conditions and read what slippage is in forex before you rely on tight triggers.
Common bullish sequences and what they imply about order flow
Order flow in a bullish structure shows demand stepping in earlier and supply failing to push price below prior lows.
- HL, HH, HL, HH. Buyers defend pullbacks. Stops below prior lows stay safe. Momentum remains intact.
- HH with shallow pullback. Buyers do not wait for deep discounts. Price trends with less mean reversion.
- Deep pullback that still holds above the prior swing low. Buyers absorb selling but you should expect wider stops and slower continuation.
- Repeated tests of the same high, then break. Liquidity builds above the level. A clean break often runs further, but you still need a confirmed HL after the move.
Track what gets protected. In a clean uptrend, the last confirmed HL acts as the line in the sand. When price holds above it, buyers still control structure.
Continuation clues: shallow pullbacks, reclaiming levels, and failed breakdowns
You can spot trend continuation by how price behaves during pullbacks and around prior highs.
- Shallow pullbacks. Price retraces less, then breaks to a new HH. You often see smaller bearish candles and quick rejection from support zones.
- Reclaiming a broken level. Price dips below a prior swing high or mid-pullback support, then closes back above it. This shows sellers could not hold the breakdown. Treat the reclaim as a continuation signal only if price then prints a new HH or breaks the pullback swing high.
- Failed breakdowns under the HL. Price wicks below the HL but closes back above it, then rallies and takes the pullback highs. This keeps the HH/HL sequence alive. If price closes and holds below the HL, treat it as structure damage.
| Price action event | What it usually signals | What you do with structure labels |
|---|---|---|
| Break above prior swing high, holds above | Demand overpowering supply | Mark new HH after your confirmation |
| Pullback stays above prior swing low, then breaks pullback high | Buyers defend higher prices | Confirm HL at the pullback low |
| Wick below HL, close back above, then rally | Stop run or liquidity sweep | Keep HL valid, wait for new HH |
| Close below HL and failure to reclaim | Sellers taking control | Invalidates HH/HL sequence, watch for shift |
Bearish Structure: Lower Lows and Lower Highs (LL/LH)
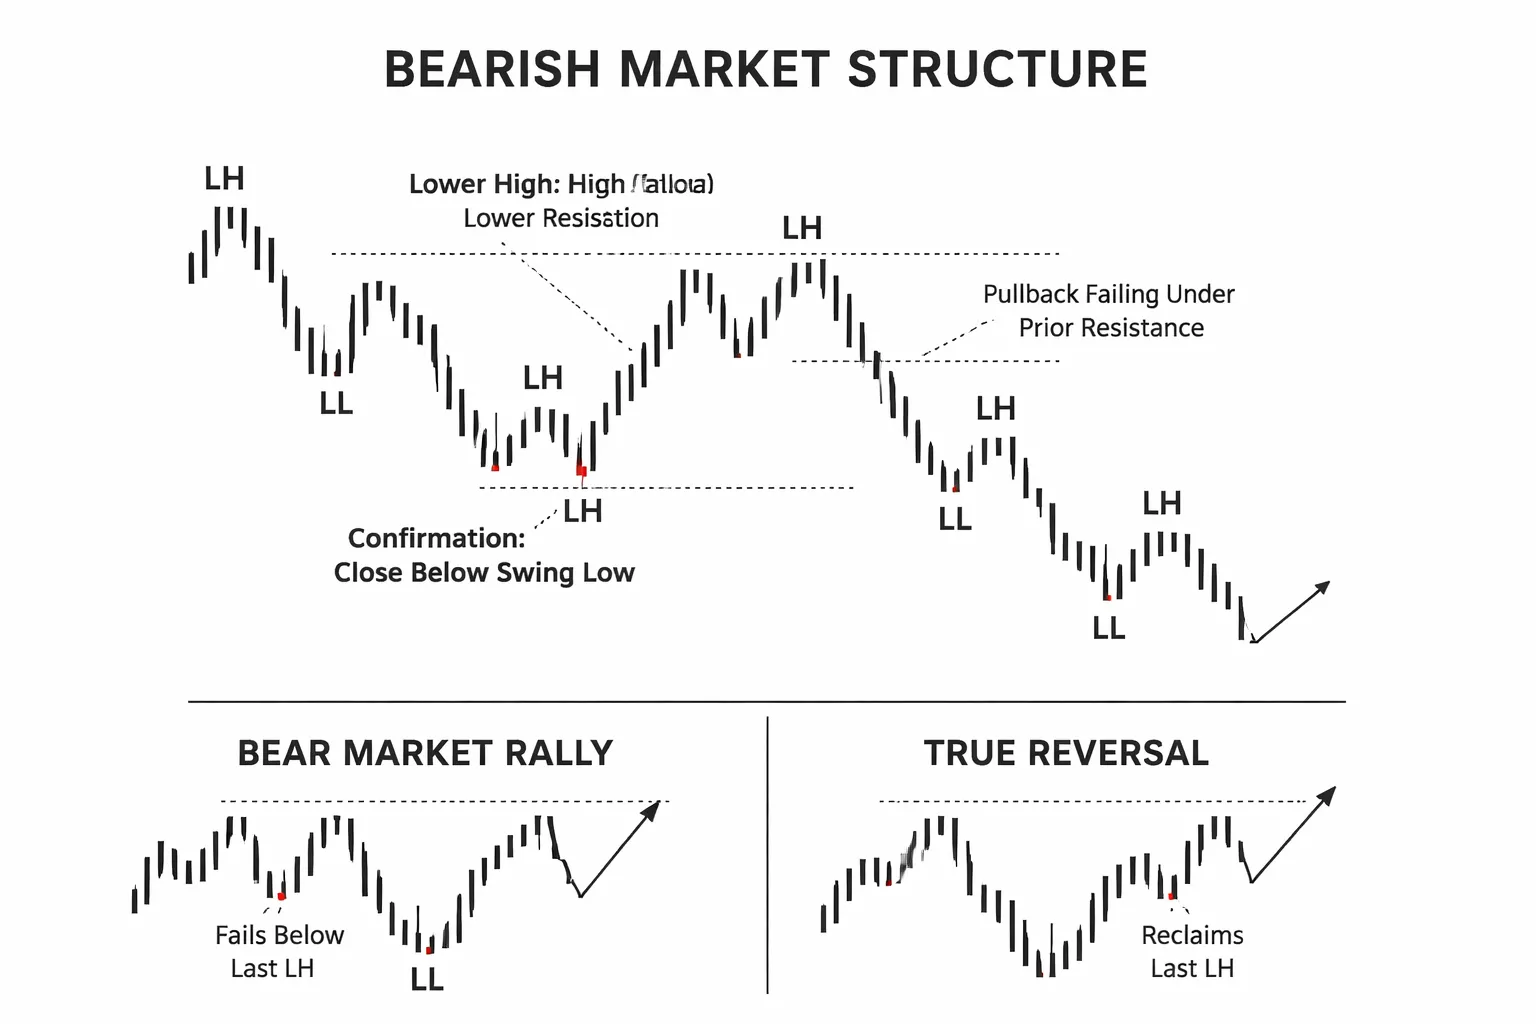
Bearish Structure: Lower Lows and Lower Highs (LL/LH)
A bearish structure prints lower lows and lower highs. Price sells off, rebounds, then fails below the last swing high. Repeat the cycle and you have a downtrend.
What qualifies as a valid LL and a valid LH
Valid LL. Price breaks the prior swing low and closes below it. You want a candle body close, not a wick. Then you want acceptance, price holds below that broken low on the next few candles, or the next pullback fails to reclaim the level.
Valid LH. After a LL, price pulls back and stalls below the prior swing high. You confirm the LH when price rolls over and breaks the pullback low. The failure needs a close. A wick above resistance with a close back under can still keep the LH valid.
- LL confirmation checklist: prior swing low breaks, close below, retest fails, next push makes a fresh low or continues to hold below.
- LH confirmation checklist: pullback tops below prior swing high, bearish rejection or loss of momentum, close below the pullback low, then continuation.
- Invalidation basics: a strong close back above the broken swing low weakens the LL. A strong close above the LH high weakens the bearish sequence and can signal a shift.
Continuation clues you can act on
Downtrends stay bearish when rebounds look weak and sellers defend the same zones.
- Weak rebounds: pullbacks retrace a small part of the prior drop, then stall fast. You often see smaller candles, overlap, and slow grind up followed by a sharp selloff.
- Repeated supply reactions: price taps the same resistance area and rejects. Each tap that fails builds evidence that sellers still control that zone.
- Failed breakouts: price pops above a LH with a wick, then closes back below and sells off. Treat that as a liquidity sweep until you see clean acceptance above.
| What you see | What it often means | What you do |
|---|---|---|
| Close below prior swing low, retest fails | LL holds, bearish continuation likely | Track next pullback for a LH entry trigger |
| Multiple rejections at the same resistance | Sellers defend supply | Keep bias bearish until a close holds above |
| Break above LH with wick, close back under | Sweep, not reversal | Wait for confirmation, avoid chasing the spike |
Bear market rallies vs genuine reversals
Bear market rallies happen inside a bearish structure. They look strong for a moment, but they fail to change the sequence.
- Bear rally signs: price rallies into a prior breakdown level, prints a lower high, then breaks the rally base. You keep seeing closes rejected under old support turned resistance.
- Reversal requirements: price must stop making lower lows. Then it must reclaim the last lower high with a clean close and hold above it. After that, you want a higher low on the pullback.
- Execution rule: do not label a reversal from one strong bullish candle. Wait for structure, then align your trade horizon with your trading timeframe.
Neutral and Transitional Conditions: Ranges, Compression, and Chop
How to label structure inside a range without forcing a trend
A range is a market that stops printing clean HH-HL or LH-LL sequences.
You see failed breakouts. You see quick reversals. Swings overlap.
Label the range first, then label swings inside it.
- Range high: the swing high that rejects price at least twice.
- Range low: the swing low that rejects price at least twice.
- Range mid: the 50 percent zone between high and low. Treat it as noise until you get a clear break and hold.
Inside a range, stop calling every push a new trend leg.
Use neutral labels.
- Inside high: a swing high that forms below the range high.
- Inside low: a swing low that forms above the range low.
- Liquidity sweep: a wick or brief break above the range high or below the range low that fails to close outside.
Your job is simple. Trade the edges or stand aside. Do not chase the middle.
Compression and triangles: why HH and LL logic gets messy before expansion
Compression is shrinking swing distance.
Highs get lower. Lows get higher. Candles overlap.
HH and LL rules lose value because the “swings” are small and inconsistent.
Common tells:
- You need more bars to form a swing point.
- Breaks of minor highs and lows fail fast.
- Multiple closes cluster in a tight band.
Treat compression as a transition state.
Wait for expansion, then apply structure rules again.
- Expansion confirmation: a close outside the compression boundary, followed by a retest that holds.
- Structure confirmation: after the break, price prints a clean HL in an upside break, or a clean LH in a downside break.
If you trade the break, account for cost. Tight ranges make spreads matter more, especially around news. Review how spreads work in forex before you size up in low-range conditions.
A simple filter: when to stand aside based on swing clarity and distance
Chop looks like movement, but it offers low edge.
Use a rule set that blocks low-quality trades.
When your labels feel forced, your trade is forced.
Wait until you get one clean outcome.
- A range break, close outside, retest, then a new swing sequence.
- A compression break with a hold, then a clear HL or LH.
Trend Shifts and Reversals: BOS vs MSS (Break of Structure vs Market Structure Shift)
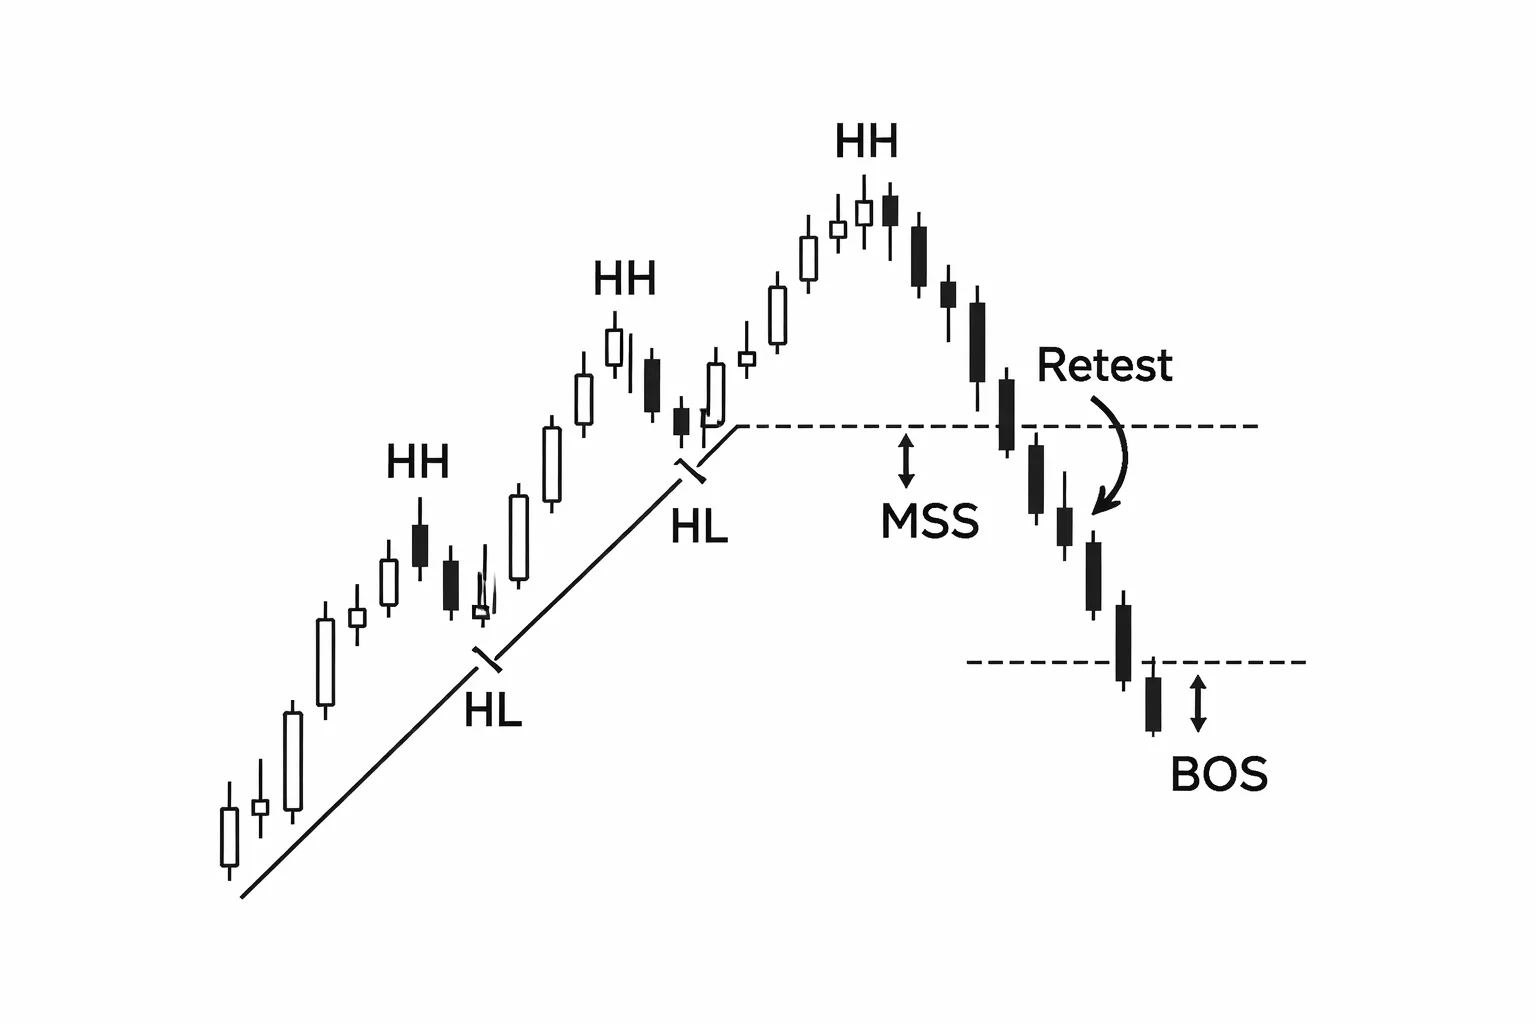
Break of Structure (BOS), what must break and what confirms it
BOS is a trend continuation signal. It tells you the current swing sequence still holds.
In an uptrend, price must break the prior swing high. In a downtrend, price must break the prior swing low. Use the last confirmed swing, not a minor intraday poke.
Confirmation needs two parts.
- Close beyond the level. A wick through the level is not enough.
- Follow-through. Price should hold above the broken high in an uptrend, or below the broken low in a downtrend.
If you keep getting closes that snap back inside the range, treat it as noise. Stand aside until a clean close and hold shows up.
Market Structure Shift (MSS), early warning vs confirmation trade-offs
MSS is a potential reversal signal. It says the prior trend is losing control.
Think in sequences.
- Uptrend equals HH and HL. The shift starts when price breaks the last HL. That is your bearish MSS trigger.
- Downtrend equals LL and LH. The shift starts when price breaks the last LH. That is your bullish MSS trigger.
MSS gives you earlier entries, but more failed signals. BOS gives you fewer signals, but stronger confirmation. Your choice is timing versus reliability.
Use a simple decision rule.
- If you trade MSS, demand a clean break and a clean retest. Keep risk tight. Accept more scratches.
- If you wait for BOS after MSS, you give up price, but you filter chop. You often get a clearer swing sequence to trade.
| Label | What breaks | What it suggests | Common mistake |
|---|---|---|---|
| BOS | Prior swing high in an uptrend, or prior swing low in a downtrend | Continuation | Counting wicks, or using a minor swing |
| MSS | Last HL in an uptrend, or last LH in a downtrend | Possible reversal or deeper pullback | Trading it without a hold or retest |
Retest logic, how structure flips roles
After a real break, the level often flips roles. Your job is to read the retest, not chase the candle that did the breaking.
- If price breaks above a prior high, that old resistance can become support. You want a retest that holds above it, then a new HL forms.
- If price breaks below a prior low, that old support can become resistance. You want a retest that holds below it, then a new LH forms.
Grade the retest with simple checks.
- Location. Retest into the broken level, not far away from it.
- Acceptance. Closes stay on the new side of the level.
- Reaction. Price rejects the level and starts a new swing in the break direction.
If the retest keeps closing back through the level, your break did not stick. Do nothing until the chart prints a new, clean swing sequence. Then you label it. Then you trade it.
Liquidity and Stop Runs: Why Highs and Lows Get Swept
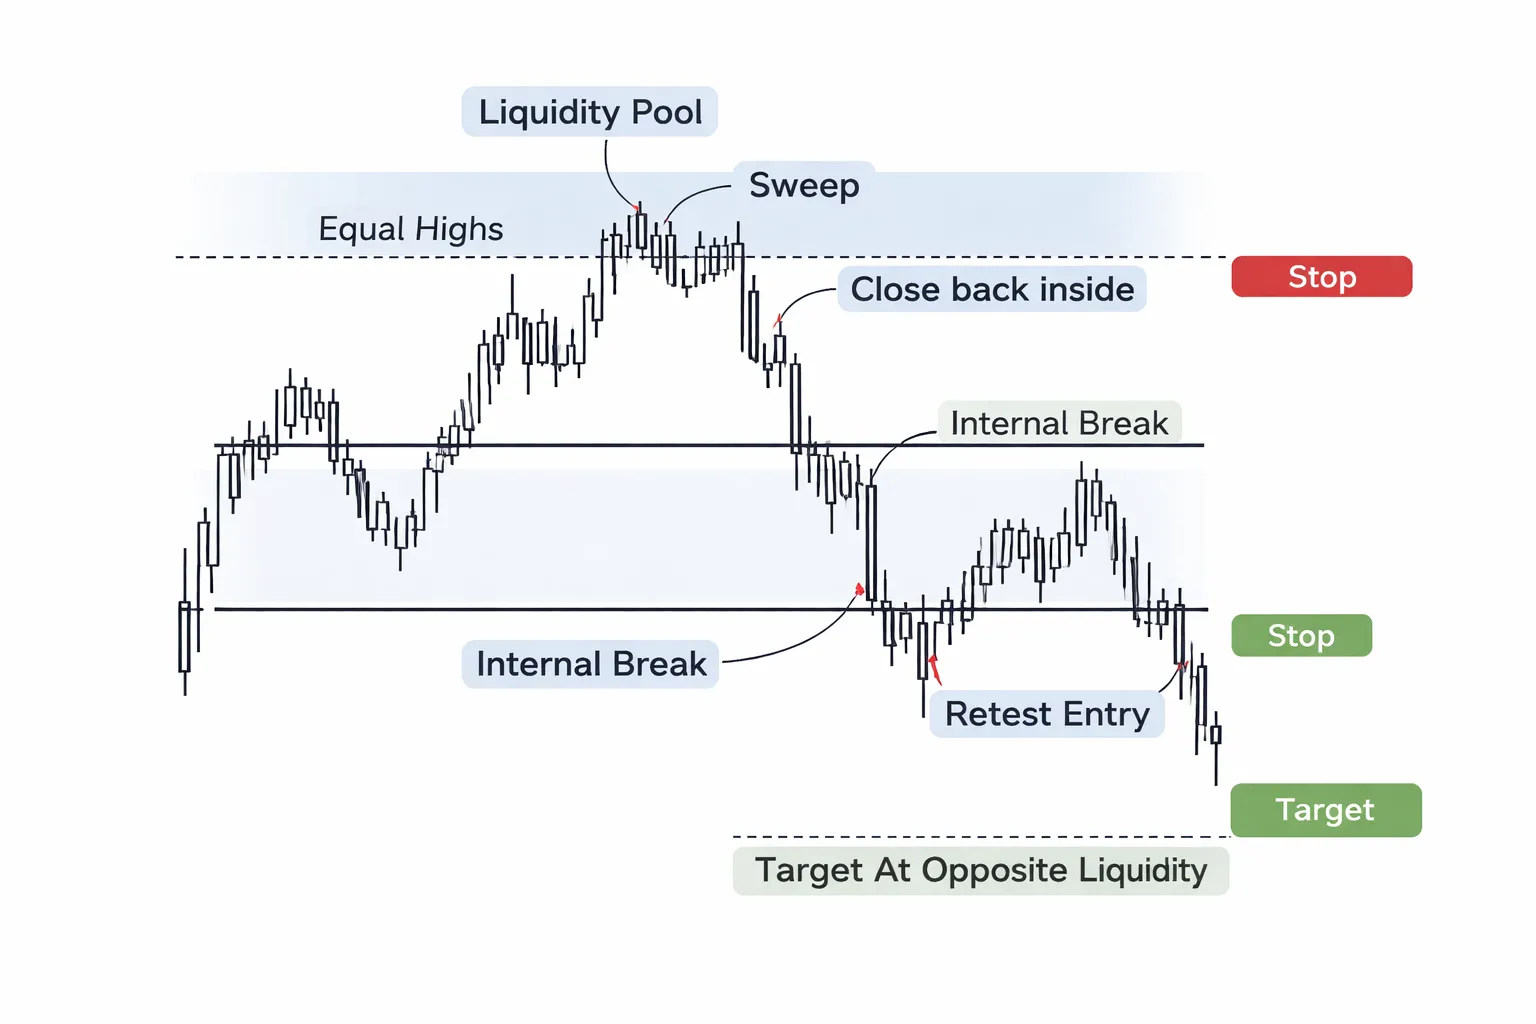
Liquidity Pools Above Highs and Below Lows and How They Form
Highs and lows attract orders.
Above a recent swing high, you will find buy stops from shorts and breakout buy orders. Below a recent swing low, you will find sell stops from longs and breakout sell orders.
These clusters form liquidity pools. Price often moves into them because that is where fills sit.
- Equal highs and equal lows. The tighter the range, the bigger the cluster. Many traders place stops in the same place.
- Clean swing points. Obvious highs and lows get used for stops because they are easy to see.
- Round numbers. 1.1000, 1.1050, 150.00. Stops and entries stack there.
- Session highs and lows. Asia range edges, London high, New York low. These levels get targeted during active hours.
A stop run is a fast push through a high or low to grab that liquidity. After the orders fill, price can reverse because the one sided fuel is gone.
If you want the deeper mechanics, read forex liquidity.
Distinguishing a Liquidity Sweep From a True Breakout
A sweep takes liquidity and fails. A breakout takes liquidity and holds.
| Feature | Liquidity sweep | True breakout |
| Close | Closes back inside the prior range or back under the broken high, back above the broken low. | Closes stay beyond the level. Follow through prints. |
| Retest | Retest rejects the breakout side fast. Price snaps back. | Retest holds the new side. Price uses the level as support or resistance. |
| Next swing | Price breaks the opposite minor structure soon after. | Price builds new higher lows in an up break, new lower highs in a down break. |
| Range behavior | Spike outside, then acceptance inside. | Acceptance outside, then expansion away. |
Do not label a trend shift from the wick. Label it from the closes and the next swing sequence.
Using Sweeps to Time Entries Without Guessing Tops or Bottoms
You do not sell because price hits a high. You sell because the sweep fails and structure flips.
- Step 1, mark the pool. Use the last clear swing high or swing low, equal highs or equal lows, and session extremes.
- Step 2, wait for the sweep. Let price trade through the level and show rejection. You want a close back inside.
- Step 3, wait for confirmation. On lower timeframes, look for a break of the most recent internal swing in the opposite direction of the sweep.
- Step 4, use the retest. Enter on a retest of the broken internal level, not at the extreme. Your stop goes beyond the sweep high for shorts, beyond the sweep low for longs.
- Step 5, target the next liquidity. Aim for the opposite side of the range, the next swing point, or the next equal high or low.
This keeps you out of early entries. You react to a failed move, then you trade the new swing sequence.
Multi-Timeframe Market Structure: Aligning Daily, H4, H1, and M15
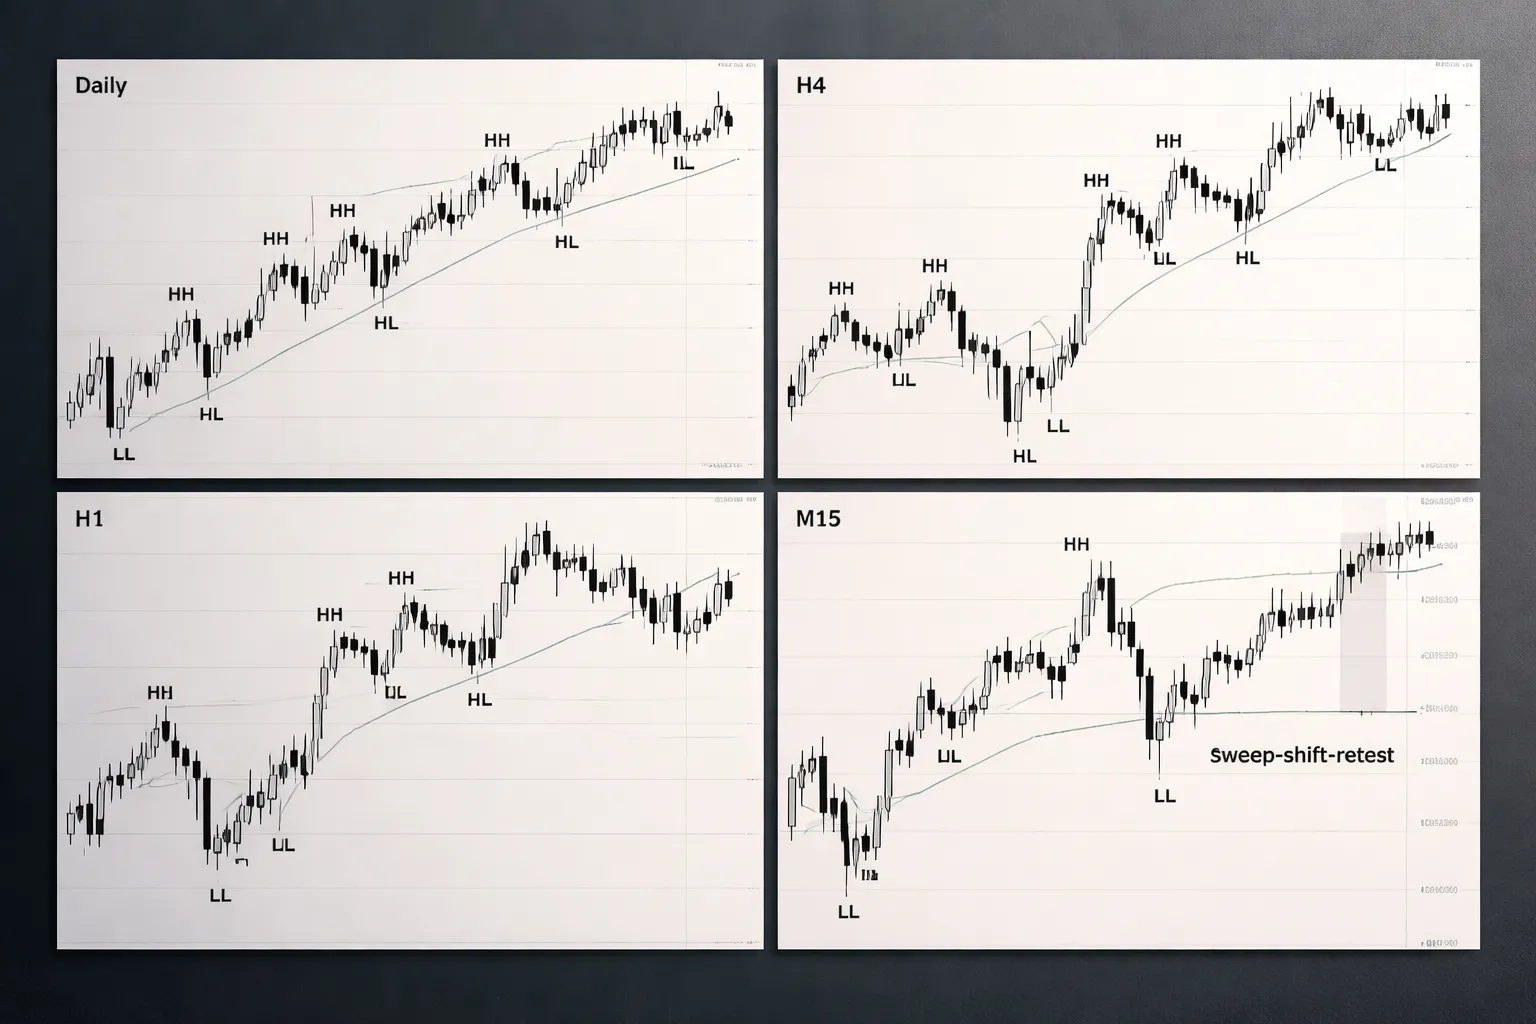
Top-down mapping, define the primary trend and the trading trend
Start with the Daily. Your job is direction, not entries.
- Daily: Mark the last confirmed swing high and swing low. Classify structure as bullish (HH, HL) or bearish (LL, LH). Note the most recent break of structure.
- H4: Refine the Daily leg. Mark the current H4 swing sequence inside the Daily move. Identify the active pullback versus continuation.
- H1: Define your trading bias for the session. Mark the nearest H1 liquidity points, equal highs, equal lows, and the last clean internal level.
- M15: Time the entry. Wait for the sweep, the shift, then the retest. Execute from the retest, not the extreme.
Use the Daily as the filter. Use H4 to frame the leg. Use H1 to pick the setup zone. Use M15 to trigger the trade.
Nested structure, when a lower timeframe downtrend is just a pullback
Lower timeframes flip first. That does not mean the higher timeframe trend ended.
Use this rule. A lower timeframe downtrend counts as a pullback when it stays inside the higher timeframe swing leg and fails to break the higher timeframe higher low.
- If Daily is bullish, a bearish H1 sequence often reflects profit taking and rebalancing, not a reversal.
- If H4 makes a new higher low after a selloff, you treat the H1 downtrend as finished and you look for a bullish shift on M15.
- If H4 breaks its prior higher low, the pullback likely turned into a reversal. You stop buying dips and you reassess the Daily leg.
Anchor your decision to the highest timeframe swing level that matters. Do not let M15 noise override a Daily structure point.
Avoiding conflicting signals, a checklist for timeframe alignment
- 1, Daily bias is clear: You can point to the last HH or LL and the last HL or LH.
- 2, H4 matches or corrects: H4 either trends with Daily or sits in a defined pullback into a level.
- 3, H1 is at a location: Price sits at a prior swing point, equal high or low, or a broken internal level.
- 4, M15 shows the sequence: Sweep, shift, retest. You do not enter before the retest.
- 5, Your stop has structure: Beyond the sweep high for shorts, beyond the sweep low for longs.
- 6, Your target has liquidity: Next swing point, range edge, or equal high or low.
- 7, Your risk is defined in pips: Convert distance to cost before you click buy or sell. Use a pips reference so your sizing stays consistent across pairs.
If you get conflict, step up one timeframe. If Daily and H4 disagree, you wait. If H4 and H1 disagree, you trade smaller or you stand down. If only M15 disagrees, you ignore it and wait for it to realign.
How to Mark Market Structure Step-by-Step (A Repeatable Workflow)
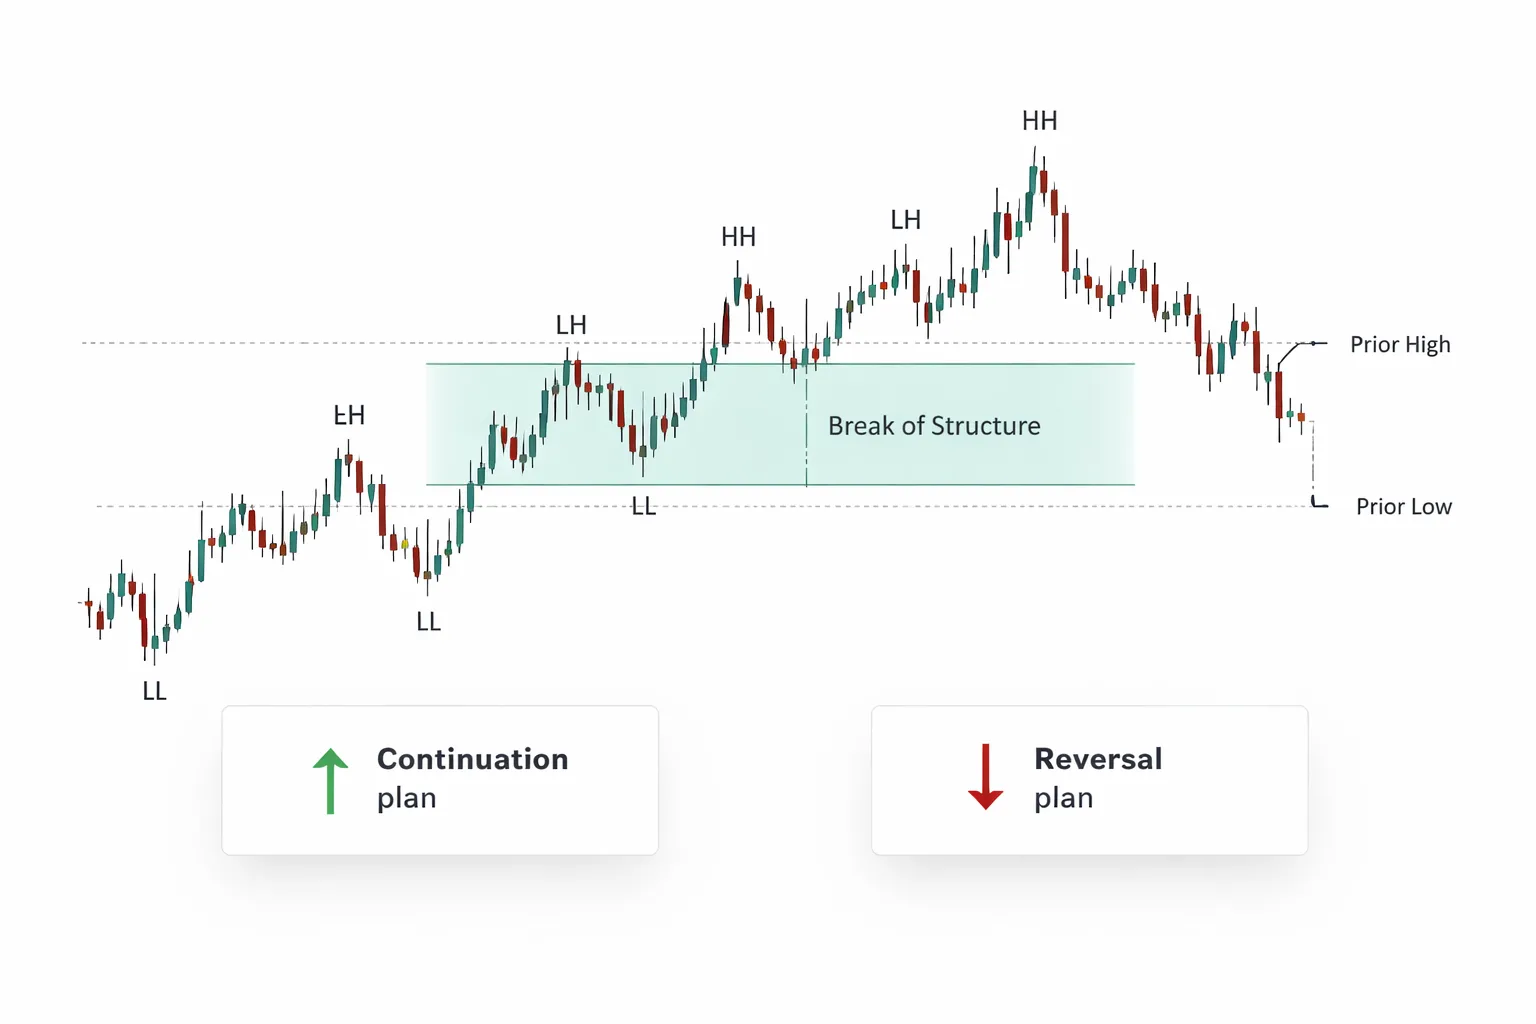
Step 1: Choose the analysis timeframe and define your swing rule
Pick one timeframe to mark structure. Use it for all labels. Do not mix rules.
- Swing rule: define what counts as a swing high or swing low.
- Use a simple rule you can repeat. Example, a swing high has at least 2 candles on each side with lower highs. A swing low has at least 2 candles on each side with higher lows.
- Timeframe guide: Daily for direction, H4 for setup, H1 for entry timing. If you trade only one timeframe, keep it consistent.
- Lock the lookback window. Example, mark the last 30 to 90 trading days on Daily, or last 2 to 4 weeks on H4.
Your goal is consistency. If you change the swing rule, your HH and LL labels change.
Step 2: Mark major swing points and label HH, HL, LH, LL objectively
Start from left to right. Mark only clear swings first. Skip minor noise.
- Plot each swing high and swing low that meets your rule.
- Label HH when price makes a swing high above the prior swing high.
- Label HL when price makes a swing low above the prior swing low.
- Label LH when price makes a swing high below the prior swing high.
- Label LL when price makes a swing low below the prior swing low.
- Use closes to confirm breaks if your system needs it. If you use wicks, use wicks every time.
Do not force labels. If you cannot point to the prior swing the label compares to, you do not have a valid HH, HL, LH, or LL.
Step 3: Identify the most recent valid break and current bias
Find the last structure level that price broke. This gives you bias.
- Bullish bias: last valid break took out a prior swing high, and price held above the last swing low that formed after the break.
- Bearish bias: last valid break took out a prior swing low, and price held below the last swing high that formed after the break.
- Invalidate bias when price breaks the last protected swing in the opposite direction.
Track one thing. The most recent confirmed break. It matters more than older structure.
Step 4: Draw key levels and zones (prior highs, lows, range boundaries)
Turn structure into levels you can trade from. Keep the chart clean.
- Draw horizontal lines at the most recent swing high and swing low.
- Mark prior day or week high and low if they align with your swings.
- Mark equal highs and equal lows as a single zone, not five lines.
- Define the current range. Use the last clear swing high as the range high and the last clear swing low as the range low.
- Limit zones. Two to five levels is enough for most sessions.
These levels become your decision points for entries, stops, and targets.
Step 5: Create a scenario plan (continuation vs reversal) before entry
Write two plans. One for trend continuation. One for trend shift. You decide before you place risk.
| Scenario | What you need to see | What you do | Invalidation |
|---|---|---|---|
| Continuation | Price respects the last HL in an uptrend, or the last LH in a downtrend. Then price breaks the prior swing in trend direction. | Look for entries near the retest of the broken level or inside the pullback zone. Set stop beyond the protected swing. Set target at the next prior swing level. | Price breaks and closes beyond the protected swing in the opposite direction. |
| Reversal | Price breaks the protected swing, then fails to reclaim it on a retest. Structure starts printing LH and LL, or HH and HL in the new direction. | Wait for the first pullback in the new direction. Enter near resistance after a bearish shift, or near support after a bullish shift. Define stop beyond the retest swing. | Price reclaims the broken structure level and holds above it for bullish, or below it for bearish. |
Then convert the stop distance to pips and cost before you enter. Match position size to your plan, and to your leverage limits. Read how leverage works in forex if you size based on margin.
Practical Trade Frameworks Using HH/LL Structure (Without Overcomplicating It)
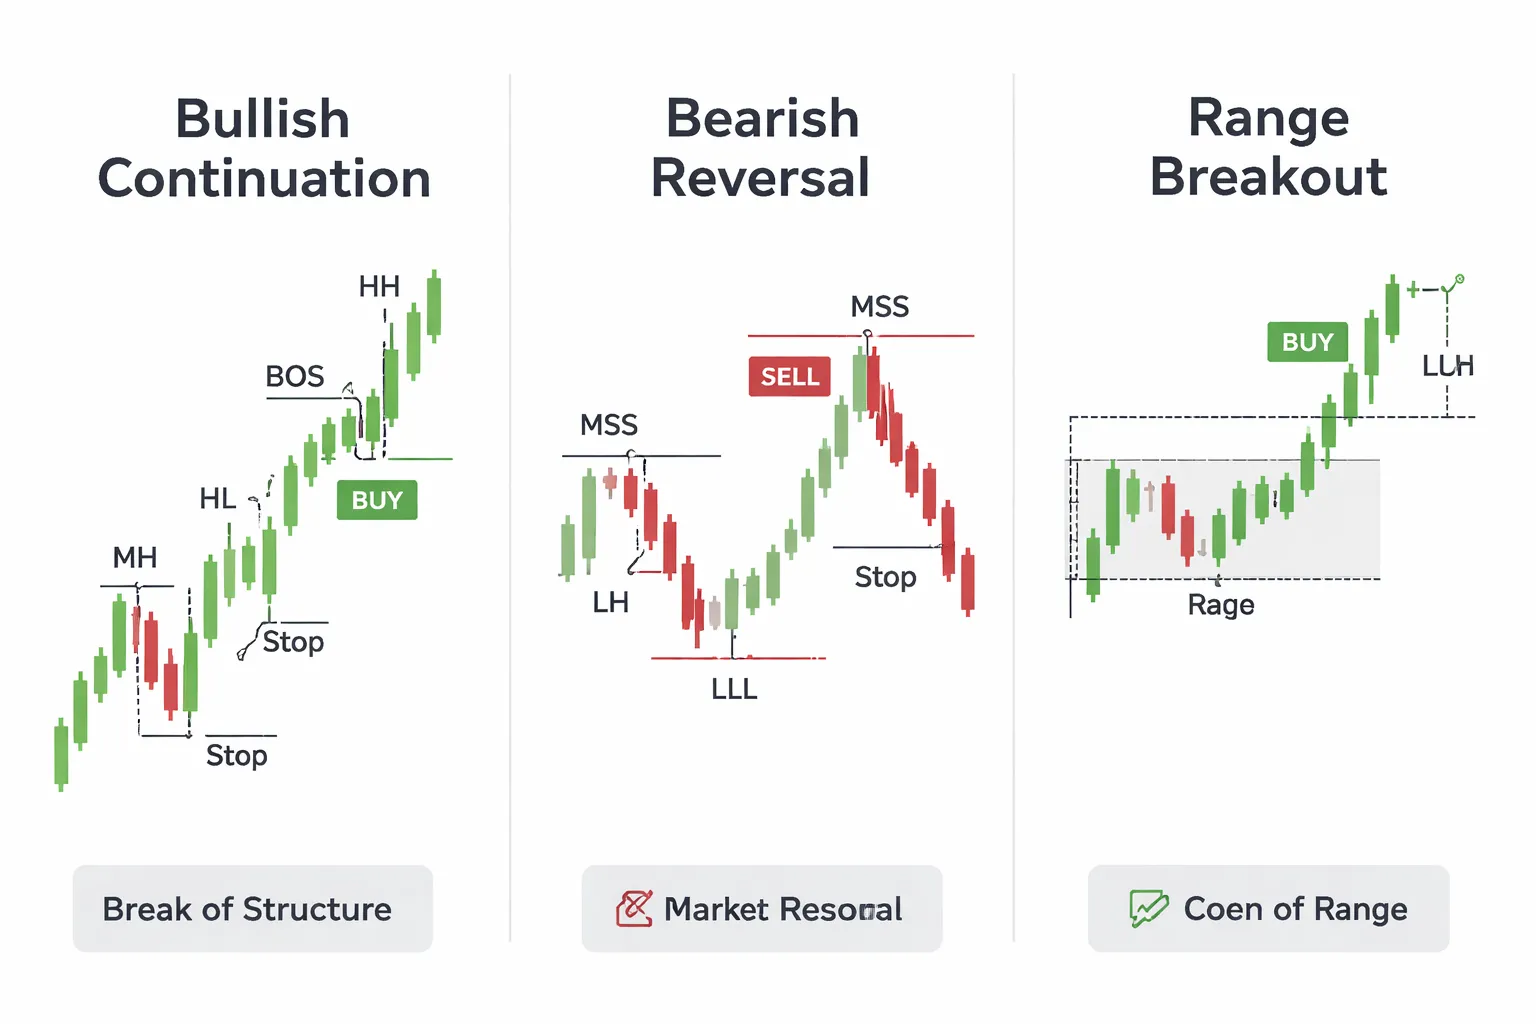
Continuation Setup, Trade the Pullback After a Confirmed BOS
Use this when price makes a clean break of a prior swing high in an uptrend, or a prior swing low in a downtrend.
- Step 1, confirm BOS. Wait for a candle close beyond the prior swing. Ignore wicks that snap back inside.
- Step 2, map the pullback zone. Mark the broken swing level and the last pullback swing that formed before the break.
- Step 3, wait for the retest. You want price to return to the broken level and stall, not slice through it.
- Stop. Place it beyond the retest swing, not tight on the level.
- Target. First target at the next obvious swing high or low. If trend stays intact, trail behind new higher lows or lower highs.
This setup fails fast when the retest does not hold. If price closes back through the level and keeps going, you skip it.
Reversal Setup, Trade After an MSS With Confirmation and Retest
Use this when the old trend loses its sequence and price prints a shift in structure.
- Step 1, spot the break in sequence. In a downtrend, you want a higher high that breaks a prior lower high. In an uptrend, you want a lower low that breaks a prior higher low.
- Step 2, demand confirmation. Wait for a candle close beyond the key swing that defines the shift. No close, no trade.
- Step 3, wait for the retest. Price returns to the broken level. You want it to hold and start printing the first higher low for bullish, or first lower high for bearish.
- Stop. Beyond the retest swing. If the retest swing breaks, the reversal idea is wrong.
- Target. Aim for the opposite side of the prior range, then the next swing level on the higher timeframe.
Keep the reversal simple. One shift, one retest, one clear invalidation point. If you need multiple extra rules, you do not have an edge, you have hesitation.
Breakout Setup, When It Is Valid to Trade Expansion From a Range
Most breakouts fail when the market still sits in balance. Trade breakouts only when structure supports expansion.
- Valid breakout conditions. Tight range, multiple reactions at the boundaries, and a clear sweep of liquidity near one edge before the break.
- Breakout confirmation. A candle close outside the range, then follow-through. One close with no follow-through is noise.
- Two entry options. Conservative, wait for a retest of the range edge. Aggressive, enter on the close only if momentum is strong and spread stays normal.
- Stop. If you enter on retest, place stop inside the range beyond the retest swing. If you enter on close, your stop still goes back inside the range. If it returns and holds inside, the breakout failed.
- Target. Use the next higher timeframe swing, or project the range height from the breakout point and take partials into that zone.
Do not trade range breakouts during thin liquidity conditions. Check your pair characteristics first, especially if you trade minors or exotics. Use major vs minor vs exotic currency pairs to avoid pairs that widen spreads and distort structure.
Entry Triggers, Candle Closes, Reclaims, and Momentum Confirmation
Structure gives direction. Triggers give timing. Use one trigger type per setup and keep it consistent.
- Candle close trigger. Enter after a close beyond the level you marked. Use it for BOS and for range breaks. You want a close that sits clearly past the line, not barely over it.
- Reclaim trigger. Price dips through the level, then closes back above it for bullish, or below it for bearish. Enter on the reclaim close or on the first pullback that holds. This works well on retests after MSS.
- Momentum confirmation. You want expansion candles in the breakout direction and smaller candles on the pullback. You also want the pullback to take longer than the impulse. Fast pullback often signals weak structure.
Risk Management and Invalidation: Where Structure Tells You You’re Wrong
Placing stops, beyond the swing vs beyond the liquidity sweep
Structure gives you a clean invalidation point. Your stop belongs where your idea fails, not where it feels comfortable.
- Trend continuation entry. If you buy a bullish pullback, your invalidation sits below the last higher low. If you sell a bearish pullback, your invalidation sits above the last lower high.
- MSS reversal entry. After the shift and retest, your invalidation sits beyond the first new HL for longs, or beyond the first new LH for shorts. If price breaks that level, the shift failed.
- Range breakout entry. If you trade a breakout, your invalidation sits back inside the range, past the retest swing. A close back inside the range with follow-through often signals failure.
Many moves sweep liquidity before reversing. If your setup expects a sweep, do not place your stop on the obvious swing. Place it beyond the sweep level that would prove real acceptance against your bias.
- Stop beyond the swing. Tighter risk. Higher chance of getting tagged by a sweep.
- Stop beyond the sweep. Wider risk. Lower chance of a stop hunt. You must cut size to keep risk constant.
Use a simple rule. If your entry triggers only after a reclaim close back above a level, your stop goes below the low of that sweep. If your entry triggers on the first touch of the level, your stop goes beyond the prior swing.
Position sizing basics, risk per trade and volatility-aware stop distance
Pick a fixed risk per trade. Most retail traders stay in the 0.25% to 1% range. You can survive a losing streak without crippling drawdown.
Then size the position from the stop distance. Wider stop means smaller position. Do not change that rule.
| Input | What you decide | Why it matters |
|---|---|---|
| Account size | Your equity, not your balance | Equity reflects real risk under open exposure |
| Risk % per trade | Fixed number, same every trade | Keeps variance under control |
| Stop distance | Structure-based invalidation in pips | Defines your loss if you are wrong |
| Position size | Calculated from risk and stop | Prevents oversizing on tight stops |
Make your stop volatility-aware. If the average swing size expands, stops placed at “normal” distances get hit more. Use recent ATR or average swing range to sanity check the distance between entry and invalidation.
- If your structure stop sits inside current ATR noise, expect more random stop-outs.
- If your structure stop sits far outside recent volatility, your position size will drop. That trade may not be worth taking.
For a step-by-step method, use this guide on how to calculate position size in forex.
Managing the trade, partials, trailing behind swings, and time-based exits
Once you enter, manage the trade with structure. If structure changes against you, exit. Do not wait for hope.
- Partials. Take some profit at the next opposing swing, prior day high or low, or a clean liquidity pool. Lock in reduction of risk, then let the rest run. Do not scale out so much that the remaining position cannot pay for losses.
- Trail behind swings. In an uptrend, trail below each new higher low that forms after a push. In a downtrend, trail above each new lower high. Move the stop only after price prints the swing and confirms it with a break in the trend leg.
- Time-based exits. If price does not break structure in your favor within your planned window, exit. Stale trades turn into random trades. Use a simple limit, like “exit if no new HH or LL forms after X candles” based on your timeframe.
Keep one invalidation rule. Price breaks the level that defines your idea, you are wrong. Close the trade. Move on.
Common Mistakes When Trading Higher Highs and Lower Lows
Using Micro Swings as Major Structure (Timeframe Mismatch)
Micro swings form all day. Major structure forms less often. If you trade a 5 minute HH or LL like it defines the daily trend, you will overtrade and get chopped.
- Match structure to your trade length. If you target 20 to 40 pips, map structure on a higher timeframe, then execute on a lower timeframe.
- Use a clean rule. Define trend on one timeframe up, enter on your execution chart. Do not redefine trend every few candles.
- Count swings consistently. Ignore minor inside swings unless they break a prior swing high or low that matters on your chosen structure timeframe.
Ignoring Session Timing and News Volatility
Session opens and high impact news print extremes. Those extremes often fail and leave false HH or LL signals. If you mark swings during thin liquidity or during a news spike, your structure map becomes noise.
- Mark structure after the impulse settles. Let the first push and snapback complete before you label a new HH or LL.
- Expect different behavior by session. London often expands range, New York often continues or reverses it, Asia often ranges.
- Plan around scheduled releases. If you trade through news, widen invalidation or reduce size. If you do not, step aside.
- Use session context. Keep a simple routine using forex market hours and trading sessions to avoid labeling swings in the worst conditions.
Confusing a Single Spike With a Structural Break (No Confirmation)
A wick through a level is not a break. Structure breaks need acceptance. Without it, you buy tops and sell bottoms.
- Require a close. Use candle close beyond the swing level on your structure timeframe.
- Look for follow through. A break that holds should not instantly snap back under the level.
- Separate stop runs from breaks. If price pierces a level and closes back inside the prior range, treat it as liquidity sweep, not a trend shift.
Forcing Bias and Missing the Bigger Picture
You will anchor to one swing that fits your idea. Then you ignore the sequence that matters. This creates late entries, missed exits, and repeated stop outs.
- Start from higher timeframe. Mark the last clear HH and HL, or LL and LH. Then drop down.
- Update your map. If price prints a new valid swing, your prior narrative is outdated.
- Keep one invalidation level. If price breaks the level that defines your idea, exit. Do not “give it room” because you want to be right.
| Common mistake | What it causes | Fix |
|---|---|---|
| Trading micro HH and LL as major structure | Chop, overtrading, weak signals | Define structure one timeframe higher than execution |
| Ignoring session and news effects | False swing points, random entries | Map structure after volatility settles, avoid labeling during spikes |
| Calling a wick a break | Buying tops, selling bottoms | Require a close and follow through beyond the level |
| Anchoring to one swing to fit bias | Late exits, missed reversals | Start higher timeframe, update swings, respect invalidation |
Tools and Chart Settings That Help (But Don’t Replace Skill)
Best Chart Types and Settings
Use candlesticks. They show open, high, low, close in one view. You can confirm breaks with a close, not a wick.
Pick a small set of timeframes. Many traders do well with HTF for structure and LTF for execution. Example, 4H or 1D to map swings, 15M or 5M to time entries. Keep it consistent.
Set your session view. Forex reacts to London and New York. If your platform supports it, mark:
- Asia range.
- London open.
- New York open.
- New York lunch to close.
Use a clean template. Your goal is to see swing points and key levels fast. Start with:
- Price candles only.
- One or two horizontal levels per swing zone, not a grid of lines.
- One moving average at most, only if it helps you stay aligned with trend.
- One volatility tool at most, like ATR, to size stops and avoid tight placements.
Standardize your chart settings. Use the same colors, same line style, same zoom level when you label structure. Consistency reduces label drift.
Optional Helpers: Fractals, ZigZag, and Swing Indicators
Indicators can help you see swings faster. They can also train you to outsource decisions. Use them as a check, not a driver.
| Tool | What it does | Pros | Cons | How to use it well |
|---|---|---|---|---|
| Fractals | Marks local highs and lows after a few bars confirm. | Forces patience. Reduces impulse labeling. | Late by design. Misses some meaningful swings in strong trends. | Use it to validate your swing selection, then remove it. |
| ZigZag | Connects swing points based on a set deviation. | Clean visual. Helps you see main legs. | Repaints. The last leg changes while price moves. | Use it for post-trade review only. Never for live break calls. |
| Swing high, swing low indicators | Marks pivots using a lookback window. | Fast labeling. Good for building a repeatable process. | Window choice changes everything. Can over-label in chop. | Fix one setting per instrument and timeframe, then compare to your manual labels. |
Non-negotiable rule. Your structure call comes from price. You need a close beyond the level, then follow-through. Tools can highlight candidates, they cannot confirm intent.
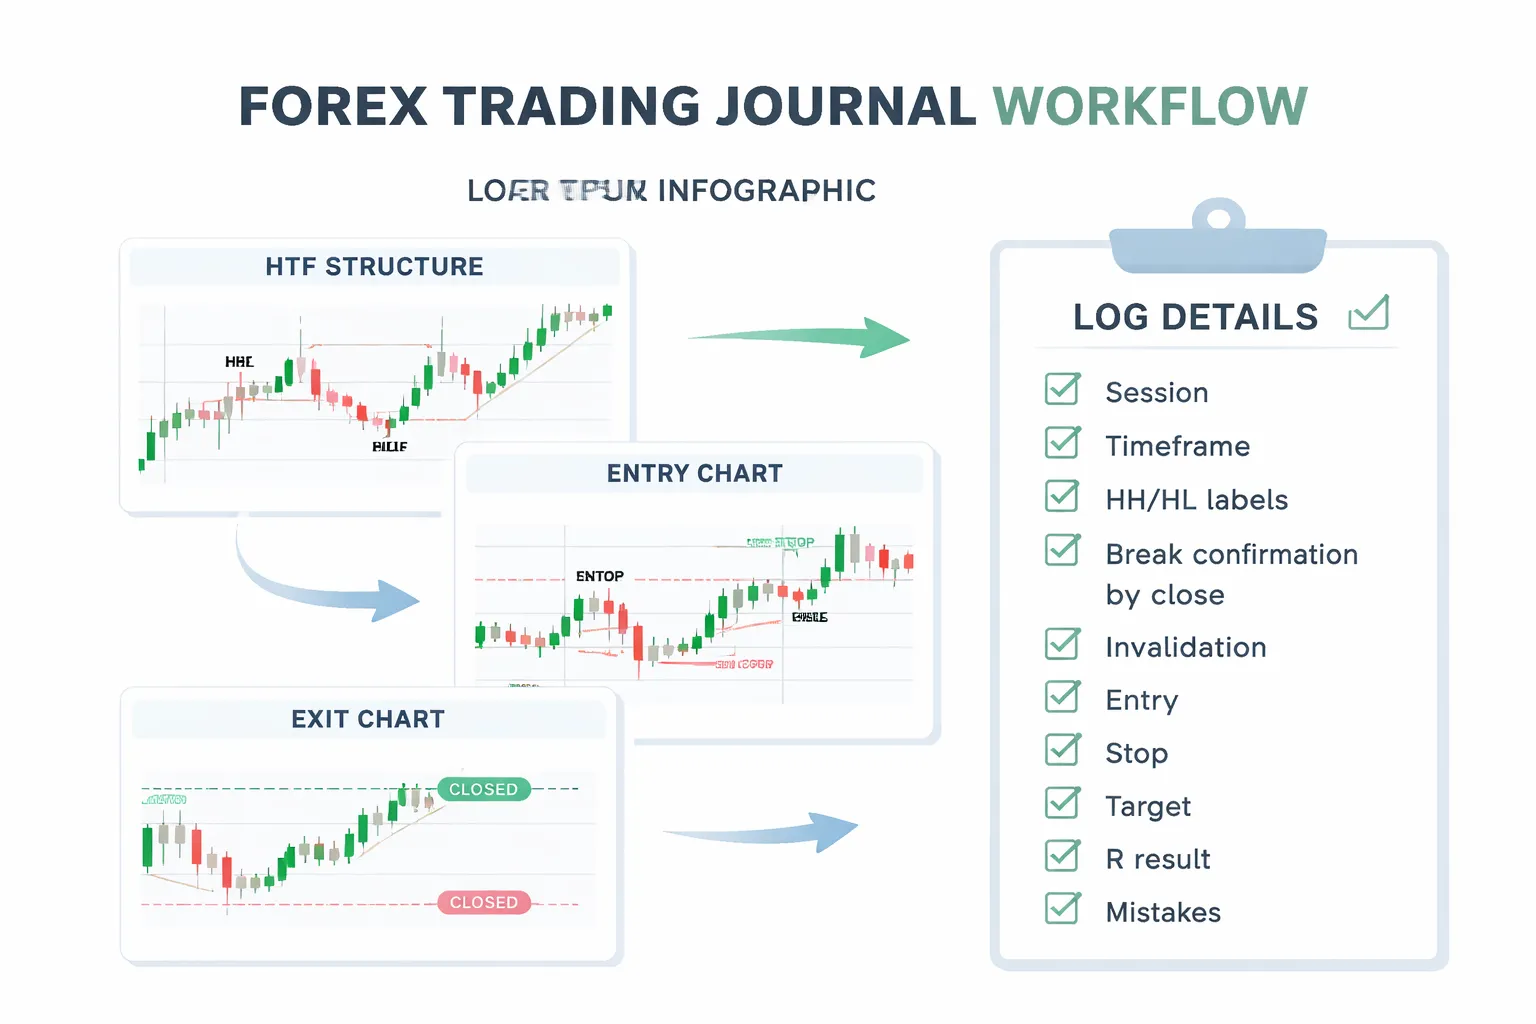
Journaling Structure: Screenshots, Labels, and What to Log
Your journal builds pattern recognition. Keep it tight. Track the same fields every trade.
Take three screenshots.
- Higher timeframe before entry, with your swing labels and key levels.
- Execution timeframe at entry, showing the break and the retest or continuation trigger.
- After exit, same zoom level, with result and notes.
Label structure the same way each time.
- Mark the last confirmed HH, HL, LH, LL.
- Mark the level that defines trend, the last HL in an uptrend, the last LH in a downtrend.
- Mark your invalidation point, where your structure idea fails.
Log what drives improvement.
- Date, pair, session, and timeframe.
- Market state, trend, range, or transition.
- Structure thesis in one line, example, “BOS above prior LH, now looking for HL hold.”
- Entry trigger and the candle close that confirmed it.
- Stop placement logic, level-based plus ATR buffer if you use it.
- Target logic, next structure level, opposing swing, or measured move.
- Execution notes, spread, fill quality, and any slippage. Link it to your read on slippage in forex if fills keep breaking your plan.
- Mistake tag, early entry, wick break, late exit, moved stop, ignored invalidation.
- Outcome in R, plus max favorable excursion and max adverse excursion if your platform provides it.
Review cadence. Review 20 trades at a time. Count your top two mistake tags. Fix one behavior next batch. Do not change five variables at once.
FAQ
What counts as a higher high and higher low?
You get a higher high when price breaks the prior swing high and closes above it. You get a higher low when price pulls back, holds above the prior swing low, then turns up. Use consistent swing rules, same timeframe, same candle close 기준.
What counts as a lower low and lower high?
You get a lower low when price breaks the prior swing low and closes below it. You get a lower high when the pullback fails below the prior swing high and turns down. Track the sequence, not one candle spike.
Do wicks count as breaks in market structure?
Wicks can signal liquidity runs. They do not confirm structure on their own. Use a close beyond the level, or your backtested rule like close plus retest. Write the rule down. Apply it the same way every trade.
How do you define a swing high or swing low?
Pick a rule you can repeat. Example, a swing high has at least two candles on each side with lower highs. A swing low has at least two candles on each side with higher lows. Use the same lookback across charts.
What is a trend shift versus a pullback?
A pullback keeps the last higher low intact in an uptrend, or the last lower high intact in a downtrend. A trend shift breaks that key swing and holds beyond it by your confirmation rule. One push against the trend is not enough.
What is a break of structure and what is a change of character?
Break of structure confirms continuation in the current trend, like taking a prior high in an uptrend. Change of character flags the first meaningful break against the trend, like taking a prior higher low. Treat it as a warning, not an entry signal.
Which timeframe should you use for market structure?
Use one timeframe to define structure and one lower timeframe to time entries if needed. Your structure timeframe should match your holding time. If you trade intraday, do not base structure on weekly swings. Keep your rules stable across sessions.
How do you avoid false breaks and whipsaws?
Reduce noise with a confirmation rule, close beyond level, close plus retest, or ATR based buffer. Filter with session context and spread. Size risk small enough to survive clusters of losses. Log wick breaks as a mistake tag if they keep hitting you.
How do you place stops using market structure?
Place the stop beyond the invalidation level, usually beyond the swing that defines the trend. In an uptrend, that is below the last higher low. Add a buffer for spread and typical noise. Keep risk per trade fixed. Use position sizing to match your stop distance.
What is the minimum you should track in your journal for structure trades?
Record entry trigger, structure level, stop, target, and your confirmation rule. Tag mistakes like early entry, wick break, moved stop, late exit. Track outcome in R, plus MFE and MAE. Review 20 trades at a time. Fix one behavior per batch.
Conclusion
You trade structure to remove guesswork. Higher highs and higher lows define an uptrend. Lower highs and lower lows define a downtrend. A trend shift starts when price breaks structure and fails to reclaim it.
Keep your process tight. Mark the last confirmed swing high and swing low. Wait for a close that breaks that level. Then wait for the retest and rejection that matches your rule. Place your stop beyond the invalidation point. Set your target at the next structure level. Do not widen stops. Do not move targets mid trade.
Your edge comes from consistency, not prediction. Use fixed risk per trade. Calculate size from your stop distance, see position sizing. Log every trade the same way. Review in batches. Change one rule or behavior at a time.
Final tip. Trade one market, one timeframe, one structure rule set for 20 trades. If you cannot follow the rule, you do not have a strategy yet.
-
Forex Leverage Explained: How It Works, Pros, Cons & Examples
7 months ago -
Forex Market Hours & Trading Sessions Explained (Best Times to Trade)
7 months ago -
How to Calculate Position Size in Forex (Position Sizing Formula + Examples)
7 months ago -
What Is a Lot Size in Forex? Lot Types + Quick Examples
7 months ago -
What Are Pips in Forex? Definition, Examples & Why They Matter
7 months ago
-
- Step 1: Choose the analysis timeframe and define your swing rule
- Step 2: Mark major swing points and label HH, HL, LH, LL objectively
- Step 3: Identify the most recent valid break and current bias
- Step 4: Draw key levels and zones (prior highs, lows, range boundaries)
- Step 5: Create a scenario plan (continuation vs reversal) before entry
-
- What counts as a higher high and higher low?
- What counts as a lower low and lower high?
- Do wicks count as breaks in market structure?
- How do you define a swing high or swing low?
- What is a trend shift versus a pullback?
- What is a break of structure and what is a change of character?
- Which timeframe should you use for market structure?
- How do you avoid false breaks and whipsaws?
- How do you place stops using market structure?
- What is the minimum you should track in your journal for structure trades?
-
-
- Step 1: Choose the analysis timeframe and define your swing rule
- Step 2: Mark major swing points and label HH, HL, LH, LL objectively
- Step 3: Identify the most recent valid break and current bias
- Step 4: Draw key levels and zones (prior highs, lows, range boundaries)
- Step 5: Create a scenario plan (continuation vs reversal) before entry
-
- What counts as a higher high and higher low?
- What counts as a lower low and lower high?
- Do wicks count as breaks in market structure?
- How do you define a swing high or swing low?
- What is a trend shift versus a pullback?
- What is a break of structure and what is a change of character?
- Which timeframe should you use for market structure?
- How do you avoid false breaks and whipsaws?
- How do you place stops using market structure?
- What is the minimum you should track in your journal for structure trades?
-
-
How to Place a Forex Trade Step by Step (Your First Trade Explained)
5 months ago -
Forex Trading vs Crypto Trading: Which Market Is Better for Beginners?
5 months ago -
Forex Lot Size Calculator: How to Use It to Size Trades Correctly
7 months ago -
How to Calculate Position Size in Forex (Position Sizing Formula + Examples)
7 months ago -
Forex Leverage Explained: How It Works, Pros, Cons & Examples
7 months ago
-
Forex Trading Platforms Comparison: MetaTrader vs cTrader vs TradingView
7 months ago -
Stop Loss vs Take Profit: Differences, Examples & Best Practices
7 months ago -
Is Forex Trading Legal in the United States? Rules, Regulators & What to Know
7 months ago -
Forex Leverage Explained: How It Works, Pros, Cons & Examples
7 months ago -
Forex Market Hours & Trading Sessions Explained (Best Times to Trade)
7 months ago