What Moves USD/JPY? Drivers, Risk Sentiment & Rate Differentials

USD/JPY moves on two forces, rate differentials and risk sentiment. When U.S. yields rise versus Japan, the pair tends to push higher. When markets turn risk-off, the yen often strengthens and USD/JPY can drop. You also need to track Bank of Japan policy, U.S. inflation, and Japan’s inflation path because they set expectations for future rates.
This guide breaks down the main drivers that matter day to day. You will learn which data points move USD/JPY most, how to read yield spreads, how to spot risk-on and risk-off shifts, and how policy signals from the Fed and BoJ flow into price. For the inflation link, see inflation and exchange rates.
Key Takeaways
Key Takeaways
- In het kort: USD/JPY tracks the U.S. Japan rate gap, real yield moves, and risk sentiment.
- In het kort: Fed and BoJ signals move the pair because they change future rate pricing.
- In het kort: Watch U.S. CPI, jobs data, and Treasury yields for the fastest reactions.
- In het kort: Watch Japan wage growth, inflation, and BoJ guidance for trend shifts.
- In het kort: Risk-off often supports JPY, risk-on often weakens it.
- Start with the yield spread. Track U.S. 2Y and 10Y yields versus JGBs. The spread often leads spot.
- Focus on real rates. Rising U.S. real yields often lift USD/JPY. Falling real yields often pressure it.
- Respect the calendar. CPI, PCE, NFP, FOMC, and key Fed speakers can reprice the curve fast.
- For Japan, track wages and services inflation. They shape BoJ exit risk and JPY repricing.
- Use risk gauges. Watch equities, VIX, credit spreads, and commodity moves. They help you read risk-on or risk-off.
- Do not ignore intervention risk. Sharp, one way moves can trigger verbal warnings or action.
- Build a simple checklist before you trade. Rates first, then policy signals, then risk sentiment, then data surprises.
- For a practical workflow on trading releases, use how to trade forex news.
USD/JPY at a glance: what the pair represents and why it matters
How to read USD/JPY
USD/JPY shows how many yen you need to buy 1 U.S. dollar.
If USD/JPY goes up, the dollar strengthens and the yen weakens. You pay more yen per dollar.
If USD/JPY goes down, the dollar weakens and the yen strengthens. You pay fewer yen per dollar.
Think in yield terms. Higher expected U.S. rates versus Japan often pushes USD/JPY higher. Lower expected U.S. rates versus Japan often pulls it lower.
Why USD/JPY is a global macro barometer
- Rates and spreads. USD/JPY tracks the gap between U.S. and Japan yields, especially the front end for policy expectations and the 5 to 10 year area for broader rate trends. When U.S. yields rise faster than Japan yields, USD/JPY often follows.
- Policy signals. Fed guidance can reprice the dollar fast. Bank of Japan policy shifts, yield curve control tweaks, or talk about JPY weakness can flip positioning.
- Risk sentiment. In risk-off moves, JPY often strengthens as funding trades unwind. In risk-on, JPY often weakens as carry demand returns. Track equities, VIX, and credit spreads alongside yields.
- Growth and data surprises. Strong U.S. prints that raise rate expectations tend to lift USD/JPY. Weak prints that pull cuts forward tend to drop it. High impact releases like payrolls can move the pair in minutes. Use your NFP trading guide to plan for that volatility.
Typical trading sessions and liquidity pockets
- Tokyo session. You often see the clearest JPY flow early in Asia. Watch local headlines, BOJ commentary, and large option levels around the Tokyo fix.
- London session. Liquidity improves as Europe opens. Trends that started in Asia often extend or reverse here as macro funds reprice rates and risk.
- New York session. U.S. data and Treasury moves dominate. You often get the day’s largest impulse after top tier releases, then slower trade into the close.
- London and New York overlap. This is the main liquidity pocket. Spreads tighten, stops trigger faster, and breakouts have a higher chance of follow-through.
| Time window | What tends to matter most | What you watch |
|---|---|---|
| Tokyo | JPY-specific flows, local policy risk | BOJ headlines, Tokyo fix, option strikes |
| London | Macro repricing, positioning | Global yields, risk tone, trend confirmation |
| New York | U.S. data and Treasuries | Economic releases, U.S. yields, equities |
| London to New York overlap | Peak liquidity, fastest execution | Breakouts, stops, spread changes |
The core engine: interest rate differentials and yield dynamics
Short-end vs long-end rates, which matters more and when
USD/JPY responds to the rate gap between the U.S. and Japan. The market prices that gap through yields across the curve, but the driver changes by regime.
- Short-end rates (0 to 2 years) lead when the market reprices central bank policy. Watch OIS, 2-year yields, and the next few FOMC and BOJ meetings. This is the cleanest signal for policy divergence.
- Long-end rates (5 to 10 years) lead when the move comes from term premium, inflation expectations, or heavy Treasury supply. Watch 10-year yields, 5y5y inflation, and auction results. This matters most when the Fed path looks stable but yields still swing.
- Curve shape matters. A U.S. bear steepener often lifts USD/JPY, but it can also trigger risk-off. A bull flattener can hit USD/JPY as front-end expectations fall.
Treasury yields as the day-to-day transmission channel
On most days, USD/JPY trades like a proxy for U.S. yields. U.S. data prints move Treasuries first, then USD/JPY follows.
- Fastest link. Hot CPI or strong payrolls push U.S. yields up, USD/JPY tends to lift with them. Soft data does the opposite.
- Best screens to track. U.S. 2-year yield for Fed pricing, U.S. 10-year yield for broader macro repricing, and Japan 10-year yield for BOJ constraint changes.
- What to log. The level of U.S. 2-year, the daily change in U.S. 10-year, and the U.S. 2-year minus Japan 2-year spread. You want the spread direction, not the headline story.
- Execution reality. Big yield moves often hit during U.S. data windows and the London to New York overlap. Spreads widen, stops run. If you trade releases, use a plan built for that tape. See how to trade Forex news without getting wrecked.
The carry trade in practice, funding in JPY, investing in USD assets
Carry supports USD/JPY when the U.S. yield pickup looks stable and volatility stays contained. Traders borrow in JPY, then buy higher yielding USD assets.
- What makes carry work. Wide rate differentials, low FX volatility, and a stable risk backdrop.
- What it looks like. Long USD/JPY, or long USD assets with JPY funding. The market often expresses it through spot, forwards, and options structures tied to yield pickup.
- What breaks carry. A volatility spike, a sharp equity drawdown, or BOJ policy risk. When investors de-risk, they often buy JPY back fast.
Hedging costs for Japanese investors, FX forwards and cross-currency basis
Japan-based investors matter because they run large pools of capital. Their decision often comes down to hedged yield, not headline yield.
- FX forwards set the hedge cost. The forward points mostly reflect the short-term rate differential. When U.S. front-end rates rise, hedging USD back to JPY gets more expensive. That can reduce demand for hedged U.S. bonds.
- Cross-currency basis can distort the math. The USD/JPY basis can add extra cost on top of the plain rate gap. When basis widens, the hedge gets worse. When it narrows, hedged U.S. yield looks better.
- Practical read. Watch USD/JPY forward points, the 3-month and 1-year basis, and Japan investor flow headlines. If hedged yields turn unattractive, support for USD/JPY can fade even if spot yields look high.
When differentials stop working
Rate spreads drive the baseline, but they do not control every move. These are the main failure modes.
- Policy shifts. BOJ changes to its bond buying, yield curve control framework, or guidance can reprice JPY fast. The same holds for sudden Fed pivot risk.
- Risk shocks. In sharp risk-off, JPY often strengthens as positions unwind. USD/JPY can fall even if U.S. yields stay relatively high.
- Intervention risk. Rapid one-way moves and official warnings can cap USD/JPY or trigger violent reversals. Liquidity thins, dealers widen spreads, and options hedging can amplify the swing.
- Positioning extremes. Crowded carry can reverse on small catalysts. Watch volatility, skew, and key strike levels around fixes and expiries.
Central banks: Fed vs BoJ policy signals that move the market
Fed reaction function: inflation, jobs, and the dots
USD/JPY tracks the Fed through U.S. yields. Your job is to map data into the Fed path, then price the spread versus Japan.
- Inflation first. CPI, core CPI, and core PCE move rate expectations fast. Sticky services inflation usually supports higher terminal rate pricing and lifts USD/JPY. Use the forex economic calendar to track the releases that hit front end yields.
- Jobs are the tie breaker. Payrolls, unemployment, and wage growth change how long the Fed can stay restrictive. Strong jobs plus firm wages tends to keep cuts priced out. Weak jobs can pull forward cuts and drop USD/JPY even if spot looks resilient.
- The dot plot is a repricing event. Dots anchor the median path, but markets trade the distribution. Watch how many dots cluster near the current rate and where the longer run dot sits. A higher median for the next year lifts 2 year yields and usually supports USD/JPY. A wider dispersion raises uncertainty and can boost volatility.
BoJ regime changes: negative rates, YCC, and exit pricing
USD/JPY reacts most when the BoJ changes the rules. Small wording tweaks can shift the whole curve in Japan.
- Negative rates and the policy rate path. Any signal that the BoJ will lift the policy rate again matters more than the size of the move. The market trades the sequence, not the first step.
- YCC adjustments and bond market function. When the BoJ loosens control over JGB yields, Japan rates can move in larger daily ranges. That can compress the rate differential and push USD/JPY lower.
- Exit expectations drive the yen. Watch inflation trends, wage settlements, and language on “sustainable” price gains. If the BoJ suggests inflation can hold without policy support, traders price a faster normalization. USD/JPY usually falls on that shift.
Forward guidance, press conferences, and surprise risk
Most of the move often comes from guidance, not the rate decision.
- Statement changes. Look for edits to risk balance, inflation confidence, and policy “restriction” language. One removed phrase can shift the implied path.
- Press conference tells. Listen for pushback against market pricing. If the Fed leans against cuts, USD/JPY can jump even with no hike. If the BoJ downplays tightening, USD/JPY can rebound even after a hawkish headline.
- Surprise risk clusters around key events. FOMC, CPI, payrolls, and BoJ meetings can gap pricing in rates. That feeds straight into USD/JPY through the short end.
Policy divergence vs convergence: how narrative shifts reprice USD/JPY
USD/JPY trends when the story stays consistent. It reverses when the story flips from divergence to convergence.
- Divergence trade. Fed stays high for longer while the BoJ stays patient. Rate spreads widen. Carry demand rises. USD/JPY tends to grind higher.
- Convergence trade. U.S. cuts come into view while Japan tightens or signals a faster exit. Spreads compress. Hedging demand for JPY rises. USD/JPY can drop fast.
- What to track weekly. 2 year U.S. yield direction, 2 year Japan yield direction, OIS implied paths, and how the market prices the next three meetings. If those inputs stop supporting the current narrative, assume USD/JPY can reprice quickly.
Risk sentiment and safe-haven behavior
Why JPY can strengthen in risk-off
JPY often strengthens when risk appetite drops. You see it most when traders cut leverage and unwind funding trades.
JPY has long served as a funding currency because rates stayed low for years. In risk-on, investors borrow JPY, sell it, and buy higher yielding assets. In risk-off, that reverses fast. Investors sell risk assets, buy back JPY, and repay funding. USD/JPY falls when that buyback wave hits.
- Deleveraging. Margin calls and VAR limits force selling in equities and credit. That pushes investors to close FX hedges and reduce carry exposure.
- Funding unwind. Short JPY positions get covered. Cross asset players buy JPY to reduce funding risk.
- Hedging flows. Japanese investors can add FX hedges on overseas holdings when volatility rises. That increases JPY demand.
Equities, VIX, and credit spreads as leading indicators
USD/JPY often reacts to risk indicators before it reacts to economic data. Track these daily.
- Equities. Watch S&P 500 and Nasdaq futures during Asia and early Europe. Sharp equity selloffs often line up with USD/JPY drops from funding unwind.
- VIX. Rising VIX signals demand for downside protection and lower risk appetite. A fast VIX spike often matches faster JPY strength than a slow grind higher.
- Credit spreads. Watch U.S. investment grade and high yield spreads, plus CDS indices. Widening spreads usually confirm stress. That tends to support JPY even if spot equities bounce.
| Indicator | What to watch | Typical USD/JPY bias |
|---|---|---|
| Equity index futures | Intraday selloff, gap down, failed rebound | Down |
| VIX | Spike, breakouts to new monthly highs | Down |
| Credit spreads | Widening in HY, stress in CDS indices | Down |
| Equity rally with stable vol | VIX flat or lower, spreads stable | Up |
Geopolitical shocks and typical USD/JPY pathways
Geopolitical shocks usually hit USD/JPY through volatility and positioning. The first move often comes from risk reduction, not from rate expectations.
- Fast shock, fast JPY bid. Headlines lift volatility. Investors cut carry and buy JPY. USD/JPY drops.
- Energy shock can complicate the move. Japan imports energy. If oil spikes and the market focuses on Japan trade balance risk, the JPY bid can fade. You can see USD/JPY stabilize or rebound even with weak risk mood.
- Policy response flips the driver. If the shock changes Fed or BoJ expectations, rate differentials take over again. Then USD/JPY can reverse even while headlines stay negative.
Use risk indicators to time the first leg. Use front end yields to judge whether the move can extend. If both align, USD/JPY trends harder.
Risk-on rallies, when USD/JPY trends higher and why
USD/JPY tends to trend higher when risk appetite improves and the U.S. yield advantage holds.
- Carry returns. Investors rebuild leveraged long positions in higher yielding assets. They sell JPY to fund it.
- Volatility falls. Lower implied vol reduces hedging demand. It also increases tolerance for leverage.
- Japan outflows. Japanese investors often add foreign bond and equity exposure when markets calm. That can increase USD demand and weigh on JPY.
For your weekly framework, treat risk as the accelerator and rates as the engine. If equities rise, VIX falls, and credit stays calm, USD/JPY can grind higher even without fresh macro surprises. This is the same logic you apply across fundamental analysis in forex.
Macro data that consistently moves USD/JPY
U.S. CPI and PCE, inflation surprises and real yield repricing
USD/JPY reacts fast when U.S. inflation data changes the expected Fed path. Your focus is the surprise versus consensus, and what it does to real yields and the 2 year and 10 year Treasury yields.
- Top tier releases: U.S. CPI, Core CPI, Core PCE, and PCE services ex housing when markets fixate on sticky inflation.
- Market mechanism: hotter inflation lifts U.S. yields, widens the U.S. Japan rate gap, and usually lifts USD/JPY. Cooler inflation does the opposite.
- What to track: 2 year yield for near term Fed pricing, 10 year yield for term premium, 10 year TIPS real yield for real rate repricing.
- How you use it: if CPI beats and real yields rise, you treat USD/JPY pullbacks as likely to get bought while the rate gap theme stays intact.
Inflation drives currency pricing through rate expectations. For a broader framework, see inflation and exchange rates.
U.S. labor data, NFP, wages, and the growth vs inflation read
Labor data moves USD/JPY when it shifts the Fed reaction function. Jobs alone matter less than wages, hours, and participation.
- Highest impact set: Non Farm Payrolls, unemployment rate, average hourly earnings, average weekly hours, labor force participation.
- Inflation read: strong payrolls with firm wage growth and stable or rising hours tends to support higher yields and a higher USD/JPY.
- Growth scare read: strong payrolls with weaker hours, softer wages, or rising unemployment can flip the move, because the market starts to price a slowdown.
- Confirmation signals: weekly jobless claims trend, JOLTS when the market cares about labor tightness, and the quits rate when wage pressure matters.
Your filter is simple. Ask what labor implies for terminal rates and cuts. Then watch the 2 year yield response. USD/JPY usually follows that lead.
U.S. activity data, ISM and retail sales, recession risk and the yield curve
Activity data matters most when markets worry about recession or a policy pivot. In that regime, USD/JPY trades the curve, not the headline.
- ISM: the manufacturing PMI, services PMI, and prices paid. New orders and employment subcomponents matter most for turns.
- Retail sales: watch the control group. It feeds GDP tracking and moves front end yields when it surprises.
- Yield curve lens: if weak data pulls the 2 year yield down faster than the 10 year, the curve steepens and USD/JPY often drops as the market prices faster cuts.
- Risk overlay: in risk off, weak U.S. data can hit USD/JPY through yields and JPY demand at the same time.
Japan CPI and wage negotiations, Shunto as BoJ catalysts
Japan data moves USD/JPY when it changes Bank of Japan policy odds. The market cares most about sustained wages and services inflation, because that supports durable inflation.
- Japan CPI: focus on Tokyo CPI as the early signal, then national CPI. Watch core measures and services, not one off energy moves.
- Wages: monthly cash earnings can be noisy. Treat them as confirmation, not the first signal.
- Shunto: spring wage negotiations matter because they shape annual wage momentum. Strong results can lift JGB yields, strengthen JPY, and pressure USD/JPY lower.
- BoJ communication: speeches and meeting outcomes can dominate the data if the BoJ signals changes to rates, bond buying, or inflation confidence.
Event calendar prioritization, what matters in different regimes
You should rank releases by what the market currently trades. Use a regime lens. Then you avoid overreacting to low signal prints.
Capital flows, trade balances, and structural forces
Japan’s net international investment position and repatriation
Japan runs one of the largest net external asset positions in the world. That matters because Japan can bring money home fast when stress hits. You often see yen strength during risk-off moves even when Japan data looks soft.
- Repatriation risk: insurers, banks, and corporates cut overseas exposure and convert back into JPY. USD/JPY can drop quickly.
- Hedging is the channel: investors do not need to sell all foreign assets. They can raise FX hedges, which still creates JPY demand.
- Watch proxies: cross-currency basis, USD/JPY implied vols, and shifts in hedge ratios from large institutions. These often move before the spot rate.
Portfolio flows, lifers, pensions, and duration
Japanese life insurers and pensions sit at the center of the flow story. They run big bond books. They care about yield, currency hedge cost, and duration.
- Hedge cost drives behavior: when short-end US rates rise, USD hedging gets expensive. That reduces demand for unhedged USD assets and can cap USD/JPY upside.
- Duration preference matters: lifers often buy longer-dated credit and sovereigns. If US long yields rise while hedge costs stay high, they may prefer shorter tenors or stay domestic.
- Rebalancing windows: flows cluster around Japan’s fiscal year-end in March and mid-year book adjustments. You can get trend moves that look “technical” but come from allocation.
- Data to track: Japan MoF weekly securities flow data, and insurer investment plan headlines. Use it as confirmation, not a standalone signal.
Trade balance, energy prices, and terms of trade
Japan imports a large share of its energy. When oil and LNG prices rise, Japan’s import bill rises. That can pressure the yen, especially if export prices do not keep up.
- Higher oil often means weaker JPY: importers buy USD to pay for energy. USD/JPY can drift higher even without a rate shock.
- Terms of trade is the key link: if import prices rise faster than export prices, Japan needs more foreign currency for the same volume of imports.
- What to watch: Japan trade balance, import price index, and crude benchmarks. Add domestic inflation prints as a cross-check on whether higher import costs feed through, see how inflation data moves currency markets.
FDI and corporate hedging, how real-economy flows hit FX
FDI headlines matter less day to day, but corporate hedging can move USD/JPY. Large Japanese exporters and multinationals manage currency risk in size.
- Exporter behavior: when USD/JPY rises, exporters tend to increase hedge selling of USD forward. That can slow rallies and create supply near key levels.
- Importer behavior: energy and commodity importers buy USD on dips and hedge future payables. That can support USD/JPY on pullbacks.
- Overseas M&A: Japanese buyers often need USD funding for acquisitions. That can create one-off USD demand, then unwind as hedges get layered in.
- How it shows up: you see it in forward points, changes in hedging ratios, and persistent spot flow around corporate fixings.
Energy and commodities: an underappreciated driver for JPY
Oil price spikes hit Japan’s current account, fast
Japan imports most of its energy. Oil and LNG sit near the top of the import bill. When crude spikes, Japan’s terms of trade worsen and the trade balance can swing toward deficit. That usually weakens JPY.
Watch the transmission channel. Importers need USD to pay for energy. They hedge future payables in forwards and options. Spot demand often clusters around month end and corporate fixings. When energy jumps, those flows grow and USD/JPY can grind higher even if rate spreads do not move much.
Track it with hard data. Use Japan’s trade balance and current account prints, MoF trade statistics, and the import price index. Pair that with Brent and JKM LNG. When the import bill rises and export volumes lag, JPY tends to underperform.
Commodity inflation changes the real yield story
Commodity led inflation pressures Japan through imported energy and food. If CPI rises but the Bank of Japan stays slow to tighten, real yields fall. Lower real yields usually mean weaker JPY.
You should separate headline CPI from services inflation. Energy spikes lift headline CPI, but they do not always create persistent wage driven inflation. That gap matters for BoJ reaction. If markets price higher inflation without higher Japanese front end rates, USD/JPY can rally on a real yield gap.
Use inflation data the way macro desks do. Track Tokyo CPI for early signals. Track 5y breakevens, JGB real yields where available, and the US Japan real rate spread. If you need a refresher on the CPI to FX link, use how inflation data moves currency markets.
When commodities dominate rates, shock regimes take over
Sometimes commodity moves drown out rate differentials. This happens in supply shocks, war risk, and sudden OPEC cuts. Energy prices reprice the trade balance, inflation expectations, and risk sentiment at the same time. USD/JPY can move on the commodity tape first, then rates catch up later.
In these regimes, focus on sequencing.
- Step 1, crude and LNG gap higher, Japan import expectations rise.
- Step 2, JPY sells on terms of trade and USD demand from hedgers.
- Step 3, global risk sentiment can worsen, JPY may stabilize if risk off dominates.
- Step 4, US yields and Fed pricing adjust, the rate channel reasserts.
Practical tells help. If USD/JPY rallies with oil while US yields stay flat, commodities and flow drive the move. If USD/JPY rallies with both oil and US yields, you have alignment and follow through risk rises.
| Commodity move | What to watch | Typical USD/JPY bias |
|---|---|---|
| Brent up hard, US yields flat | Japan trade balance, import prices, corporate hedging flow | Up, grind rather than spike |
| Brent up, US yields up | Fed pricing, US Japan real rate spread | Up, stronger trend risk |
| Brent up, equities down hard | Volatility, credit spreads, safe haven flows | Two way, oil vs risk off battle |
| Brent down fast | Japan import bill relief, CPI expectations, hedges rolling off | Down, JPY can recover |
FX intervention and policy jawboning
Who can intervene and how it works
Japan intervenes through the Ministry of Finance (MoF). The MoF makes the decision and authorizes the trade. The Bank of Japan (BoJ) executes it as the agent. You will often see official language split this way, MoF talks policy, BoJ talks operations.
Most intervention aims to buy JPY and sell USD. The MoF uses Japan’s FX reserves. That changes short term order flow fast. It does not change the core driver if the rate gap still points to USD strength.
Coordination matters. The U.S. Treasury leads the U.S. stance. The Fed can execute if the U.S. agrees. Coordinated action is rare, but it has more impact because it signals shared policy intent and reduces the risk of a quick fade.
- MoF: decides, funds, communicates “excess moves” concerns.
- BoJ: executes spot intervention and handles settlement.
- U.S. side: Treasury approval drives any coordination, Fed can act as agent.
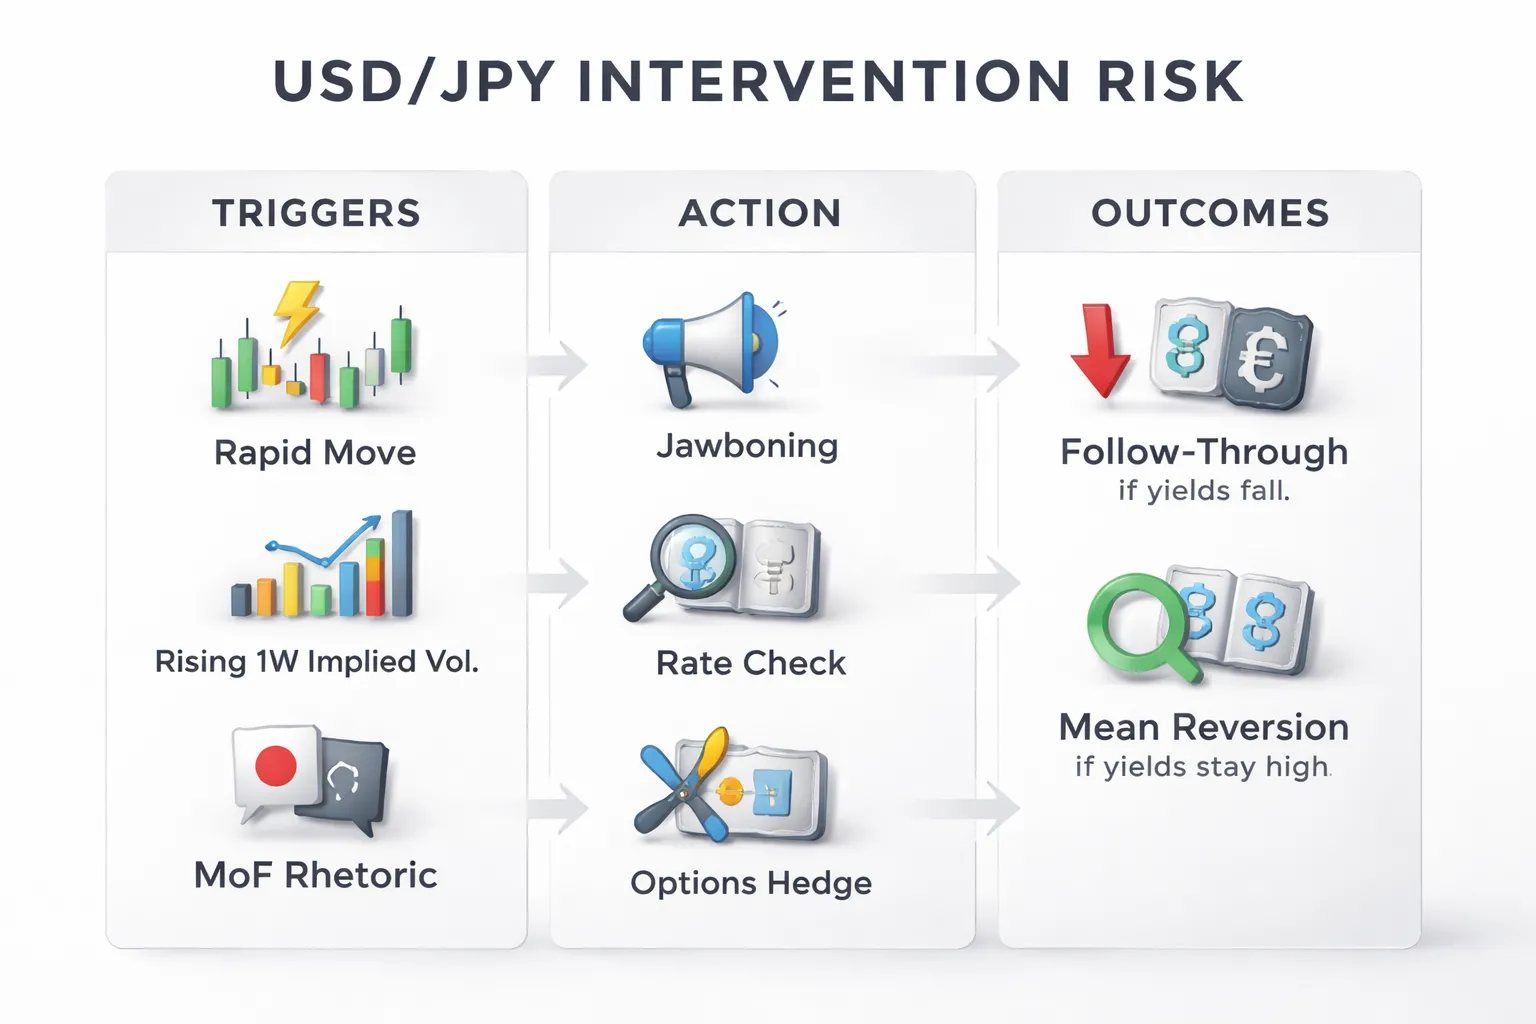
How to spot rising intervention risk
Speed beats level. Authorities focus on disorderly moves, not a specific number. A fast one way climb in USD/JPY raises the odds of action.
- Intraday pace: large, continuous advances with shallow pullbacks. Watch 1 hour and 4 hour ranges versus recent averages.
- Gap risk: thin liquidity windows, Tokyo open, London handover, and post data releases.
- Options signals: rising 1 week implied volatility, higher risk reversals that price JPY calls, and wider USD/JPY spreads.
- Rhetoric escalation: phrases like “excess volatility,” “one sided,” “speculative moves,” and “will take decisive action.” Repeated comments in a short period matter more than a single headline.
- Price behavior around round levels: failed breakouts and sudden multi figure drops can signal testing or pre positioning.
Jawboning is a tool by itself. Officials talk the market down to slow momentum and reduce the need to spend reserves. Treat it as a volatility catalyst, even if no intervention follows.
What happens after intervention, follow-through vs mean reversion
Intervention can move USD/JPY fast. The first move often comes with a sharp drop in USD/JPY and a spike in realized volatility. Your next decision is whether the move can hold.
- Follow-through setup: U.S. yields fall, risk sentiment turns defensive, or the market reprices the Fed. In this case, intervention aligns with fundamentals and the down move can extend.
- Mean reversion setup: U.S. yields stay bid, the rate differential stays wide, and dips attract hedging and carry demand. In this case, USD/JPY often rebounds over days to weeks.
- Key tell: how USD/JPY trades after the first 24 to 48 hours. If it cannot regain broken levels despite higher U.S. yields, the intervention likely changed positioning. If it reclaims levels quickly, it likely only reset the trend.
| After-intervention check | What you watch | What it implies |
|---|---|---|
| U.S. yields | 2Y, 5Y, real yields direction | Falling yields supports JPY strength, rising yields invites rebound |
| Volatility | 1W implied, realized range | Sticky vol keeps USD/JPY two way, falling vol restores trend trading |
| Positioning and flows | Dip buying, exporter selling, hedging demand | Persistent dip buying weakens intervention impact |
| Rhetoric follow-up | MoF comment frequency and tone | Escalation supports downside, silence often invites retracement |
Practical risk management around intervention headlines
Assume headline risk when USD/JPY trends in a straight line. You manage intervention risk the same way you manage event risk, you cut leverage and define exits.
- Size down carry trades. Intervention creates gap risk. Small position size beats tight stops in fast markets.
- Use hard invalidation points. Place stops where your trade idea breaks, not where you feel less pain. Expect slippage in shock moves.
- Avoid holding full risk through thin liquidity. Intervention often hits when liquidity drops. Reduce exposure into Tokyo morning and after major U.S. data.
- Prefer options for defined risk. If you need upside USD exposure, consider structures that cap loss when USD/JPY drops hard. Watch how implied volatility changes your breakeven.
- Separate trend from shock. If you trade the rate differential, plan for violent counter moves. Build entries on pullbacks, not at stretched highs.
- Track rates first. If the U.S. Japan rate spread keeps widening, intervention often turns into a dip, not a reversal. Review your rate driver framework using how interest rates affect currency pairs.
Market microstructure: positioning, options, and technical catalysts
CFTC positioning, when “crowded” starts to matter
CFTC data shows how leveraged funds and asset managers sit in JPY futures. Use it as a crowding gauge, not a timing tool.
- Track the change, not the level. Fast moves in net JPY shorts often line up with late-stage USD/JPY squeezes.
- Watch extremes for asymmetric risk. When positioning hits multi-month extremes, bad news for the dominant trade can move price more than good news.
- Use it to size risk. Crowding raises the chance of sharp pullbacks. Tighten leverage. Demand better entry prices.
- Pair it with catalysts. Positioning matters most into CPI, payrolls, FOMC, BoJ, and MoF headlines. Plan around your economic calendar for forex.
Options cues, risk reversals, implied vol, and skew
Options tell you how traders price tail risk. That helps you judge dip risk and intervention risk.
- Implied volatility. Rising implied vol means wider expected ranges. Your breakeven gets harder. Your stop placement must adapt.
- Risk reversals. A 25-delta risk reversal compares demand for USD calls versus USD puts. A higher USD-call premium signals traders pay up for upside protection in USD/JPY. A flip lower signals demand for downside protection.
- Skew shifts can lead spot. If spot grinds higher but USD-call premium stops rising, upside momentum can fade. If downside puts get bid fast, traders fear a sharp drop.
- Event pricing. If implied vol rises into a known event, you can expect larger swings. If vol stays muted, the market expects continuity or expects official smoothing.
Gamma, barriers, and expiries, why price can stick
Large option strikes can pin spot near a level. Dealer hedging can dampen moves near expiry, then release price after the cut.
- Gamma near big strikes. If dealers run high gamma, they buy dips and sell rallies. Spot can chop and revert around the strike.
- Expiry timing. The effect peaks into major FX option expiries. After expiry, the pin can disappear and trend can resume fast.
- Barrier lore. Some levels attract attention because traders believe barriers exist there. Treat this as a flow clue, not a fact.
- How to use it. If your macro view stays intact, wait for expiry-related pullbacks to build entries. If you chase into a pinned level, you often pay the worst price.
Liquidity and stop runs, what happens at round numbers
USD/JPY concentrates orders near round numbers and prior highs and lows. Liquidity thins during roll, holidays, and around headlines. That mix fuels stop runs.
- Round numbers act like magnets. Dealers and algorithms cluster orders at 150.00, 155.00, 160.00, and similar levels.
- Stop runs follow structure. Price pushes through a known level, triggers stops, then snaps back once the forced flow ends.
- Intervention amplifies the pattern. Official selling can punch through levels, then mean-revert if the rate spread still dominates.
- Your risk control. Place stops where the idea breaks, not where others place stops. Reduce size when liquidity drops.
Blend technicals with fundamentals without double-counting
Use microstructure and technicals to time entries and manage risk. Use fundamentals to define direction. Keep them separate.
- Start with the driver. If the U.S. Japan rate spread widens, treat dips as buyable until the rate story changes.
- Use levels as execution tools. Prior highs, VWAP bands, and round numbers help you pick pullbacks and place stops.
- Avoid stacked signals. Do not count “rates bullish” and “uptrend bullish” as two independent reasons. They often describe the same force.
- Let options guide your expectations. If implied vol jumps and skew prices downside fear, tighten targets and widen time horizons. Do not assume a clean trend day.
| Input | What it tells you | How to use it |
|---|---|---|
| CFTC positioning | Crowding and unwind risk | Scale risk down at extremes, wait for better entries |
| Implied volatility | Expected range and stop stress | Adjust position size, stops, and holding period |
| Risk reversals and skew | Which tail risk traders pay for | Respect crash risk when downside puts get bid |
| Expiries and big strikes | Pinning risk and post-cut release | Avoid chasing into the strike, plan around the cut |
| Round numbers and stops | Liquidity pockets and stop-run zones | Place stops beyond the crowd, trade smaller in thin liquidity |
Seasonality and recurring calendar effects
Japan fiscal year-end, March flows and repatriation
Japan’s fiscal year ends in March. Many firms and investors set hedges, book gains, and adjust overseas holdings around that cutoff.
- Repatriation bias: Japanese exporters and investors may bring funds home, which can support JPY and pressure USD/JPY lower.
- Hedge adjustment: Corporates may reduce or roll USD hedges tied to invoices and balance-sheet positions. That can shift demand between spot and forwards.
- Timing matters: The heaviest flow risk often clusters in the second half of March and the final week, then fades after the new fiscal year starts in April.
- How you trade it: Respect sudden, flow-driven dips. Use smaller size near the fix and into Tokyo hours if price action turns one-way without new macro news.
U.S. tax season and quarter-end rebalancing
Calendar rebalancing can move USD/JPY even when rates and data stay quiet. You see it most at quarter-end, and sometimes around U.S. tax payments.
- Quarter-end hedging: Real money and pension portfolios rebalance equity and bond exposure. That changes FX hedge ratios, which can create large, price-insensitive flow.
- Cross-asset link: Strong U.S. equity quarters can trigger hedge adds or trims. That can push USD/JPY in a way that conflicts with the day’s yield move.
- Fix concentration: WM/Reuters fix windows often carry the flow. You can get fast moves, then mean reversion once the order is done.
- How you trade it: Mark quarter-end weeks on your calendar. Reduce reliance on intraday signals near the fix. Treat late-month breakouts with caution unless rates and risk confirm.
Holiday liquidity and exaggerated moves
Thin liquidity turns normal orders into large candles. Holidays in Japan, the U.S., and the U.K. matter because they remove key liquidity centers.
- Wider spreads: Dealers quote wider and pull size. Your stops sit closer to the market than you think.
- Air pockets: Price can gap through levels. Round numbers and recent highs and lows break more easily.
- False signals: A move on a holiday session often fails when full liquidity returns. Do not treat it like a clean trend day.
- How you trade it: Trade smaller, use wider stops, and take profits faster. If you need confirmation, wait for normal Tokyo and London overlap before you commit.
| Calendar effect | Typical window | What to watch | Practical response |
|---|---|---|---|
| Japan fiscal year-end | Mid to late March | JPY-supporting repatriation, hedge rolls, fix-related spikes | Lower size into Tokyo, respect one-way dips, avoid chasing late-month breaks |
| Quarter-end rebalancing | Last 3 to 5 business days of Mar, Jun, Sep, Dec | Flow that overrides rates, sharp fix moves, quick reversals | De-emphasize intraday signals near fixes, wait for post-fix direction |
| Holiday liquidity | Japan Golden Week, U.S. holidays, year-end week | Spread widening, stop-runs, gap risk | Wider stops, faster exits, avoid large positions in thin sessions |
If you trade these windows as flow events, your read improves. Combine the calendar with yields, risk tone, and positioning, then apply the same discipline you use in fundamental analysis in forex.
A practical framework: how to analyze what moves USD/JPY right now
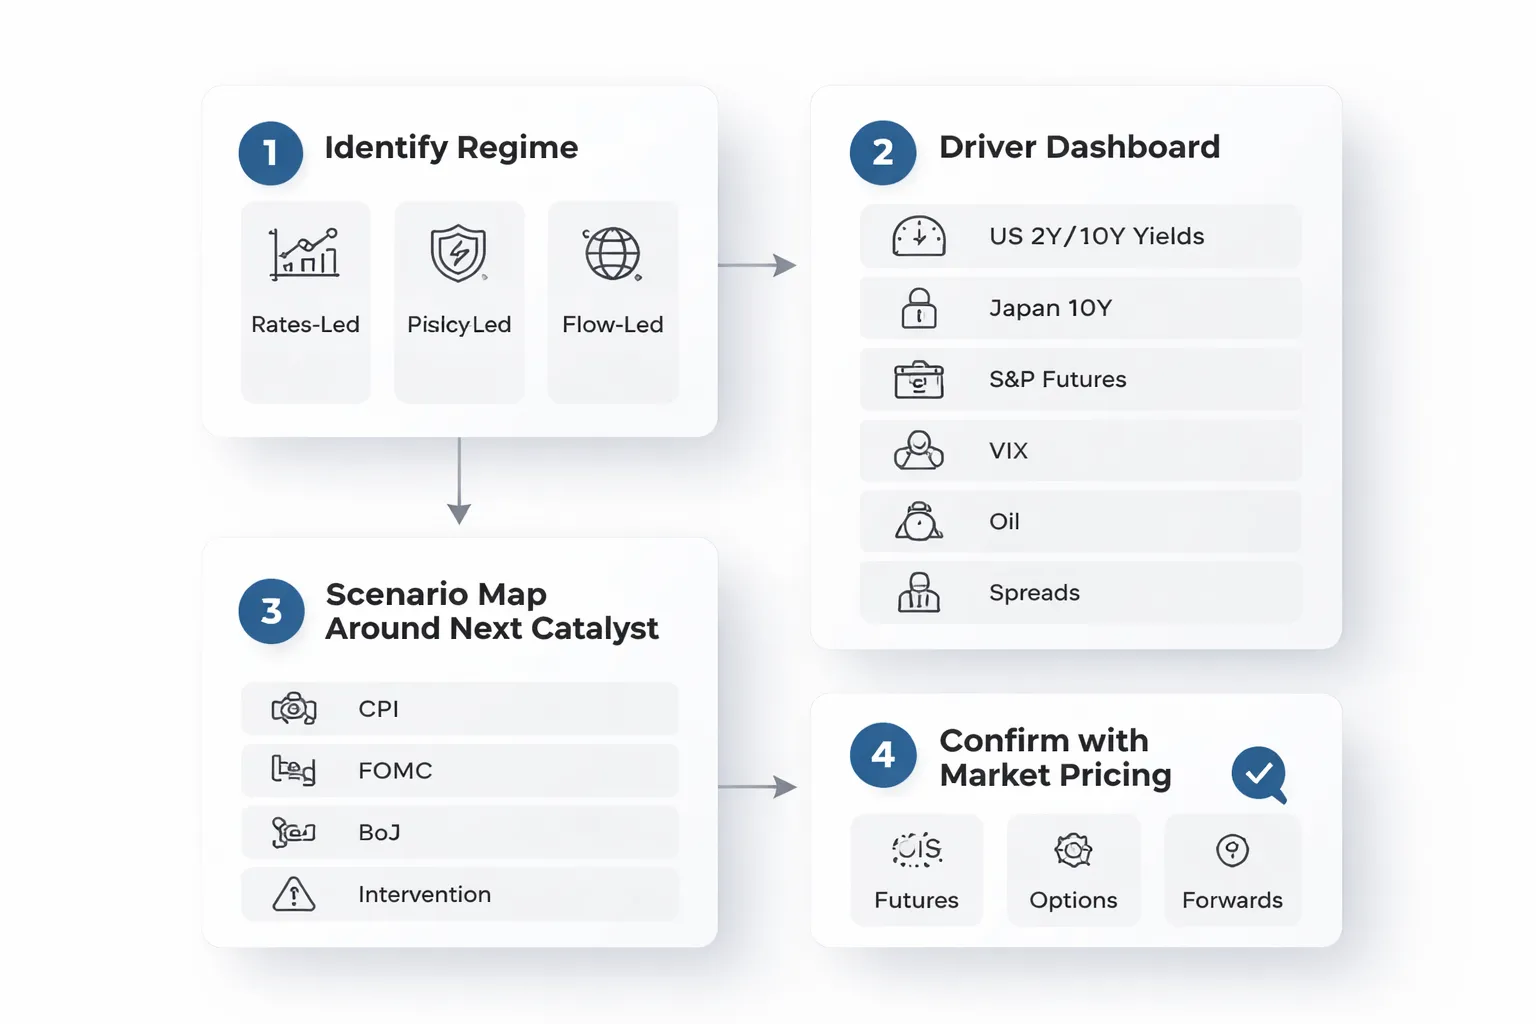
Step 1: Identify the active regime
Start with one job. Name what drives USD/JPY today. Pick one regime and trade it until it changes.
- Rates-led: U.S. yields move first, USD/JPY follows. Focus on U.S. data, Fed speakers, Treasury auctions, and the 2-year yield.
- Risk-led: Equities and volatility lead. Risk-off often supports JPY and pressures USD/JPY. Risk-on often does the opposite.
- Policy-led: BoJ and Japan MoF headlines dominate. Watch for yield curve control signals, inflation tone, and intervention language.
- Flow-led: Fixings, hedging, repatriation, month-end, and holiday liquidity drive price. Expect fast spikes and weak follow-through.
Do not mix regimes in your thesis. If you cannot name the regime, you have no edge.
Step 2: Build a simple driver dashboard
Track a small set of inputs. Update them before London, before New York, and after key releases.
| Driver | What to watch | How it hits USD/JPY |
|---|---|---|
| Yields | U.S. 2-year, U.S. 10-year, Japan 10-year, U.S. real yields | Wider U.S. minus Japan yield gap often supports USD/JPY. Narrowing often pressures it. |
| Equities | S&P 500 futures, Nikkei, breadth | Risk-off can strengthen JPY. Risk-on can weaken it, especially when carry demand rises. |
| Volatility | VIX, FX implied vol for USD/JPY | Vol spikes often push investors to cut leverage, which can support JPY and cap USD/JPY. |
| Oil | Brent or WTI and the daily trend | Higher oil can worsen Japan’s terms of trade and lean against JPY. The effect varies with risk tone. |
| Spreads | Swap points, cross-currency basis, funding stress indicators | Funding stress can trigger hedging and repatriation flows, which can support JPY. |
Keep it mechanical. If USD/JPY rises while the yield gap narrows and risk turns off, assume flows or policy risk. Then cut size and wait for confirmation.
Step 3: Map scenarios around the next major catalyst
Pick the next event that can reset pricing. Build three scenarios. Define what must move first.
- U.S. CPI, jobs, retail sales: Hot data can lift front-end yields and support USD/JPY. Soft data can do the opposite. Watch the 2-year yield first.
- FOMC: Use the dot plot, press conference tone, and the reaction in 2-year yields. Price action that fades fast often signals positioning, not a new trend.
- BoJ meeting: Watch any change in guidance, bond buying operations, and language on wages and inflation. A shift toward normalization can strengthen JPY fast.
- Japan MoF intervention risk: Watch spot speed, not just level. Fast one-way moves raise intervention risk and can flip the regime to policy-led.
Write your triggers. If X happens, you do Y. If the market does Z instead, you exit.
Step 4: Confirm with market pricing
Check what traders already priced. Trade the gap between pricing and your scenario.
- OIS and rate futures: Use them to quantify expected Fed and BoJ paths. Focus on changes after data, not the absolute level.
- Options: Track implied volatility and risk reversals. A stronger JPY bid in risk reversals often signals demand for downside USD/JPY protection.
- Forwards and swap points: Use them to gauge carry. When carry looks attractive but spot fails to rise, you often face risk or policy constraints.
If spot and pricing disagree, respect pricing. It often leads spot during regime shifts.
Common mistakes
- Overfitting one driver: You anchor on yields, then ignore that risk took control. You keep buying dips while vol rises and equities break.
- Ignoring correlation breaks: USD/JPY can decouple from yields around BoJ shifts, intervention risk, or thin liquidity. When correlations flip, reduce size and reset your framework.
- Chasing headlines without a regime: You react to every print. You lose the signal.
If you want the same process applied to another major pair, use this framework alongside our guide on what moves GBP/USD.
Trading and risk considerations (informational, not advice)

Choosing instruments: spot, forwards, ETFs, futures, and options
Match the instrument to your goal, time horizon, and constraints. USD/JPY trades fast. Funding and liquidity details matter.
- Spot FX (CFD or margin spot). Tight spreads in active hours. 24 hour access. You face rollover and broker execution risk. You can get slipped on news.
- Forwards and FX swaps. You trade the rate differential through the forward points. Useful for hedging known cash flows. Less flexible for small size. Pricing depends on credit lines and dealer terms.
- Futures (CME JPY futures). Central clearing and transparent prints. Defined contract specs. You trade via margin. You must manage roll dates and session liquidity gaps.
- ETFs. Simple access inside equity accounts. You take equity market hours and tracking error. Some products embed carry costs. Liquidity varies by ticker and time of day.
- Options. You can define downside with premium. You can express views on volatility and event risk. USD/JPY option markets price intervention risk and policy meetings. Implied volatility can jump before key events.
Volatility and sizing: why USD/JPY can gap on headlines
USD/JPY can reprice in seconds. You need a sizing rule that assumes slippage. Headlines can move the pair when liquidity thins.
- BoJ headlines. Yield curve control tweaks, bond buying changes, and guidance shifts can break the yield link. Moves can overshoot and mean revert fast.
- Intervention risk. Japan can act without warning. The market can gap. Stops do not guarantee fills at your level.
- U.S. data surprises. CPI, payrolls, and inflation expectations can move front end yields. USD/JPY often follows, then chops.
- Session transitions. Liquidity changes around Tokyo open, London open, and the U.S. morning. Spreads can widen in off hours.
Keep sizing tied to current volatility, not your conviction. Use smaller size into known event windows. Assume worse fills when you plan risk.
Pros and cons of trading USD/JPY vs other major pairs
- Pros
- Clear macro drivers. Rate differentials and risk sentiment often lead.
- Deep liquidity in core hours. Tight pricing when markets run normally.
- Event sensitivity can create clean moves after major data and policy signals.
- Cons
- Higher tail risk. Intervention and BoJ regime shifts can override models.
- Correlation breaks. USD/JPY can ignore yields when policy credibility changes.
- Gap risk in thin liquidity. Stops can slip more than you expect.
If you want a broader fundamentals primer, read our guide to fundamental analysis in forex.
Risk checklist for high impact days (Fed, BoJ, CPI, NFP, intervention risk)
- Define the regime. Are you trading rate differentials, risk sentiment, or a policy shift story. Do not mix them.
- Map the calendar. Note Fed and BoJ decision times, pressers, minutes, CPI, NFP, and key Treasury auctions.
- Mark liquidity windows. Expect worse execution in pre release minutes, session handoffs, and holidays.
- Know your invalidation level. Place exits where the thesis breaks, not where you feel pain.
- Plan for slippage. Stress test with wider spreads and gaps. Reduce leverage into events.
- Watch rates and risk proxies. Track U.S. front end yields, real yields, equity futures, and volatility indices. Confirm your driver still leads.
- Monitor intervention signals. Track sharp one way moves, official commentary, and price levels the market fixates on. Do not assume you get a warning.
- Set rules for correlation breaks. If USD/JPY stops responding to yields, cut size and pause. Rebuild the model with fresh data.
- Limit exposure across products. Spot, futures, and options can stack the same risk. Count total USD/JPY delta.
FAQ
What is the main driver of USD/JPY day to day?
Rate differentials. Watch the U.S. 2 year yield versus Japan. When the spread widens, USD/JPY tends to rise. When it narrows, USD/JPY tends to fall. Confirm with price action and liquidity conditions.
Which yields matter most for USD/JPY, 2 year or 10 year?
The 2 year often leads because it tracks policy expectations. The 10 year can matter in risk swings and curve moves. Track both. If USD/JPY follows one and ignores the other, treat it as regime information.
How does Bank of Japan policy affect USD/JPY?
BOJ guidance shifts Japanese yields and funding costs. Changes to YCC, bond buying, or language on inflation can move JPY fast. You often see the move first in JGB yields, then in USD/JPY, then in crosses.
How does the Fed move USD/JPY?
Fed pricing moves the front end of the U.S. curve. Watch Fed funds futures, OIS, and U.S. 2 year yields around CPI, jobs, and FOMC. A hawkish repricing usually lifts USD/JPY. A dovish repricing usually weighs.
What does risk sentiment do to USD/JPY?
Risk off tends to support JPY, risk on tends to weaken it. Use S&P 500 futures, VIX, and credit spreads as quick checks. If equities sell off and USD/JPY still rises, yields usually explain it.
Does USD/JPY track the dollar index?
Sometimes. DXY can help when USD moves broad based. In many periods, USD/JPY trades more like a rates pair than a USD basket proxy. If DXY rallies but USD/JPY lags, check Japan specific news and yield spreads.
How do Japanese intervention risks show up?
You see sharp one way drops, heavy volume, and official warnings about excessive moves. Levels matter because the market anchors to round numbers. Do not assume you get a warning. Cut leverage when price action turns disorderly.
What data releases move USD/JPY the most?
U.S. CPI, payrolls, retail sales, and ISM, plus BOJ decisions and Tokyo CPI. U.S. data matters most when it shifts the expected Fed path. Japan data matters most when it changes BOJ credibility on normalization.
Why does USD/JPY sometimes ignore yields?
Flow can dominate. Think month end hedging, repatriation, options hedging, or intervention fear. Liquidity can also distort price. When correlation breaks, reduce size, pause, and rebuild your model with fresh sample periods.
How do options affect USD/JPY?
Large expiries can pin spot near strikes. Dealer hedging can amplify or dampen moves as spot nears key levels. Watch 10am New York cut timing, 1 week implied vol, and risk reversals for skew toward calls or puts.
How do you track USD/JPY catalysts efficiently?
Build a short list. Yield spread, S&P futures, VIX, Fed pricing, BOJ headlines, and options expiries. Use an economic calendar to plan high vol windows. See How to Use the Forex Economic Calendar.
Conclusion
Conclusion
USD/JPY moves when U.S. yields and Japan policy expectations change. Risk sentiment can speed up or reverse that move. Options positioning can add short term noise near large expiries and strikes.
Keep your process tight. Track the U.S. Japan yield spread first, then Fed and BOJ pricing and headlines. Confirm the tone with S&P futures and VIX. Check the options board for 10am New York cut levels, 1 week implied vol, and risk reversals before you take a trade.
Your best edge comes from timing. Plan around data and central bank events, then reduce size or widen stops when the calendar flags a high vol window. Use the economic calendar to map the week and avoid surprises.
-
How Interest Rates Affect Currency Pairs (With Real Examples)
4 months ago -
Fundamental Analysis in Forex Explained (What Actually Moves Prices)
4 months ago -
Inflation and Exchange Rates Explained (Why Currencies Rise or Fall)
4 months ago -
How to Trade Forex News (NFP, CPI, FOMC) Without Getting Wrecked
4 months ago -
Economic Calendar for Forex: How to Use It (Step-by-Step)
4 months ago
-
- U.S. CPI and PCE, inflation surprises and real yield repricing
- U.S. labor data, NFP, wages, and the growth vs inflation read
- U.S. activity data, ISM and retail sales, recession risk and the yield curve
- Japan CPI and wage negotiations, Shunto as BoJ catalysts
- Event calendar prioritization, what matters in different regimes
-
- What is the main driver of USD/JPY day to day?
- Which yields matter most for USD/JPY, 2 year or 10 year?
- How does Bank of Japan policy affect USD/JPY?
- How does the Fed move USD/JPY?
- What does risk sentiment do to USD/JPY?
- Does USD/JPY track the dollar index?
- How do Japanese intervention risks show up?
- What data releases move USD/JPY the most?
- Why does USD/JPY sometimes ignore yields?
- How do options affect USD/JPY?
- How do you track USD/JPY catalysts efficiently?
-
How to Place a Forex Trade Step by Step (Your First Trade Explained)
2 months ago -
Forex Trading vs Crypto Trading: Which Market Is Better for Beginners?
2 months ago -
Forex Lot Size Calculator: How to Use It to Size Trades Correctly
3 months ago -
How to Calculate Position Size in Forex (Position Sizing Formula + Examples)
3 months ago -
Forex Leverage Explained: How It Works, Pros, Cons & Examples
3 months ago
-
Is Forex Trading Legal in the United States? Rules, Regulators & What to Know
4 months ago -
Forex Market Hours & Trading Sessions Explained (Best Times to Trade)
4 months ago -
Forex Trading Platforms Comparison: MetaTrader vs cTrader vs TradingView
4 months ago -
Forex Leverage Explained: How It Works, Pros, Cons & Examples
3 months ago -
What Is a Lot Size in Forex? Lot Types + Quick Examples
4 months ago