Forex Correlation Pairs List: How to Use Correlations in Real Trading

Forex pairs rarely move alone. Correlation tells you how two pairs move together over a set time. You use it to spot hidden risk, avoid doubling the same trade, and build simple hedges.
In this guide, you will learn what positive and negative correlation mean, how to read a correlation pairs list, and what timeframes and lookback periods change the numbers. You will also learn clear rules for using correlation in real trading, position sizing, and portfolio checks.
You will link correlation to execution, so you can plan entries and exits with cleaner exposure and better control of drawdowns. Pair it with your risk-reward ratio rules, then validate the full basket before you click buy or sell.
Key Takeaways
- In het kort: Correlation measures how two pairs move together, from -1 to +1.
- In het kort: Treat +0.80 to +1.00 as strongly positive, -0.80 to -1.00 as strongly negative, and -0.20 to +0.20 as near zero.
- In het kort: Your timeframe and lookback window change the result, recalc often.
- In het kort: Use correlation to manage exposure, not to predict price.
- In het kort: Avoid stacking the same risk across multiple pairs, size positions as one combined bet.
- In het kort: Use negative correlation for hedging, but expect it to fail in stress markets.
- In het kort: Validate the full basket before entry, then track correlation drift during the trade.
Key takeaways:
- Correlation is a portfolio tool. Use it to control total USD, EUR, JPY, GBP, CHF, AUD, NZD, and CAD exposure.
- Set practical thresholds in your plan. Example, treat any pair combination above +0.80 as one position for risk.
- Check correlation on the timeframe you trade. A day trader and a swing trader can see different numbers for the same pairs.
- Use rolling windows. Compare 20, 60, and 120 trading days, then trade the regime you see now.
- Do not add trades because correlation looks “diversified”. Confirm the drivers, shared base currency, quote currency, and risk-on behavior.
- When you hold multiple correlated trades, cut your per-trade risk. Keep your total basket risk fixed.
- Negative correlation helps for hedges and offset baskets. It does not guarantee drawdown control during news and risk events.
- Backtest your correlation rules with your full workflow, entries, exits, and sizing, then document what holds up. Use backtest a forex strategy to validate the process.
What forex correlation means (and why it matters in real trading)
What correlation means in forex
Forex correlation measures how two currency pairs move relative to each other.
Most traders use the Pearson correlation coefficient on returns over a set lookback window. The result sits between -1.00 and +1.00.
- +1.00, the pairs move in the same direction with similar timing.
- -1.00, the pairs move in opposite directions with similar timing.
- 0.00, the moves show no consistent relationship.
You use correlation to control exposure. If you stack trades that behave like one trade, your risk concentrates. If you combine trades that offset, your net swings can shrink, until the relationship breaks.
Positive, negative, and near-zero relationships
Positive correlation means your trades reinforce each other.
- You buy EURUSD and you buy GBPUSD. If USD weakens, both can rise together.
- You short USDJPY and you short USDCHF. If USD strengthens broadly, both can move against you at the same time.
Negative correlation means your trades tend to offset.
- You buy EURUSD and you sell USDCHF. Both often express a similar USD view, but in opposite quote terms.
- You buy AUDUSD and you sell USDCAD. Both often lean on commodity and USD flows, but the offset varies by regime.
Near-zero correlation means the pairs do not help or hurt each other in a stable way.
- You can treat them closer to independent bets, but only for the specific lookback and market regime you measured.
Correlation vs causation
Correlation does not tell you why the market moves. It tells you how two return series moved together in the past window.
- Correlation can help you spot duplicated exposure, so you do not size as if trades are independent.
- Correlation can help you build baskets, so your combined position matches your intended risk.
- Correlation cannot predict the next move, or guarantee a hedge will hold during a shock.
- Correlation cannot replace a trade plan. You still need entries, stops, and targets, plus a clear method to set take profit levels.
Use correlation as a risk tool, not a signal.
Why correlations change
Correlations shift because the drivers behind price change.
- Volatility regimes. In calm markets, pairs can trade off idiosyncratic factors. In high volatility, risk-on and risk-off flows can dominate, and many pairs start moving together.
- Macro narratives. Central bank divergence, yield spreads, growth scares, and commodity cycles can tighten or flip relationships. A pair can move from rate-driven to risk-driven within weeks.
- Liquidity and market hours. Relationships can look stable in London and New York, then weaken in thin sessions. Month-end flows and holidays also distort short windows.
Do not treat any correlation number as permanent. Measure it on the timeframe you trade, update it on a schedule, and size your basket as if the relationship can fail.
Forex correlation pairs list: the core tables traders actually use
These are the correlation tables traders check in real time. Use them as a shortlist. Then verify with your own rolling correlation on your trading timeframe.
Most commonly watched positively correlated pairs
Positive correlation means both pairs tend to move in the same direction. It often comes from shared base or quote exposure, or the same risk theme.
| Pair A | Pair B | Typical driver | What you see in live markets | How traders use it |
|---|---|---|---|---|
| EUR/USD | GBP/USD | Broad USD moves, Europe risk sentiment | Both rise when USD sells off. Both drop on USD strength. | Reduce duplicate USD exposure, or use one as a confirmation check. |
| AUD/USD | NZD/USD | Risk-on flows, commodity China sensitivity | Often rally and dip together. AUD usually moves first, NZD follows. | Pair selection, avoid doubling the same risk trade. |
| EUR/JPY | GBP/JPY | Carry and risk sentiment | Both jump in risk-on sessions. Both sink in equity stress. | Basket sizing, one position often covers the theme. |
| USD/CHF | USD/JPY | USD leg dominance, safe-haven demand at times | Can trend together when the USD leg drives. Can diverge in stress when CHF and JPY behave differently. | Cross-check USD trend strength, avoid stacking similar USD longs. |
| EUR/AUD | EUR/NZD | EUR leg dominance | Moves often track each other. AUD side may lead on commodities. | Hedge selection, choose the cleaner chart. |
- Rule: strong positive correlation increases your effective position size if you trade both.
- Practice: if you want two entries, split size across the two pairs instead of doubling risk.
Most commonly watched negatively correlated pairs
Negative correlation means one pair tends to rise while the other falls. This often happens when they share one currency in opposite positions, or one acts as a proxy hedge.
| Pair A | Pair B | Typical driver | What you see in live markets | How traders use it |
|---|---|---|---|---|
| EUR/USD | USD/CHF | USD on opposite sides, EUR and CHF both Europe-linked | When EUR/USD rallies, USD/CHF often falls. Relationship weakens when CHF safe-haven flows dominate. | Quick hedge proxy, or confirmation that a USD move has breadth. |
| GBP/USD | USD/CHF | USD on opposite sides | Often inverse on clean USD days. Can decouple on UK-specific news. | Filter out false USD signals caused by single-country headlines. |
| AUD/USD | USD/JPY | Risk-on vs defensive USD JPY positioning | In risk-on, AUD/USD tends to rise while USD/JPY often rises too, so this can flip. In risk-off, AUD/USD drops while JPY strengthens, pushing USD/JPY down. | Use as a regime check, do not assume it stays inverse. |
| USD/CAD | CAD/JPY | CAD strength vs JPY risk filter | When CAD strengthens broadly, USD/CAD falls and CAD/JPY rises. | Separate CAD theme from USD theme. |
- Rule: negative correlation is not a free hedge. In a shock, both legs can move against you through spreads and gaps.
- Practice: hedge with clear invalidation points and hard stops. Use order types that match your plan. order types matter most during fast moves.
Major pairs vs crosses, where correlations tend to be stronger or weaker
- Majors often show cleaner correlation clusters. EUR/USD, GBP/USD, AUD/USD, NZD/USD often line up on broad USD days.
- Crosses can tighten correlation inside a single theme. EUR/JPY and GBP/JPY can track each other when risk drives JPY flows.
- Crosses also break faster. One local catalyst can dominate, like BoE news in GBP/JPY or RBA tone in AUD/JPY.
- Shared base or quote makes correlation more stable. AUD/USD and NZD/USD share USD quote and similar macro links.
- Two pairs can look correlated but still add risk. If both depend on the same event risk, your drawdown clusters.
Risk-on, risk-off groupings traders track
These groupings help you read whether the market trades rate-driven or risk-driven. They also help you avoid building the same trade four times.
| Cluster | Currencies | What tends to happen | Pairs traders watch | Practical use |
|---|---|---|---|---|
| USD driver cluster | USD | When USD leads, many majors move together against it. | EUR/USD, GBP/USD, AUD/USD, NZD/USD, USD/JPY | Check if multiple pairs confirm the same USD move before sizing up. |
| Safe haven cluster | JPY, CHF | In stress, JPY and CHF often strengthen. In calm markets, they can weaken as carry returns. | USD/JPY, CHF/JPY, USD/CHF, EUR/CHF | Detect risk-off, tighten correlation assumptions on carry pairs. |
| Risk and commodity FX cluster | AUD, NZD, CAD | Often strengthen in risk-on and weaken in risk-off. CAD can follow oil and North America flows. | AUD/USD, NZD/USD, AUD/JPY, NZD/JPY, USD/CAD, CAD/JPY | Pick one or two expressions of the theme, do not stack all of them. |
| Europe block sensitivity | EUR, GBP, CHF | Regional risk and rates can pull these together, then split them on local central bank signals. | EUR/USD, GBP/USD, EUR/GBP, EUR/CHF, GBP/CHF | Use EUR/GBP to separate EUR strength from GBP strength. |
- Execution tip: if your basket includes AUD/USD, NZD/USD, and AUD/JPY, treat it like one large risk-on position.
- Risk tip: cap total risk per theme, not per trade. Correlation turns separate trades into one outcome.
How to read a correlation table correctly
Understand the correlation scale (-1 to +1)
A correlation table shows how two pairs move together over a set time window. The coefficient runs from -1 to +1.
- +1.00, they move in the same direction almost point for point.
- +0.70 to +0.90, strong positive link. Treat them as one theme for risk.
- +0.30 to +0.70, weak to moderate link. It can tighten in stress and loosen in calm markets.
- -0.30 to +0.30, low link. You get limited diversification value.
- -0.70 to -0.90, strong inverse link. One tends to rise when the other falls.
- -1.00, near perfect inverse movement, rare in live markets for long.
Use simple rules. Above +0.80, reduce position size across the set. Below -0.80, avoid holding both as “hedges” unless you accept basis risk and spread costs.
Check the lookback period before you trust the number
Correlation changes with time. Your table usually offers multiple lookbacks. Read them from short to long.
- 1 week, sensitive to the current catalyst. It reacts fast to central bank headlines and risk shocks.
- 1 month, a working baseline for swing trades. It smooths noise but still adapts.
- 3 months, the regime view. It shows the dominant macro driver, but it can lag when conditions flip.
Action rule. If 1 week and 3 months disagree, you have a transition. Cut exposure or trade smaller until the story aligns.
Pearson vs Spearman, know what your tool measures
Most retail correlation tables use Pearson correlation on returns. Pearson measures linear co-movement. It works well when moves scale together.
- Pearson, best for day to day co-movement and risk aggregation. It can miss relationships that show up only during extremes.
- Spearman, rank-based. It checks whether pairs move in the same direction in the same order, even if the size differs.
If your tool does not state the type, assume Pearson. Do not treat the number as a guarantee. Treat it as a sizing input.
Common pitfalls that blow up “diversification”
- Overlapping USD exposure. EUR/USD, GBP/USD, AUD/USD, and NZD/USD can act like one USD short. Your “four trades” become one bet. Cap total risk per USD theme.
- Misreading inverse quotes. EUR/USD and USD/CHF often show a strong negative correlation. That does not mean you have a perfect hedge. Different central banks, different safe-haven flows, and different volatility profiles break the link.
- Mixing base and quote logic. A positive correlation does not mean the same currency is strong in both pairs. Always translate the move into base versus quote before you decide exposure.
Use correlation as a risk map, not a signal. If you need a clean framework for building positions and sizing risk, follow this beginner roadmap first.
How to build your own correlation pairs list (step-by-step)
Choosing the dataset, timeframe, session filters, and data source
Your correlation list is only as good as your input data. Set your rules first, then keep them consistent.
- Pick your timeframe to match your holding period. Day trading, use M5 to M15 returns. Intraday swing, use H1 returns. Swing and position, use H4 to D1 returns.
- Use a fixed lookback window. Common windows are 100, 200, or 300 candles. Short windows react faster. Long windows stay stable but lag.
- Control the session. If you trade London and New York, calculate correlations using only those hours. If you trade Asia, use Asia hours. Session mixing distorts results when one pair moves in a different time block.
- Decide what price you will use. Close-to-close is simplest and consistent across feeds. Avoid mixing bid and ask series.
- Know the feed limits. Broker feeds differ by spread rules, rollover, and small quote differences. Independent feeds reduce broker noise. If you execute with a broker feed, build your list from the same broker data so your tracking matches what you trade.
- Use clean symbols. Avoid exotic crosses at first. Start with majors and liquid crosses so price discovery stays tight.
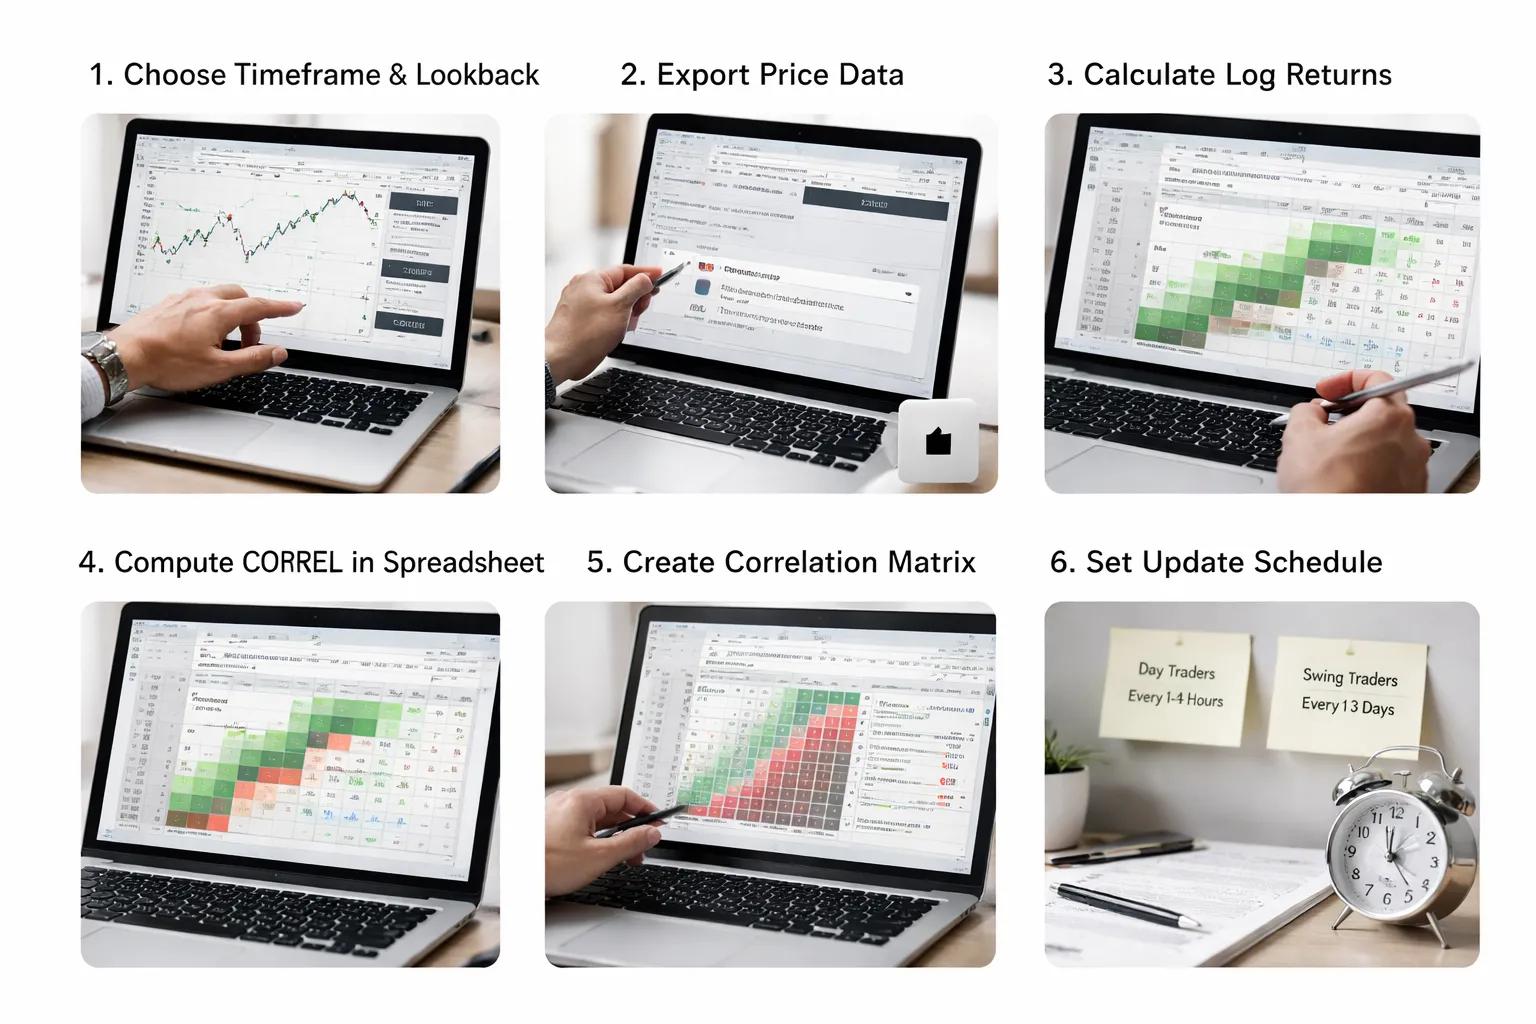
Simple spreadsheet method (returns-based) for DIY correlation
Build correlations on returns, not raw prices. Price levels can trend for months. Returns keep the math honest.
- Step 1. Choose pairs. Start with 8 to 14 pairs. Example set, EURUSD, GBPUSD, AUDUSD, NZDUSD, USDJPY, USDCAD, USDCHF, EURJPY, GBPJPY, EURGBP.
- Step 2. Export the same timeframe for every pair. Use the same candle size and the same number of rows. Keep timestamps aligned.
- Step 3. Compute returns. Use log returns or simple percent returns. Log returns handle large moves better. In a spreadsheet, log return per row is LN(Close_t / Close_t-1).
- Step 4. Run correlation on the returns columns. Use your spreadsheet CORREL(range1, range2) on matching rows.
- Step 5. Build a matrix. Put pairs on rows and columns. Fill the grid with correlation values. Use conditional formatting to highlight strong links.
- Step 6. Set action thresholds. Track three buckets. Strong, |r| ≥ 0.80. Medium, 0.50 to 0.79. Weak, below 0.50. Treat strong links as shared risk.
- Step 7. Translate exposure. Positive r means the pairs tend to move together, but you still need base versus quote logic. Example, EURUSD and GBPUSD often show positive r, both price up means USD down. USDCAD tends to flip sign versus those because USD is the base.
| Setting | Practical default | Why it works |
|---|---|---|
| Return type | Log returns | Stable across volatility regimes |
| Lookback | 200 candles | Balances stability and responsiveness |
| Timeframe | Match your trade chart | Keeps correlation tied to your holding period |
| Threshold | |r| ≥ 0.80 | Flags pairs that can double your risk |
Platform workflows (TradingView, MT4, MT5) to monitor correlations efficiently
You want a workflow that takes seconds, not an extra analysis session.
- TradingView watchlist workflow. Build a dedicated watchlist called “Correlation Map.” Add your core pairs plus the crosses tied to your main exposures. Use the same timeframe on all charts. Flip through charts fast, then confirm if moves match direction and speed.
- TradingView layout workflow. Use a 4 to 8 chart layout. Lock symbol change to one pane so you can compare a primary pair with its closest positive and negative partners. Keep one pane on D1 or H4 to spot regime shifts.
- MT4 workflow. Use profiles. Create one profile per currency block, USD block, JPY block, commodity block. Add pairs to Market Watch, then cycle charts with hotkeys. Keep your correlation matrix in a separate spreadsheet and refresh it on schedule.
- MT5 workflow. Use Symbols, Market Watch sets, and templates. Keep a template with identical indicators and scale settings. Compare moves with “Tile Windows” for side-by-side scans. Export history from MT5 for your spreadsheet update.
- Execution rule. When two pairs sit in the strong bucket, treat them like one position for risk. If you still take both, cut size. If you need help structuring exits, use this guide on stop loss vs take profit.
How often to refresh (a practical updating schedule)
Correlations drift. Your refresh schedule should match how long you hold trades.
- Day traders. Recalculate weekly. Check for breaks daily with a quick visual scan. If volatility spikes, recalculate midweek.
- Swing traders. Recalculate every two to four weeks using H4 or D1 returns. Review after major central bank weeks and after large risk events.
- When to refresh early. Refresh after a regime shift. Examples, a rate differential shock, an intervention, a commodity shock that hits CAD or AUD, or sustained equity selloffs that change JPY behavior.
- Keep a change log. Save each matrix with a date. Track which pairs stay stable and which pairs flip often. Use stable pairs for your core risk map.
How to use correlations in real trading setups
Exposure control, spot when you place the same trade twice
Start with your open risk, not your watchlist. Correlation matters only when both trades can lose together.
- Group your positions by base and quote currency. Two USD-long trades often behave like one bigger USD bet.
- Check the correlation between the two pairs you want to hold. If it stays above +0.70, treat them as one position for risk. If it stays below -0.70, treat them as opposing exposure.
- Translate to risk units. If you risk 1R on EURUSD and add 1R on GBPUSD, and they run at +0.85, your effective USD exposure can look closer to 1.7R to 2.0R in a risk-off spike.
- Use a cap. Set a rule like, max 2R combined risk inside one highly correlated cluster.
- Watch “hidden duplicates.” AUDUSD and NZDUSD often track. USDJPY and EURJPY can stack JPY risk. USDCAD can pull in oil risk.
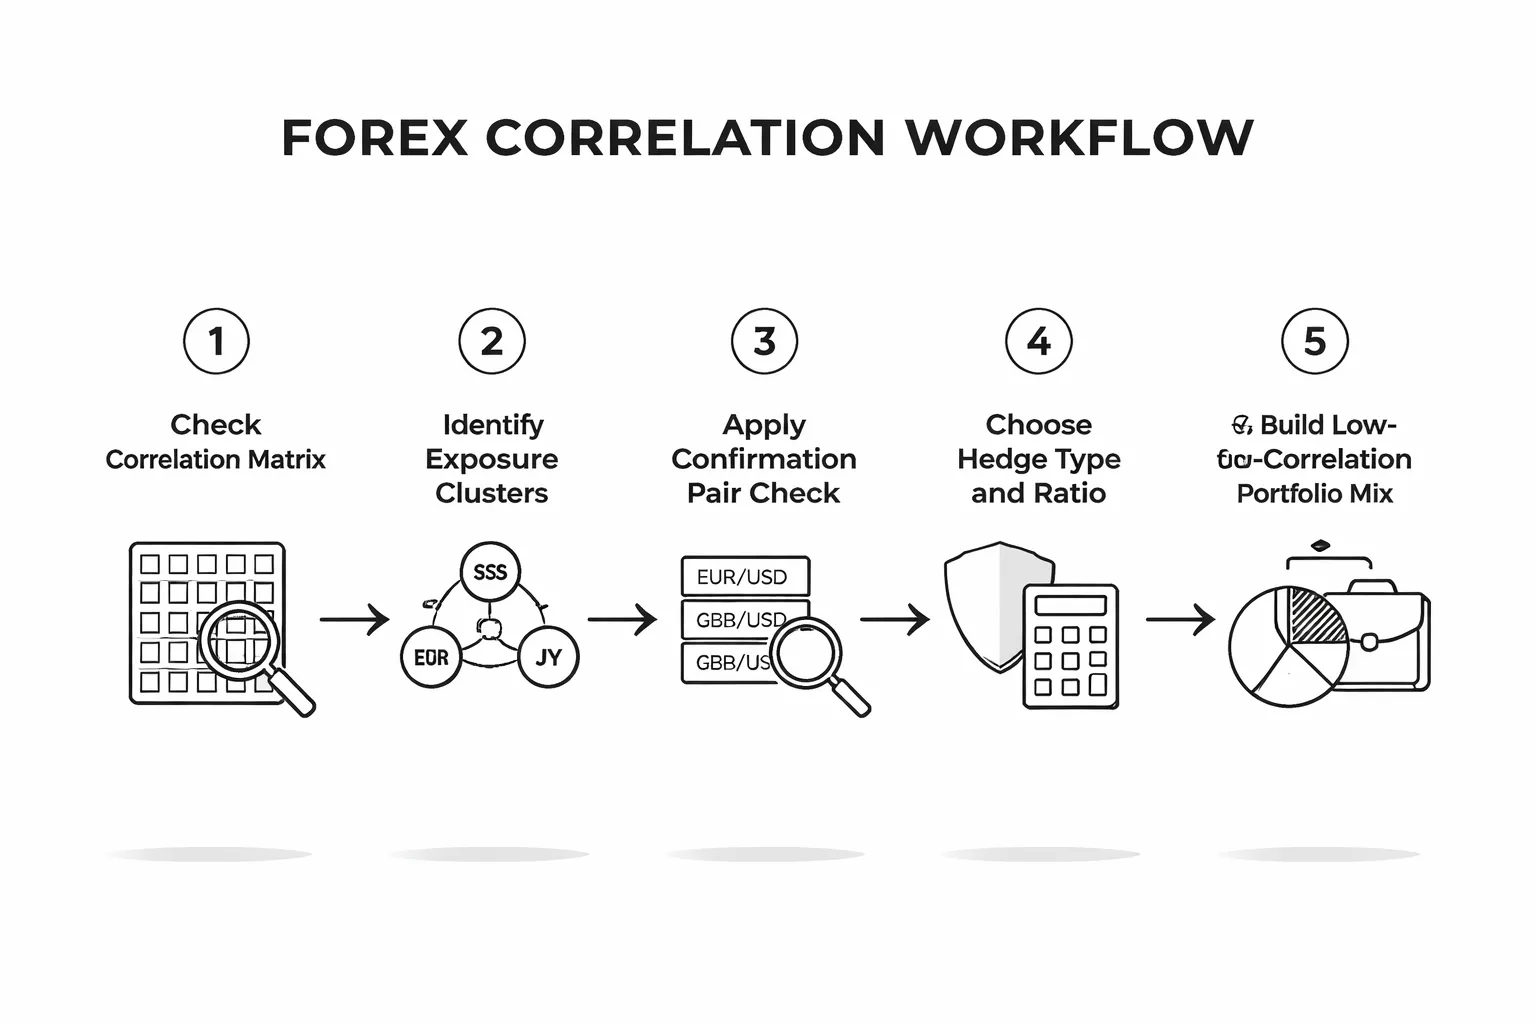
Confirmation logic, use a second pair as a sanity check
Use correlation to confirm direction and momentum. Do it before entry, not after.
- For positively correlated pairs. If you plan to buy EURUSD, you want GBPUSD to hold higher lows, break the same session level, or at least stop falling. If GBPUSD dumps while EURUSD “breaks out,” treat the move as fragile.
- For negatively correlated pairs. If you plan to buy EURUSD, you want USDCHF to weaken. If USDCHF rallies hard at the same time, EURUSD strength may fail fast.
- Use simple filters. Align on market structure, trend, and session direction. One clean check beats five indicators.
- Define invalidation. If the confirmation pair flips trend or breaks a key level against your thesis, reduce size or stand down.
Hedging approaches, partial hedges vs full hedges
Hedges reduce net exposure. They also add spread, swap, and complexity. Use them to manage a known risk window.
- Partial hedge. You keep the core trade, then add a smaller position in a negatively correlated pair to cut drawdown during high-risk events. Example, you hold long EURUSD and add a smaller long USDCHF into a major USD event. You lower net USD short exposure without fully flattening.
- Full hedge. You try to neutralize exposure. This often locks in a floating loss and turns your book into a time-decay problem through costs. Use it only when you must stay in the market but need to kill directional risk.
- Hedge ratio. Do not assume 1:1 size. Use recent correlation strength and relative volatility. If Pair A moves 1.2x Pair B, size the hedge smaller on A or larger on B.
- Exit plan first. Decide what unlocks the hedge. Time based, level based, or volatility based. If you do not plan the unwind, you will keep it too long.
Pairs trading basics, relative strength and divergence
Pairs trading uses correlation as a baseline, then looks for temporary divergence.
- Pick a stable relationship. Use a pair set with a history of steady correlation, not one that flips every month.
- Define the spread. Track the performance difference between two correlated pairs over a fixed lookback. Keep it simple, percent change over 5 to 20 days works.
- Trade mean reversion with a rule. If EURUSD outperforms GBPUSD far beyond its recent range, you can sell EURUSD and buy GBPUSD, sized by volatility, aiming for the spread to compress.
- Respect regime risk. A spread can stay wide when fundamentals shift. Protect with a hard stop on the spread, not on each leg in isolation.
- Take profit like a technician. Use prior spread extremes, midline, or a fixed multiple of spread risk. For clean target planning, use your normal process from take profit levels.
Portfolio construction, combine low-correlation positions
Correlation helps you build a smoother book. You want fewer trades that move together.
- Build clusters. Put highly correlated pairs in one bucket. Examples, EURUSD and GBPUSD. AUDUSD and NZDUSD. USDJPY and EURJPY.
- Limit cluster exposure. Risk small inside a cluster, then spread risk across other clusters with lower correlation.
- Mix drivers. Combine positions tied to different themes, rates, commodities, and risk sentiment. Your goal is less equity curve shock on one headline.
- Rebalance by correlation shifts. If a pair starts moving with your core exposure, cut size or rotate to a lower-correlation alternative.
- Measure weekly. Track realized correlation across your open positions. If your book drifts into one bet, fix it before the next risk event.
Position sizing and risk management with correlated pairs
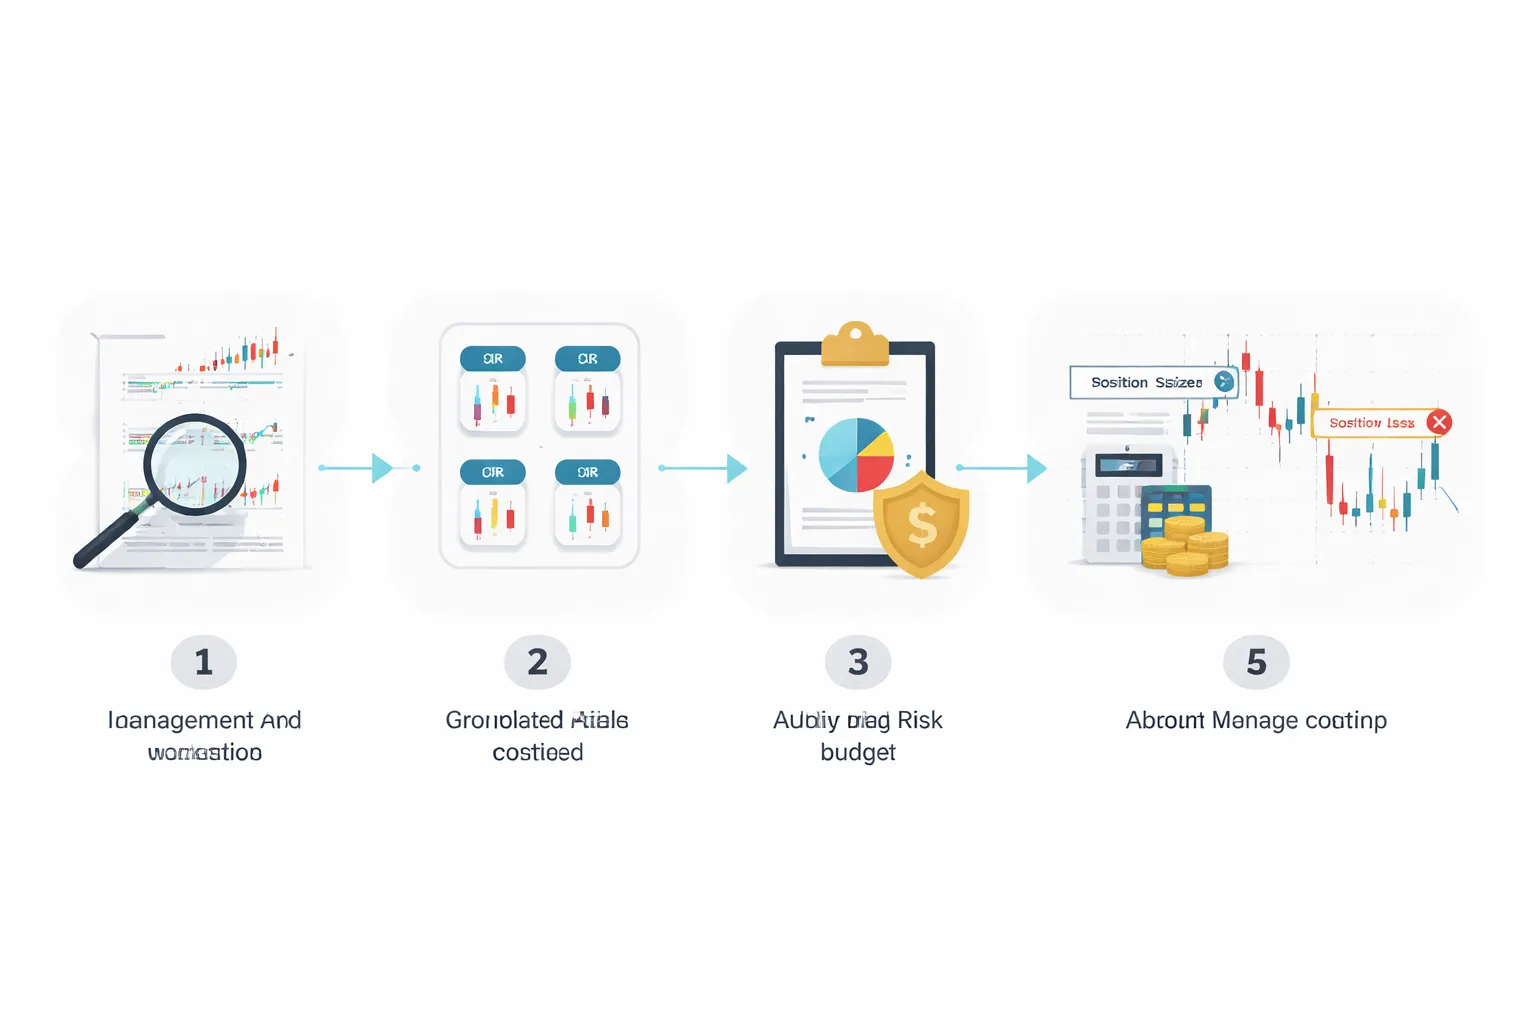
Correlation-adjusted position sizing, avoid hidden leverage
Correlation turns two trades into one bigger trade. Your platform shows two positions. Your risk behaves like one concentrated bet.
Use a simple adjustment. Treat each position as if it shares risk with the others.
- Use realized correlation. Measure it on the timeframe you trade. Use the last 20 to 60 trading days. Update weekly.
- Convert each trade into risk percent. Example, 0.50 percent per trade based on your stop distance.
- Apply a correlation hair-cut. If two trades have high positive correlation, cut size on both.
| Realized correlation (r) | What it means for your sizing | Practical action |
|---|---|---|
| 0.80 to 1.00 | Almost the same trade | Trade one, or split your intended risk across both |
| 0.50 to 0.79 | Strong overlap | Cut each position size by 30 to 50 percent |
| 0.20 to 0.49 | Some overlap | Small cut, or keep size and cap total exposure |
| -0.20 to 0.19 | Low overlap | Size normally, still respect total risk limits |
| -0.21 to -1.00 | Hedge like behavior, sometimes unstable | Do not increase size just because it is negative |
Do not stack trades that share the same base driver. USD risk, JPY risk, rates risk, or commodities risk. You will feel it on one headline.
Stop-loss clustering, correlated trades can trigger together
Correlated pairs move together. Your stops cluster around the same event risk and the same volatility spikes.
- Audit stop distance in ATR terms. If both trades use similar ATR multiples, they will likely fail together.
- Avoid identical technical levels. Many correlated pairs break the same session high or low at the same time.
- Stagger execution. If you want two related positions, enter the second only after the first moves in your favor.
- Use one primary stop. For two highly correlated trades, manage them as one position with one risk budget.
If you need help building clean stop rules, use this guide on how to place a stop loss.
Managing drawdowns, maximum correlated exposure rules of thumb
Set limits that stop correlation from turning into a blowup.
- Cap total open risk. Keep your total risk across all positions small enough to survive a volatility jump.
- Cap same-theme risk. Limit risk across positions that depend on the same currency or macro driver.
- Cap high-correlation clusters. If r is above 0.70 between positions, treat the cluster as one trade.
- Reduce risk into known events. CPI, jobs, central banks. Correlations tighten during these windows.
| Rule | What you do | Why it works |
|---|---|---|
| One-bet rule | If r > 0.80, allow only one position, or split risk across them | Prevents duplicate exposure |
| Theme cap | Limit total risk tied to one currency, like USD, to a fixed share of your total | Stops a single driver from dominating your book |
| Event cut | Reduce cluster risk before major releases | Correlation and volatility often rise together |
A practical risk checklist before placing multiple related trades
- List the driver. Rates, risk sentiment, oil, or a single currency theme.
- Pull realized correlation. Use the last 20 to 60 sessions on your trading timeframe.
- Group your positions. Put trades with r above 0.70 in one cluster.
- Set one risk budget per cluster. Decide the max loss you accept for the whole group.
- Adjust position size. Split the cluster risk across trades, or drop the weakest setup.
- Check stop overlap. If both stops rely on the same volatility regime or the same level, change the plan.
- Stress test the headline move. Assume a fast spike. Ask if all stops hit in minutes.
- Recheck after entry. If correlation rises after you enter, cut size. Do not wait for the next event.
Correlation breakdowns: when the list can fail you
High-impact news and central banks, why correlations can flip or vanish
Correlations break when policy drives one currency more than the other. Rate decisions, inflation surprises, and forward guidance can rewrite flows in minutes.
- Interest rate repricing. A hawkish shift can lift a currency across the board. Pairs that usually move together can split because the driver becomes yield, not risk.
- Asymmetric exposure. One pair may price a central bank path. Another pair may price growth or commodities. Your correlation list does not adjust fast enough.
- Two central banks, two shocks. If both sides face different policy surprises, correlation can collapse. Your hedge becomes a second bet.
Rule for live trading. Treat major scheduled events as correlation reset points. Cut cluster size before the release. Rebuild after the first clean reaction candle. Use basic candle context if you need a refresher from your candlestick charts guide.
Crisis and risk events, correlations converge and diversification disappears
During stress, markets trade one factor. Liquidity and funding matter more than pair logic. Correlations converge toward 1 or -1, fast.
- USD funding rush. In panics, USD demand can dominate. Many pairs move as a single block, even if they rarely correlate in calm markets.
- Widening spreads and gaps. Correlation math uses prints, your execution uses fills. Slippage can turn a “hedged” book into a larger loss.
- Correlation sign flips. A classic safe haven can behave like a risk currency for a stretch, due to positioning and deleveraging.
Action step. If volatility jumps, assume correlation rises. Reduce total exposure. Do not add “diversifiers” inside the same risk regime.
Commodity and equity linkages, when external markets drive FX relationships
Some FX pairs track external markets. When those markets take control, your pair list becomes secondary.
- Oil and CAD, NOK. A sharp oil move can override normal FX correlations. USDCAD can decouple from other USD pairs.
- Metals and AUD, NZD. Iron ore, copper, and China-linked data can push AUD crosses in ways that do not match your usual basket.
- Equities and JPY, CHF. If equities gap, safe haven flows can dominate. USDJPY can move with indices, while EURUSD does not.
Trading rule. If a commodity or index drives your thesis, track it first. Only use the correlation list as a sizing tool, not as a signal.
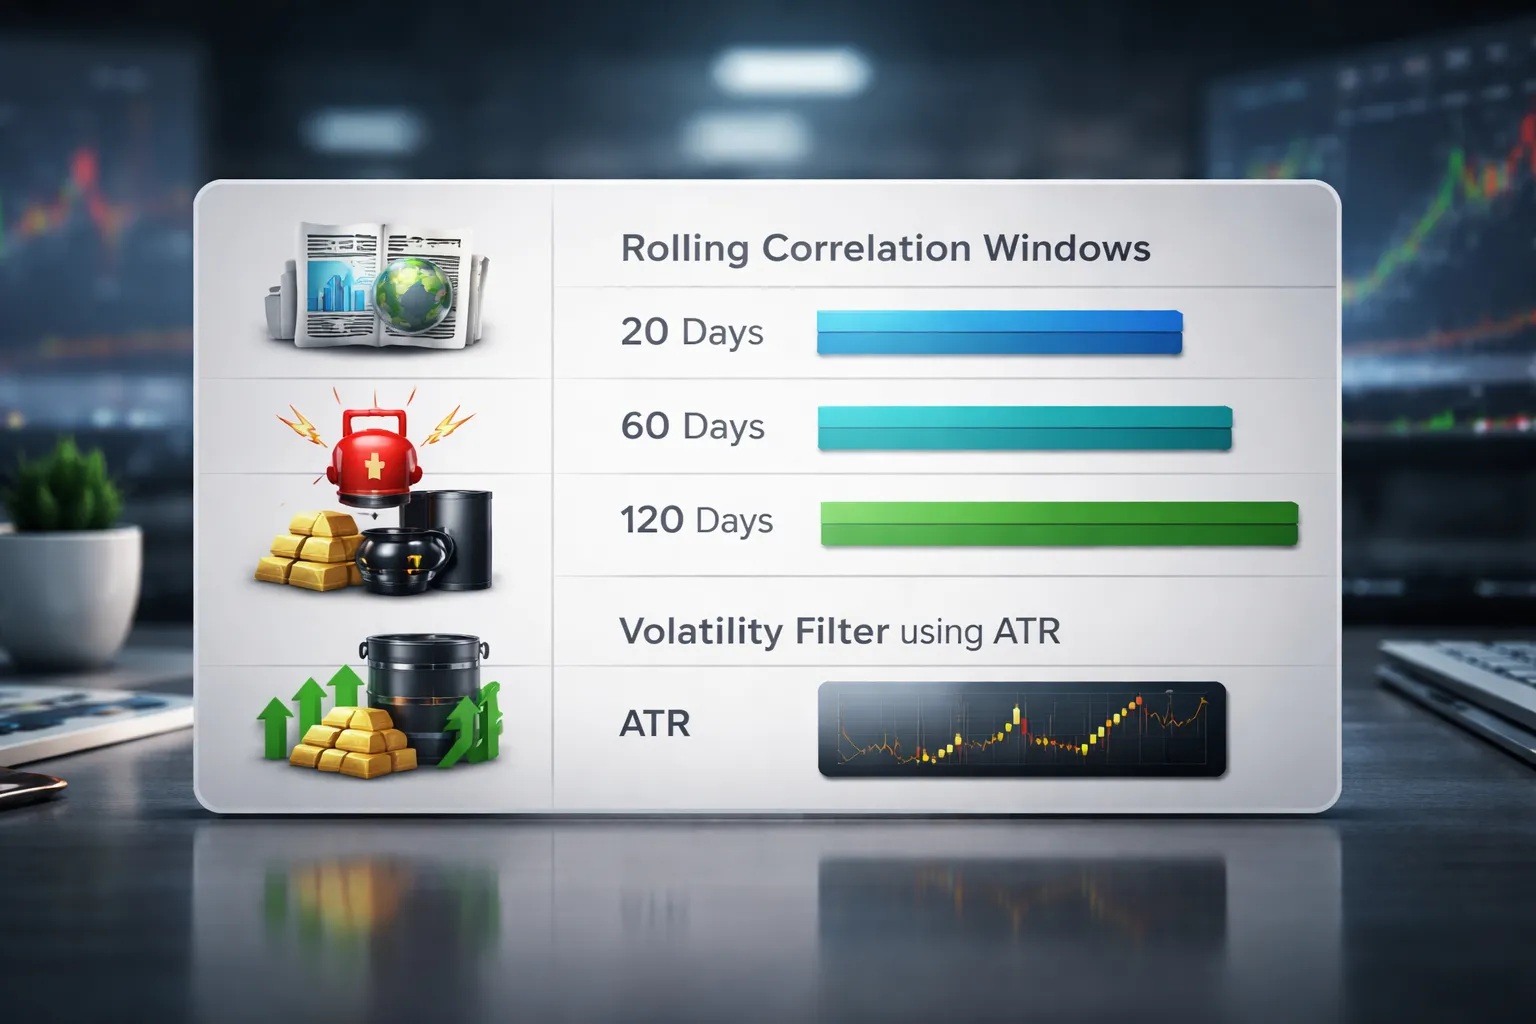
How to detect instability, rolling correlations and volatility filters
Static correlations mislead. You need a live read.
- Use rolling windows. Track correlation over 20, 60, and 120 trading days. Compare them. A big spread means the relationship shifts.
- Watch the sign. If correlation crosses from positive to negative inside your lookback set, treat it as unstable. Do not hedge with it.
- Add a volatility filter. Only trust correlation when volatility stays inside a normal band. If ATR or daily range expands past your threshold, downgrade correlation weight.
- Confirm with beta. Correlation ignores magnitude. Check the slope. If pair A now moves 1.8x pair B, your hedge ratio fails even if correlation stays high.
| Instability signal | What it means | What you do |
|---|---|---|
| 20-day correlation diverges from 120-day by 0.30+ | Regime change or event-driven flow | Cut size, avoid using the pair as a hedge |
| Correlation sign flips inside the last 60 days | Relationship not reliable | Remove from the correlation plan until it stabilizes |
| ATR or daily range spikes above your norm | Execution risk and convergence risk rise | Assume higher correlation, reduce total exposure |
| High correlation but beta shifts by 30%+ | Hedge ratio no longer fits | Recalculate sizing, do not “match lots” by habit |
Correlation vs other tools (and how to combine them)
Correlation vs other tools (and how to combine them)
Correlation does one job. It measures how two pairs move together over a set window. It does not explain why. Use it as a risk and confirmation layer, not as a standalone signal.
Correlation and fundamentals: interest rate differentials, growth, and inflation narratives
Fundamentals drive the long swings. Correlation tells you if two pairs share the same macro driver right now.
- Interest rate differentials: If rates drive both legs, correlations can tighten fast. Treat highly correlated USD pairs as one USD rates trade. Size as a basket, not as separate “ideas”.
- Growth narrative: If global growth is the theme, pro-cyclical FX can cluster. AUD, NZD, and CAD can align. Your cross exposure rises even if each position looks small.
- Inflation narrative: Inflation shocks can flip central bank paths and break prior relationships. When your macro thesis changes, assume your correlation map will change too. Reduce risk until the new regime stabilizes.
- Practical rule: When two trades rely on the same rate path, treat them as correlated even if the 60-day number looks mild.
If you use carry, connect correlation to your funding and crash risk. Use one carry theme at a time and cap total exposure across correlated pairs. Read the carry trade strategy guide if you need a framework for sizing and risk events.
Correlation and technicals: structure, trend alignment, and multi-pair confirmation
Technicals tell you where you can enter and where you are wrong. Correlation tells you if your technical setup repeats across the complex.
- Structure first: Check swing highs and lows on each pair. If both pairs break structure in the same direction, correlation supports the trade. If one breaks and the other fails, treat it as a warning.
- Trend alignment: Only compare trends on the same timeframe. If one pair trends and the other ranges, correlation may be noise. Do not force a hedge or a confirmation.
- Multi-pair confirmation: If EURUSD breaks up and GBPUSD breaks up, your USD short theme has confirmation. If EURUSD breaks up but USDJPY also breaks up, you likely face mixed drivers, not clean USD weakness.
- Execution rule: When two highly correlated pairs give the same entry signal, pick the cleaner structure and better spread. Avoid doubling exposure by taking both.
Correlation and sentiment/positioning: COT, risk proxies, and crowding
Positioning explains when correlation becomes crowded and fragile. Crowded trades unwind together.
- COT direction: If specs hold extreme USD longs, many USD pairs can move as a pack. Your correlation risk rises even if the rolling window still looks normal.
- Risk proxies: Watch the pairs that act as risk gauges for your broker hours, such as AUDJPY, NZDJPY, and USDJPY. When risk-off hits, correlations often jump toward 1 across “risk” FX.
- Crowding filter: If your trade sits in the same direction as crowded positioning across correlated pairs, cut size. Use wider time stops. Expect faster reversals.
- Portfolio rule: Never stack three versions of the same crowded bet. Correlation turns them into one oversized position.
Correlation and volatility metrics: ATR, implied volatility, and event risk planning
Volatility changes correlation. In stress, correlations rise and hedges fail.
- ATR: When ATR expands, your normal correlation plan breaks. Reduce total exposure across correlated pairs, or widen stops and cut size. Keep your risk per theme stable.
- Implied volatility: Rising implied vol signals repricing risk. Treat it as a warning that historical correlations may lag. Assume more shared movement across pairs with the same base driver.
- Event risk: Before CPI, NFP, central bank decisions, and rate statements, correlations can compress to one trade. Plan for gaps and slippage. Avoid holding multiple correlated positions into the same event.
- Scheduling rule: If two pairs share the same calendar risk, limit to one position or cut size across both. Do not rely on “diversification” inside the same event.
Practical examples using a forex correlation pairs list
Example 1: Avoiding double risk when EURUSD and GBPUSD align
EURUSD and GBPUSD often move together because USD sits on the other side of both pairs. Your correlation pairs list will often show a strong positive correlation in normal conditions.
Scenario. You see a USD-weak setup and you buy both EURUSD and GBPUSD. You think you placed two trades. You actually placed one view with doubled exposure.
- Step 1, check correlation: If your list shows EURUSD and GBPUSD at +0.70 to +0.95 on your lookback, treat them as one theme trade.
- Step 2, map the real risk: Both positions profit from USD weakness and both lose on a USD squeeze. You concentrate your downside into one driver.
- Step 3, fix the exposure: Pick the cleaner chart, or split risk across the two but keep total risk the same as a single trade.
- Step 4, avoid false diversification: Do not count both trades as two independent shots in your journal.
Practical rule. If two pairs show high positive correlation, size them like one position. Keep your total USD risk budget intact.
Example 2: Using negative correlation to reduce USD concentration
Negative correlation helps when you want a second trade but you do not want more of the same USD bet. Use your list to find pairs that often move in opposite directions.
Scenario. You already hold long EURUSD. You want another trade, but you do not want to double down on USD weakness.
- Step 1, identify the concentration: Long EURUSD equals short USD exposure.
- Step 2, find an offset: Look for a pair that often runs negative to EURUSD over the same lookback window. Many lists show EURUSD vs USDCHF as strongly negative in normal regimes.
- Step 3, use the offset correctly: If you want to reduce USD concentration, avoid adding another USD-short. A long USDCHF position can partially offset the USD leg in EURUSD.
- Step 4, keep the hedge imperfect on purpose: Aim to reduce drawdowns, not to remove risk. A perfect hedge often kills your upside.
Practical rule. When you add a second position, write down your net USD exposure before and after. Use correlation as a check, not a promise.
Example 3: Building a diversified 3-trade basket with low correlation
A basket works when trades rely on different drivers. Your correlation pairs list helps you avoid stacking the same risk across three charts.
Goal. Three trades, three themes, low overlap.
| Slot | Example pair | Main driver to monitor | Correlation filter |
|---|---|---|---|
| 1 | EURUSD | USD rates and US data | Keep other USD pairs limited |
| 2 | AUDJPY | Risk sentiment and Asia flows | Avoid adding NZDJPY and CADJPY together |
| 3 | EURGBP | ECB vs BoE spread | Prefer a cross to cut USD overlap |
- Step 1, start with your best setup: Build the basket around it.
- Step 2, add a different driver: Use a cross or a JPY risk pair to avoid repeating USD exposure.
- Step 3, check pairwise correlation: You want low or unstable correlation between each pair in the basket, not just between the first and the third.
- Step 4, size as a portfolio: If two legs start correlating during a news regime, cut size. Your basket became one trade.
Practical rule. Correlation changes fastest around events. Recheck your list after major data and central bank days, not once per month.
Example 4: Spotting a divergence and deciding whether it’s signal or noise
Divergence happens when two normally correlated pairs stop moving together. Sometimes it signals new information. Sometimes it is a temporary liquidity move.
Scenario. Your list shows EURUSD and GBPUSD usually correlate strongly. Today EURUSD breaks higher but GBPUSD stalls.
- Step 1, confirm the regime: Check if correlation weakened over a shorter window. A rolling 5 to 20 day check often catches shifts faster than a 90 day average.
- Step 2, look for pair-specific drivers: UK data, BoE headlines, or UK political risk can break the link even if USD drives the broader move.
- Step 3, use divergence as a decision tool: If your trade thesis is USD weakness, the cleaner confirmation is broad USD selling across several majors. If only one pair runs, treat it as lower quality.
- Step 4, plan the invalidation: If you trade the breakout anyway, tighten the logic. Define the level that proves the move failed. Tie your exit to that level and your risk-reward ratio, not to hope.
- Step 5, watch for catch-up: If the lagging pair snaps into line without new information, the divergence was noise. If it keeps diverging on fresh headlines, the divergence was signal.
Practical rule. Divergence does not mean reversal. It means the market received new information, or liquidity shifted. Your job is to label which one it is and size down until you know.
Best practices and common mistakes to avoid
Best practices for maintaining a watchlist and correlation dashboard
- Track rolling correlation. Use a 20 day and 60 day window. Correlation changes. A single static number misleads you.
- Separate regimes. Keep notes for risk on and risk off periods. Correlations tighten in stress and loosen in calm markets.
- Group by driver. Build lists by shared exposure, USD pairs, JPY risk pairs, commodity FX, Europe block. This keeps your thesis clean.
- Log the spread between pairs. If you trade divergences, chart Pair A minus Pair B or a ratio. You need a clear view of expansion and mean reversion.
- Set alerts for breaks. Alert when correlation drops below a threshold you set, like 0.50, or when the spread hits a 20 day extreme.
- Refresh inputs. Update correlation readings at a fixed time each day. Do not change settings mid week to fit your last trade.
- Keep a small universe. Watch 10 to 20 pairs. You want repetition and fast recognition.
- Write the trade driver in one line. Example, USD yield move, oil move, Europe data, risk shock. If you cannot name it, you do not have a thesis.
Mistake, using correlation as an entry signal without a thesis
- You buy because two pairs “should” move together. That is not a reason. Correlation describes the past. It does not predict the next hour.
- You fade divergence by default. Divergence often comes from new information. Treat it as a warning, not a trigger.
- You ignore the catalyst calendar. One pair can move on local data while the other waits. Your dashboard will show “breakdown” that is normal.
- Fix. Define the driver, define what would confirm it, then decide if you want convergence or continuation. Size down until price agrees.
- Fix. Use a hard stop on each leg. Place it based on structure, not on a correlation line. Use this stop loss guide if you need a simple placement process.
Mistake, ignoring spread and rollover costs when pairing trades
- You pay two spreads. A pair trade opens two positions. Your break even moves farther away.
- You pay or receive swap on both legs. Swap can erase the edge in slow mean reversion trades. This matters most if you hold for days.
- You ignore different liquidity. One leg can slip more. Your “neutral” hedge turns into a directional bet during news.
- Fix. Check typical spread and swap before you trade. Estimate total cost in pips and in account currency. If expected edge cannot cover it, skip the setup.
- Fix. Prefer liquid majors for correlation trades. Avoid thin crosses unless the expected move is large and time bound.
Mistake, confusing correlation with a guaranteed hedge
- Correlation is not hedging. A high positive correlation does not cap your loss. Both pairs can drop together, or correlation can flip during shocks.
- Equal lots do not mean equal risk. Different pairs have different pip values, volatility, and gap risk. Your exposure can stack.
- Correlations converge in crises. In stress, many risk pairs move as one. Your “diversified” book can become one trade.
- Fix. Measure risk in dollars, not lots. Use ATR or recent range to size each leg so one does not dominate.
- Fix. Stress test the idea. Assume correlation breaks to zero and both legs move against you. If the loss is not acceptable, reduce size or do not trade it.
FAQ
What is forex correlation?
Forex correlation is how two currency pairs move relative to each other over a set period. Positive correlation means they tend to move in the same direction. Negative correlation means they often move in opposite directions. Correlation changes with time and market regime.
What correlation value is “strong”?
Use the Pearson range from -1 to +1. Above +0.70 is strong positive. Below -0.70 is strong negative. Between -0.30 and +0.30 is weak. Treat these as guidelines, not rules. Always check the current window.
What time window should you use?
Match the window to your holding time. Day traders can use 20 to 60 trading days. Swing traders can use 90 to 180 days. Long-term positions can use 1 to 3 years. Recalculate often. A stable average can hide recent breakdowns.
How do you use correlation to avoid doubling your risk?
Group pairs by shared currencies. If two pairs show strong positive correlation, treat them as one idea. Reduce size across the group. Cap total exposure per currency. Size in dollars using ATR so one leg does not dominate your book.
How do you use negative correlation for hedging?
Use it to reduce net exposure, not to “lock” a loss. Build the hedge with smaller size than the main trade. Recheck correlation during the trade. If correlation weakens, your hedge may fail and add risk instead of cutting it.
Why do correlations break in news and crises?
Flows dominate. Liquidity drops. Spreads widen. Risk pairs can move together as traders de-risk. Safe havens can decouple or spike. Assume instability around major releases and stress events. Plan for correlation to move toward zero or flip sign.
Is correlation the same as cointegration?
No. Correlation measures short-term co-movement. Cointegration tests if a spread tends to revert over time. A pair can show high correlation and still drift apart for months. Use cointegration tools if you trade mean reversion or spreads.
How do you calculate correlation?
Use Pearson correlation on returns, not price levels. Pull daily closes. Convert to percent or log returns. Run the correlation for your chosen window. Most platforms and spreadsheets do it. Update weekly or after major volatility shifts.
Should you use correlation on intraday charts?
Be careful. Microstructure noise and session effects distort results. If you trade intraday, compute correlation on the same timeframe returns and use a larger sample. Confirm with a higher timeframe. Do not assume a daily correlation applies to a 5 minute chart.
Can you backtest a correlation filter?
Yes. Test rules like “skip trade if correlation above 0.80 with an open position” or “cut size by 50 percent.” Use walk-forward windows and include spreads and swaps. Use realistic execution. Follow a clean process in how to backtest a forex strategy.
How do you manage stops when trades are correlated?
Place stops per trade, then cap total loss across the cluster. If both stops can hit on one move, you sized too big. Use a portfolio stop or reduce exposure. If you need help with placement, see your broker rules and your volatility measures.
What are common correlated forex pairs?
- Positive, often: EURUSD and GBPUSD; AUDUSD and NZDUSD.
- Negative, often: EURUSD and USDCHF; AUDUSD and USDCAD at times.
- Variable: USDJPY with risk sentiment, can shift fast.
What is the biggest mistake traders make with correlation?
They treat it as fixed. They stack positions and call it diversification. Then volatility hits and the book becomes one trade. Use rolling windows. Stress test: set correlation to zero and assume both legs move against you. If the loss hurts, cut size.
Conclusion
Conclusion
Correlation is a risk tool, not a signal.
Use it to stop hidden leverage. Measure it often. Trade smaller when pairs start moving together.
- Check the window. Track 20, 60, and 120 trading days. If values disagree, treat correlation as unstable.
- Convert positions into one number. Sum your USD exposure across pairs. If most trades lean the same way, you run one theme.
- Stress test your book. Assume correlation goes to zero. Assume both legs move against you. If the drawdown breaks your limit, cut size or remove a leg.
- Plan exits first. Place stops where the trade idea fails, not where correlation “should” protect you. Use a clear stop process from your stop loss guide.
Final tip. Treat every new position as an addition to the same risk bucket until your numbers prove otherwise.
-
Stop Loss vs Take Profit: Differences, Examples & Best Practices
5 months ago -
Forex Trading Psychology Tips: How to Stay Disciplined and Consistent
5 months ago -
Forex Order Types Explained: Market vs Limit vs Stop Orders
5 months ago -
How to Set Stop Loss and Take Profit (Step-by-Step)
5 months ago -
How to Start Forex Trading Step by Step (Beginner Roadmap)
5 months ago
-
-
- Correlation vs other tools (and how to combine them)
- Correlation and fundamentals: interest rate differentials, growth, and inflation narratives
- Correlation and technicals: structure, trend alignment, and multi-pair confirmation
- Correlation and sentiment/positioning: COT, risk proxies, and crowding
- Correlation and volatility metrics: ATR, implied volatility, and event risk planning
-
- What is forex correlation?
- What correlation value is “strong”?
- What time window should you use?
- How do you use correlation to avoid doubling your risk?
- How do you use negative correlation for hedging?
- Why do correlations break in news and crises?
- Is correlation the same as cointegration?
- How do you calculate correlation?
- Should you use correlation on intraday charts?
- Can you backtest a correlation filter?
- How do you manage stops when trades are correlated?
- What are common correlated forex pairs?
- What is the biggest mistake traders make with correlation?
-
-
- Correlation vs other tools (and how to combine them)
- Correlation and fundamentals: interest rate differentials, growth, and inflation narratives
- Correlation and technicals: structure, trend alignment, and multi-pair confirmation
- Correlation and sentiment/positioning: COT, risk proxies, and crowding
- Correlation and volatility metrics: ATR, implied volatility, and event risk planning
-
- What is forex correlation?
- What correlation value is “strong”?
- What time window should you use?
- How do you use correlation to avoid doubling your risk?
- How do you use negative correlation for hedging?
- Why do correlations break in news and crises?
- Is correlation the same as cointegration?
- How do you calculate correlation?
- Should you use correlation on intraday charts?
- Can you backtest a correlation filter?
- How do you manage stops when trades are correlated?
- What are common correlated forex pairs?
- What is the biggest mistake traders make with correlation?
-
How to Place a Forex Trade Step by Step (Your First Trade Explained)
3 months ago -
Forex Trading vs Crypto Trading: Which Market Is Better for Beginners?
3 months ago -
Forex Lot Size Calculator: How to Use It to Size Trades Correctly
5 months ago -
How to Calculate Position Size in Forex (Position Sizing Formula + Examples)
5 months ago -
Forex Leverage Explained: How It Works, Pros, Cons & Examples
5 months ago
-
Forex Trading Platforms Comparison: MetaTrader vs cTrader vs TradingView
5 months ago -
Is Forex Trading Legal in the United States? Rules, Regulators & What to Know
5 months ago -
Stop Loss vs Take Profit: Differences, Examples & Best Practices
5 months ago -
Forex Market Hours & Trading Sessions Explained (Best Times to Trade)
5 months ago -
Forex Leverage Explained: How It Works, Pros, Cons & Examples
5 months ago