Understanding Forex Candlestick Charts (Beginner Guide)
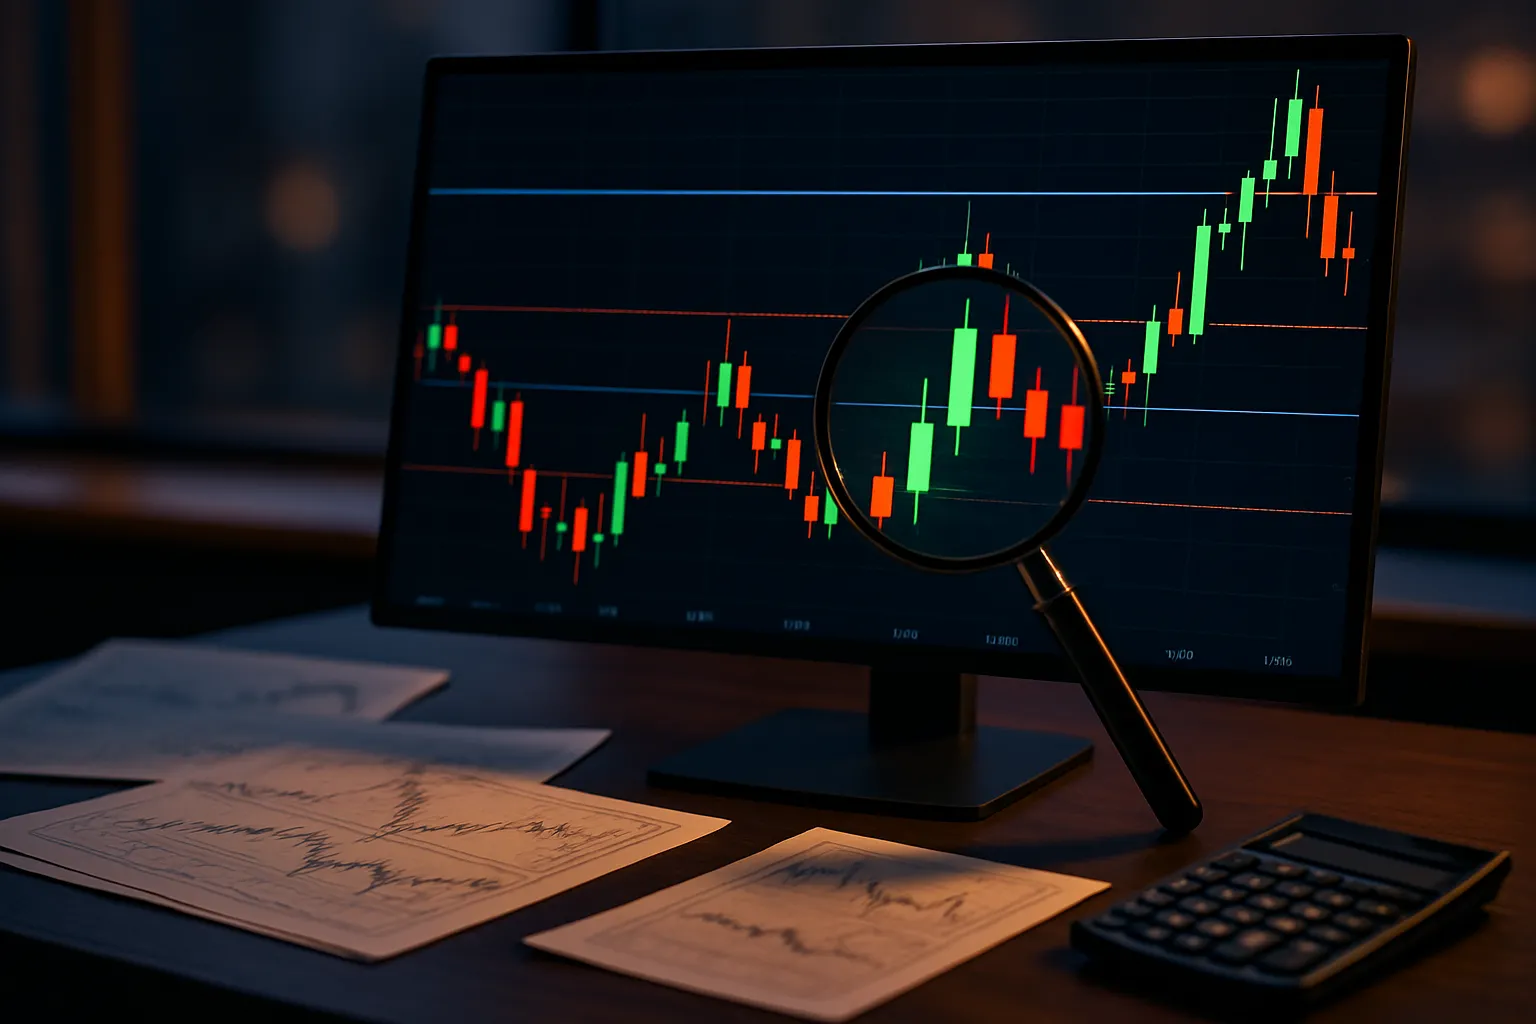
Candlestick charts show you price action fast. Each candle compresses four data points, open, high, low, close, into one readable unit. You use this to spot momentum shifts, rejection at key levels, and short term trend strength.
This guide teaches you how to read a candlestick, how wicks and bodies signal buying and selling pressure, and how to combine candles with support and resistance. You will also learn the most common candlestick patterns, what they mean in Forex, and when to ignore them. If you want to turn these signals into rules, use a Forex trading plan so your entries, stops, and risk stay consistent.
Key Takeaways
- In het kort: A candlestick shows four prices, open, high, low, close.
- The body shows who controlled the close. A larger body signals stronger momentum.
- The wicks show rejection. Long upper wick signals selling pressure. Long lower wick signals buying pressure.
- Read candles in context. A strong signal at support or resistance matters more than the same candle in the middle of a range.
- Start with the basics. One and two candle patterns, like pin bars and engulfing candles, give the most usable signals for beginners.
- Confirm before you act. Use the next candle, a break of a level, or a close beyond a zone to filter weak setups.
- Ignore “perfect” patterns with weak location, low range, or mixed structure. Pattern names do not beat context.
- Risk control comes first. Define entry, stop, and position size before you trade the signal.
- Use support and resistance as your main filter. Read more in support and resistance.
What Forex Candlestick Charts Are and Why They Matter
How candlesticks differ from line and bar charts
A line chart plots one price per period, usually the close. You see direction, but you lose detail.
A bar chart shows open, high, low, and close. It carries the full data, but it takes longer to read fast.
A candlestick chart uses the same OHLC data as bars. It packages it for quick scanning.
- Body, the distance between open and close. It shows net progress in that period.
- Wicks, the distance to the high and low. They show rejection and failed attempts.
- Color, close above open or close below open. It helps you spot momentum shifts faster.
When you trade off support and resistance, this speed matters. You can see pressure, rejection, and follow-through without zooming into lower timeframes.
What a single candlestick can tell you about buyers vs sellers
Each candle is a fight summary for one time slice. You read who controlled most of the period and who won the close.
- Large body, small wicks, one side stayed in control. Momentum is clear.
- Small body, long wicks, both sides pushed and failed. Price found no agreement.
- Long upper wick, buyers drove price up, sellers forced it back down. That level attracted selling.
- Long lower wick, sellers drove price down, buyers absorbed and pushed it back up. That level attracted buying.
- Close near the high, buyers held gains into the close. Stronger than a mid-range close.
- Close near the low, sellers held control into the close. Stronger than a mid-range close.
Candles do not predict by themselves. They show order flow clues. You still need location, a level, and a plan for entry and risk.
When candlesticks are most useful (and when they can mislead)
Candlesticks work best when you use them as confirmation at a clear level. You want clean structure, enough range, and a close that proves intent.
- Most useful at support and resistance, swing highs and lows, and breakouts with a strong close.
- Most useful after a pullback, when you look for rejection and continuation.
- Most useful on higher timeframes, where noise drops and closes carry more weight.
Candlesticks can mislead when conditions distort the data or when you ignore context.
- Range and chop create many “signals” that fail. Wicks print on both sides and mean little.
- Low liquidity periods widen spreads and spike wicks. The candle looks decisive, execution is not.
- News candles combine spread expansion and fast repricing. One candle can erase several setups.
- Different broker feeds can change candle shapes, especially on intraday charts. Opens and closes vary with server time.
- Pattern hunting makes you late. A name does not replace structure, level, and risk rules.
Keep candlesticks in their lane. Use them to time entries and read pressure at key zones. Control downside with strict rules from your risk management plan.
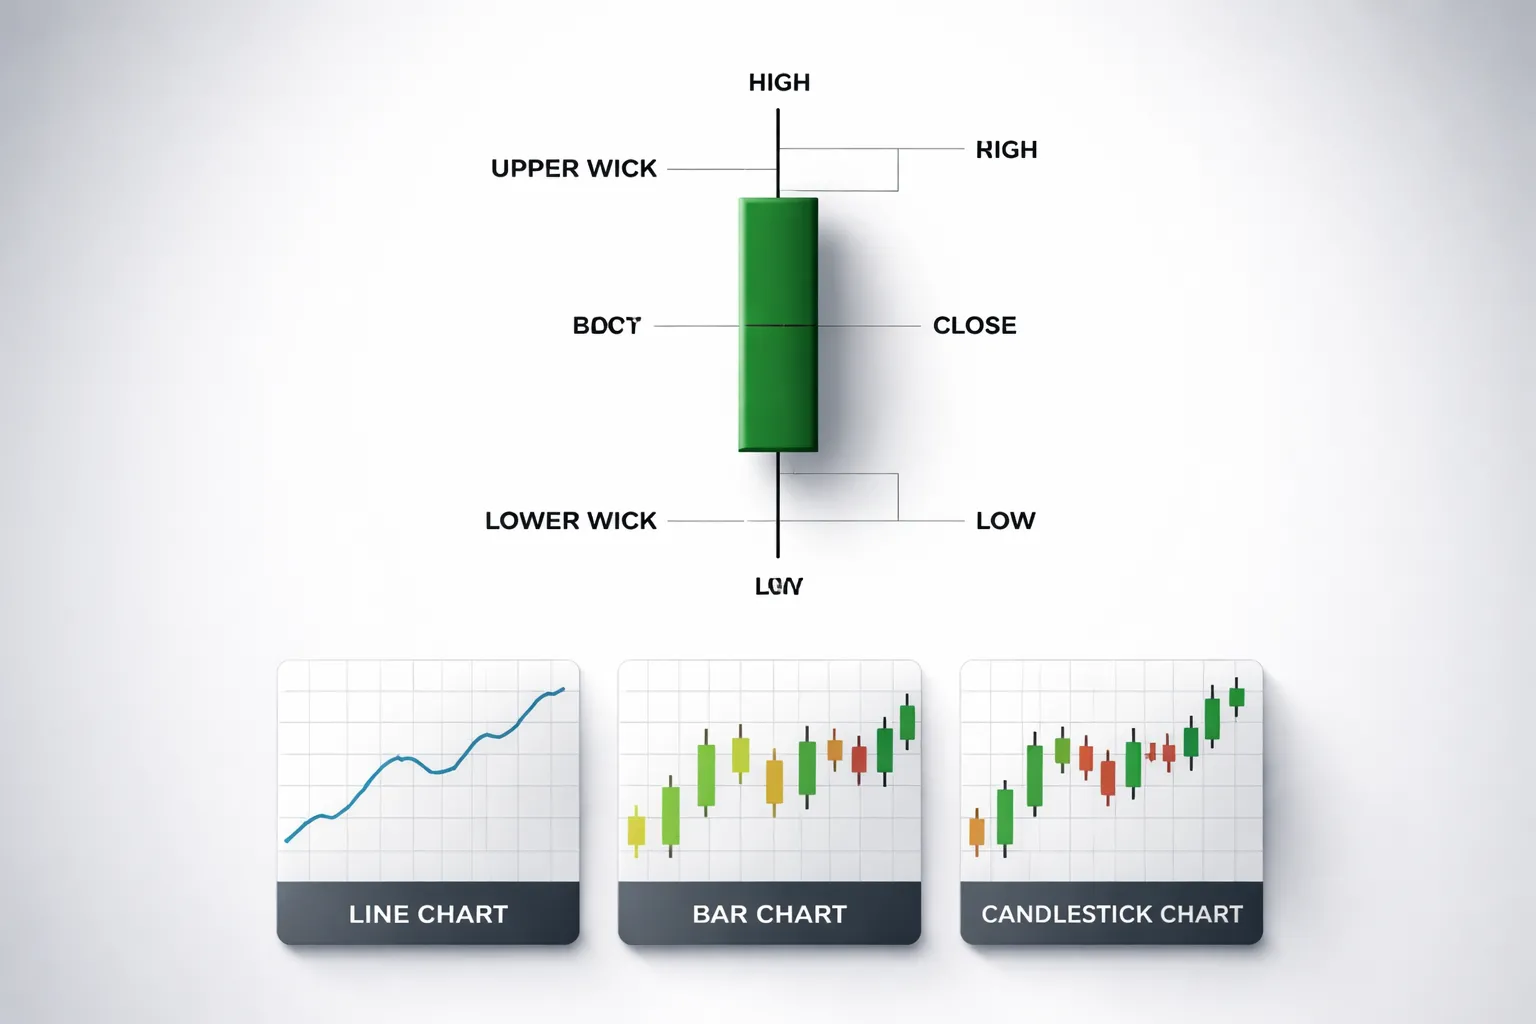
Candlestick Anatomy: Open, High, Low, Close (OHLC) Explained
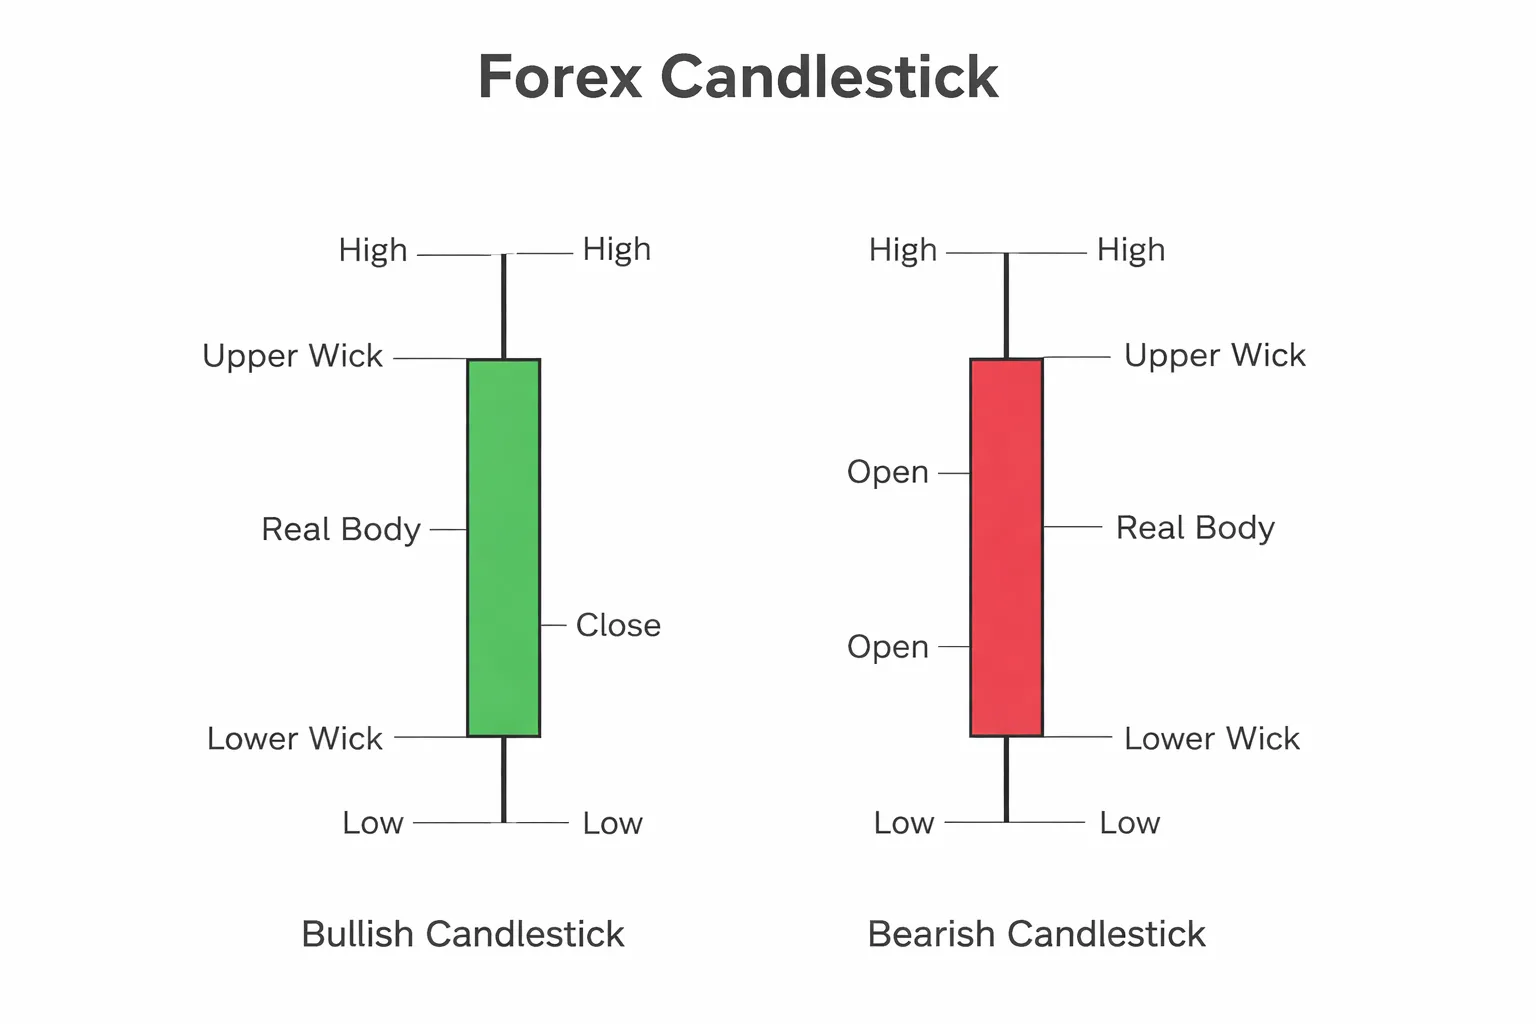
OHLC: What Each Part Records
Each candlestick summarizes four prices for a set time window.
- Open, the first traded price of the period.
- High, the highest traded price of the period.
- Low, the lowest traded price of the period.
- Close, the last traded price of the period.
You read candles to see who controlled the period, buyers or sellers, and where price got rejected.
Real Body vs Wicks: What They Signal
The real body is the range between open and close. It shows how far price moved net during the period.
The wicks, also called shadows, show the extremes. They mark where price traded, then failed to hold.
- Upper wick, buyers pushed up, sellers pushed back down.
- Lower wick, sellers pushed down, buyers pushed back up.
Long wicks often mean rejection. You confirm that rejection with location, such as at support, resistance, or a prior swing.
Bullish vs Bearish Candles: Color Is Secondary
A candle is bullish when the close sits above the open. It is bearish when the close sits below the open.
Your platform may paint bullish candles green or white, and bearish candles red or black. The color does not change the data. The open and close do.
Do not treat one bullish candle as a buy signal. Treat it as one bar of information inside your plan.
Body-to-Wick Ratios: Strength and Rejection
Use the body-to-wick ratio to judge conviction.
- Large body, small wicks, price moved with less pushback. Momentum dominated that period.
- Small body, long wick on one side, price probed and got rejected. You often see this at key levels.
- Long wicks on both sides, two-way trading. Liquidity grabs and chop become more likely.
Compare each candle to recent candles. A “large body” only matters relative to what your market just did.
Doji Candles: Indecision and Its Limits
A doji forms when open and close sit near the same price. The body looks very small.
A doji signals balance. It does not signal reversal by itself.
- If you get a doji into a level after a strong move, it can mark a stall.
- If you get a doji inside a range, it often means nothing. Noise dominates.
Common Beginner Confusion: Close Direction vs Candle Shape
Many beginners label candles by shape and ignore the close. Fix that.
- Direction comes from the close versus the open, bullish or bearish.
- Shape comes from the whole range, high to low, plus where the close sits inside that range.
- A candle can close bullish and still show upper-wick rejection. Buyers won the close, but sellers defended higher prices.
- A candle can close bearish and still show lower-wick rejection. Sellers won the close, but buyers defended lower prices.
Track two facts on every bar, who won the close, and where price got rejected. Then align that read with your higher-timeframe context using multi-timeframe analysis.
Choosing the Right Timeframe and Understanding Candle “Noise”
Multi-timeframe reading, align higher and lower charts
Your timeframe controls what you see. Start high, then drill down.
- Pick a “context” chart. Use it to mark trend, key highs and lows, and obvious ranges.
- Pick an “execution” chart. Use it to time entries and manage risk inside that context.
- Keep the story consistent. If the higher timeframe trends up, treat lower-timeframe sell candles as pullbacks until price proves otherwise.
- Trade from levels, not from random candles. Wait for candles to form at a prior swing, range edge, or clear breakout point.
Most beginners fail here. They read one timeframe in isolation. They take every wick as a signal. You need a location first, then a candle read.
Why lower timeframes create more false signals
Lower timeframes print more candles. More candles means more noise.
- More spreads and micro swings. Small moves can flip candle color without changing the real bias.
- More stop runs. Price can spike through levels and snap back within minutes.
- More “pattern pollution”. You will see engulfing bars and pin bars everywhere. Most do nothing without context.
Control noise with rules.
- Set a minimum candle size. Ignore tiny bodies and tiny ranges. They often reflect churn.
- Demand follow-through. A rejection wick matters more when the next candle confirms by holding the level.
- Use one filter. A simple trend filter, such as a moving average on your context chart, can keep you aligned. See moving averages in forex.
How sessions influence candle behavior (Asia, London, New York)
Forex behavior changes with the clock. Volume and volatility shift by session.
- Asia session. Often slower for many pairs. Candles can cluster and form tight ranges. Breakout signals fail more often.
- London session. Often the first major expansion of the day. Breakouts and strong trend candles appear more often.
- New York session. Can extend London moves or reverse them. Volatility can spike around US data releases.
- London and New York overlap. Common time for the largest candles and cleanest directional moves.
Match timeframe to the session you trade. If you trade the overlap, a 15 minute or 1 hour chart often shows structure without the 1 minute whipsaw. If you trade quiet hours, expect more range candles and more fake breaks.
Gaps, weekend effects, and low-liquidity candles in Forex
Forex trades 24 hours on weekdays, but price can still jump.
- Weekend gaps. The market closes Friday and reopens Sunday. News can hit while the market is closed. Price can reopen far from Friday’s close. Your chart will show a gap on some platforms.
- Gap fills are not a rule. Price may fill quickly, fill later, or never fill. Treat the gap as a volatility event, not a guarantee.
- Low-liquidity candles. Holidays, late Friday, early Sunday, and off-peak hours can print candles with odd wicks. Spreads widen. Levels get pierced without real commitment.
- Broker feed differences. Spot Forex has no central exchange. Two brokers can print slightly different highs and lows. Do not overfit your levels to a single wick.
Manage these conditions with simple safeguards.
- Avoid new trades into market close. Liquidity drops, spreads widen, and wicks get messy.
- Reduce size around major news. News candles can invalidate technical reads in seconds.
- Wait for the first clean reaction after a gap. Let price show support or resistance before you commit.
How to Read Candlestick Charts Step-by-Step (A Beginner Workflow)
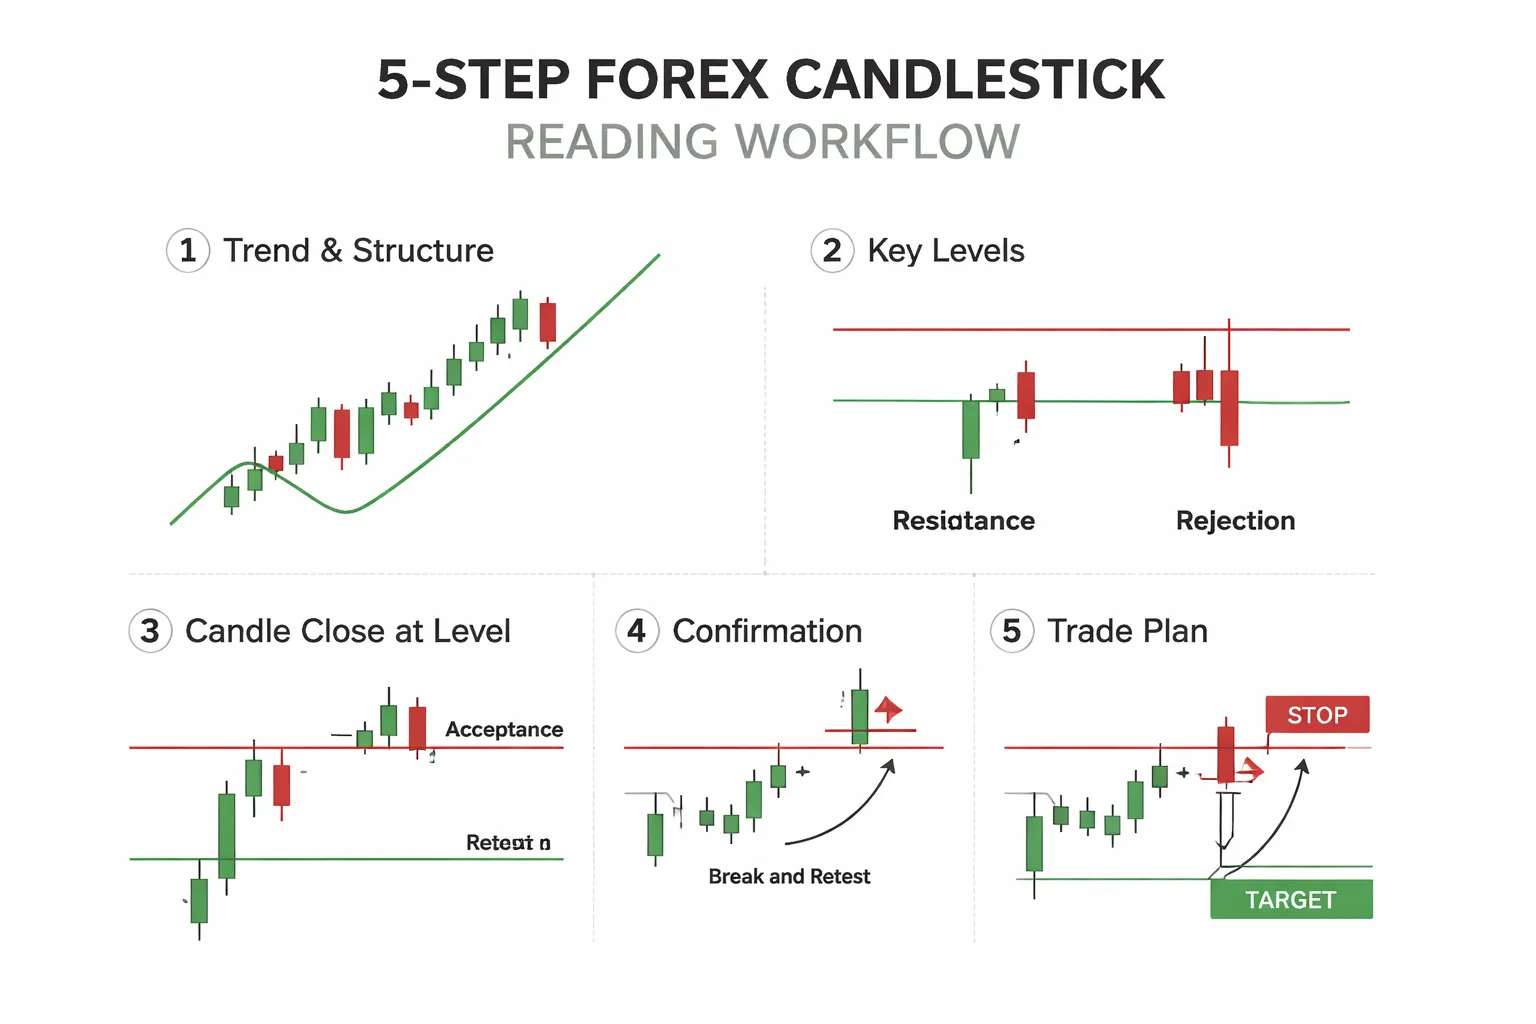
Step 1: Identify the current trend and market structure
Start with a higher timeframe than you trade. If you trade on M15, check H1 and H4 first.
- Uptrend: higher highs and higher lows.
- Downtrend: lower highs and lower lows.
- Range: repeated highs and lows, no clear progression.
Mark the last two swing highs and swing lows. You need them to judge breaks and to avoid forcing a trend that is not there.
Then check where price sits right now. Near prior highs, prior lows, or mid-range. Location changes how you read the next candles.
Step 2: Mark key levels (support, resistance, supply, demand)
Use clean levels. Do not draw a line through every wick.
- Start with obvious swing highs and swing lows.
- Convert lines into zones when wicks cluster over a small price band.
- Keep 3 to 6 key areas on your chart. More creates noise.
Prioritize levels that show multiple reactions and clear displacement away from the area. Ignore “levels” that price sliced through with no pause.
Step 3: Read candle closes around levels (acceptance vs rejection)
At a level, the close matters more than the wick.
- Rejection: price tests the level, leaves a wick, then closes back inside the prior range or away from the level.
- Acceptance: price closes beyond the level and holds that side, with less wick and more body.
Use a simple checklist on the signal candle:
- Did it close above resistance or below support, or did it close back inside?
- Is the candle body large relative to recent candles, or did it stall?
- Do you see repeated wicks into the same area, showing failed follow-through?
One wick does not equal a level. One close does not equal a breakout. You need context and the next candle.
Step 4: Look for confirmation (next candle, break, retest)
Do not trade the first touch by default. Let price confirm.
- After rejection: you want the next candle to continue away from the level, not return to it.
- After acceptance: you want price to hold beyond the level, then either continue or retest and bounce.
Common confirmation triggers you can use:
- Next candle closes in the direction of the signal.
- Break of a nearby swing high or swing low in the direction you want.
- Retest of the broken level that holds, then a continuation close.
If price breaks a level and instantly snaps back, treat it as failed acceptance. Stand aside or flip your bias only after a clean close back inside.
Step 5: Translate the read into an actionable trade plan
Write the plan before you click buy or sell. Keep it mechanical.
- Direction: aligned with structure, or a range trade at a boundary.
- Entry: on confirmation close, or on the retest that holds.
- Stop loss: beyond the level that invalidates your idea, not inside the noise.
- Take profit: at the next logical level, not at a random number.
- Risk: fixed percent or fixed amount per trade.
| Chart read | What you do | Invalidation | Target logic |
|---|---|---|---|
| Rejection at resistance in a downtrend | Plan a short after bearish confirmation close | Close above the rejection zone | Next support zone or prior swing low |
| Acceptance above resistance in an uptrend | Plan a long on hold above, or on retest that holds | Close back below the broken level | Next resistance zone or prior swing high |
| Range, price at range low | Plan a long only after rejection and follow-through | Close below range support | Mid-range first, then range high |
Set targets from structure. If you need a clear method, use this guide on how to set take profit in forex.
The “Message” of Candles: Momentum, Rejection, and Control
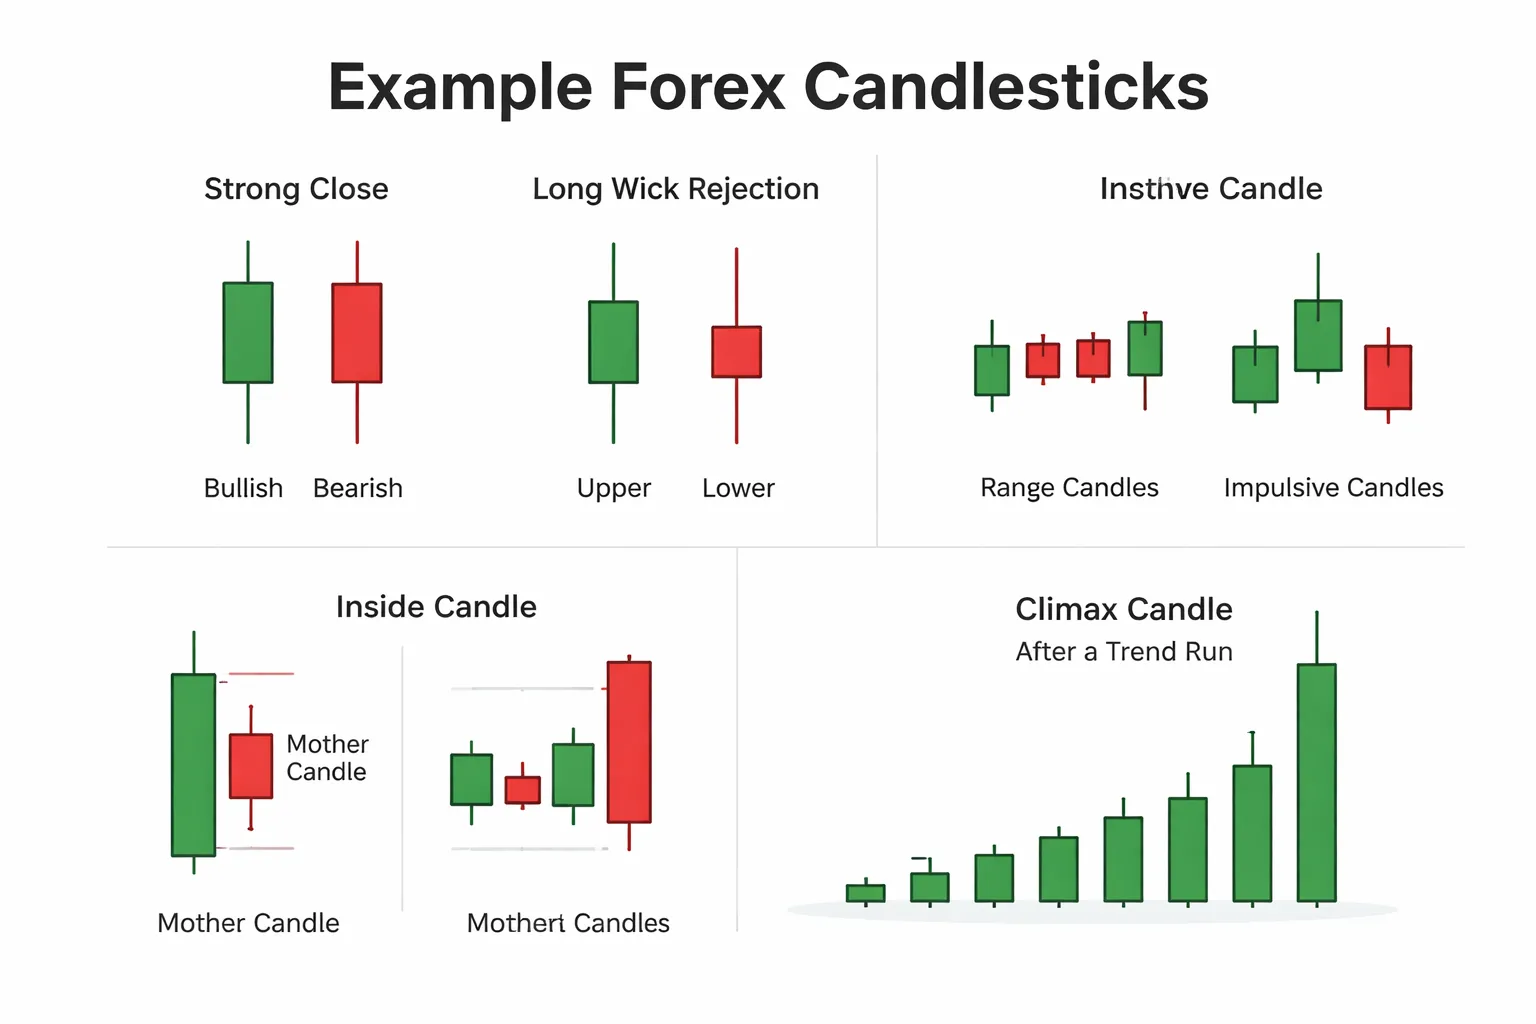
Strong closes, follow-through, and control
A candle close tells you who controlled the end of that session.
- Strong bullish close near the high, buyers stayed in control into the close. You often get follow-through if the next candle holds above the close or breaks the high.
- Strong bearish close near the low, sellers kept control into the close. You often get follow-through if the next candle holds below the close or breaks the low.
- Big body, small wicks, price moved with less rejection. Momentum stayed clean.
- Small body, big wicks, control changed hands during the candle. Momentum looked weaker.
Use strong closes to filter trades. If you plan to trade a breakout, you want a close beyond the level, not just a wick through it.
Long wicks, liquidity grabs, and failed moves
Long wicks show rejection. Price pushed into an area, met orders, then snapped back.
- Upper wick, buyers pushed up, sellers hit back. This often shows a failed push into resistance or a sweep of recent highs.
- Lower wick, sellers pushed down, buyers absorbed it. This often shows a failed push into support or a sweep of recent lows.
- Wick through a key level, close back inside, you often see trap behavior. Breakout traders enter, then get forced out.
Trade the message, not the shape. A long wick matters most at clear structure, prior highs and lows, range edges, and round levels. Combine it with the next candle. Rejection needs follow-through.
Inside candles, compression, and pending expansion
An inside candle sits fully inside the prior candle’s high and low. It signals contraction.
- Range shrinks, both sides pause. Orders build.
- Break of the inside candle range, you often get expansion. The direction depends on context, trend, and nearby levels.
- Inside candle at support or resistance, it often acts like a pause before the next leg. You wait for a clean break and close.
Mark the mother candle high and low. Use them as short-term boundaries. Your trade plan should define which side triggers your entry and where your invalidation sits.
Range candles vs impulsive candles, spotting transitions
Price alternates between balance and imbalance.
- Range candles, overlapping bodies, mixed wicks, small net progress. This shows two-sided trade and weak directional edge.
- Impulsive candles, large body, limited overlap, close near the extreme. This shows one side hitting the market with size.
- Transition clues, ranges that start printing stronger closes at one edge, then a clean impulsive break. This often marks a shift in control.
In ranges, you focus on rejection at the edges and targets toward the middle, then the far edge. In impulse, you focus on pullbacks, holds, and continuation structure. If you need a full plan, follow this beginner roadmap.
Climax candles and exhaustion risk
A climax candle is a large candle that prints after an extended push. It can signal exhaustion, not strength.
- Big range after a multi-candle run, late entries rush in. Smart money often takes profit into that flow.
- Climax into a major level, risk of reversal or consolidation rises. You often see a pullback or a tighter range next.
- Climax with long wick, the move failed to hold the extreme. This raises reversal odds.
Do not chase climax candles. You wait for the next candle to confirm. You want either continuation with a hold above or below, or a clear reversal signal with structure.
Essential Single-Candle Patterns (With Plain-English Meanings)
Hammer and Hanging Man, Same Shape, Different Context
Both have a small real body and a long lower wick. The lower wick should be at least 2 times the body. The upper wick should be small.
- Hammer (after a drop). Sellers pushed price down, buyers forced it back up. You read it as rejection of lower prices.
- Hanging man (after a rally). Sellers showed up and drove price down during the candle. Buyers recovered part of it. You read it as a warning that the up move may weaken.
How you use it. You do not trade the candle alone. You wait for the next candle to confirm. For a hammer, you want a close above the hammer high or at least a higher close. For a hanging man, you want a close below the hanging man low or a clear lower close.
Shooting Star and Inverted Hammer, Upside Rejection vs Basing
Both have a small real body and a long upper wick. The upper wick should be at least 2 times the body. The lower wick should be small.
- Shooting star (after a rally). Buyers pushed price up, sellers forced it back down. You read it as rejection of higher prices.
- Inverted hammer (after a drop). Buyers managed a push higher, but price closed back near the open. You read it as early demand, but it still needs proof.
How you use it. For a shooting star, you want the next candle to close below its low or show lower highs. For an inverted hammer, you want the next candle to close above its high or at least hold above its midpoint.
Marubozu Candles, Strong Conviction and Continuation Bias
A marubozu has a large body and little to no wick. It shows one side controlled the whole session.
- Bullish marubozu. Open near the low, close near the high. Buyers stayed in control. You expect follow-through unless price hits a major level.
- Bearish marubozu. Open near the high, close near the low. Sellers stayed in control. You expect follow-through unless price hits a major level.
How you use it. You treat it as momentum. You avoid buying directly into resistance or selling into support. You prefer a pullback entry toward the candle midpoint, with a stop beyond the candle low for longs, or beyond the candle high for shorts. You also watch for breakout traps, especially after a large range candle near a key level. Use a clear breakout plan if you trade these moves.
Spinning Tops, How to Avoid Overtrading Indecision
A spinning top has a small body and wicks on both sides. It shows balance and hesitation.
- Plain-English meaning. Price moved up and down, but closed near the open. Neither side won.
- Best use. It flags a decision point, not a signal.
How you avoid overtrading. You do not take a trade just because you see one. You wait for a break and close beyond the spinning top high or low, or you wait for a clean rejection at a level with a larger follow-through candle. If you see several spinning tops in a row, you treat it as chop. You reduce size or stand aside.
Pin Bars, Strict Criteria Beginners Should Use
A pin bar is a rejection candle. Most beginners label too many candles as pin bars. Use strict rules.
- Wick-to-body rule. The rejection wick should be at least 2 to 3 times the body.
- Small opposite wick. The other wick should be small. If both wicks are long, it is indecision.
- Close location. For a bullish pin bar, the close should be in the top third of the full range. For a bearish pin bar, the close should be in the bottom third.
- Location rule. You want it at a clear level. Support, resistance, prior swing high or low, or a clean trend pullback zone.
- Confirmation rule. You want the next candle to take the pin bar high for bullish, or take the low for bearish, and hold.
How you place risk. You put the stop beyond the wick tip. If the wick gets taken out, the rejection failed. You avoid pin bars that form inside a tight range unless you also get a range break and close.
Essential Two- and Three-Candle Patterns Beginners Should Know
Engulfing patterns: quality filters that improve accuracy
An engulfing pattern uses two candles. The second candle’s real body covers the first candle’s real body. Wicks do not matter as much as the body.
- Best location. Trade engulfing candles at clear support or resistance, prior swing points, or a trend pullback zone.
- Size matters. Favor a second candle that is larger than recent candles. A small engulfing candle inside noise often fails.
- Close matters. For bullish engulfing, you want the second candle to close near its high. For bearish engulfing, near its low. Weak closes signal weak control.
- Engulf the right candle. Stronger when the first candle is a clear push into the level, then the engulfing candle reverses it.
- Context filter. Avoid taking a bullish engulfing straight into nearby resistance. Avoid taking a bearish engulfing straight into nearby support.
- Confirmation. Conservative entry waits for price to break the engulfing candle high for bullish, or low for bearish, and hold.
- Risk placement. Place the stop beyond the engulfing candle’s opposite wick. If that wick breaks, the reversal thesis failed.
Harami patterns: what they do and don’t indicate
A harami is a two-candle pattern where the second candle’s body sits inside the first candle’s body. It signals slowdown, not a reversal by itself.
- What it indicates. Momentum pauses. The market compresses. Traders wait for new information.
- What it does not indicate. It does not prove a trend change. Many haramis break in the trend direction and continue.
- How to use it. Treat it like a mini range. Plan a trade only after a clean break and close beyond the harami range.
- Best location. Near a level you already respect. Without a level, the pattern has little value.
- Common mistake. Entering on the harami close. You often get chopped because the market has not picked a direction yet.
Piercing line and dark cloud cover: reversal clues near levels
These are two-candle reversal patterns. They work best when they form right at support or resistance.
- Piercing line (bullish). First candle is bearish. Second candle opens lower, then closes above the midpoint of the first candle’s body.
- Dark cloud cover (bearish). First candle is bullish. Second candle opens higher, then closes below the midpoint of the first candle’s body.
- Level dependency. You want a clear level. Without a level, these become random two-candle sequences.
- Quality filter. The deeper the second candle closes through the first candle’s body, the stronger the reversal pressure.
- Confirmation. Wait for the next candle to push beyond the pattern’s high for bullish, or low for bearish, and hold.
- Risk placement. Stop goes beyond the pattern extreme. Target the next structure level, not an arbitrary number of pips.
Morning star and evening star: structure, not just shapes
These are three-candle reversal patterns. The logic matters more than the picture.
- Morning star (bullish). Strong bearish candle, then a small candle that shows hesitation, then a strong bullish candle that closes well into the first candle’s body.
- Evening star (bearish). Strong bullish candle, then hesitation, then a strong bearish candle that closes well into the first candle’s body.
- Key requirement. The third candle must show real displacement. A weak third candle turns the pattern into noise.
- Where it works. At major support or resistance, or at the end of a clean pullback in a trend.
- How you trade it. Enter on a break of the third candle’s high for a morning star, or low for an evening star. Place the stop beyond the pattern’s extreme.
- When to skip. Skip if the pattern forms mid-range, or if the third candle closes into nearby opposing structure.
Three white soldiers and three black crows: continuation vs late entry risk
These are three-candle sequences that show strong control. They often appear during trend continuation, but they can also mark exhaustion.
- Three white soldiers. Three strong bullish candles with higher closes. Bodies are decent size. Wicks stay small.
- Three black crows. Three strong bearish candles with lower closes. Bodies are decent size. Wicks stay small.
- Continuation use. Best after a breakout and retest, or after a pullback that holds a trend level. You use them as confirmation that the trend resumed.
- Late entry risk. After three strong candles, price often pulls back. Buying the third soldier or selling the third crow can give you a poor entry and a wide stop.
- Practical tactic. Mark the sequence high and low. Wait for a pullback and hold, or wait for a small consolidation and break.
- Extra filter. If the third candle runs into a major level, treat it as a warning, not a buy or sell signal.
If you want one rule that keeps you safe, you trade these patterns at levels, then you demand confirmation, then you control risk. Put those rules into your trading plan so you execute the same way every time.
Using Candlestick Patterns in Context (Where Competitors Often Fall Short)
Pattern location, levels beat pattern names
Most traders lose here. They trade a candlestick name. They ignore where it forms.
Your first job is to map the nearest swing highs and swing lows. Mark the zones that price respected at least two times. Give more weight to levels that caused fast moves and big candles.
Then judge the pattern by its location.
- At support: bullish rejection patterns matter more. Bullish engulfing, hammer, morning star.
- At resistance: bearish rejection patterns matter more. Bearish engulfing, shooting star, evening star.
- In the middle of a range: most patterns have low value. You need a clear edge or you skip.
Use a simple rule. If you cannot point to the level in one sentence, you do not have a trade.
Trend alignment, reversals vs pullbacks
Context changes everything. A reversal trade fights the current flow. A pullback trade uses it.
- Reversal setup: you trade a turn after an extended move into a major level. You require stronger confirmation. You keep targets realistic.
- Pullback setup: you trade a bounce in the direction of the trend after a retrace into support or resistance. You can accept simpler confirmation.
If you do not know the trend on your trading timeframe, you will force patterns. Keep it mechanical. Higher highs and higher lows means uptrend. Lower highs and lower lows means downtrend.
If you want a clean way to define trend, use moving averages and price structure. Keep the rules consistent. Link your filter to your plan, not to your mood. Use this guide to tighten that step, moving averages in forex.
Confluence checklist, volume, ATR, moving averages
Patterns work best when other facts agree. You do not need ten indicators. You need three checks you can repeat.
- Volume, if you have it: look for above average volume on the rejection candle or the confirmation candle. Low volume signals weak participation. Spot FX volume data varies by broker, so treat it as a supporting clue, not proof.
- ATR and volatility: measure the current ATR. If the pattern candle is tiny versus ATR, the signal often lacks force. If the pattern candle is huge versus ATR, spreads and slippage risk rise, and stops often need to be wider.
- Moving averages: use them as a direction and location filter. In an uptrend, patterns that form above a rising MA and reject toward it tend to behave better than patterns below a falling MA.
One hard rule helps. Your stop distance must make sense versus ATR. If your stop sits inside normal noise, you will get clipped.
Avoiding pattern spotting bias, why perfect setups fail
Your brain will find patterns everywhere. Markets do not care.
- News and session shifts: a clean engulfing candle can fail when liquidity changes. Treat pre news patterns as lower quality.
- Level strength matters: a pattern at a weak level is still weak. One touch does not equal support or resistance.
- Order flow can run stops: price can print a textbook reversal, then sweep the level once more, then move. If you enter too early, you become the liquidity.
- Range conditions: trending patterns fail in chop. Reversal patterns fail in strong trends.
Fix this with two habits. Backtest your exact rules. Track screenshots. You will see which contexts pay and which contexts drain your account.
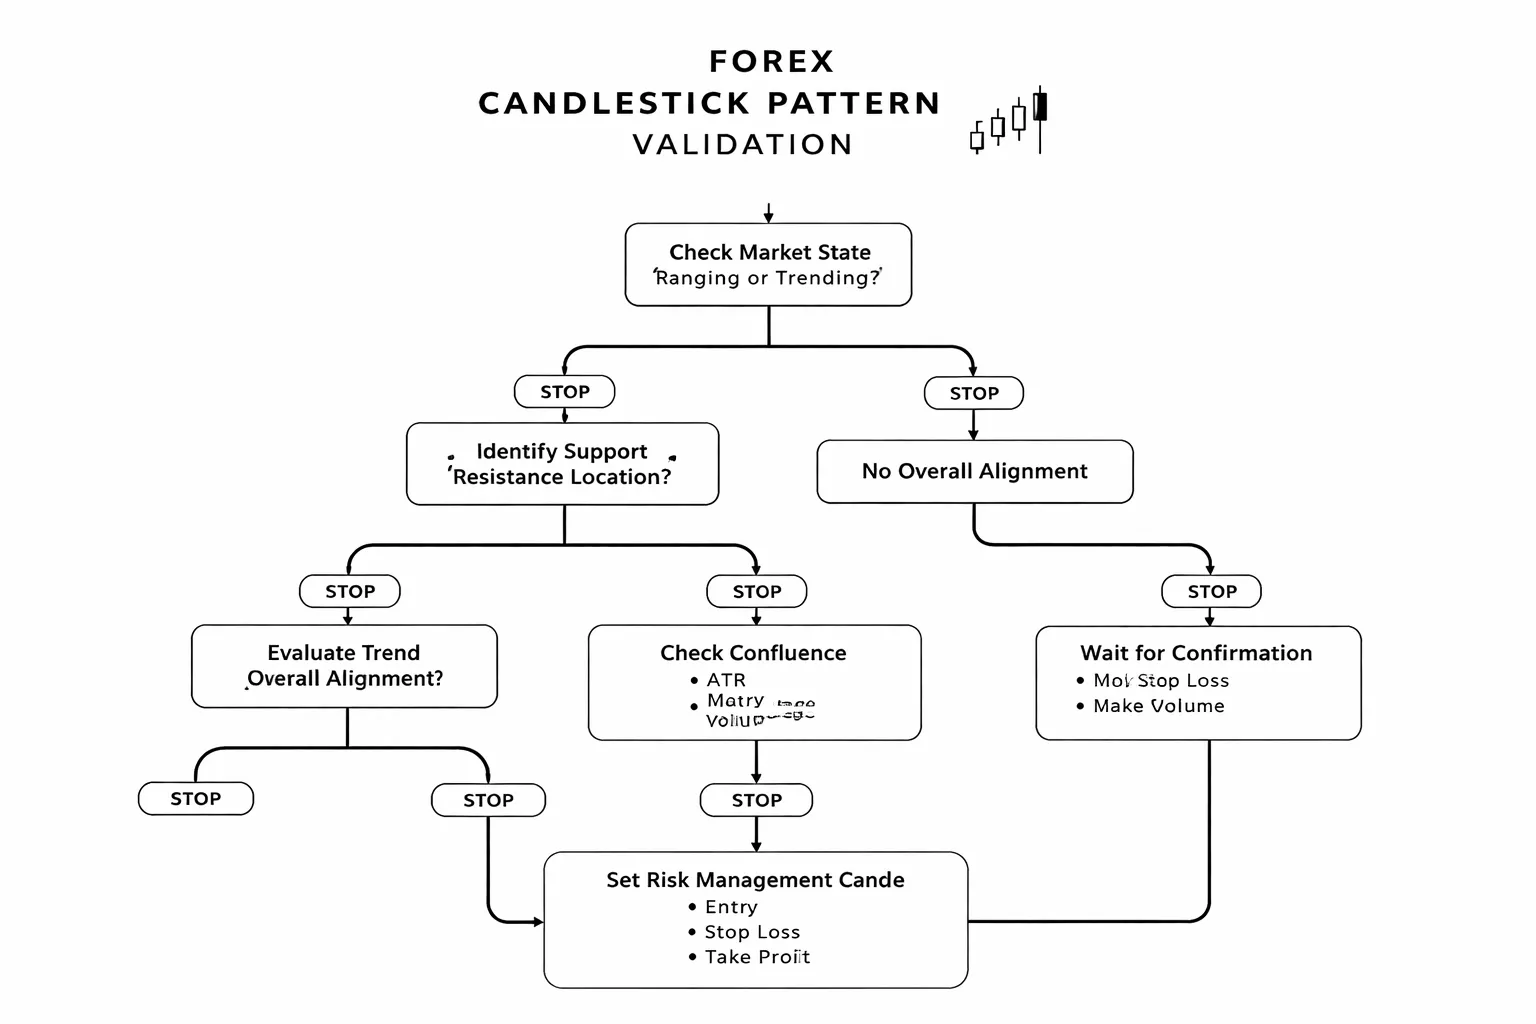
A simple decision tree for pattern validation
Use a small checklist you can follow fast. Keep each step binary. Yes or no.
This tree keeps you out of random trades. It also makes your results measurable. You can log which step failed and improve one part at a time.
Risk Management When Trading Candlestick Signals
Where to place stops logically
Your stop must sit where your candlestick idea is wrong. Put it beyond the wick and beyond the level, not inside the noise.
- Wick-based stop: For a bullish signal, place the stop a few pips below the signal candle’s low. For a bearish signal, place it a few pips above the signal candle’s high.
- Level-based stop: If you trade a signal off support or resistance, place the stop beyond that level. Do not place it on the level. Give price room to retest.
- Pattern plus level: If a pin bar forms at support, the strongest invalidation is below the wick and below support. If you cannot afford that stop size, skip the trade.
- Use a buffer: Add a small buffer to cover spread and normal flicks. Many traders use 1 to 3 pips on majors, more on volatile pairs. Base it on recent spread and average candle size.
Setting targets
Set exits before you enter. Keep them tied to structure and to R multiples.
- R-multiples: Define R as your stop size. If your stop is 20 pips, 1R equals 20 pips. A 2R target equals 40 pips.
- Structure-based exits: Aim for the next obvious swing high or swing low, a prior daily high or low, or a clear supply or demand zone. If structure sits too close to your entry, your reward-to-risk is poor. Skip.
- Partials: Many traders scale out. Example, take partial profit at 1R, then trail the stop or target the next level. Keep the rule consistent so you can measure it.
- Time stop: If price does not move away from the level after a set number of candles, exit. Stagnant trades often turn into stop-outs.
Position sizing basics for Forex
Control risk with position size, not hope. Pick a fixed account risk per trade, then size your lot from stop distance.
- Step 1: Choose account risk. Many beginners start at 0.25% to 1% per trade.
- Step 2: Measure stop distance in pips from entry to stop.
- Step 3: Convert risk into lot size using pip value.
| Item | What it means |
|---|---|
| Lot size | Units of currency you trade. Standard lot is 100,000 units, mini is 10,000, micro is 1,000. |
| Pip value | Money gained or lost per pip. It varies by pair and account currency. |
| Risk per trade | Your maximum planned loss if the stop hits, including spread. |
Simple sizing logic: Lot size equals account risk divided by (stop in pips times pip value). If you do not know pip value, use your platform’s position size tool and validate the dollar risk shown before you place the trade.
Managing spreads and slippage around news
Candlestick signals fail more often when execution conditions change. News can turn a clean wick into a fill far from your stop or entry.
- Watch the spread: If spreads widen, your entry gets worse and your stop gets easier to hit. Treat the widened spread as part of your risk.
- Expect slippage: Market orders can fill away from price. Stops can slip too. Your real loss can exceed your planned loss.
- Reduce size or stand down: If major releases hit soon, trade smaller or skip. A good setup is not enough if execution is unstable.
- Use limits with care: Limit orders control price, but you may miss the trade. Do not chase after a missed fill.
Common risk mistakes
- Moving stops: Do not move your stop farther away to avoid a loss. You turn a planned loss into an unplanned one.
- Overleveraging: Large lot sizes make small moves fatal. Keep risk small and consistent.
- Revenge trading: After a loss, do not force the next candle signal. Take a break, then follow your checklist again.
- Ignoring correlation: Two trades on highly correlated pairs can act like one oversized position. Treat combined exposure as one risk bucket.
- No routine: If you do not track setups, stops, and outcomes, you will repeat the same mistakes. Use structured practice and review, see a structured demo and replay routine.
Practical Examples: Reading Candles on Real Forex Scenarios (No Strategy Hype)
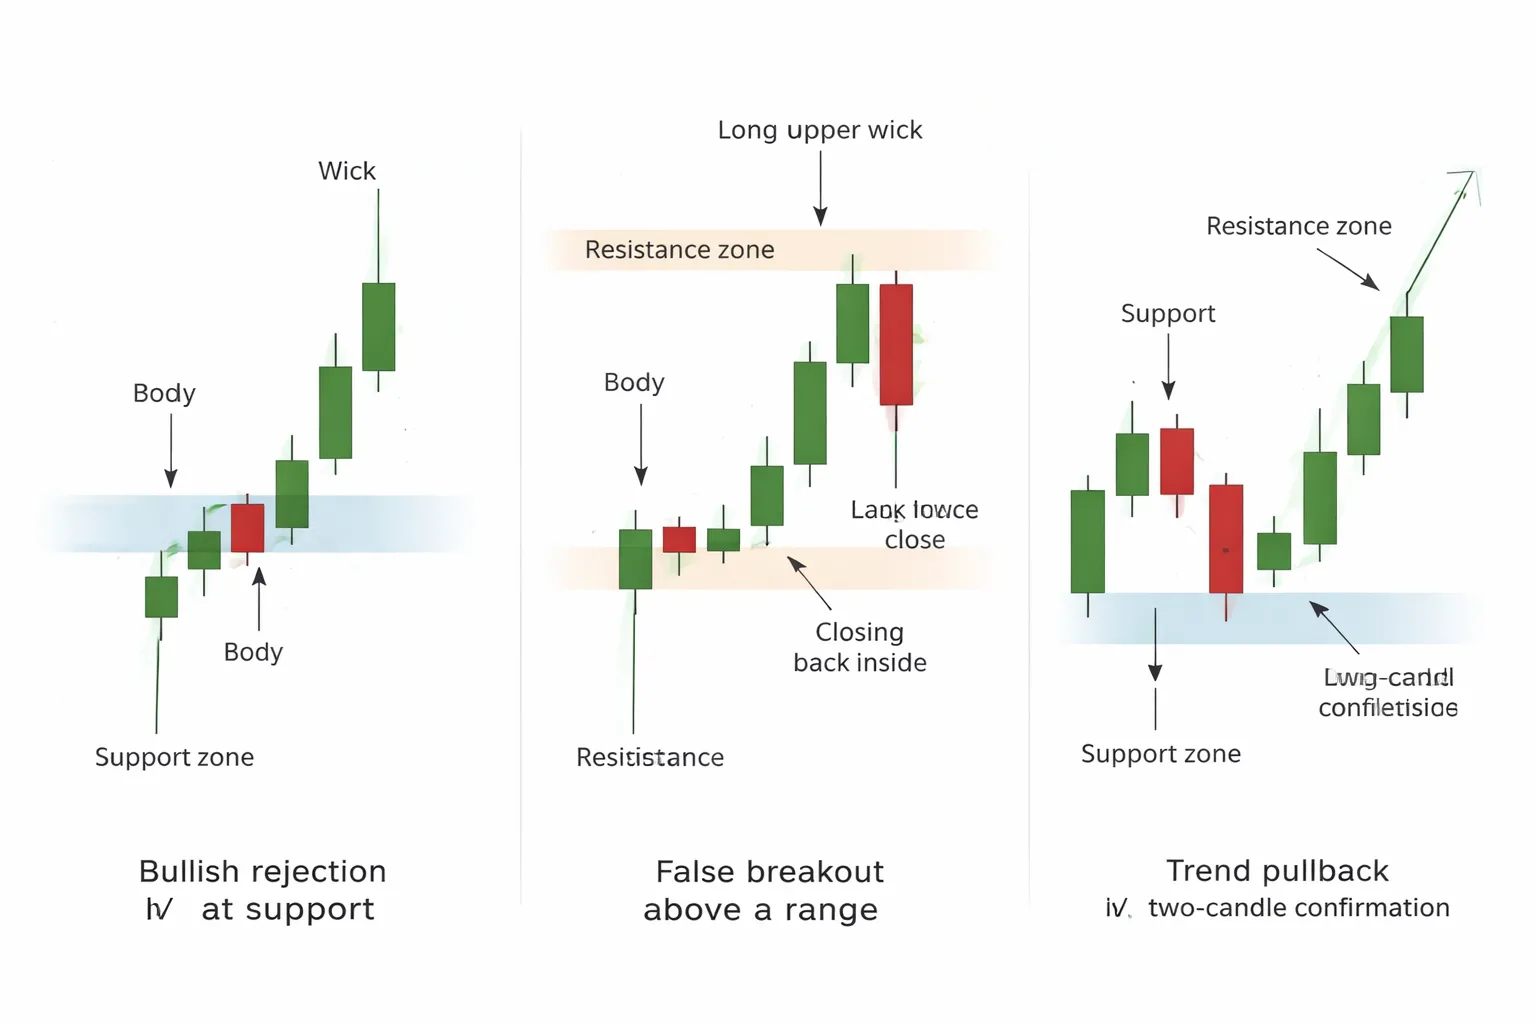
Example 1: Bullish rejection at support followed by confirmation close
You start with a clear support zone. Use a zone, not a single line. Mark it from repeated lows or a prior swing base on the same timeframe you trade.
- Context. Price trades down into support after a decline or a pullback.
- Rejection candle. The candle dips into the zone and closes back above it. The lower wick is large relative to the body. The close sits in the upper half of the candle range.
- What it means. Sellers pushed below support and failed. Buyers absorbed that push and reclaimed the zone by the close.
- Confirmation close. The next candle closes above the rejection candle’s high, or at least closes strong and stays above the support zone.
- What you record. Distance from close to support, wick length as a rough multiple of body, and whether the next candle closed above the prior high.
| Checklist item | Minimum you want to see | What you do if missing |
|---|---|---|
| Support location | At least 2 touches or a clean prior base | Skip, or mark it as low quality |
| Rejection close | Close back above the zone, upper half close | Wait for a better close, no early trade |
| Next candle confirmation | Closes above rejection high or holds above zone | Stand down, do not force a signal |
Example 2: False breakout with long wick and range continuation
You start with a defined range. You need at least two clear touches on both the top and bottom. The more obvious the range, the more traders will react to the edges.
- Context. Price sits in a horizontal range. Volatility compresses or stays steady. No clean higher highs or lower lows.
- Breakout attempt. A candle pushes above range resistance.
- Failure signal. That candle closes back inside the range. It leaves a long upper wick above resistance. The close sits near the middle or lower part of the candle.
- What it means. Breakout buyers got trapped. Sellers used the liquidity above the range to sell into strength.
- Follow-through you want. The next 1 to 3 candles hold inside the range and respect the broken level from below. You often see a drift back toward the range midpoint.
- What you avoid. Calling every wick a false breakout. If price closes above the range and holds, you treat it as acceptance, not failure.
| Range and wick check | What you measure | Practical note |
|---|---|---|
| Range quality | Touches and clean reactions | Messy ranges create messy signals |
| Close location | Inside range, not on the edge | Edge closes often retest and break later |
| Wick size | Wick clearly larger than body | Small wick equals weak evidence |
Example 3: Trend pullback setup using a two-candle confirmation
You start with a trend you can define with structure. Higher highs and higher lows for an uptrend. Lower highs and lower lows for a downtrend. Then you wait for a pullback into an area that matters.
- Context. Price trends, then pulls back to a prior swing level, a trendline touch, or a moving average you track. Keep it simple and consistent.
- Candle 1, pullback candle. A down candle in an uptrend, or an up candle in a downtrend. It pushes into the pullback area and slows.
- Candle 2, confirmation candle. It closes in the trend direction and closes above Candle 1 high in an uptrend, or below Candle 1 low in a downtrend.
- What it means. The pullback loses control and the trend side resumes. You get structure plus confirmation, not a single candle guess.
- Common failure. Candle 2 closes weak and stalls inside the pullback area. That often leads to deeper pullback or range.
| Trend pullback check | Uptrend version | Downtrend version |
|---|---|---|
| Trend structure | Higher highs and higher lows | Lower highs and lower lows |
| Pullback location | Into prior swing support area | Into prior swing resistance area |
| Two-candle confirmation | Candle 2 closes above Candle 1 high | Candle 2 closes below Candle 1 low |
How to journal screenshots and notes for faster learning
You learn faster when you can review patterns without relying on memory. Keep your journal small and structured. Focus on what you saw, what you did, and what happened next.
- Take two screenshots. One at entry decision time, one after the move completes or at the session end. Include timeframe and pair in the screenshot.
- Mark three prices. Planned entry, invalidation level, and the nearest structure target. Even if you did not trade, mark the levels you would have used.
- Write a 5 line note. Context, signal candle facts, confirmation facts, risk note, result. Use numbers where possible.
- Tag the setup. Use tags like “support rejection, confirmed” or “false breakout, range”. Keep tags consistent so you can filter later.
- Track outcomes in a table. Setup tag, timeframe, did confirmation occur, max favorable move in pips, max adverse move in pips, final outcome.
- Review weekly. Count how often confirmation worked by pair and timeframe. Drop the tags that never show follow-through.
- Use a repeatable practice loop. Follow a structured demo and replay routine so your screenshots match the same process each time. See how to practice forex trading effectively.
| Journal field | Example entry | Why it matters |
|---|---|---|
| Setup tag | Support rejection, confirmed | Lets you filter and count outcomes |
| Signal facts | Lower wick 2x body, close above zone | Keeps you honest about what you saw |
| Confirmation | Next candle close above prior high | Separates clean from forced trades |
| MFE and MAE | MFE 38 pips, MAE 12 pips | Shows if your idea had room to work |
Best Tools and Settings for Candlestick Charting
Recommended Chart Types and Candle Colors for Clarity
Use candlestick charts for entry and exit decisions. Keep the layout clean.
- Chart type: Standard candlesticks. Avoid Heikin Ashi until you can read normal candles fast. Heikin Ashi smooths price and can hide exact open and close.
- Timeframes: Pick two. One for context, one for execution. Example, 4H for structure and 15M for entries. If you scalp, use 1H and 5M. If you swing, use Daily and 4H.
- Session view: Mark London and New York open. Most clean moves and breaks happen there.
- Candle colors: Use high contrast. Green for bullish, red for bearish. Use a dark background with bright candles, or a light background with dark candles. Do not use similar shades.
- Wicks and borders: Keep wicks visible and thin. Add borders if your candles blend into the background.
- Price scale: Use a regular scale. Avoid log scale for most FX pairs.
Key Indicators That Pair Well With Candlesticks (Minimal Set)
Start with tools that answer one question each. Trend, level, volatility, and timing.
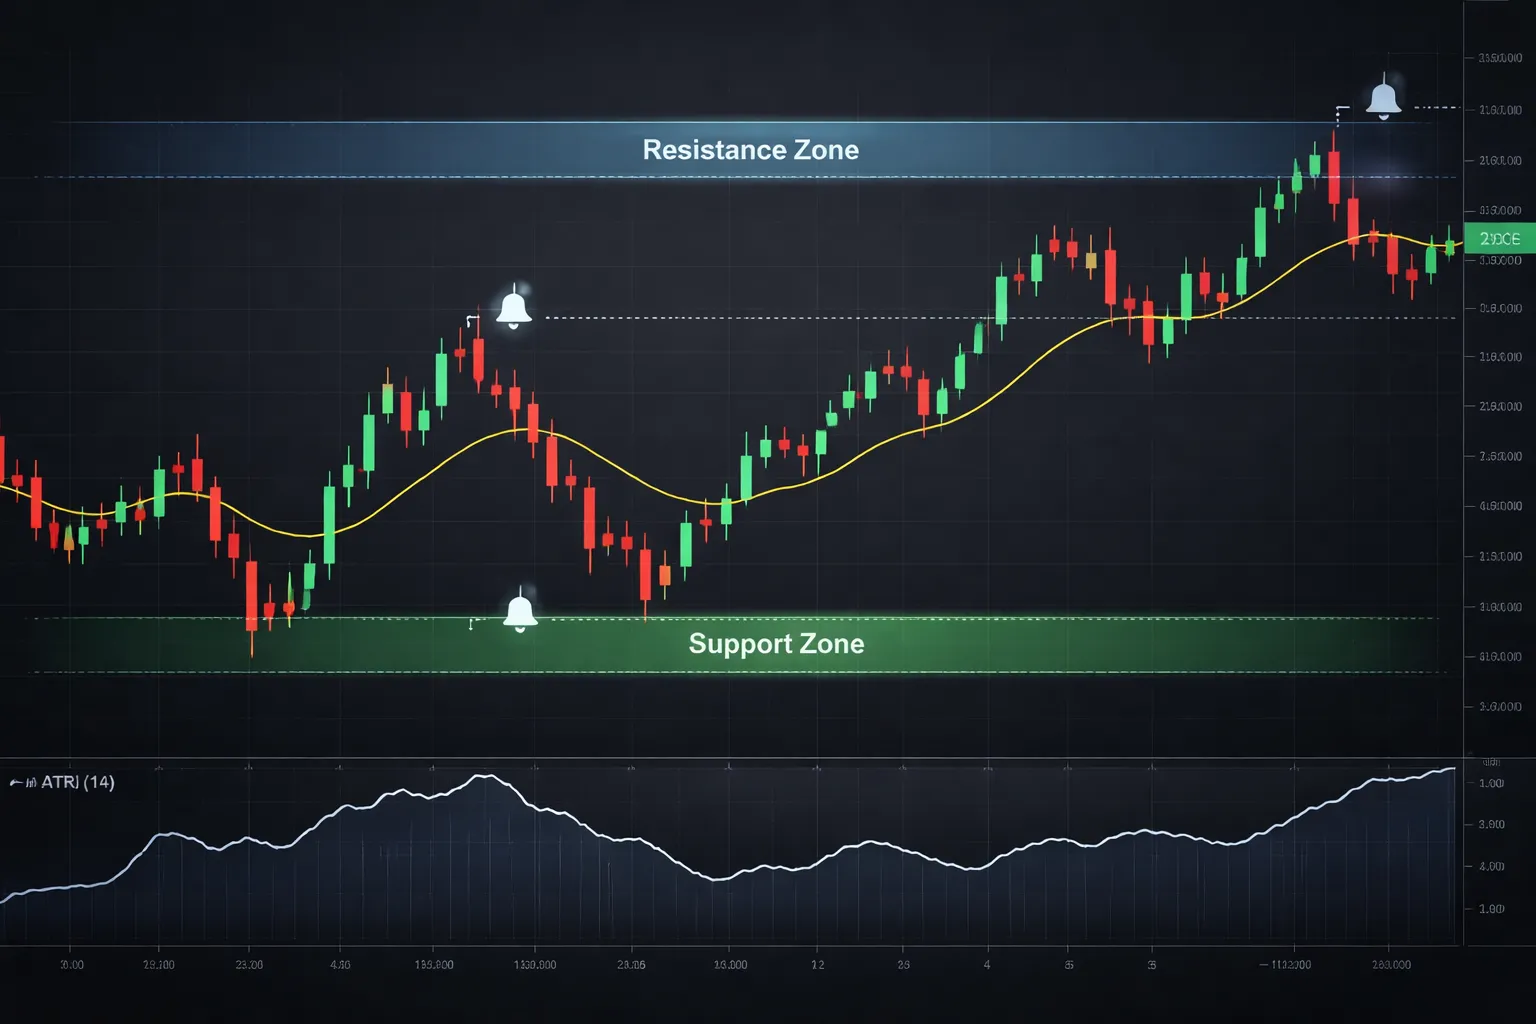
- Horizontal levels: Support and resistance zones. Draw from swing highs and lows. Use zones, not single lines. Keep 3 to 6 key zones on screen.
- One moving average: Use 20 EMA or 50 EMA. Treat it as a trend filter, not a signal. Price above and holding suggests bullish bias, below suggests bearish bias.
- ATR (14): Use it for stop distance and expectations. If ATR on your entry timeframe is 12 pips, a 4 pip stop usually fails from noise.
- Volume: Spot FX volume is broker based. If your platform offers tick volume, use it only as a rough activity gauge during breaks and rejections.
Platform Tips (TradingView, MT4, MT5): Templates and Alerts
Build one template and reuse it. Save time and cut mistakes.
- One layout per style: Create a single chart template for your main setup. Include candles, zones, one EMA, ATR, and nothing else.
- Name your template clearly: Example, “SR + 20EMA + ATR”. Do not keep ten versions.
- Set alerts on levels, not patterns: Alert when price reaches your zone. Then you watch the candle close. This stops you from staring at charts.
- Use candle close rules: If you trade 15M, wait for the 15M candle to close. Do not trigger off an unfinished wick.
- TradingView: Use “Add alert” on horizontal rays and trendlines. Set “Once per bar close” when you can. Save a layout with two timeframes side by side.
- MT4 and MT5: Use templates and profiles. Save a profile for each market watch list. Use price alerts on key levels, then confirm with your candle rules.
How to Avoid Indicator Overload as a Beginner
More indicators do not give you more edge. They often give you more excuses.
- Limit tools to four jobs: trend filter, levels, volatility, timing. If two tools do the same job, remove one.
- Do not stack oscillators: RSI plus Stoch plus MACD usually repeats the same signal in different forms.
- Audit every tool: Write one sentence for why it stays. Example, “ATR sets my stop and target range.” If you cannot write that sentence, delete it.
- Run a two week test: Trade or replay with the minimal set only. Track outcomes. Add tools only if they improve your stats, not your comfort.
- Control trade frequency: Alerts plus rules reduce random clicks. If overtrading shows up, use a simple checklist and limits. Link to how to avoid overtrading in forex.
Limitations of Candlestick Analysis (Pros, Cons, and Realistic Expectations)
Error: Invalid type for 'messages[1].content': expected one of a string or array of objects, but got a boolean instead.FAQ
What does one candlestick show?
One candlestick shows price action for a set period. It prints the open, high, low, and close. The body marks the open to close range. The wicks mark the highest and lowest prices reached during that period.
What timeframes should you use as a beginner?
Start with higher timeframes. Use the daily and 4-hour charts to reduce noise. Drop to 1-hour only after you can read clean trends and key levels. Match your timeframe to your holding time and risk limits.
How do you read bullish and bearish candles?
A bullish candle closes above its open. A bearish candle closes below its open. The size of the body shows drive. Long wicks show rejection. Always judge candles at a clear support or resistance level.
Which candlestick patterns matter most for beginners?
Focus on a short list. Pin bar, engulfing candle, and inside bar. These show rejection, reversal pressure, or compression. Trade them only when they form at a key level and align with the higher timeframe trend.
Why do candlestick patterns fail?
They fail when you trade them in the middle of a range, ignore trend, or skip confirmation. They also fail in low liquidity or during news spikes. Treat patterns as context, not signals on their own.
What is confirmation for a candlestick setup?
Confirmation means price follows through. Examples include a close beyond a level, a break of a pattern high or low, or a retest that holds. You can also use a momentum check like the MACD indicator for basic direction and slowing momentum.
How do you set stop loss using candlesticks?
Place your stop beyond the candle that defines invalidation. For a pin bar, place it beyond the wick. For an engulfing setup, place it beyond the pattern low or high. Keep the stop outside normal noise, then size your trade.
Can you trade with candlesticks alone?
You can, but you should still use structure. Mark support and resistance, trend, and session context. Candles show how price reacts. Levels show where it matters. Combine both to avoid random entries.
Do candlestick colors matter?
Color helps you read direction fast, but it changes nothing. Focus on open, close, range, and where the candle forms. A small body with long wicks signals rejection regardless of color scheme.
How many candles do you need to confirm a reversal?
Use price, not a fixed count. One strong candle at a key level can be enough if the next candle breaks and closes with follow-through. If price stalls or prints mixed candles, treat it as indecision and wait.
What does a long wick mean?
A long upper wick shows sellers pushed price down from higher levels. A long lower wick shows buyers pushed price up from lower levels. The meaning strengthens when the wick rejects a known support or resistance zone.
How do candlesticks relate to chart patterns?
Candles show the micro story inside a pattern. Use them to time entries near breakouts, retests, and failed breaks. For the bigger structures, use classic setups like triangles and flags from forex chart patterns.
Conclusion
Conclusion
Candlesticks help you read intent. The body shows control. The wicks show rejection. Location does the heavy work. A strong signal forms at support or resistance, or at a clear breakout and retest.
Keep your process tight.
- Mark the trend and key levels first.
- Drop to your entry timeframe and wait for a clean close, not a mid candle guess.
- Use one pattern you can spot fast, then repeat it.
- Place your stop beyond the level the candle rejected, not inside the noise.
- Skip trades with poor payoff. Use a fixed rule based on risk-reward ratio.
Final tip. Take screenshots of every trade. Log the level, the candle signal, the timeframe, the stop, and the outcome. Review after 20 trades. Keep what holds up. Cut what does not.
-
Stop Loss vs Take Profit: Differences, Examples & Best Practices
5 months ago -
Forex Trading Psychology Tips: How to Stay Disciplined and Consistent
5 months ago -
Forex Order Types Explained: Market vs Limit vs Stop Orders
5 months ago -
How to Set Stop Loss and Take Profit (Step-by-Step)
5 months ago -
How to Start Forex Trading Step by Step (Beginner Roadmap)
5 months ago
-
-
-
- What does one candlestick show?
- What timeframes should you use as a beginner?
- How do you read bullish and bearish candles?
- Which candlestick patterns matter most for beginners?
- Why do candlestick patterns fail?
- What is confirmation for a candlestick setup?
- How do you set stop loss using candlesticks?
- Can you trade with candlesticks alone?
- Do candlestick colors matter?
- How many candles do you need to confirm a reversal?
- What does a long wick mean?
- How do candlesticks relate to chart patterns?
-
-
-
- What does one candlestick show?
- What timeframes should you use as a beginner?
- How do you read bullish and bearish candles?
- Which candlestick patterns matter most for beginners?
- Why do candlestick patterns fail?
- What is confirmation for a candlestick setup?
- How do you set stop loss using candlesticks?
- Can you trade with candlesticks alone?
- Do candlestick colors matter?
- How many candles do you need to confirm a reversal?
- What does a long wick mean?
- How do candlesticks relate to chart patterns?
-
How to Place a Forex Trade Step by Step (Your First Trade Explained)
3 months ago -
Forex Trading vs Crypto Trading: Which Market Is Better for Beginners?
3 months ago -
Forex Lot Size Calculator: How to Use It to Size Trades Correctly
5 months ago -
How to Calculate Position Size in Forex (Position Sizing Formula + Examples)
5 months ago -
Forex Leverage Explained: How It Works, Pros, Cons & Examples
5 months ago
-
Forex Trading Platforms Comparison: MetaTrader vs cTrader vs TradingView
5 months ago -
Is Forex Trading Legal in the United States? Rules, Regulators & What to Know
5 months ago -
Stop Loss vs Take Profit: Differences, Examples & Best Practices
5 months ago -
Forex Market Hours & Trading Sessions Explained (Best Times to Trade)
5 months ago -
Forex Leverage Explained: How It Works, Pros, Cons & Examples
5 months ago