FOMC Meeting and Forex Volatility: What Usually Happens and How to Prepare

FOMC days can move FX faster than most releases. Liquidity thins, spreads widen, and price can swing hard in minutes. The driver is simple, the Fed changes rate expectations, and the US dollar reprices across pairs.
This guide breaks down what usually happens before, during, and after the FOMC decision and press conference. You will learn which time windows see the biggest spikes, why the first move often reverses, and which pairs tend to react most. You will also get a clear prep checklist, key levels to mark, order and risk rules to use, and the data points that matter. For the basics behind these drivers, start with fundamental analysis in forex.
- In het kort: Expect the biggest volatility at 14:00 ET (statement) and 14:30 ET (press conference).
- In het kort: The first spike often fades, wait for the second move and the close.
- In het kort: Watch the dot plot, forward guidance, and Powell’s tone, they drive repricing fast.
- In het kort: USD pairs with high rate sensitivity usually react most, especially USD/JPY and EUR/USD.
- In het kort: Spreads widen and slippage rises, size down and use hard risk limits.
- In het kort: Mark key levels before the event, trade only if price respects them after the first burst.
Key takeaways
- Two shock windows matter most. The statement hits first. The press conference often sets the real direction.
- The market trades expectations, not the headline. A “no change” decision can still move FX if guidance shifts.
- The dot plot can overpower the rate decision. One dot can change the path the market prices.
- Powell’s tone moves the front end. Front end yields move the USD fast.
- Expect the first move to be messy. Liquidity drops. Stops get swept. Reversals happen often.
- Your edge comes from preparation. Map levels, define invalidation, cut size, and plan the time windows.
- Focus on what actually drives the USD repricing, rates, yields, and risk conditions. Use fundamental analysis in forex to frame the move before you trade it.
What the FOMC meeting is and why it matters for FX markets
What the FOMC is
The FOMC is the Federal Open Market Committee. It sets US monetary policy. It votes on the target range for the fed funds rate. It also guides markets on the path of rates and the pace of balance sheet runoff.
FX cares because the USD is the funding currency for much of the world. When US rates reprice, USD pairs reprice fast. When the Fed shifts global risk appetite, capital moves across borders. That hits FX.
How Fed policy hits USD pairs
Most USD moves after FOMC come from the rates curve, especially the front end. Traders react to changes in expected policy over the next 6 to 24 months. That shows up in 2-year yields first. Spot follows.
- Yields and rate differentials. Higher expected US rates, or higher US yields versus peers, tend to support USD. Lower expected rates tend to weaken USD. Watch 2-year yields, the 2s10s curve, and US versus Germany and Japan front-end spreads.
- Risk sentiment. A hawkish surprise can tighten financial conditions. Equities can drop. Volatility can rise. In those windows, USD often gains versus high beta currencies and loses versus safe havens depending on the shock and positioning.
- Capital flows and hedging. Higher US yields pull foreign demand into Treasuries and US cash products. US investors also adjust FX hedges on foreign holdings. These flows can extend the move after the initial spike.
If you need a clean refresher on the mechanics, read how interest rates affect currency pairs.
Rate decision versus policy stance
The headline rate decision matters less than the total message. The market trades the stance.
- Rate decision. The change, or no change, in the fed funds target range.
- Statement language. Changes in inflation and growth assessment. Shifts in risk balance. Any hint the reaction function changed.
- Dots. The median path, dispersion, and terminal rate tell you how the committee thinks. A small dot shift can move the front end more than the rate decision.
- Guidance and press conference. The chair can confirm or reject market pricing. This often drives the second move, and sometimes the reversal.
Why expectations dominate
Markets trade the gap between pricing and reality. If the outcome matches what futures and swaps already price, the USD often whips then fades. If the Fed surprises the path, the move tends to extend.
- Priced-in outcome. Minimal follow-through. Most action comes from stop runs, liquidity gaps, and fast repositioning.
- Genuine surprise. Sustained repricing in the front end. Clear follow-through in USD pairs. Larger post-event ranges and tighter correlations to yields.
Your job is to define what the market expects before the meeting. Compare that to what the Fed can realistically deliver. Trade the difference, not the headline.
Which USD pairs tend to react most, and why
- EUR/USD. Deep liquidity and heavy macro positioning. It reacts to US Germany yield spreads and broad USD demand. It often sets the tone for the USD complex.
- USD/JPY. Highly sensitive to US yields because Japan rates move less. When US yields spike, USD/JPY can trend hard. It can also reverse fast if risk breaks and carry gets cut.
- GBP/USD. Moves with USD repricing plus UK-specific rate expectations. It can show sharper swings when UK data or BoE pricing sits close to key levels.
- Gold and gold proxy pairs. Gold often trades real yields and the USD. A hawkish shift can pressure gold via higher real rates. A dovish shift can lift gold if yields drop. AUD and NZD can echo this when risk sentiment drives the tape.
FOMC release timeline: When volatility typically spikes
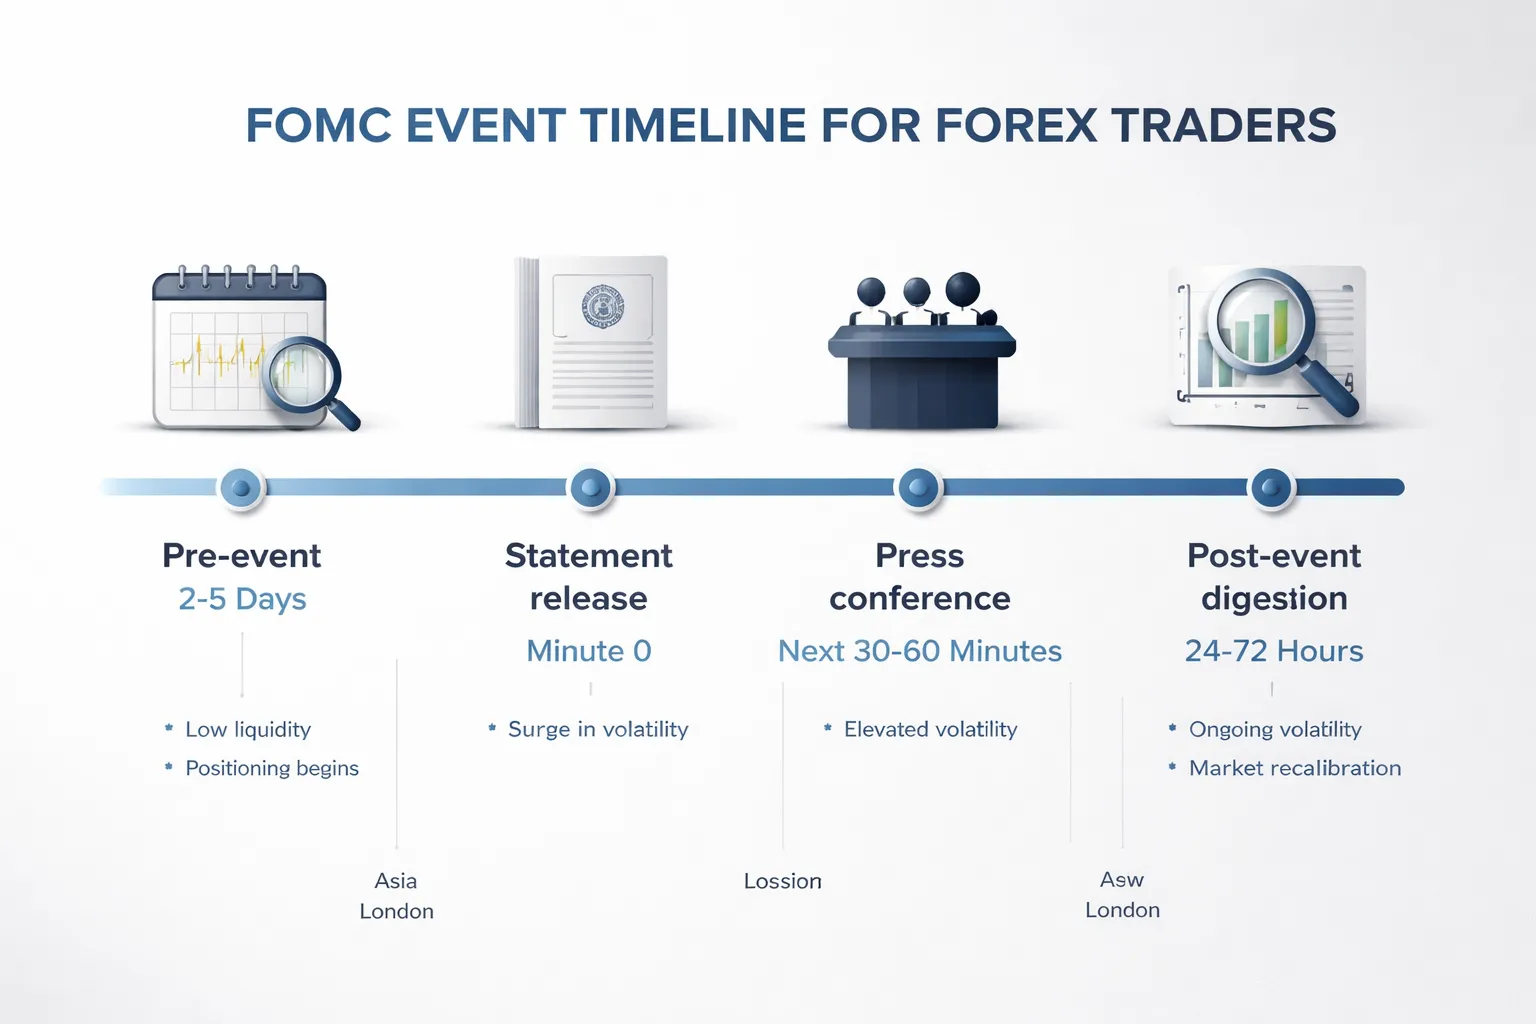
Pre-event positioning: the days leading into the decision
Volatility often rises 2 to 5 trading days before the FOMC. You see it in wider intraday ranges and faster mean reversion.
Most of this move comes from repricing rate expectations. Traders adjust positions as Fed speakers go quiet and the market leans into one base case.
- Typical behavior: Choppy price action, false breakouts, and tight correlation to US yields and the USD index.
- What to watch: Fed funds futures, the US 2-year yield, and front-end OIS pricing. These often lead spot FX.
- Practical prep: Reduce size, widen invalidation levels, and avoid placing stops at obvious swing highs and lows where liquidity hunts cluster.
If you need a clean way to track the build-up, use an economic calendar and note the decision time, the press conference time, and any same-week CPI, jobs, or Treasury auctions.
Decision minute: statement release and immediate algorithmic reaction
The first spike usually hits at the statement release time. Price can travel far in seconds, then snap back.
- What drives the first move: Rate decision vs expectations, statement language changes, and any surprise in the dot plot on dot-plot meetings.
- Typical microstructure: Spreads widen, depth thins, and slippage increases. Market orders get punished.
- Common pattern: One sharp impulse, then a partial retrace as humans confirm what the text implies for the next meeting.
Press conference dynamics: when reversals and trend confirmation often occur
The press conference often produces the second volatility wave. It can reverse the statement move or extend it.
- Reversal risk: The statement reads hawkish or dovish, then the chair adds nuance that pulls pricing back toward neutral.
- Trend confirmation: Clear guidance on inflation progress, labor market balance, and the reaction function can lock in a direction.
- What to track live: Changes in the US 2-year yield during answers. If yields keep moving in the same direction, FX follow-through becomes more likely.
Post-event digestion: the 24 to 72 hour follow-through period
Many of the cleanest moves happen after the noise. The market needs time to reprice curves, rebuild risk, and rotate positioning.
- First 24 hours: Volatility stays elevated, but direction can remain unstable. Liquidity normalizes, then trend attempts show up.
- 24 to 72 hours: Follow-through depends on whether pricing shifts for the next one to three meetings, not just the current decision.
- Confirmation tools: Look for alignment between FX, US yields, and equities. If they disagree, expect more chop.
How time zones and session overlaps change the liquidity and volatility profile
The FOMC hits during US hours. Liquidity concentrates in New York, but volatility does not stay contained there.
| Window | Liquidity | What volatility looks like | Your main risk |
|---|---|---|---|
| 1 to 3 hours before release | Moderate to high in London and New York overlap | Tight ranges, sudden probes | Getting chopped out by positioning flows |
| Statement minute | Low effective liquidity, spreads widen | Fast spike, fast retrace | Slippage and stop overruns |
| Press conference | Improves, still reactive | Second wave, reversals common | Holding the wrong bias from the first move |
| After New York close, into Asia | Lower in many USD pairs | Gaps and thinner follow-through | Liquidity vacuum moves that fade later |
| Next London and New York sessions | High | Cleaner continuation if repricing holds | Late entries after most of the move |
FOMC meeting forex volatility: what to expect in common scenarios
Hawkish surprise, stronger USD outcomes and the usual price path
A hawkish surprise means higher rate expectations than priced. It can come from a hike when a hold was priced, a higher dots path, or a press conference that signals less urgency to cut.
You usually see USD strength in two phases. First is the headline burst. Second is repricing as traders rebuild positions around yields and spreads.
- 0 to 5 minutes: Fast spike. Stops trigger. Spreads widen. Slippage increases.
- 5 to 30 minutes: Second wave. Price often revisits the first move. Reversals hit traders who chase late.
- After New York close into Asia: Thinner liquidity. You can get sharp continuation or a vacuum move that fades later.
- Next London and New York: Cleaner continuation if the market still prices a higher terminal rate or fewer cuts.
Pairs with large rate sensitivity tend to show the cleanest response. USD/JPY often tracks the move in US yields. EUR/USD often reacts through rate differentials and broad USD demand. For drivers specific to USD/JPY, use this guide on what moves USD/JPY.
Dovish surprise, when USD weakness accelerates and when it fades
A dovish surprise means lower rate expectations than priced. It can come from guidance toward cuts, weaker growth or inflation language, or dots shifting down.
- USD weakness accelerates when the statement and the press conference align. You also see acceleration when the market was positioned long USD into the event.
- USD weakness fades when the message looks dovish but inflation risks stay high. It also fades when risk sentiment flips to risk-off and safe haven USD demand returns.
Watch the front end of the US curve. If 2 year yields drop and keep dropping through the press conference, the USD down move tends to hold into the next session. If yields bounce back quickly, the FX move often mean reverts.
No surprise decision, why FX can still swing hard on guidance
A hold that matches expectations can still produce big ranges. The market trades the path, not the level.
- Dots: A small median shift can reprice months of expectations.
- Statement wording: Changes in risk balance can matter more than the rate line.
- Press conference: The first move can flip if the chair pushes back on market pricing.
- Positioning: Crowded trades unwind even with no change in policy.
Expect two directional attempts. The first comes from the statement. The second comes from Q&A. Plan for both.
Split signals, “hawkish hold” and “dovish hike” outcomes
Split signals create the messiest price action. You get large ranges and lower follow-through.
- Hawkish hold: Rates unchanged, guidance leans tighter. USD often spikes up, then retraces if the market doubts future hikes. Continuation improves only if yields hold higher into the next session.
- Dovish hike: Hike delivered, guidance points to a pause or cuts. USD often pops up first on the headline, then sells off as traders price the end of the cycle.
In both cases, the statement gives you the first impulse. The press conference often decides the close and the next day direction.
Risk-on vs risk-off overlays, when equities and carry dominate FX
FOMC reactions in FX do not run on rates alone. Risk sentiment can take control.
- Risk-on overlay: Equities rally, volatility falls. High beta and carry currencies can outperform even if the USD stays firm versus low yielders. JPY and CHF often lag in risk-on flows.
- Risk-off overlay: Equities drop, volatility jumps. Funding currencies strengthen. Carry trades unwind. USD can strengthen even on a mildly dovish message if the market rushes to safety.
Use a simple check. If equity index futures keep trending after the first 15 to 30 minutes, risk can dominate your FX outcome. If equities chop and yields lead, rates usually dominate.
Key drivers traders watch beyond the headline rate decision
Dot plot interpretation, focus on the median dot and the spread
The dot plot moves FX more than the rate itself when the decision matches expectations.
- Median dot for the current year and next year. This is the market’s quick proxy for the Fed path. A higher median usually supports USD. A lower median usually pressures USD.
- Distribution matters. A tight cluster signals confidence. A wide spread signals uncertainty. Wider dispersion can lift implied FX vol because traders hedge more.
- Look for “dot drift” versus the prior meeting. Count how many dots shift up or down by 25 to 50 bps. Even small shifts can reprice the front end of the curve fast.
- Watch the longer-run rate. A higher longer-run dot implies a higher neutral rate. That can push up longer-term yields and support USD beyond the first hour.
SEP changes that reprice USD, inflation, jobs, and growth
The SEP tells you what the Fed thinks it can sustain. FX reacts when the SEP forces a new rates path.
- Core inflation (PCE) revisions. Upward inflation revisions usually mean fewer cuts or later cuts. That tends to support USD, especially against low-yielders.
- Unemployment rate revisions. A higher jobless path can signal easing ahead. That can weaken USD if the market believes cuts come faster.
- GDP growth revisions. Stronger growth can keep policy tight longer. Weak growth can do the opposite.
- Pay attention to the mix. Higher inflation plus higher unemployment reads like stagflation risk. That can lift volatility and trigger risk-off USD strength even if cuts look closer.
Powell’s language cues, what to listen for in the press conference
The first move can reverse when Powell frames the reaction function.
- Inflation progress. Phrases that stress “insufficient progress” often push yields up and support USD. Language that stresses “disinflation continues” often does the opposite.
- Labor market slack. If he highlights cooling, rebalancing, or downside risks to employment, markets lean dovish. If he stresses tightness and wage pressure, markets lean hawkish.
- Higher for longer. If he repeats it and ties it to sticky services inflation, traders extend the expected hold. That can lift USD through higher real yields.
- Conditionality words. “Data dependent,” “confidence,” and “need to see more” usually reduce certainty. That can widen intraday ranges as pricing flips between scenarios.
Balance sheet policy, QT and liquidity signals
QT can move the long end even when the Fed holds rates. FX cares because yield differentials and funding conditions change.
- QT pace changes. A slower runoff can ease liquidity stress and cap longer-term yields. A faster or extended runoff can do the opposite.
- Focus on Treasury runoff caps and MBS stance. Shifts here can change term premium and the 5 to 10 year yield response.
- Why it matters for USD. Higher long-end yields can support USD. Tighter liquidity can also trigger risk-off behavior that supports USD versus high beta and carry pairs.
Fed communication strategy, guidance, Q&A, and emphasis shifts
The Fed often guides by emphasis, not by a single sentence. You need to track what they choose to repeat.
- Statement tweaks. Small edits on inflation risks, labor conditions, or financial conditions can shift rate expectations.
- Forward guidance style. If they move from calendar hints to pure data dependence, the market prices a wider distribution of outcomes. That tends to lift volatility.
- Press Q&A risk. Reporters push on cuts, recession odds, and the balance sheet. Off-the-cuff clarifications can reverse the initial algo move.
- Unexpected focus areas. If Powell spends time on financial conditions, bank lending, or market functioning, watch for a bigger move in risk and longer-term yields.
If you need a rates-first framework for your pairs, read how interest rates affect currency pairs.
How to gauge expectations before the meeting (so you can spot a ‘surprise’)
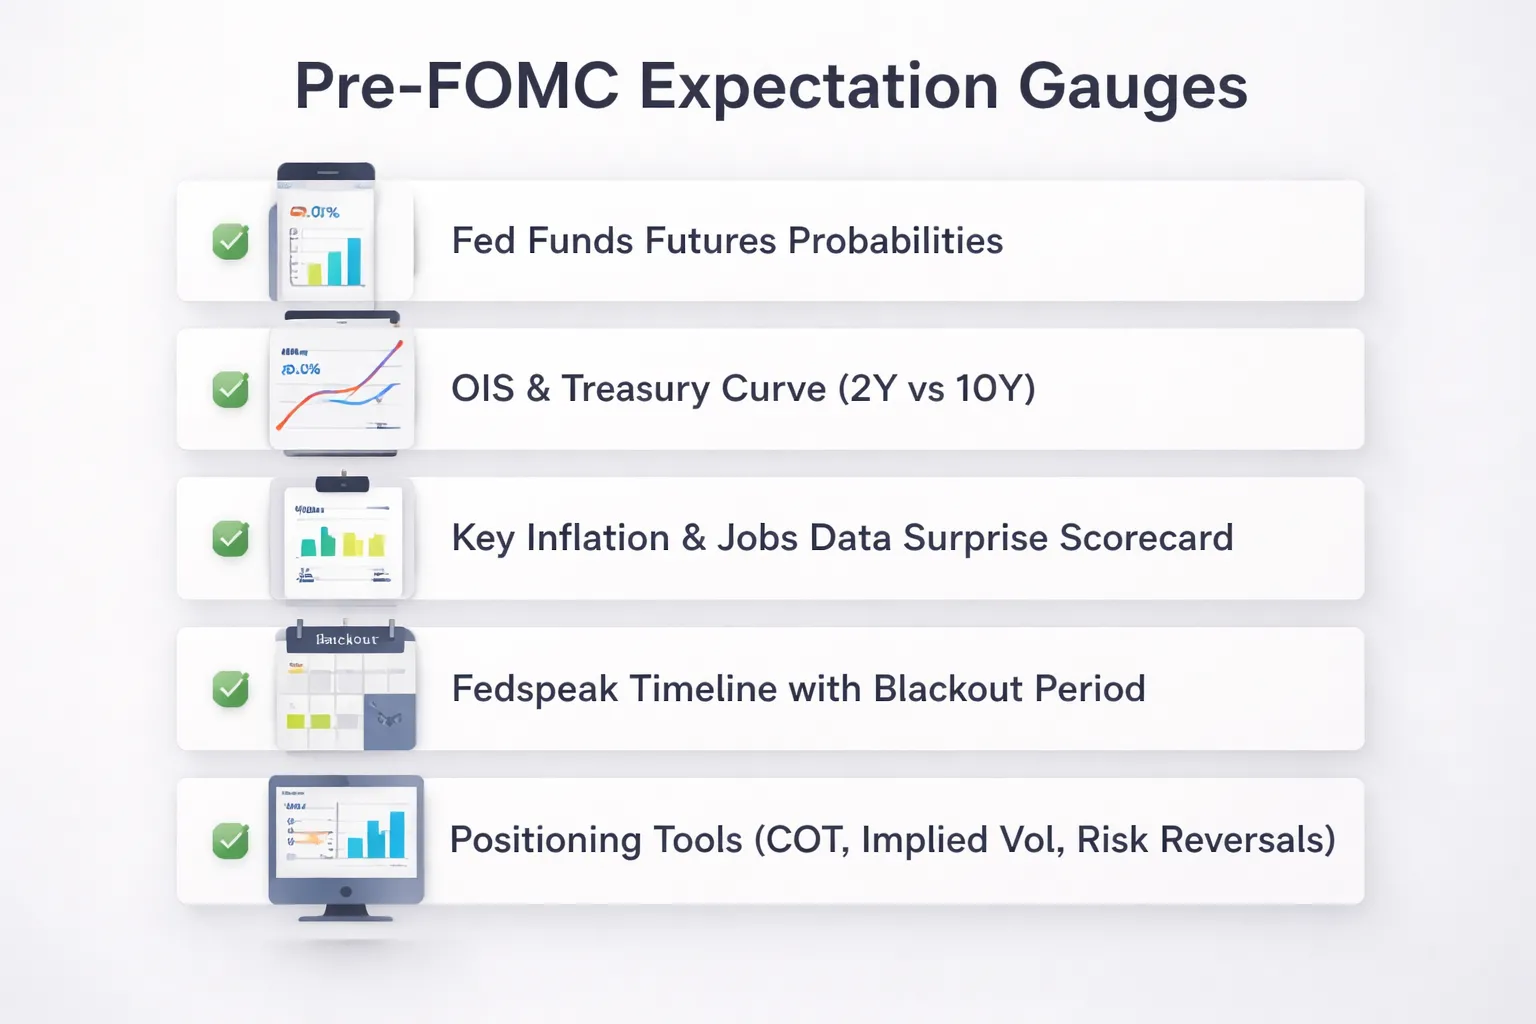
Reading Fed funds futures and implied probabilities
Start with Fed funds futures for the meeting month. They price the expected average effective fed funds rate for that month.
Convert that price into an expected rate. Then map it to the target range outcomes the market cares about, hold, cut, or hike.
- What it tells you. The market’s base case for the policy decision, plus how much uncertainty sits around it.
- What it does not tell you. The path after the meeting. It also will not isolate the statement from the dot plot or press conference. It is one blended expectation.
- How to spot a surprise. Compare the market-implied probability for the top two outcomes versus what you expect the Fed to do. If pricing shows near certainty and the Fed delivers the second outcome, volatility usually jumps.
- Watch the reprice window. The real move often hits when the market shifts from “decision risk” to “path risk.” That usually means the dots, the press conference, or the first Q and A.
Using OIS and Treasury curve moves to infer USD pressure points
Use OIS and the Treasury curve to locate where USD sensitivity sits. Different pairs react to different parts of the curve.
- Front end, 2-year. This is the policy path. If the 2-year yield jumps, USD strength often follows fast. If it drops, USD can soften, especially against higher beta FX.
- Long end, 10-year and 30-year. This is growth, inflation risk, and term premium. Big long-end moves can drive risk sentiment and affect JPY and CHF crosses through rates and risk channels.
- Curve shape. A bull steepener, front end down more than long end, often signals easier policy ahead. A bear flattener, front end up more than long end, often signals tighter policy risk. That helps you frame USD direction and equity tone.
- Real yields. If real yields rise, USD tends to gain support. If real yields fall, USD support weakens, all else equal.
If you trade GBP/USD, align your read with the rate differential and growth narrative, then cross-check with what moves GBP/USD.
Tracking inflation and labor data that drive the Fed’s reaction function
Keep your focus narrow. The Fed reacts most to inflation persistence and labor market tightness.
- Inflation. Core PCE matters most, but markets often reprice on CPI because it hits first and moves expectations. Watch core services ex housing for stickiness.
- Wages. Average hourly earnings and ECI help you judge wage pressure. Sticky wage growth can keep cuts priced out.
- Jobs. Nonfarm payrolls, unemployment rate, and participation drive the “slack” story. A rising jobless rate can pull the front end down fast.
- Demand. Retail sales and ISM services can shift the growth view and move the long end, which can flip risk tone.
Build a simple scorecard. Track whether the last two inflation prints and the last two labor prints ran hot or cool versus consensus. That tells you if the meeting has upside or downside risk versus market pricing.
Watching Fedspeak and blackout periods
Fedspeak shapes the market’s base case. The blackout changes the information flow.
- Before blackout. Speakers often guide expectations. Watch if multiple officials repeat the same message, especially the Chair, Vice Chair, and New York Fed.
- Signal versus noise. Give more weight to officials with votes this year and to remarks that reference the reaction function, inflation progress, labor rebalancing, and financial conditions.
- Into blackout. New guidance stops. Volatility can rise because the market loses its anchor. Data takes over. Positioning becomes more important.
- Meeting week. With no fresh Fed talk, the market leans on last dots, last presser tone, and the latest data surprises. That is when “surprise” risk builds.
Sentiment and positioning tools to anticipate asymmetry
Expectations alone do not tell you the size of the move. Positioning and options tell you where pain sits.
- COT. Use it to spot crowded USD longs or shorts. It moves slowly, but it helps you avoid trading into a consensus that already looks stretched.
- Options implied volatility. Rising implied vol into the meeting signals demand for hedges. Compare 1-week vol versus 1-month vol to see if the event dominates pricing.
- Risk reversals. They show call versus put demand. In FX, they reveal whether traders pay up for upside or downside in a pair. A skewed market can react harder in the crowded direction if the Fed disappoints it.
- Strike clusters. Large expiries near spot can pin price before the decision, then release it after the event. Combine expiry levels with the first reaction to judge follow-through risk.
Put it together in one view. Use futures and OIS for the base case, use the curve for the pressure point, use data surprises for directional risk, and use positioning for asymmetry.
Forex market microstructure during FOMC: spreads, slippage, and stop hunts
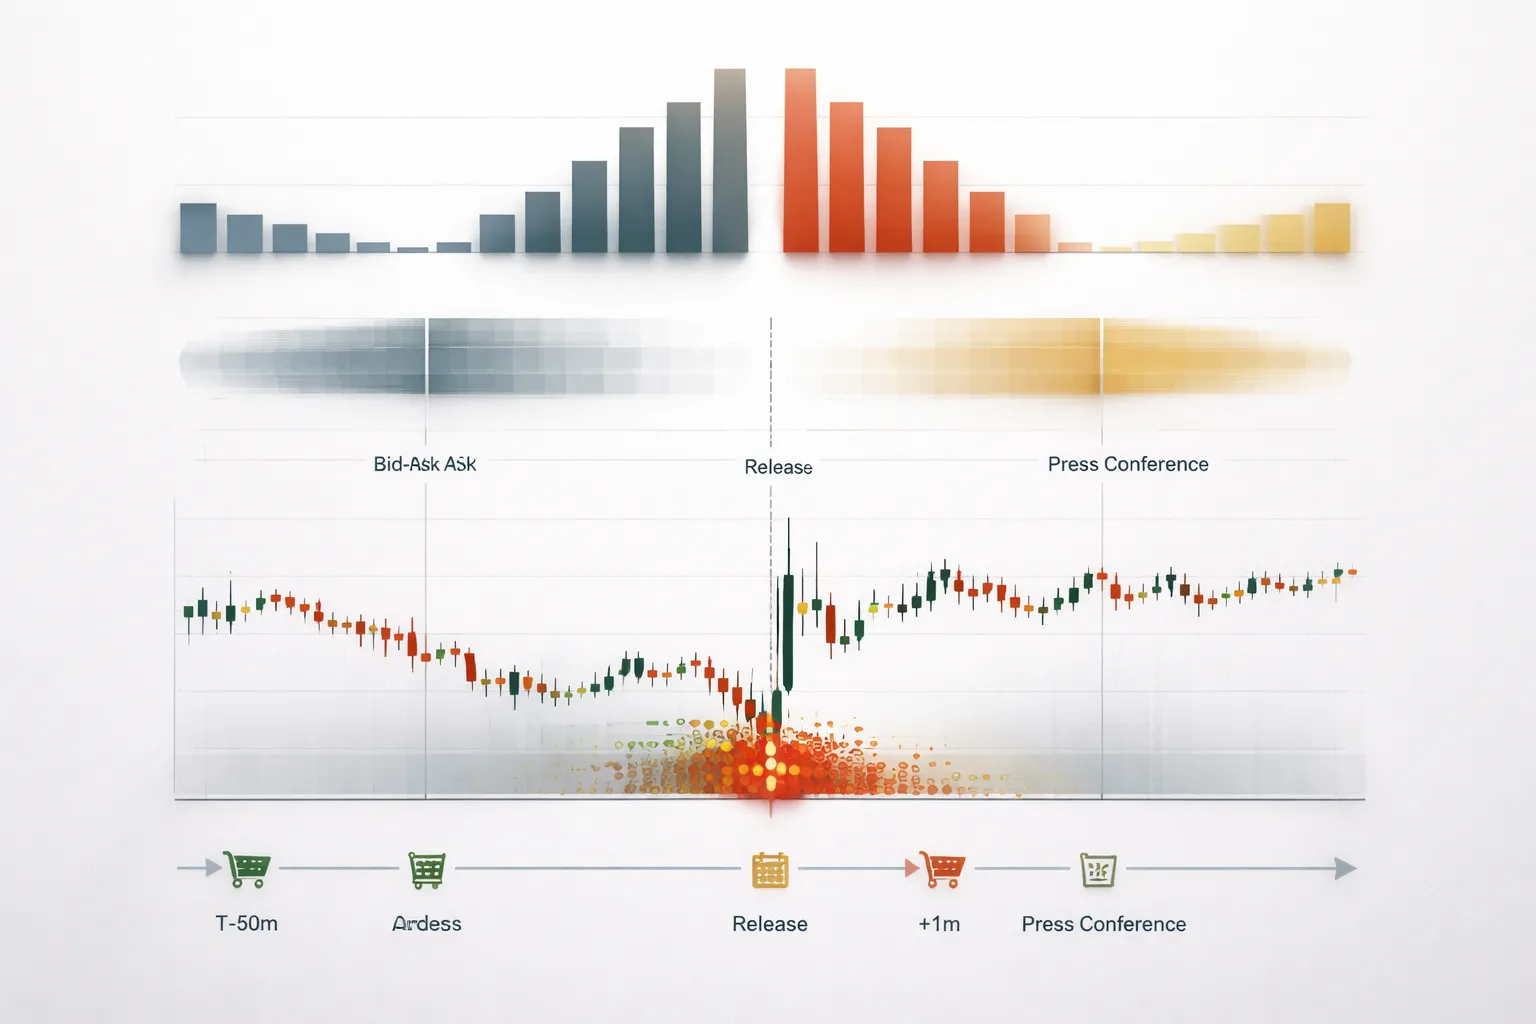
Why spreads widen and liquidity thins around scheduled macro events
Spreads widen because dealers pull quotes. They do it to control risk.
- Adverse selection. Fast traders hit stale prices first. Liquidity providers protect themselves by widening spreads or reducing size.
- Quote refresh limits. During the statement and press conference, price updates arrive faster than many pricing engines can re-quote. You see gaps between prints.
- Inventory risk. Banks and market makers do not want to hold exposure into a binary outcome. They quote smaller and hedge slower.
- Fragmentation. FX liquidity splits across venues. Top of book can look fine, but depth disappears after the first clip.
What it means for you. The spread you see before the event is not the spread you will trade during the event. Your effective cost becomes spread plus slippage.
Stop-loss clustering and wick behavior: how whipsaws form
Stops cluster in simple places. Prior highs and lows. Round numbers. Session opens. Option barriers. Large strike zones.
During FOMC, thin depth turns these clusters into fuel.
- Price spikes into a stop pocket. Market stop orders convert into market orders.
- Those orders sweep the book. Price prints through multiple levels.
- Liquidity returns after the sweep. Price snaps back. You get the wick.
This is not always a conspiracy. It is order flow. When many traders place stops in the same area, the first move can trigger a chain reaction.
Plan for it. Place stops where fewer traders place stops. Size down if your stop must sit near an obvious level. Avoid tight stops during the release window.
Market vs limit orders: execution trade-offs during high volatility
Market orders buy certainty. You get a fill. You do not control the price.
- Use market orders when you must exit risk. Example, you are wrong and need out now.
- Avoid market orders for new entries in the first seconds after the decision. Slippage can exceed your planned stop.
Limit orders buy price control. You control the worst price. You may not get filled.
- Use limit orders if you want to fade an extreme move and you accept missed trades.
- Expect partial fills or no fill when the market gaps through your price.
If your platform supports it, prefer limit with a clear invalidation level. Avoid widening your limit repeatedly. That turns into a delayed market order.
Broker and venue differences: ECN vs market maker considerations
Your broker setup changes your FOMC outcomes.
- ECN or STP. Spreads can blow out, but you often see the real widening. Slippage can go both ways. Fills depend on available depth.
- Market maker. You may see fixed or smoother spreads at times, but execution rules matter more. Requotes, last-look delays, and order rejection can rise during spikes.
Check your broker policy before you trade FOMC. Look for stop order handling, maximum deviation settings, rejected order rules, and whether they allow limit orders inside the spread.
Venue and symbol matter. EUR/USD and USD/JPY usually hold deeper liquidity than crosses. Exotics can become untradeable for minutes.
Common execution mistakes that turn a good idea into a bad fill
- Trading your usual size. Your normal risk model breaks when spreads triple and slippage jumps.
- Placing stops at obvious levels. Prior swing points and round numbers get swept first.
- Entering on the first headline. The first spike often reverses when the market parses the dots, the press conference tone, and rate path pricing.
- Using tight stops with market entries. You can get slipped in, then stopped on a wick, then watch the move run without you.
- Ignoring order type settings. Default market stops and market take-profits can create avoidable slippage.
- Holding through the press conference without a plan. Volatility can reset at the first tough question.
Build your event checklist the same way you do for other tier one releases. If you trade both, apply the same execution discipline you use for NFP.
Practical preparation plan for traders (before, during, and after the announcement)
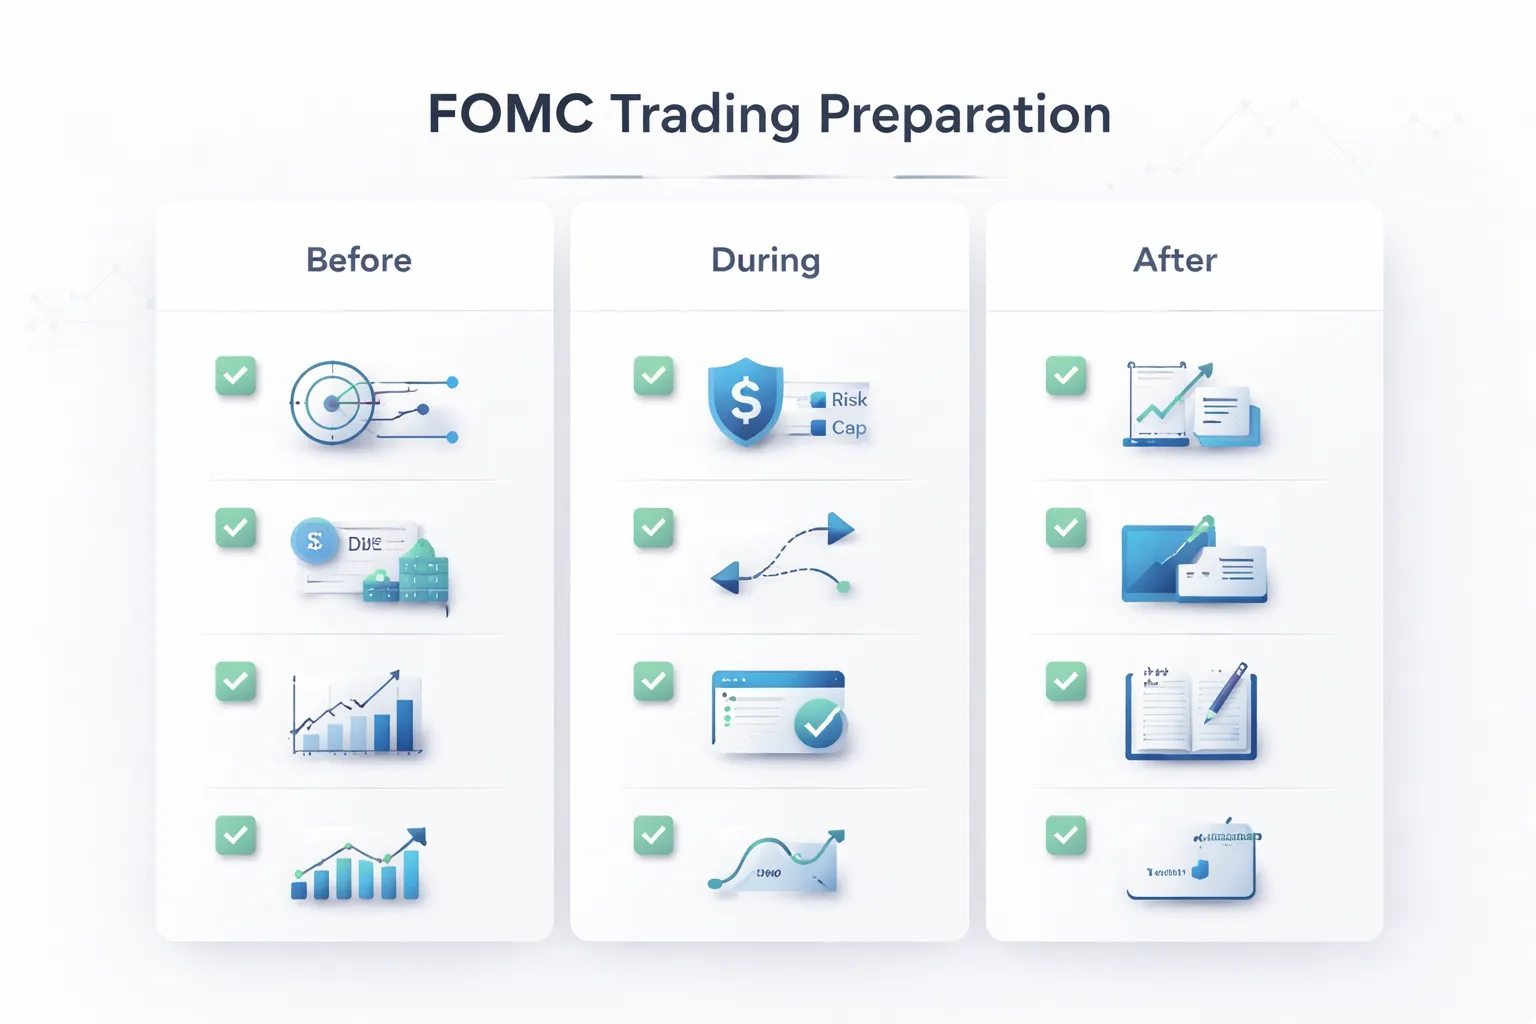
Pre-event checklist, levels, catalysts, correlations
- Mark the exact schedule. Statement time. Rate decision time. Press conference time. Any SEP and dots release time.
- Map key levels on your pairs. Prior day high and low. Asia range. London range. Weekly open. Last FOMC day high and low. Current swing high and low.
- List the catalysts that can move the first 5 minutes. Rate decision. Statement language. Dots. Inflation and growth projections. Chair tone in the first answers.
- Check DXY. Note the nearest support and resistance. Note if DXY sits at a multi week high or low.
- Check US yields. Watch the 2 year first, then the 10 year. A fast 2 year move often drives the first FX impulse.
- Check equities. Use S&P 500 futures as a risk proxy. Risk rallies can mute USD strength in some crosses. Risk selloffs can amplify it.
- Check spread and liquidity. Record typical spread now. If spreads already widen, cut size or stand down.
- Confirm your driver. If you trade EUR/USD, align your plan with the main macro inputs. Use what moves EUR/USD as your quick reference.
Scenario planning, outcomes, bias, invalidation
- Write three scenarios before the release. Hawkish. Neutral. Dovish.
- Define the trigger for each scenario. Example inputs. A dot shift up. A higher terminal rate path. A statement upgrade from “progress” to “confidence”. A stronger inflation forecast.
- Map each scenario to a directional bias. Pick one pair per scenario as your primary expression. Keep it simple.
- Set your invalidation point. Use a hard price level. Tie it to structure, not feelings. Example. “If price reclaims the pre release range midpoint and holds for 5 minutes, I am wrong.”
- Plan for the second move. The press conference often reverses the first impulse. You need a rule for re entry and a rule for no trade.
- Pre define your execution type. Limit orders for mean reversion setups. Stop entries for breakouts. Avoid mixed logic.
Risk rules, sizing, max loss, contingency stops
- Set a max loss per event. Use a fixed percent or fixed dollar cap. Stop trading when you hit it.
- Reduce size. Volatility rises. Your normal stop distance often needs to widen. Size down to keep risk constant.
- Use hard stops. Do not rely on mental stops in the first minutes.
- Plan a contingency stop. If slippage gaps through your stop, define what you do next. Example. Close at market if loss exceeds 1.5x planned risk.
- Avoid stacking correlated exposure. Long EUR/USD and long GBP/USD can equal one big short USD. Limit total USD risk across positions.
- Set an order timeout. Cancel any resting order that does not fill within your window. Old orders become traps after the first spike.
Live-event tactics, stand aside vs trade confirmation
- Stand aside when spreads blow out. If spread jumps to multiples of normal, you lose edge. Wait.
- Stand aside when price whipsaws inside the pre release range. That often signals headline noise and poor follow through.
- Trade confirmation, not the headline. Use one clear rule. Example. Wait for a 1 to 5 minute close beyond your level, then retest, then enter.
- Respect the first minute. It can print both sides. Do not chase the first candle.
- Watch the 2 year yield during the move. If FX breaks out but yields fade, expect a reversal risk.
- Separate statement trade from press conference trade. Treat them as two events. Reset your risk budget between them.
- Take profits with structure. Scale at the next major level. Do not use a random pip target.
Post-event review, slippage, playbook updates
- Journal the timeline. Entry time. Statement time. Press conference time. Exit time. Add screenshots.
- Measure slippage. Record intended price vs filled price. Do it for entries and stops. Track it as a cost per event.
- Record spreads. Note peak spread and average spread during your trade window.
- Grade your plan adherence. One score for execution. One for risk. One for patience.
- Update your playbook. Save the best pattern you saw. Delete rules that failed. Keep a short checklist for the next meeting.
- Tag the regime. Note if the market cared more about rates, dots, or Chair tone. Next event often rhymes, not repeats.
Strategy ideas: Different ways to approach FOMC volatility (with pros and cons)
Hands-off approach, skip the event window
If you do not have a proven FOMC playbook, the best strategy is no trade. Spreads widen. Slippage jumps. Correlations break.
- How to do it: Close or reduce positions before the statement. Avoid new trades from 15 minutes before the release through the first 15 to 30 minutes of the press conference.
- Risk control: If you must hold, cut size, widen stops to realistic volatility, and accept the gap risk.
- Pros: Lower tail risk. Fewer forced errors. Cleaner decision making after liquidity returns.
- Cons: You miss the biggest impulse move. You can still face gaps if you hold overnight.
Breakout trading, trade confirmation not the first spike
FOMC breaks can run, then reverse. You need rules that filter false breaks and control time in the trade.
- Confirmation triggers: Wait for a 5 to 15 minute close beyond your level. Or require a break, a pullback, and a second push that holds.
- False break filters: Avoid the first 1 to 3 minutes. Require price to hold above the broken level for X minutes. Use a volatility filter, trade only if the move exceeds a minimum range so you avoid chop.
- Execution plan: Use limit entries on the retest when possible. If you use stops, reduce size to account for slippage.
- Time-based exits: If price does not follow through within 10 to 20 minutes, exit. If the press conference reverses the move, flatten and reassess.
- Pros: You trade with momentum. Clear invalidation levels. Works best on genuine repricing events.
- Cons: You enter late. Whipsaws can hit stops fast. Slippage can turn a good setup into a bad fill.
Mean-reversion scalps, fade the first move only in the right regime
Fading works when the first move reflects positioning and thin liquidity, not a true policy surprise. It fails when the Fed shifts the rate path.
- When it is more viable: The decision matches expectations, the dots stay close to prior, and the first impulse stalls at a major pre-marked level. Price snaps back once spreads normalize.
- When to avoid it: Large dot plot shift, clear change in Chair tone, or a big move in front end yields. Those tend to trend, not mean-revert.
- Rules that reduce damage: Use small size. Use tight time stops. Exit fast if the level does not hold. Do not average down.
- Pros: Good reward to risk when the spike is an overreaction. Short holding time reduces exposure.
- Cons: One true repricing can erase many small wins. Execution quality matters more than the chart.
Options-based hedging, define risk when volatility is priced in
Options let you cap downside during event risk. Your main enemy is implied volatility. It often rises into FOMC, then drops after, even if spot moves.
- Straddle concept: Buy call and put at the same strike. You need a large move to beat premium plus spread. You also need the move to happen before implied volatility collapses.
- Strangle concept: Buy out of the money call and put. Cheaper premium, but you need a larger move to profit.
- Implied volatility check: Compare current implied volatility to its recent range. If implied volatility sits high into the event, the market already expects a big move.
- Hedge use case: If you hold a spot position, use options to cap loss rather than to chase a windfall.
- Pros: Defined risk. No stop hunting. Cleaner planning.
- Cons: Premium costs. Volatility crush risk. Limited access for many retail FX accounts.
Swing positioning, focus on the multi-day repricing
The first hour can be noise. The bigger trade often appears when rates and FX align over the next sessions.
- Core idea: Let the statement and press conference pass. Then trade the follow through once the market chooses a direction.
- What to track: 2 year and 10 year yield direction, the dollar index trend, and risk mood. Align with the driver that dominated the meeting.
- Entry style: Use end of day closes, pullbacks to broken weekly levels, and measured risk. Avoid chasing the first candle.
- Event stacking: Combine the FOMC read with the next inflation print. Use your inflation framework from CPI and forex to plan follow up scenarios.
- Pros: Better liquidity. Clearer trend structure. Lower slippage impact.
- Cons: Smaller initial move captured. You can sit through choppy consolidation before the trend resumes.
Pair-specific tendencies: How major currencies often react to Fed surprises
EUR/USD: Rate-differential focus and the role of European data timing
EUR/USD reacts to Fed surprises through the U.S. and euro rate spread. A hawkish Fed surprise usually lifts U.S. yields and pressures EUR/USD lower. A dovish surprise often does the opposite.
Your main filter is timing. A clean Fed-driven move often holds when the euro calendar is quiet. If Europe has CPI, PMIs, or an ECB speaker within the next session, that flow can blunt or reverse the initial impulse.
- Hawkish Fed surprise: EUR/USD often drops first, then consolidates near prior daily lows and key breakout levels.
- Dovish Fed surprise: EUR/USD often jumps first, then retests the breakout zone if U.S. yields fade after the press conference.
- What you track: U.S. 2-year yield, U.S. 10-year yield, and the next Europe data window.
- How you prepare: Mark the next European release time, size smaller if Europe prints within 12 to 18 hours.
USD/JPY: Sensitivity to U.S. yields and intervention risk considerations
USD/JPY usually gives the cleanest response to a Fed surprise because it keys off U.S. yields. Watch the U.S. 2-year first, then the 10-year for follow-through.
You also face a unique risk. Japan officials can jawbone or intervene when moves look one-way and fast. That risk rises during sharp USD strength and thin liquidity windows.
- Hawkish Fed surprise: USD/JPY often spikes up with U.S. yields, then whips during the press conference as markets reprice the terminal rate path.
- Dovish Fed surprise: USD/JPY often drops hard because long USD/JPY positioning can unwind quickly when yields fall.
- What you track: U.S. 2-year, U.S. 10-year, and spot speed into round numbers.
- How you prepare: Use defined risk. Avoid chasing late in the move. Assume bigger slippage than normal.
GBP/USD: Bank of England expectations and risk sentiment cross-currents
GBP/USD reflects two forces. Fed pricing drives the dollar leg. Bank of England expectations drive the pound leg. Risk sentiment can override both for short bursts.
Fed hawkishness often pushes GBP/USD lower, but the downside can accelerate when global risk turns defensive. Fed dovishness can lift GBP/USD, but follow-through depends on whether UK rates can stay firm versus U.S. rates.
- Hawkish Fed surprise: GBP/USD often sells off with broader USD strength, then reacts to UK rate expectations in the following session.
- Dovish Fed surprise: GBP/USD often rallies, but can stall if the market also downgrades global growth and risk appetite.
- What you track: U.S. yields, SONIA pricing, and broad risk proxies.
- How you prepare: Separate the spike from the repricing. If UK data or BoE speakers hit soon, expect a second move.
For a deeper driver breakdown, use this guide on what moves GBP/USD.
AUD/USD and NZD/USD: Risk appetite, commodities, and carry trade impacts
AUD/USD and NZD/USD often trade like risk sentiment plus yield spread. A hawkish Fed surprise usually tightens financial conditions. That tends to hit high beta FX first.
Commodities matter, but the immediate post-FOMC reaction often comes from rates and risk. If U.S. yields jump and equities slip, AUD and NZD can fall even if commodity prices hold.
- Hawkish Fed surprise: AUD/USD and NZD/USD often drop fast, then either trend lower or mean-revert if risk stabilizes.
- Dovish Fed surprise: Both often pop higher, but the move sticks more when the market also prices easier U.S. financial conditions.
- Carry impact: Higher U.S. front-end yields can reduce the appeal of funding trades and tighten USD liquidity, which can pressure AUD and NZD.
- How you prepare: Watch U.S. real yields and equity futures after the statement, then reassess after the press conference.
USD/CAD: Oil correlation and divergence between Fed and BoC paths
USD/CAD trades a three-way mix. Fed pricing moves USD. BoC pricing moves CAD. Oil can reinforce or cancel the rate move.
A hawkish Fed surprise usually lifts USD/CAD, but strong oil can cap the upside. A dovish Fed surprise often drops USD/CAD, but weak oil can limit follow-through.
- Fed versus BoC: The larger the expected policy gap, the cleaner the move. If the market already expects BoC to mirror the Fed, USD/CAD can chop.
- Oil check: If crude breaks a key level during the same window, treat USD/CAD signals as lower quality.
- What you track: U.S. 2-year, Canada 2-year, WTI direction, and the next BoC communication date.
- How you prepare: Build scenarios for rate gap up, rate gap down, and oil shock. Size down when oil and rates point in opposite directions.
| Pair | Usually most sensitive to | Main Fed surprise risk | Your preparation focus |
|---|---|---|---|
| EUR/USD | U.S. versus euro rate spread | Europe data soon after the meeting | Check the next EU data window, avoid over-commitment into it |
| USD/JPY | U.S. yields | Intervention and fast reversals | Defined risk, avoid late chase, expect slippage |
| GBP/USD | Fed path plus BoE pricing | Risk sentiment whips | Track SONIA and risk tone, plan for a second leg on UK inputs |
| AUD/USD, NZD/USD | Risk appetite and yield spread | Equity-led reversals after the presser | Confirm with yields and equity futures, then reassess post-presser |
| USD/CAD | Fed-BoC divergence plus oil | Oil cancels the rates signal | Map scenarios for rates and oil alignment before you trade |
Risk warnings and common misconceptions about trading FOMC
Myth: “No rate change means no volatility”
The decision line moves markets less than the message.
Volatility often comes from guidance. That includes the statement language, the dots, and the press conference.
- Forward guidance: A small wording change can reprice the next meeting and the whole path after it.
- Dots and dispersion: A similar median dot can hide a wider split, traders price uncertainty and term premium.
- Press conference: The first answers can override the statement. Traders react to emphasis on inflation, labor, and financial conditions.
- Balance sheet talk: QT pace and reinvestment plans can hit yields, then FX follows.
If you trade the headline and ignore the path, you trade the smallest part of the event. Learn the drivers with fundamental analysis in forex.
Overconfidence in the first 1-minute candle
The first minute often reflects positioning and liquidity gaps, not a settled view.
- Spread expansion: Your entry can fill far from your click price, even on liquid pairs.
- Stop runs: Initial spikes often clear nearby stops, then price reverses.
- Two-step reactions: Statement moves price one way, the presser flips it after clarifications.
Wait for confirmation. Use yields and equity futures. Watch the next 5 to 15 minutes for direction and for whether the move holds after the first pullback.
Ignoring correlations
A clean FX story can fail when the cross-asset tape disagrees.
- Yields lead FX: If US 2-year and 10-year yields fade, USD strength can fade even if the statement sounds firm.
- Equities can flip risk: A hawkish read can still turn into risk-on if equities rally, high beta FX can rip against the first USD move.
- Real yields matter: Inflation expectations can shift the signal, nominal yields alone can mislead you.
Before you trade, define what must confirm your idea. Example, you want USD/JPY up, you also want US yields up and risk not collapsing. If one leg breaks, cut size or stand down.
Leveraging into uncertainty
FOMC is not a normal liquidity window. Your usual risk rules fail if you keep normal leverage.
- Wider stops do not fix bad sizing: A wider stop with the same lot size increases your dollar risk.
- Gaps and slippage: Stops protect you less when price jumps over levels.
- Multiple catalysts: Statement, dots, and presser can each create a new impulse move.
Use stricter limits. Reduce position size. Cap total exposure across correlated pairs. Plan the max loss for the whole event, not per trade.
When not to trade
Skip the event when your setup cannot survive execution risk.
- Account size: If a normal FOMC spike can hit your max daily loss, you cannot trade it responsibly.
- Platform latency: If your platform freezes, delays fills, or requotes during news, you trade blind.
- Wide spreads on your broker: If spreads blow out beyond your stop distance, your trade has no edge.
- Poor psychological readiness: If you chase, average down, or revenge trade, FOMC will amplify it.
Stand aside if you cannot define entry, invalidation, and size before the release. Your best trade can be no trade.
FAQ
When does FOMC volatility usually peak?
It usually spikes in two waves, the statement release, then the press conference. The first move can fade fast. The second move can trend if the messaging shifts rate expectations. Expect the widest spreads in the first minutes.
Which part moves FX more, the rate decision or the statement?
The statement and the dot plot often move FX more than the rate itself. Markets price the decision in advance. The reaction comes from changes in guidance, inflation language, and the projected path of rates.
Why do price moves look random right after the release?
Liquidity drops, spreads widen, and orders hit thin books. Stops trigger in clusters. Algorithms react to headlines in milliseconds. Your chart can print large candles without clean structure. Wait for execution to normalize before you act.
How long should you wait before trading?
If you trade spot FX, many traders wait 5 to 15 minutes for spreads and fills to stabilize. If your broker stays wide longer, wait longer. Use time and spread conditions as rules, not feelings.
What is the most common retail mistake during FOMC?
Oversizing into a widening spread. A stop that works in normal hours can fail during news. Your risk becomes execution risk. Reduce size, widen invalidation, or stay out.
How do you set risk when spreads blow out?
Model risk in pips including spread. If spreads can widen to 5 to 20 pips on majors, your stop must survive that or you must not trade. Use a smaller position so your dollar risk stays fixed.
Should you use market orders during FOMC?
A market order gives you speed but no price control. A limit order gives price control but risks no fill. If slippage breaks your plan, avoid market orders near the release. If missing the trade is acceptable, use limits.
Can you trade FOMC with tight stops?
Tight stops usually fail during the first spike. Spreads and noise can hit your invalidation before direction forms. If your edge requires a 5 to 10 pip stop, you likely have no edge during FOMC minutes.
Which pairs tend to react the most?
USD pairs with high liquidity often show the cleanest reaction, EUR/USD, USD/JPY, GBP/USD. Crosses can move more but trade worse due to spreads. For USD/JPY, rate expectations and Treasury yields matter most.
What data matters most besides the decision?
Dots, inflation language, and growth balance. Watch how the market reprices the next 1 to 3 meetings in OIS and Fed funds futures. If the rate path shifts, USD can trend for hours. CPI also shapes those expectations.
How do you prepare a plan before the release?
Define entry, invalidation, and size. Define maximum spread you will accept. Define a no trade window around the release. If any rule breaks, you do nothing. Write it down before the statement hits.
What is a simple checklist to avoid platform risk?
- Execution: confirm spreads and fill speed in prior news events.
- Stops: confirm stop type and how your broker handles gaps.
- Connection: use wired internet if possible.
- Backup: have a phone app ready.
How is FOMC different from CPI?
FOMC moves FX through guidance and rate path pricing. CPI moves FX through inflation surprise and expected policy response. CPI often creates a single shock move. FOMC often creates two waves and more headline risk. See how inflation data moves currency markets.
What usually happens after the first hour?
Volatility often compresses. Price may form a trend if the Fed message changes the expected terminal rate or timing of cuts. If the move lacks follow through and yields revert, FX often mean reverts.
When should you stand aside?
Stand aside if spreads exceed your stop distance, your platform lags, or you cannot state your entry and invalidation. Stand aside if you feel urgency or anger. FOMC punishes weak process more than weak analysis.
Conclusion
Conclusion
FOMC moves FX through rates, yields, and expectations. Price usually spikes first, then the market chooses between trend and mean reversion based on whether the Fed shifts the expected path.
Your edge comes from preparation, not prediction. Define your scenarios, set your maximum risk, and decide in advance if you will trade the statement, the press conference, or the post-event reset.
- Trade the repricing, not the headline. Focus on how the terminal rate, cuts timing, and dot plot implications change.
- Use a volatility plan. Size down, widen stops only if your risk stays fixed, and assume spreads expand.
- Wait for structure. If you cannot mark a clear level for entry and invalidation, do not trade.
- Protect your process. If fills slip, data lags, or emotions rise, stand aside. Preserve capital for cleaner sessions.
Final tip. Write a one-page checklist and follow it every meeting. If you want the macro framework behind these moves, review what actually moves prices in forex and keep your focus on rates, expectations, and positioning.
-
How Interest Rates Affect Currency Pairs (With Real Examples)
6 months ago -
Fundamental Analysis in Forex Explained (What Actually Moves Prices)
6 months ago -
What Moves EUR/USD? The Biggest Drivers You Should Watch
6 months ago -
Inflation and Exchange Rates Explained (Why Currencies Rise or Fall)
6 months ago -
How to Trade Forex News (NFP, CPI, FOMC) Without Getting Wrecked
6 months ago
-
- Pre-event positioning: the days leading into the decision
- Decision minute: statement release and immediate algorithmic reaction
- Press conference dynamics: when reversals and trend confirmation often occur
- Post-event digestion: the 24 to 72 hour follow-through period
- How time zones and session overlaps change the liquidity and volatility profile
-
- Hawkish surprise, stronger USD outcomes and the usual price path
- Dovish surprise, when USD weakness accelerates and when it fades
- No surprise decision, why FX can still swing hard on guidance
- Split signals, “hawkish hold” and “dovish hike” outcomes
- Risk-on vs risk-off overlays, when equities and carry dominate FX
-
- Why spreads widen and liquidity thins around scheduled macro events
- Stop-loss clustering and wick behavior: how whipsaws form
- Market vs limit orders: execution trade-offs during high volatility
- Broker and venue differences: ECN vs market maker considerations
- Common execution mistakes that turn a good idea into a bad fill
-
- EUR/USD: Rate-differential focus and the role of European data timing
- USD/JPY: Sensitivity to U.S. yields and intervention risk considerations
- GBP/USD: Bank of England expectations and risk sentiment cross-currents
- AUD/USD and NZD/USD: Risk appetite, commodities, and carry trade impacts
- USD/CAD: Oil correlation and divergence between Fed and BoC paths
-
- When does FOMC volatility usually peak?
- Which part moves FX more, the rate decision or the statement?
- Why do price moves look random right after the release?
- How long should you wait before trading?
- What is the most common retail mistake during FOMC?
- How do you set risk when spreads blow out?
- Should you use market orders during FOMC?
- Can you trade FOMC with tight stops?
- Which pairs tend to react the most?
- What data matters most besides the decision?
- How do you prepare a plan before the release?
- What is a simple checklist to avoid platform risk?
- How is FOMC different from CPI?
- What usually happens after the first hour?
- When should you stand aside?
-
- Pre-event positioning: the days leading into the decision
- Decision minute: statement release and immediate algorithmic reaction
- Press conference dynamics: when reversals and trend confirmation often occur
- Post-event digestion: the 24 to 72 hour follow-through period
- How time zones and session overlaps change the liquidity and volatility profile
-
- Hawkish surprise, stronger USD outcomes and the usual price path
- Dovish surprise, when USD weakness accelerates and when it fades
- No surprise decision, why FX can still swing hard on guidance
- Split signals, “hawkish hold” and “dovish hike” outcomes
- Risk-on vs risk-off overlays, when equities and carry dominate FX
-
- Why spreads widen and liquidity thins around scheduled macro events
- Stop-loss clustering and wick behavior: how whipsaws form
- Market vs limit orders: execution trade-offs during high volatility
- Broker and venue differences: ECN vs market maker considerations
- Common execution mistakes that turn a good idea into a bad fill
-
- EUR/USD: Rate-differential focus and the role of European data timing
- USD/JPY: Sensitivity to U.S. yields and intervention risk considerations
- GBP/USD: Bank of England expectations and risk sentiment cross-currents
- AUD/USD and NZD/USD: Risk appetite, commodities, and carry trade impacts
- USD/CAD: Oil correlation and divergence between Fed and BoC paths
-
- When does FOMC volatility usually peak?
- Which part moves FX more, the rate decision or the statement?
- Why do price moves look random right after the release?
- How long should you wait before trading?
- What is the most common retail mistake during FOMC?
- How do you set risk when spreads blow out?
- Should you use market orders during FOMC?
- Can you trade FOMC with tight stops?
- Which pairs tend to react the most?
- What data matters most besides the decision?
- How do you prepare a plan before the release?
- What is a simple checklist to avoid platform risk?
- How is FOMC different from CPI?
- What usually happens after the first hour?
- When should you stand aside?
-
How to Place a Forex Trade Step by Step (Your First Trade Explained)
4 months ago -
Forex Trading vs Crypto Trading: Which Market Is Better for Beginners?
4 months ago -
Forex Lot Size Calculator: How to Use It to Size Trades Correctly
6 months ago -
How to Calculate Position Size in Forex (Position Sizing Formula + Examples)
6 months ago -
Forex Leverage Explained: How It Works, Pros, Cons & Examples
6 months ago
-
Forex Trading Platforms Comparison: MetaTrader vs cTrader vs TradingView
6 months ago -
Stop Loss vs Take Profit: Differences, Examples & Best Practices
6 months ago -
Is Forex Trading Legal in the United States? Rules, Regulators & What to Know
6 months ago -
Forex Market Hours & Trading Sessions Explained (Best Times to Trade)
6 months ago -
Forex Leverage Explained: How It Works, Pros, Cons & Examples
6 months ago