Technical Analysis in Forex Explained (Core Concepts for Beginners)

Price leaves a track record. Technical analysis helps you read it.
In forex, technical analysis means you study price charts to spot trends, levels, and repeatable patterns. You use that information to plan trades with clear entries, exits, and risk limits. You focus on what price does, not why it moves.
In this guide, you will learn the core concepts that beginners need. You will learn how candlesticks and timeframes work, how to mark support and resistance, how to identify trend direction, and how to use common indicators without stacking noise. You will also learn how to build a basic trading plan with defined risk using stop loss and take profit.
Key Takeaways
Key Takeaways
- In het kort: Technical analysis uses price and time. You read the chart, then plan the trade.
- In het kort: Candlesticks show open, high, low, close. Use them to spot momentum shifts and rejection at key levels.
- In het kort: Timeframes change what you see. Pick one main timeframe for direction, one lower timeframe for entries.
- In het kort: Support and resistance drive most decisions. Mark clear zones where price reacted before.
- In het kort: Trend direction matters. Trade with the trend unless you have a rule-based reason to fade it.
- In het kort: Indicators should confirm, not decide. Use one or two, avoid stacking signals that say the same thing.
- In het kort: Your plan needs defined risk. Set entry, stop loss, and take profit before you place the trade.
- In het kort: Protect your account first. Keep position size tied to your stop distance, not to your opinion.
Action steps: Mark the trend, draw your key levels, wait for price to react, then execute with fixed risk and a planned exit. Use a simple checklist, and keep it consistent. For execution rules, see how to set stop loss and take profit.
What Technical Analysis in Forex Means (Beginner-Friendly Definition)
Why forex prices can be analyzed from charts alone
Technical analysis in forex means you use price and volume data to plan trades. You read the chart. You look for trend, key levels, and momentum. You then set entry, stop loss, and take profit based on what price does.
Forex price reflects the net result of all participants. Banks, funds, exporters, hedgers, and retail traders all hit the same order book. Their actions print on the chart as swings, trends, and ranges. That is why many traders start with price first and news second.
Core assumptions, discounting, patterns, and repeatable behavior
- Price discounts known information. When traders expect a rate change or data surprise, they position early. The chart often moves before the headline lands. You trade what price confirms, not what you think should happen.
- Price trends and ranges. Markets often move in one direction for a time, then pause. Your job is to label the current state, trend up, trend down, or range, and trade rules that fit that state.
- Behavior repeats enough to trade. Traders react to prior highs, lows, and round numbers. Orders cluster. This creates repeatable reactions around support and resistance. You can learn the basics in support and resistance.
- Timeframes stack. A clean setup on a 15 minute chart fails more often when it fights the daily trend. You reduce noise by aligning higher timeframe direction with lower timeframe entries.
What technical analysis can and cannot tell you
What it can tell you. It can define bias, invalidation, and trade location. You can mark where buyers stepped in before, where sellers defended before, and where your idea becomes wrong. You can also measure risk in pips and size your position from that number.
What it cannot tell you. It cannot guarantee direction. It cannot forecast news shocks, gaps, or sudden liquidity drops. It also cannot remove drawdowns. Your edge comes from a repeatable method, solid risk limits, and execution discipline.
| Technical analysis helps you | Technical analysis does not |
|---|---|
| Find structure, trend, and key levels | Predict exact tops and bottoms |
| Plan entries with clear invalidation | Prevent losses or streaks of losses |
| Set stops and targets from chart logic | Replace risk management |
Technical vs Fundamental Analysis (and How Beginners Can Combine Both)
Technical vs Fundamental Analysis
Technical analysis uses price and volume to map trend, ranges, and key levels. It helps you plan entries, stops, and targets with clear chart rules.
Fundamental analysis uses macro data and policy to explain why a currency strengthens or weakens. It helps you build a directional bias and avoid trading against major drivers.
Most beginners fail by mixing them in the wrong order. They react to headlines, then force a chart entry. Flip it. Use fundamentals to set the backdrop, then use technicals to execute with defined risk.
When Fundamentals Tend to Dominate
- Interest rates and expectations. Central bank paths drive multi-week trends. Watch rate decisions, guidance, and market pricing.
- Inflation prints. CPI and wage growth can reprice rate expectations fast. Expect wider spreads and sharp swings around the release.
- Central bank communication. Speeches, minutes, and press conferences change expectations even without a rate move.
- Labor data. Jobs and unemployment often move USD pairs because they feed into growth and inflation expectations.
- Risk sentiment. In risk-off periods, funding and safe-haven flows can override local data.
Practical rule. If the calendar shows a top-tier event for your pair, reduce size, widen your “no-trade” window, or wait for post-news structure.
When Technicals Tend to Dominate
- High-liquidity sessions. London and New York often respect key levels because execution volume increases.
- Range conditions. When macro drivers stay stable, price often rotates between clear support and resistance.
- Positioning and stops. Markets hunt liquidity around obvious highs, lows, and round numbers. Expect spikes and fast reversals.
- End-of-day and week flows. Rebalancing and profit-taking can move price even without new information.
Practical rule. When no major data sits ahead, give more weight to trend, structure, and level reactions. Your chart becomes the main source of truth.
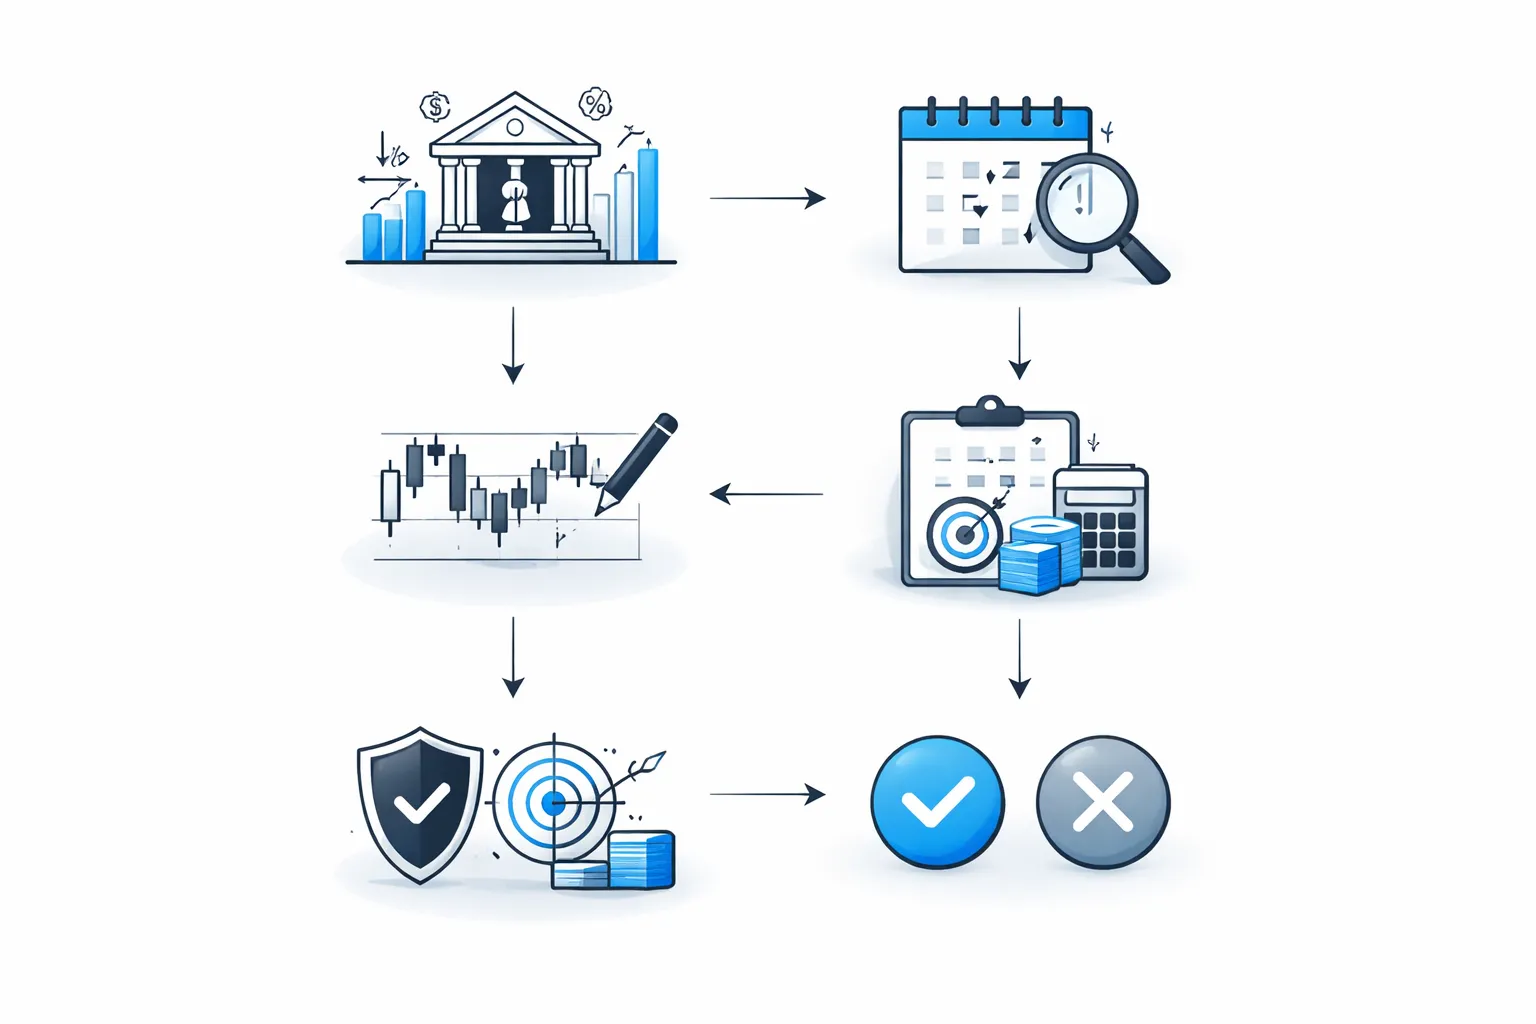
How Beginners Can Combine Both, A Simple Hybrid Workflow
| Step | What you do | Output |
|---|---|---|
| 1. Set macro bias | Check rates, inflation trend, and central bank tone for both currencies. | Lean bullish, bearish, or neutral for the pair. |
| 2. Mark event risk | Note high-impact releases and speeches for the next 24 to 72 hours. | Times you will not open new trades, or where you will cut size. |
| 3. Define technical plan | Mark trend, key levels, and invalidation points. Choose one setup type. | Entry trigger, stop location, target zones. |
| 4. Enforce risk | Set position size from stop distance. Require a minimum payoff. | Controlled downside, consistent process. Use a clear risk-reward ratio. |
| 5. Execute or skip | Take the trade only if price hits your level and confirms your trigger. Otherwise, do nothing. | Fewer trades, higher clarity, less overtrading. |
Keep the roles clean. Fundamentals decide direction and danger zones. Technicals decide price levels, timing, and when you are wrong.
How the Forex Market Works (So the Charts Make Sense)
Currency pairs explained: base, quote, pips, and spreads
Forex quotes show one currency priced in another. You trade the relationship.
Base currency comes first. Quote currency comes second. In EUR/USD, EUR is the base and USD is the quote.
If EUR/USD trades at 1.0850, you pay 1.0850 USD to buy 1 EUR. When the price rises, EUR strengthens versus USD. When it falls, EUR weakens versus USD.
- Pip is the standard unit of movement. Most pairs move in 0.0001 increments, so 1.0850 to 1.0851 is 1 pip.
- JPY pairs usually use 0.01 per pip, so 156.20 to 156.21 is 1 pip.
- Spread is the gap between bid and ask. It is your main built-in cost on entry.
Spreads change with liquidity. Tight spreads mean easier execution and cleaner chart levels. Wide spreads add noise and can trigger stops early.
| Term | What it means | Why it matters on charts |
|---|---|---|
| Bid | Price you can sell at | Stops and targets may fill near bid depending on order type |
| Ask | Price you can buy at | Your long entries pay the ask, not the bid |
| Spread | Ask minus bid | Acts like instant drawdown on entry |
| Pip value | Cash value per pip for your position size | Links chart distance to risk in dollars |
What moves FX intraday: sessions, liquidity, and volatility
FX trades 24 hours from Monday to Friday, but it does not move the same all day.
- Asia session often brings slower moves in many non-JPY pairs. JPY, AUD, and NZD pairs usually see more activity.
- London session often has the most volume. Many intraday trends start or accelerate here.
- New York session stays active, especially early. USD pairs react strongly to US data releases.
- Session overlaps can spike volatility. London and New York overlap often brings fast moves and sharp reversals.
Liquidity drives chart behavior. High liquidity tends to respect key levels better. Low liquidity can produce thin moves, sudden jumps, and messy wicks.
Volatility expands around scheduled events. CPI, jobs data, central bank decisions, and rate guidance can move price more in minutes than a normal session does in hours. Your levels can still work, but your stop size and execution risk change.
Why some pairs trend more (and others range more)
Pairs trend when one side has a clear macro advantage and the market reprices it over time. Rate differentials, growth outlook, and risk sentiment matter.
Pairs range when the two economies move in sync and the market sees little reason to revalue one against the other. In those conditions, price often rotates between established highs and lows.
- Major pairs usually have tighter spreads and cleaner structure. They can trend, but they often mean-revert around big levels during quiet weeks.
- Commodity-linked pairs can trend hard when commodities and risk sentiment move together. They can also whip when commodities gap.
- Crosses can trend or range depending on relative policy paths, but spreads can be wider, especially off-peak.
Match your technical approach to the pair. Use trend tools when the market shows strong directional structure. Use level-to-level execution when price rotates. This is where support and resistance stops feeling abstract and starts feeling like a map.
Chart Types and Timeframes: Choosing the Right View
Candlesticks vs Line vs Bar Charts
Your chart type changes what you notice first. Pick the view that matches your task.
- Line chart. Plots close price only. Best for quick trend direction and clean support and resistance zones. Weak for entries because it hides intrabar swings.
- Bar chart. Shows open, high, low, close. Gives full structure without the visual noise of candle bodies. Useful when you want price data, not patterns.
- Candlestick chart. Shows open, high, low, close with a body. Fast to read. Good for execution because you can see momentum, rejection, and consolidation at a glance.
Use line charts to map the big picture. Switch to candles or bars to plan entries, stops, and targets.
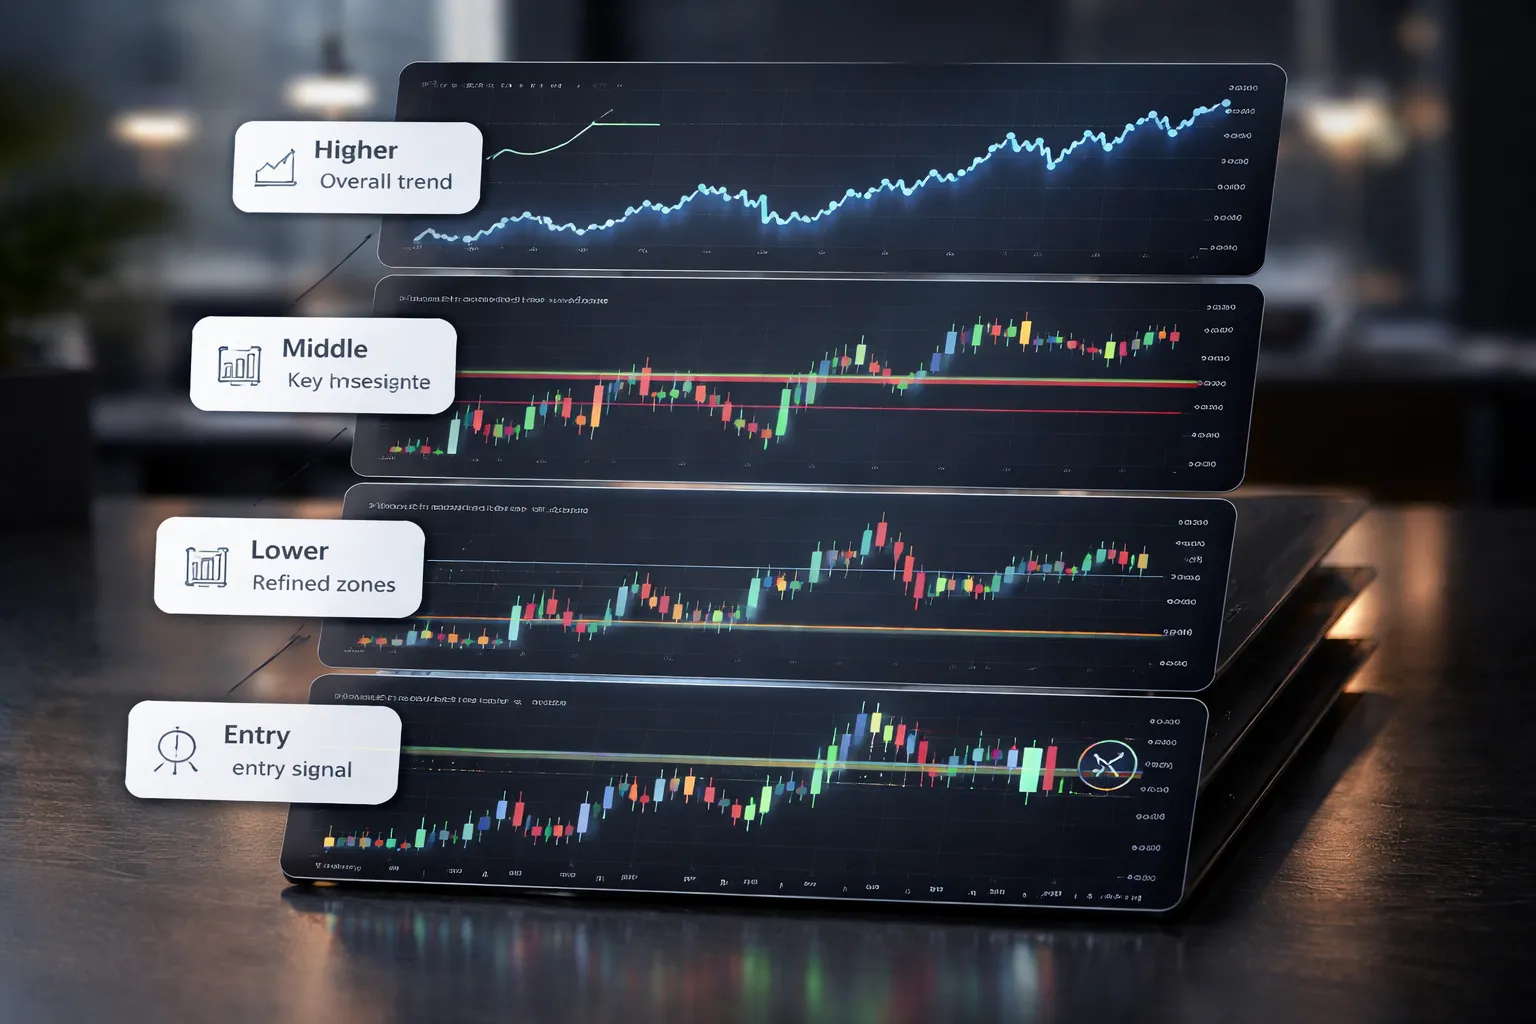
Multiple Timeframe Analysis, A Simple Top Down Routine
Start with context. Drop down for execution. Keep the same routine every time.
- Step 1, Higher timeframe. Mark the trend and the closest major swing highs and lows. You want clear level-to-level space. If structure looks messy, trade smaller or stand down.
- Step 2, Middle timeframe. Refine key zones. Look for range boundaries, broken levels, and pullback areas. This is where you decide if you trade with the trend or fade a range.
- Step 3, Lower timeframe. Time the entry. Look for a clean trigger near your level. Define invalidation fast. Place your stop where the idea is wrong, not where it feels comfortable.
Keep your analysis aligned. If the higher timeframe trends up and the middle timeframe pulls back into support, the lower timeframe should show stabilization before you enter.
Matching Timeframe to Your Trading Style
Your timeframe sets your holding time, your stop size, and how often you face noise.
| Style | Common chart timeframes | What you focus on | Practical notes |
|---|---|---|---|
| Scalping | 1m to 5m for entries, 15m to 1h for context | Micro structure, tight levels, quick exits | Spreads and execution matter more. Avoid thin liquidity hours. Accept more false breaks. |
| Day trading | 5m to 15m for entries, 1h to 4h for context | Intraday trend or range, session highs and lows | Plan around scheduled news. Close or reduce risk if volatility spikes. |
| Swing trading | 1h to 4h for entries, daily for context | Pullbacks, breakouts, multi-day moves | Stops need room. Hold through normal retracements. Track rollover costs. |
| Position trading | Daily to weekly for entries, weekly to monthly for context | Major trends, large levels, policy cycles | Fewer trades. Wider stops. You must size smaller and manage carry. |
Pick one primary timeframe. Use one higher timeframe for bias, one lower timeframe for entries. If your stop and target do not fit the timeframe, change the trade, not the chart. For deeper guidance on exits, see stop loss vs take profit.
Market Structure Essentials: Trend, Range, and Turning Points
Identifying Uptrends and Downtrends With Swing Highs and Lows
Market structure starts with swings. A swing high forms when price pushes up, then pulls back. A swing low forms when price drops, then bounces.
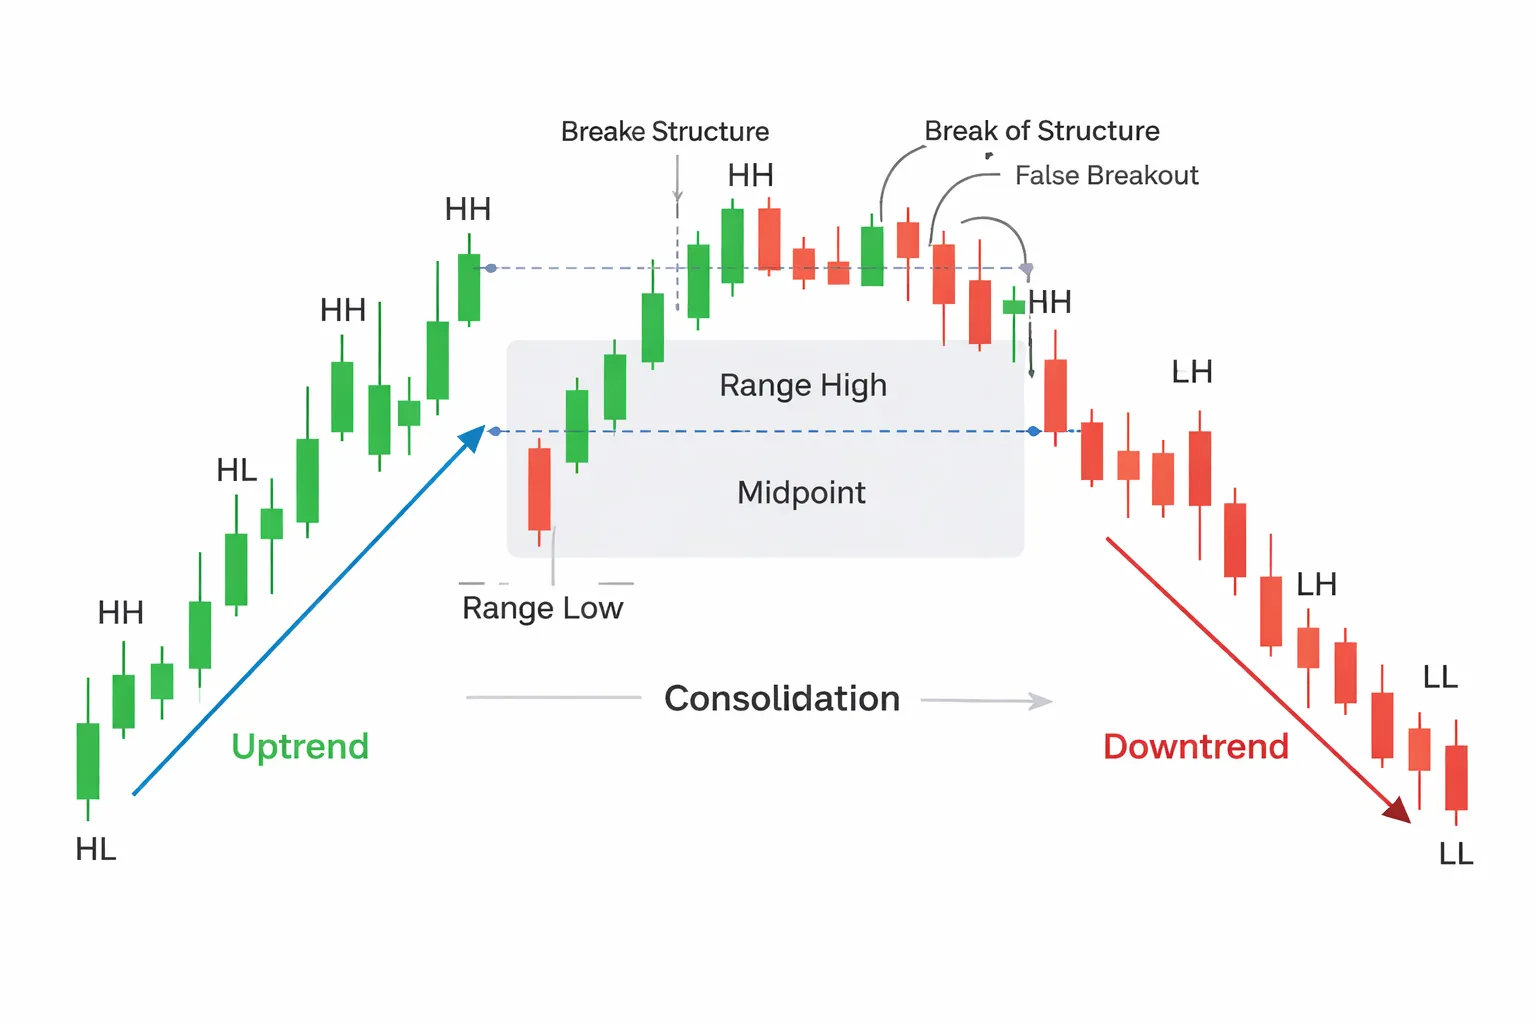
An uptrend holds when price prints higher highs and higher lows. A downtrend holds when price prints lower lows and lower highs.
- Uptrend: HH, HL. Your bias stays bullish while the last higher low holds.
- Downtrend: LL, LH. Your bias stays bearish while the last lower high holds.
- Key check: Mark the last protected swing. That level defines if the trend still stands.
Use your higher timeframe to label the swings that matter. Ignore minor zigzags on your entry timeframe. If you cannot point to a clean last swing high or low, you do not have a clear structure.
Spotting Consolidations and Defining a Valid Range
A range is a period where price stops making progress and rotates between two levels. You trade it as a box with a top and a bottom.
- Start with at least two clear touches near the top and two near the bottom.
- Prefer ranges that show rejection wicks at the edges and smaller candles in the middle.
- Draw the range with bodies first, then note wick extremes as secondary levels.
Define three zones. Range high, range low, range midpoint. The midpoint often acts as a decision line. Price acceptance above it favors longs, below it favors shorts.
Do not force a range around a steep trend pullback. If swings keep stepping in one direction, you have a trend, not a range.
Recognizing Breaks of Structure vs False Breakouts
A break of structure happens when price closes beyond the last meaningful swing. In an uptrend, structure breaks when price closes below the last higher low. In a downtrend, structure breaks when price closes above the last lower high.
- Valid break: Close beyond the level on your primary timeframe, then follow-through or a retest that holds.
- False breakout: Quick push through a level, then close back inside the prior structure.
- Filter: If the break does not hold for at least one full candle close, treat it as unproven.
Use your lower timeframe to time entries after the higher timeframe level breaks or holds. You want alignment, higher timeframe defines direction, lower timeframe gives a cleaner stop.
When you trade breaks, plan your target before you enter. Pick the next structure level, prior swing, range edge, or imbalance. If you need help setting targets, use this guide on how to set take profit levels.
Support and Resistance: The Backbone of Forex Technical Analysis
How to mark key support and resistance levels
Start on a higher timeframe. Use H4, daily, or weekly. Mark fewer levels. Make them count.
- Swing highs and swing lows. Mark clear turning points where price rejected hard and moved away fast. Focus on the last 2 to 5 major swings.
- Prior day high and low. Draw horizontal levels at yesterday’s high and low. These levels often act as intraday decision points.
- Session high and low. Mark Asia range high and low if you trade London or New York. Many breakout and reversal moves react there.
- Round numbers. Mark clean handles like 1.1000, 1.1050, 150.00. Price often pauses there because orders cluster near big figures.
- Consolidation edges. If price ranged for hours or days, mark the range high and range low. These edges matter more than the middle.
Then drop to your entry timeframe. Keep the higher timeframe levels. Do not add noise. If your chart turns into a grid, you marked too many.
Zones vs single lines
Support and resistance rarely act like a single price. Treat them as zones. Your job is to define a workable area for decisions, not a perfect line.
- Build the zone from bodies and wicks. If several candles rejected the same area, draw a band that covers the cluster.
- Widen the zone when volatility rises. News days and high ATR sessions need more tolerance. Tight lines cause early stop-outs.
- Refine with structure. Use the last reaction point. If price bounced from 1.1042 to 1.1048 multiple times, that is your zone.
- Use the middle as a reference. Treat the center as a guide, then manage entries and stops around the edges.
When you place stops, avoid hiding them right on the level. Put them beyond the zone. Give price room to test.
Role reversal: support becomes resistance and resistance becomes support
Role reversal gives you a clean, repeatable read.
- Break. Price closes through a level on your higher timeframe or prints a clear impulse move through it.
- Retest. Price returns to the level or zone. This is where many trades set up.
- Hold or fail. If the old resistance holds as new support, buyers defend it. If the old support holds as new resistance, sellers defend it.
Grade the retest. Strong setups show rejection and continuation. Weak setups churn inside the zone.
- Strong hold signs. Fast rejection, small pullback depth, clean higher low or lower high, close back away from the zone.
- Weak signs. Multiple deep pushes through the zone, long time spent inside it, closes on both sides.
For precise execution, align the retest with your lower timeframe entry trigger. Keep your bias tied to the higher timeframe level. If you need a framework for syncing direction and entry timing, use this guide on multi-timeframe analysis in forex.
Trendlines, Channels, and Price Action Clues
Drawing trendlines correctly
A trendline is a boundary for price swings. It works best when you treat it as a zone, not a single perfect line.
- Start with the right timeframe. Draw your main trendline on the higher timeframe you trade from, then refine on the next lower timeframe.
- Use clean swing anchors. In an uptrend, connect higher lows. In a downtrend, connect lower highs. Pick swings that stand out without zooming in.
- Require at least three touches. Two points draw a line. Three points validate it. More touches add weight if price respects the line with clear reactions.
- Keep the slope realistic. If the line is too steep, it will break often. Redraw to a broader set of swings when you see repeated clean breaks.
- Decide wick vs close, then stay consistent. Use wicks for swing structure. Use closes when you want a stricter rule for breaks and retests.
Common mistakes cause most false signals.
- Forcing a line to fit. If you need to ignore multiple violations, you do not have a trendline.
- Anchoring to noisy micro swings. If you must zoom in to see the swing, it is not a strong anchor.
- Moving the line after every candle. Adjust only when structure changes, not because price poked through once.
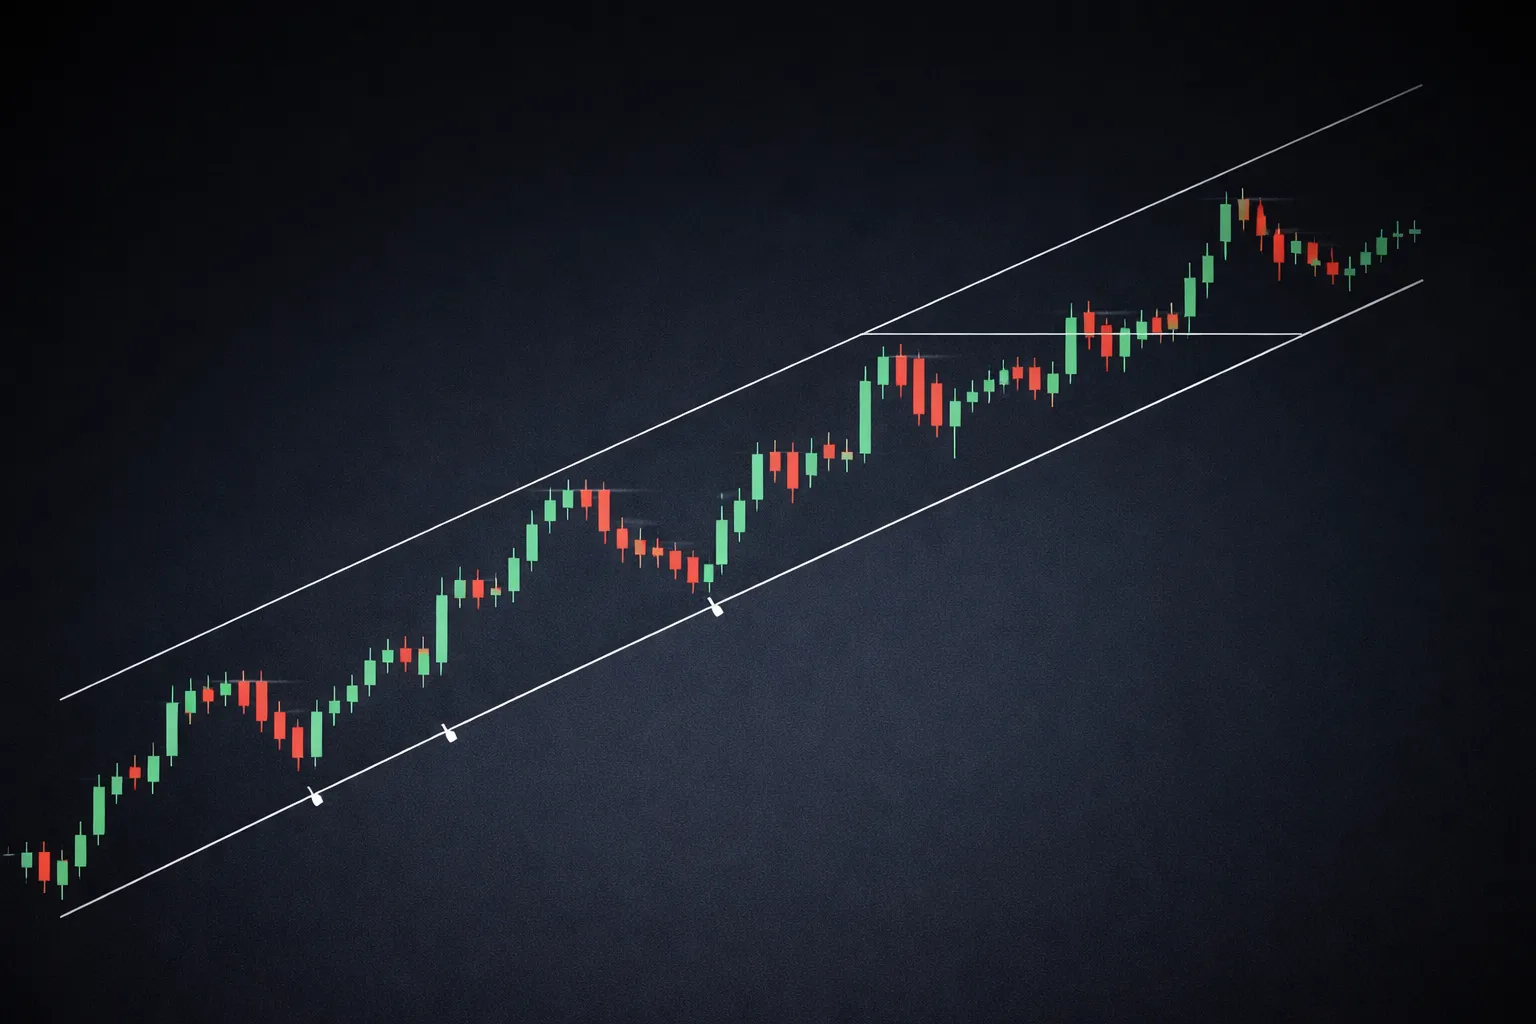
Using channels to estimate pullbacks and extensions
A channel pairs a trendline with a parallel line. It helps you estimate where pullbacks may end and where extensions may stall.
- Step 1, draw the baseline. Use your validated trendline from swing lows in an uptrend or swing highs in a downtrend.
- Step 2, copy it in parallel. Place the parallel line on the opposite swing, the first clear swing high in an uptrend, or swing low in a downtrend.
- Step 3, map probable areas. The midline, if you add one, often acts as a reaction area. The outer line often marks stretched price.
Use channels as a planning tool, not a signal by itself.
- Pullback planning. In an uptrend, look for long entries when price pulls toward the lower channel line and shows rejection. In a downtrend, do the reverse.
- Extension control. When price hits the outer band after a strong run, tighten risk. Avoid new entries into the band unless you have a clear breakout plan.
- Break rules. One spike outside the channel means little. Multiple closes outside it, plus a failed retest back inside, often signals a change in trend strength.
| Channel event | What it often implies | What you do |
|---|---|---|
| Clean touch and rejection at outer band | Trend still controls | Look for continuation entries with defined invalidation |
| Multiple closes outside the band | Momentum expansion | Wait for a pullback to the band, then reassess |
| Break, then retest fails | Channel no longer frames price | Redraw using new swings, reduce size until structure stabilizes |
Clean price action signals: momentum candles and rejection wicks
Price action clues help you judge intent at your level, trendline, or channel boundary. Focus on two signals that show up across pairs and timeframes.
- Momentum candles. A wide real body that closes near its extreme. It often breaks a line or confirms a bounce. Treat it as stronger when it closes beyond the level, not just wicks through it.
- Rejection wicks. A long wick into the level with a close back away from it. It shows price tested liquidity and got pushed back.
Use simple filters so you avoid weak reads.
- Location first. Signals matter most at a trendline touch, channel boundary, or a prior swing level. Signals in the middle of nowhere carry less weight.
- Close matters. For bullish rejection, you want a close back above the level. For bearish rejection, you want a close back below it.
- Follow-through. One candle can lie. A second candle that continues in the same direction boosts validity.
- Invalidation point. Place your trade idea where it dies. For rejection, the wick extreme often marks the line in the sand.
Execution still needs an order decision. If you want a clean way to match the setup to your entry type, use this guide on forex order types.
Candlestick Patterns Beginners Should Actually Learn (and How to Use Them)
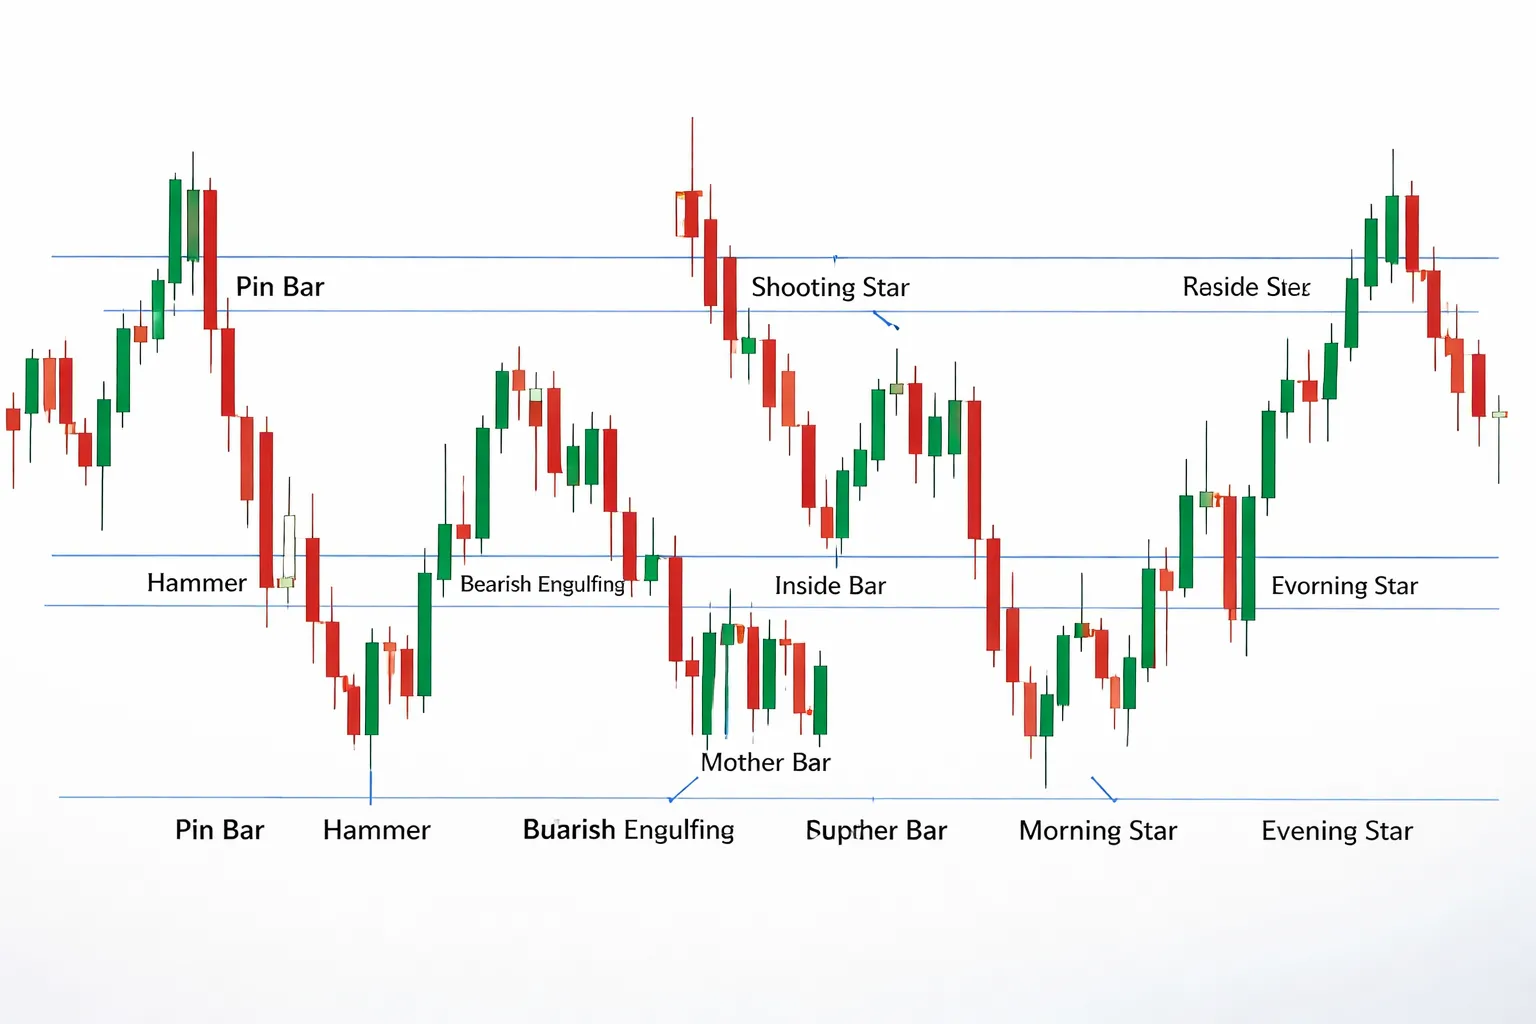
Single-candle signals, pin bars, hammers, and shooting stars
Most single-candle patterns fail when you trade them in the middle of nowhere. Use them as rejection signals at a level, or at the edge of a trend move.
- Pin bar. Small body, long wick, close back toward the open. The wick shows rejection. The close shows who won the session.
- Hammer. Bullish pin bar after a drop. Long lower wick, small body near the top. Buyers defended the lows.
- Shooting star. Bearish pin bar after a rise. Long upper wick, small body near the bottom. Sellers defended the highs.
How to use them:
- Location first. Mark the swing high or low, prior daily high or low, and clean support or resistance. Wait for the candle to reject that area.
- Entry. Enter on a break of the pin bar high for bullish setups, or a break of the pin bar low for bearish setups. Conservative traders wait for the next candle to close in the trade direction.
- Stop loss. Place it beyond the wick extreme. If price breaks the wick, rejection failed.
- Target. Use the next obvious level, or a fixed multiple of risk. Keep it simple.
Two- and three-candle setups, engulfing, inside bars, morning and evening star
Multi-candle patterns give you a clearer shift in control. They still need context. Treat them as evidence, not a trigger by itself.
- Engulfing. A candle body fully covers the prior candle body. Bullish engulfing after a decline shows buyers took control. Bearish engulfing after a rally shows sellers took control.
- Inside bar. The entire candle sits inside the prior candle range. It signals compression. Price often expands after.
- Morning star. Three candles, strong down candle, small indecision candle, strong up candle that closes well into the first candle. It shows a reversal attempt.
- Evening star. The bearish version, strong up, indecision, strong down that closes well into the first candle.
How to use them:
- Engulfing entry. Enter on the break of the engulfing candle high or low, in the direction of the engulf. Put the stop beyond the engulfing candle extreme.
- Inside bar entry. Use a stop order above the mother bar high for a bullish break, or below the mother bar low for a bearish break. Place the stop beyond the other side of the mother bar. Skip low-range inside bars in dead sessions.
- Star patterns. Trade them like a reversal structure. You want the third candle to close with strength. Enter on the next break in the same direction as the third candle. Stop goes beyond the pattern extreme.
Context matters, combine patterns with levels and trend
Candlestick patterns work best when they align with structure. You want a reason for traders to react in that area.
- Trade with the trend. In an uptrend, focus on bullish patterns at support and pullbacks. In a downtrend, focus on bearish patterns at resistance and rallies.
- Use levels that matter. Prior swing points, range highs and lows, and clear support and resistance. If you cannot draw it in five seconds, it is not clean enough.
- Demand follow-through. After the pattern prints, price should move away from the level. If it stalls, reduce risk or pass.
- Avoid weak signals. Tiny wicks, messy candles, and patterns inside chop. A pattern inside a tight range often means noise, not intent.
- Plan your risk first. Define stop distance, target, and position size before entry. If your stop is wide, you need a larger target. Use a simple risk-reward ratio rule to filter trades.
Indicators and Oscillators: What They Measure and When to Use Them
Indicators and Oscillators, What They Measure and When to Use Them
Indicators process price data. Some track trend. Some track momentum. Some track volatility. Use them to filter trades and manage risk, not to predict exact turning points.
Moving Averages, Trend Filter and Dynamic Levels
A moving average (MA) smooths price. It helps you trade in the direction of the main move and avoid chop.
- What it measures: The average price over a set lookback, shown as a line.
- Best use: Trend filtering and pullback entries.
- Common approach: Use one MA as a regime filter. Only take longs when price holds above it, only take shorts when price holds below it.
- Dynamic support and resistance: In clean trends, price often reacts near the MA. Treat it as an area, not a precise line.
- Limits: MAs lag. In ranges, they generate many false flips.
RSI, Momentum and Range Conditions
RSI tells you how strong recent gains are versus recent losses. It works best when you match it to market type.
- What it measures: Momentum, based on the speed of recent closes.
- Best use: Range trading, momentum confirmation, and spotting shifts in strength.
- Range read: In ranges, RSI often oscillates between 40 and 60. A push to 70 or 30 can mark a range extreme, but you still need price levels for entries.
- Trend read: In uptrends, RSI often holds above 40 and reaches 60 to 80 on impulse legs. In downtrends, it often caps near 60 and reaches 20 to 40 on selloffs. Use these zones to avoid fading strong trends.
- Divergence: Divergence can warn of weakening momentum, but it is early. Use it as a caution signal, not a trigger.
If you want a deeper RSI walkthrough, use this RSI indicator guide.
MACD, Trend and Momentum Confirmation
MACD compares two moving averages and tracks their relationship over time. It helps you confirm trend strength and spot possible shifts.
- What it measures: Momentum and trend direction, based on MA spread and a signal line.
- Best use: Confirmation, not timing exact entries.
- Trend confirmation: When MACD stays on one side of its baseline for long periods, trend pressure dominates. Use that to avoid countertrend trades.
- Shift warning: A baseline cross after a long run can signal a regime change, especially when price also breaks structure.
- Limits: Like all MA-based tools, MACD lags and can whip in ranges.
Bollinger Bands, Volatility and Squeeze Behavior
Bollinger Bands adapt to volatility. They help you see when the market compresses and when it expands.
- What it measures: Volatility around a moving average using standard deviation bands.
- Best use: Spotting volatility contraction and expansion, plus managing expectations on range moves.
- Squeeze: Narrow bands signal low volatility. A squeeze often precedes a larger move, but it does not tell you direction. Wait for price to break and hold outside the range, then manage risk.
- Band rides: In strong trends, price can walk the band. Do not treat every touch as a reversal.
- Limits: Bands expand after volatility increases, so late entries often come with wider stops.
Avoiding Indicator Overload
More indicators do not mean more edge. Many indicators repeat the same input, price.
- Pick 1 trend tool: MA or MACD.
- Pick 1 momentum or volatility tool: RSI or Bollinger Bands.
- Keep price first: Use structure, key levels, and clean candles as the trigger. Use indicators as filters.
- Use one timeframe for bias, one for entry: A higher timeframe for direction, a lower timeframe for execution.
- Track outcomes: Log trades with and without the indicator filter. Keep the tool only if it improves your win rate, average win, or drawdown.
| Tool | Measures | Use it when | Avoid it when |
|---|---|---|---|
| Moving Average | Trend direction and smoothing | Market trends cleanly, you want pullbacks with the trend | Market ranges tightly, frequent crossovers |
| RSI | Momentum | You need a range filter or momentum confirmation | You use 70 and 30 as reversal signals in strong trends |
| MACD | Trend and momentum via MA spread | You want confirmation and regime shift clues | You need early signals in choppy conditions |
| Bollinger Bands | Volatility and compression | You want squeeze and breakout context, or range expectation | You fade band touches without structure support |
Volume, Volatility, and Session Tools (Often Missed in Beginner Guides)
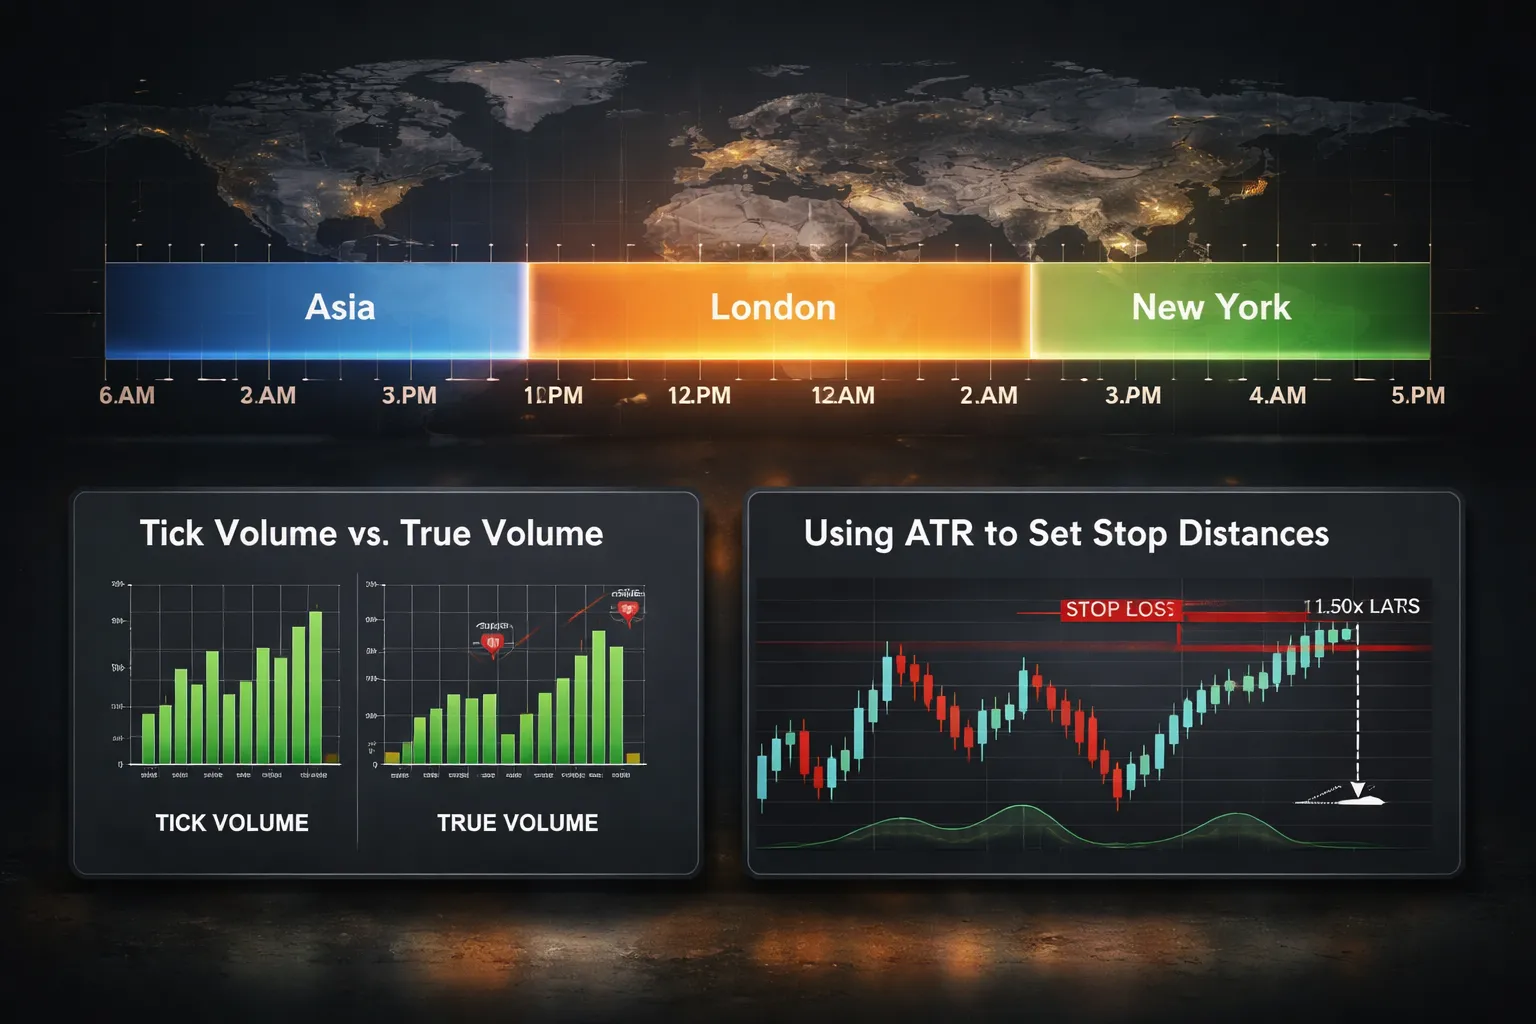
Volume in Spot FX, Why You Do Not Get “True” Volume
Spot FX has no central exchange. You do not see total traded volume across all participants.
Your platform shows broker-specific data. Most charts use tick volume, the count of price updates in a candle.
Tick volume is still useful. It tracks activity. When activity rises, liquidity and intent often rise with it.
- Use tick volume for confirmation. Breakouts with higher tick volume tend to follow through more than breakouts on low activity.
- Watch volume at key levels. If price hits support or resistance and tick volume spikes, you often get either rejection with fast reversal, or a clean level break.
- Compare like with like. Judge volume relative to the last 20 to 50 candles on the same session. Do not compare Asian session volume to London overlap volume.
- Avoid volume myths. Low tick volume does not mean “smart money.” It usually means fewer participants and higher failure risk.
Volatility, Use ATR to Set Stops and Targets That Match Reality
Most beginner losses come from stops that ignore volatility. Price moves. Your stop must sit outside normal noise.
Use ATR, Average True Range. ATR tells you the recent average movement per candle for your timeframe.
- Stop placement. Put your stop beyond structure, then check if the distance is at least 1.0 to 1.5 ATR from entry. If not, your stop sits inside normal swing range.
- Target sizing. Use ATR to set a minimum realistic target. If you target 0.5 ATR moves in a slow pair, you will need perfect timing. If you target 3 ATR in a range session, you will wait or get reversed.
- Trade filtering. If ATR expands fast, spreads and slippage often rise. If ATR contracts, breakouts fail more and ranges dominate. Match your strategy to the regime.
Keep the math simple. Decide your stop in ATR terms, then set position size to control risk. For practical examples, see stop loss vs take profit.
Session Tools, Highs, Lows, and Time of Day Effects
Forex moves by session. Liquidity and volatility change by the clock.
- Asian session. Often slower for EUR and GBP pairs. Ranges form. False breaks increase.
- London open. Volatility rises. Many days set direction here. London often runs stops above the Asian high or below the Asian low.
- London and New York overlap. Highest activity window for major pairs. Breakouts and trend continuation work better. Reversals also hit harder.
- Late New York. Movement can fade. Follow-through drops.
Mark session highs and lows. Use them as reference points.
- Break and hold. If price breaks the Asian high during London with rising activity, continuation becomes more likely.
- Sweep and reject. If price runs the Asian high then closes back inside the range, you often get a move to the other side of the range.
- Use time filters. If your setup needs momentum, avoid placing it in the quietest hours for that pair.
Economic Calendar Awareness, Prevent Clean Setups From Failing
News creates volatility spikes that can invalidate technical levels. Price can ignore support, resistance, and indicators for minutes or hours.
- Check high-impact events before you trade. CPI, NFP, rate decisions, and central bank speeches change conditions fast.
- Manage the event window. Avoid new entries 15 to 30 minutes before major releases. Tight stops often die here.
- Expect spread changes. Spreads widen at release time and at rollovers. Your stop can fill worse than expected.
- Re-evaluate after the first impulse. Let the initial spike print. Then look for structure. Many clean trades appear after volatility normalizes.
Entry and Exit Basics: Turning Analysis into a Trade Plan
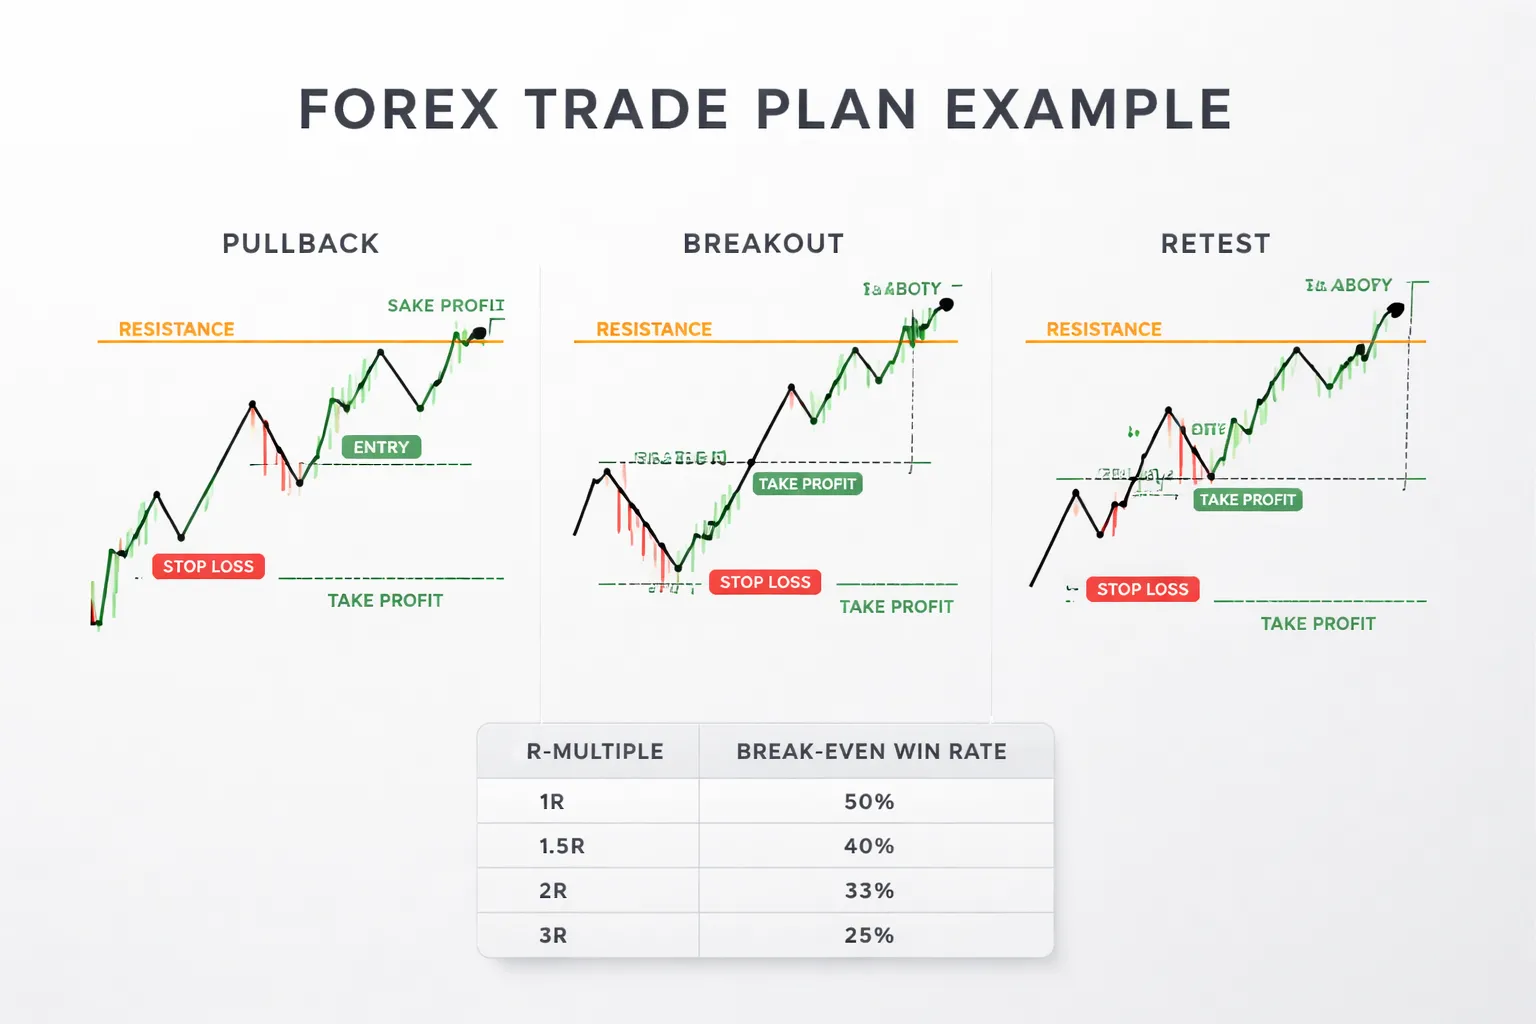
Common Entry Methods
Your analysis becomes a plan when you define an entry trigger. Use a method that matches the market state, trend, range, or fresh expansion.
- Pullback entry: Trade with the trend after price pulls back into prior support or resistance. Wait for a clear rejection, then enter near the level. Place your entry where your trade becomes wrong fast if price breaks through.
- Breakout entry: Enter when price closes beyond a level that held multiple times. Avoid thin breaks. Favor a strong close and rising range size. Treat false breaks as common, not rare.
- Retest entry: Let price break a level, then wait for a pullback to that same level. Enter after the retest holds. This often gives a tighter stop than a raw breakout.
Stop-Loss Placement Based on Structure
Place your stop where the chart says your idea fails. Do not place it where your feelings feel safe.
- Use swing points: For longs, put the stop below the last higher low. For shorts, put it above the last lower high.
- Use the level, not the line: Support and resistance act as zones. Give your stop room beyond the zone and beyond the wick noise.
- Match stop size to volatility: If the pair prints larger candles, you need a wider stop or no trade. A tight stop in a volatile session gets clipped.
- One invalidation point: If you cannot state the exact structure that invalidates the setup, you do not have a stop. Skip the trade.
If you need a clear workflow for this, use this guide on how to set stop loss and take profit.
Targets Using R-Multiples, Levels, and Measured Moves
Set targets before you enter. Use objective rules so you do not improvise under pressure.
- R-multiples: Define 1R as your risk, the distance from entry to stop. A 2R target means your profit distance equals 2 times your risk.
- Key levels: Target the next major support or resistance, prior swing high or low, or a range boundary. These areas often trigger reactions.
- Measured moves: In ranges, project the range height from the breakout point. In trends, use the last impulse leg as a reference and project a similar distance from the next pullback.
- Scale-outs with rules: If you take partial profits, define the exact points, like 1R and 2R. Keep the method consistent so results stay measurable.
Risk-to-Reward and Win Rate Work Together
Risk-to-reward does not mean much without win rate. You need both to judge if a plan has an edge.
| Average R per win | Win rate needed to break even |
|---|---|
| 1R | 50% |
| 1.5R | 40% |
| 2R | 33.3% |
| 3R | 25% |
Use this to choose a style that fits your market. Breakouts can deliver larger R, but they often win less. Pullbacks can win more, but targets can sit closer. Track at least 30 to 50 trades per setup. Log entry type, stop distance in pips, R result, and session. Keep the data. Cut what fails.
Risk Management and Position Sizing (The Real Edge for Beginners)
Set a Fixed Risk Per Trade
Your edge comes from survival. You need enough trades for your data to mean something.
Pick a fixed percent risk per trade. Keep it small. Most beginners should use 0.25% to 1%.
Fixed risk does three things.
- It caps damage during a losing streak.
- It keeps your results comparable across setups and sessions.
- It stops one trade from wrecking your month.
Define your R first. R is your risk per trade. Example, 1R equals 1% of your account. Every result ties back to that number.
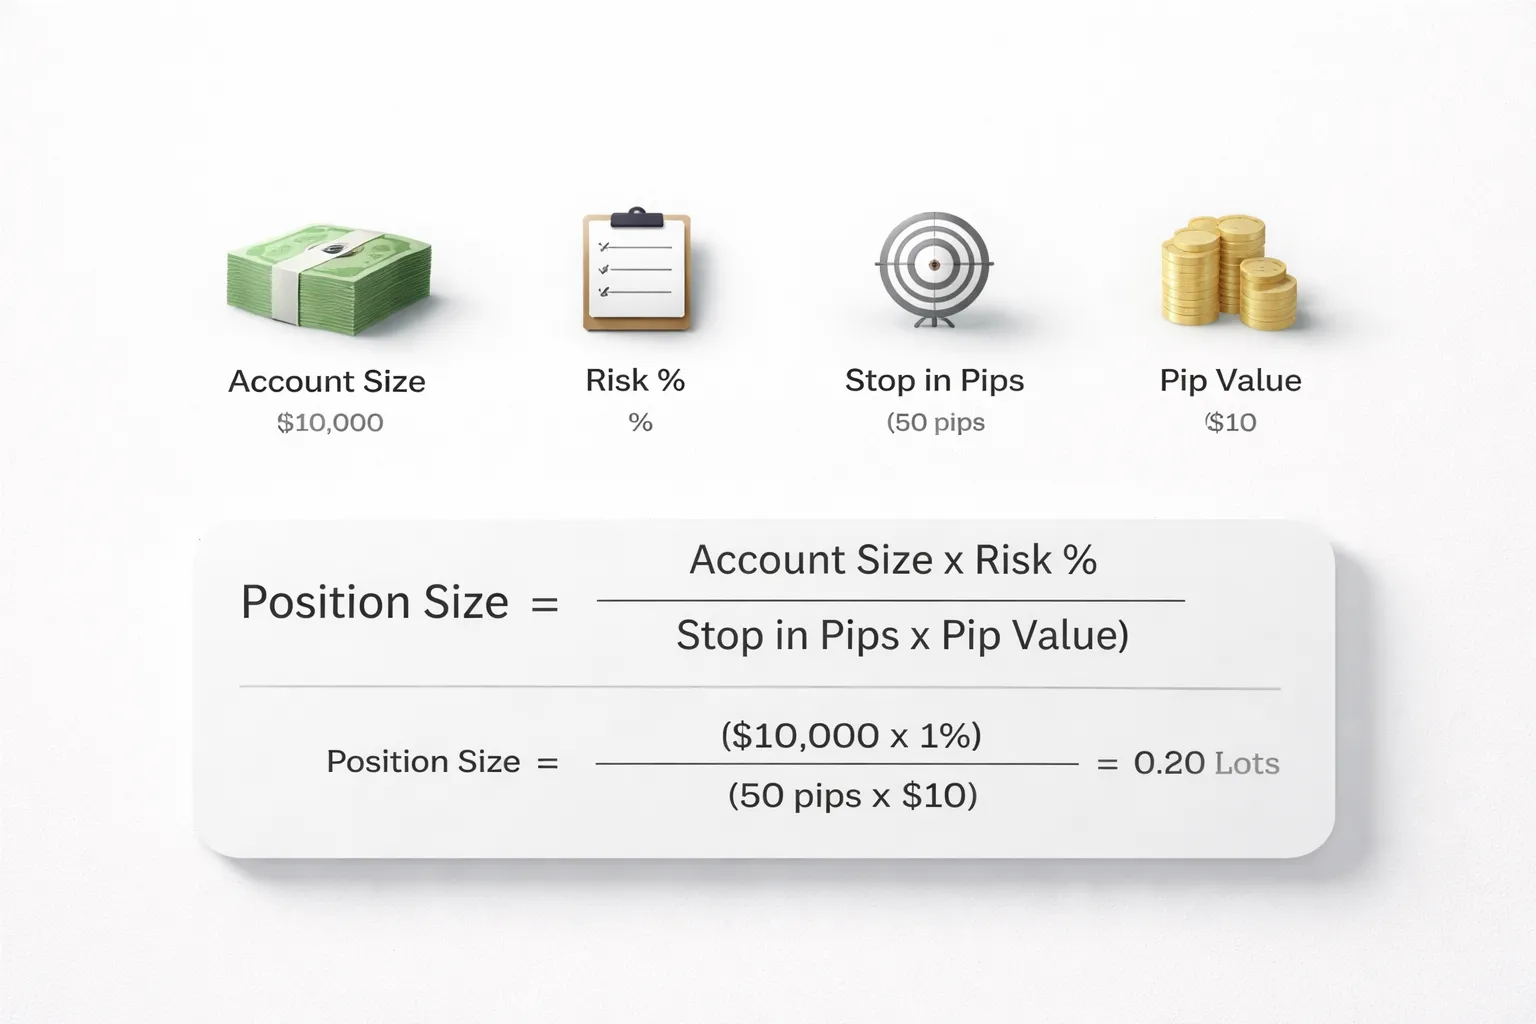
Position Sizing With Pip Value and Stop Distance
You size the trade from your stop. Not from your bias. Not from your confidence.
Use this formula.
Position size (lots) = Risk ($) / (Stop (pips) x Pip value per lot ($/pip))
Step by step.
- Set account risk. Example, $5,000 account, 1% risk, risk equals $50.
- Set stop distance. Example, 25 pips.
- Use pip value per lot for your pair. For many USD-quoted majors, 1.00 lot is about $10 per pip. Confirm in your platform.
- Compute lots. $50 / (25 x $10) = 0.20 lots.
Same risk, different stop, different size. That is the point.
| Risk ($) | Stop (pips) | Pip value per 1.00 lot ($/pip) | Position size (lots) |
|---|---|---|---|
| 50 | 10 | 10 | 0.50 |
| 50 | 25 | 10 | 0.20 |
| 50 | 50 | 10 | 0.10 |
If your platform shows pip value for the exact position size, use it. If it does not, use a pip value calculator and save the numbers for the pairs you trade.
Leverage and Margin Basics, Avoid Blow-Ups
Leverage changes margin. It does not change your stop size in pips. Losses still hit your account the same way.
Margin is the deposit your broker locks to hold the trade. If margin gets tight, you lose control. Your broker can close trades at the worst time.
Rules that keep you alive.
- Risk stays fixed. Leverage never changes your percent risk.
- Keep free margin high. Avoid stacking positions that push margin usage up.
- Limit total exposure. If you trade pairs that share the same currency, you can double up risk without noticing.
If you want a simple guardrail, cap total open risk. Many beginners use 2R to 3R max across all positions. When you hit the cap, you do nothing.
If you trade multiple pairs, check correlation first. Use this forex correlation pairs list to avoid taking the same trade five times.
Common Risk Mistakes That Kill Beginners
- Moving stops wider. You turn a planned 1R loss into a random loss. Price does not owe you a bounce. If your stop is wrong, exit and review.
- Revenge trading. You increase size or take lower quality setups to get money back. You trade emotion, not rules.
- Overtrading. You take every wiggle. Your log fills with noise. Your costs rise. Your focus drops.
Use a checklist and enforce it. Track your risk, stop in pips, lots, and R result. If you break a rule, mark the trade as invalid. Do not count it in your stats.
A Simple Technical Analysis Workflow You Can Follow Today
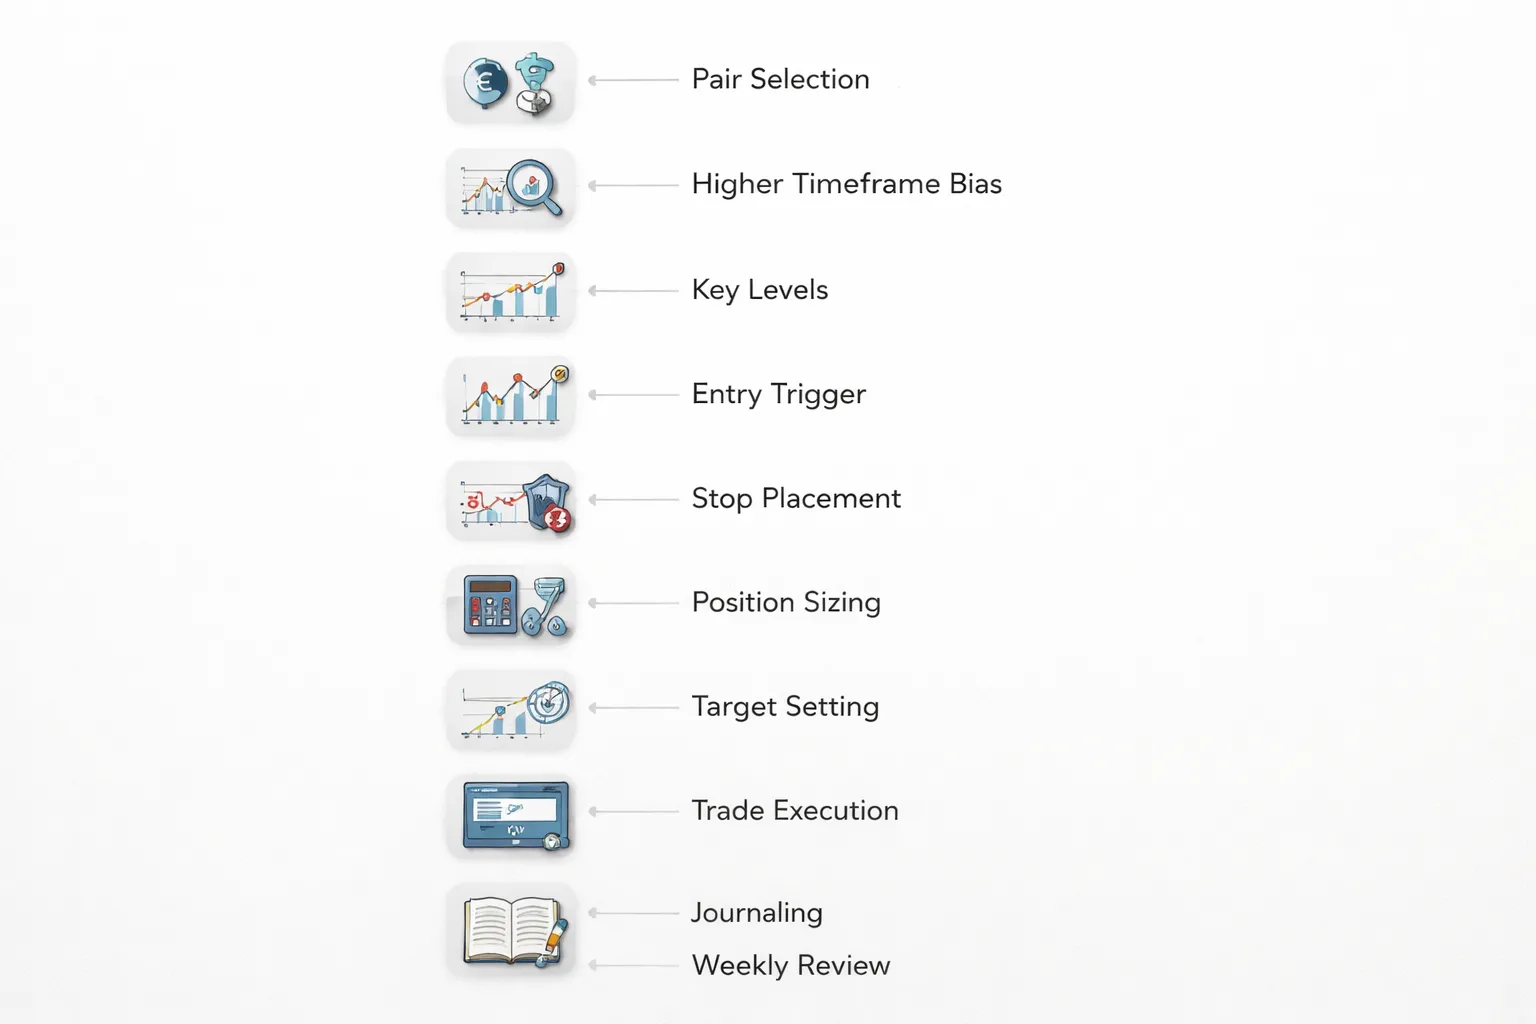
Step-by-step checklist you can run before every trade
- 1) Pick your pair. Choose 1 to 3 pairs you can track daily. Stick to liquid majors and crosses. Avoid wide spreads.
- 2) Set the timeframe stack. Use a higher timeframe for direction, a lower timeframe for entry. Example, H4 for bias, M15 for trigger.
- 3) Define your bias. Mark one of these only: uptrend, downtrend, range. Use structure first, higher highs and higher lows, or lower highs and lower lows.
- 4) Mark key levels. Draw the closest swing high and swing low. Add the most recent consolidation boundary. Mark the prior day high and low if you day trade.
- 5) Wait for price to reach a level. No level, no trade. Do not chase price in the middle of a zone.
- 6) Look for a trigger. Use one clear rule for entry. Example, break and close beyond a level, then retest hold. Or a single confirmation candle at the level.
- 7) Place the stop based on structure. Put it where your idea is wrong, beyond the level or beyond the swing. Do not use an arbitrary pip stop.
- 8) Set target and R. Define target before entry. Use the next level as the first target. Only take trades that offer enough reward for your stop size, document your minimum, example 1.5R.
- 9) Size the position. Risk a fixed percent or fixed amount per trade. Convert stop pips to lot size. Lock this rule.
- 10) Set trade management rules. Decide in advance, take partials or not, move stop or not. One plan. No improvising.
- 11) Log it. Screenshot before and after. Record the checklist result. If you broke a rule, mark it invalid.
Example template you can copy: trend filter, key level, confirmation candle
Trend filter (H4): Only buy if price holds above the last higher low and breaks the last swing high. Only sell if price holds below the last lower high and breaks the last swing low.
Key level (H1): Mark the last broken swing level, or the edge of the most recent consolidation. Treat it as your decision zone.
Entry trigger (M15): Wait for price to touch the level, then print one confirmation candle:
- Buy: bullish close back above the level, with the candle body closing above the level.
- Sell: bearish close back below the level, with the candle body closing below the level.
Stop: Beyond the swing point that sits on the other side of the level. Add a small buffer only if spread requires it.
Target: Next clear opposing level. If you trade trends, you can trail behind new swings after price reaches 1R.
Minimum criteria: Spread under your limit, clean level touch, confirmation candle closes where you need it, target gives your minimum R.
Keeping a trading journal: what to record and how to review
Your journal is your feedback loop. Keep it simple. Make it measurable.
- Trade ID, date, session. London, New York, overlap.
- Pair and timeframes used. Example, H4, H1, M15.
- Setup tag. Example, trend plus retest, range reversal, breakout.
- Bias and level. Uptrend, key level at 1.0840, prior swing high.
- Entry, stop, target. Include stop in pips and target in pips.
- Position size and risk. Dollars at risk, percent risk, planned R multiple.
- Result in R. Example, +1.8R, -1R, +0.4R.
- Execution notes. Slippage, spread, missed entry, early exit.
- Rule compliance. Valid or invalid. List the broken rule if invalid.
- Screenshots. Before entry, at entry, at exit.
Review routine: Review every 20 trades, or weekly. Sort by setup tag and by valid only. Track win rate, average win in R, average loss in R, expectancy in R. Find your top two setups. Cut the rest. If you need a structured practice plan, use demo replays and routines to test the workflow without live risk.
Backtesting and Practice: Building Confidence Without Guesswork
Manual Backtesting vs Strategy Tester
Backtesting turns your rules into numbers. It shows you what your setup does across many samples. It stops you from relying on memory.
- Manual backtesting. You scroll bar by bar and take trades as if live.
- Strategy tester. You code rules and let software run the test.
| Method | Pros | Cons |
|---|---|---|
| Manual backtest |
|
|
| Strategy tester |
|
|
For most beginners, start manual. You need screen time and clean process. Use a tester later to validate one tight rule set.
Paper Trading and Demo Accounts, Treat Them Like Real
Demo builds habits. Bad demo habits become live habits. Trade demo like it is your job.
- Use the same risk per trade you will use live, such as 0.25R to 1R.
- Use real market hours. Trade the session you can actually trade.
- Use realistic costs. Add spread assumptions and do not ignore slippage on stops.
- Place orders the same way every time. Same order type, same stop rules, same take profit rules.
- Do not increase size after wins. Do not revenge trade after losses.
- Limit your focus. Trade one or two pairs and one timeframe until your data stabilizes.
If you rely on structure, practice it with replay charts and a fixed routine. This keeps your process consistent with how you draw levels and plan entries. If you need a refresher on levels, read support and resistance and keep the rules strict.
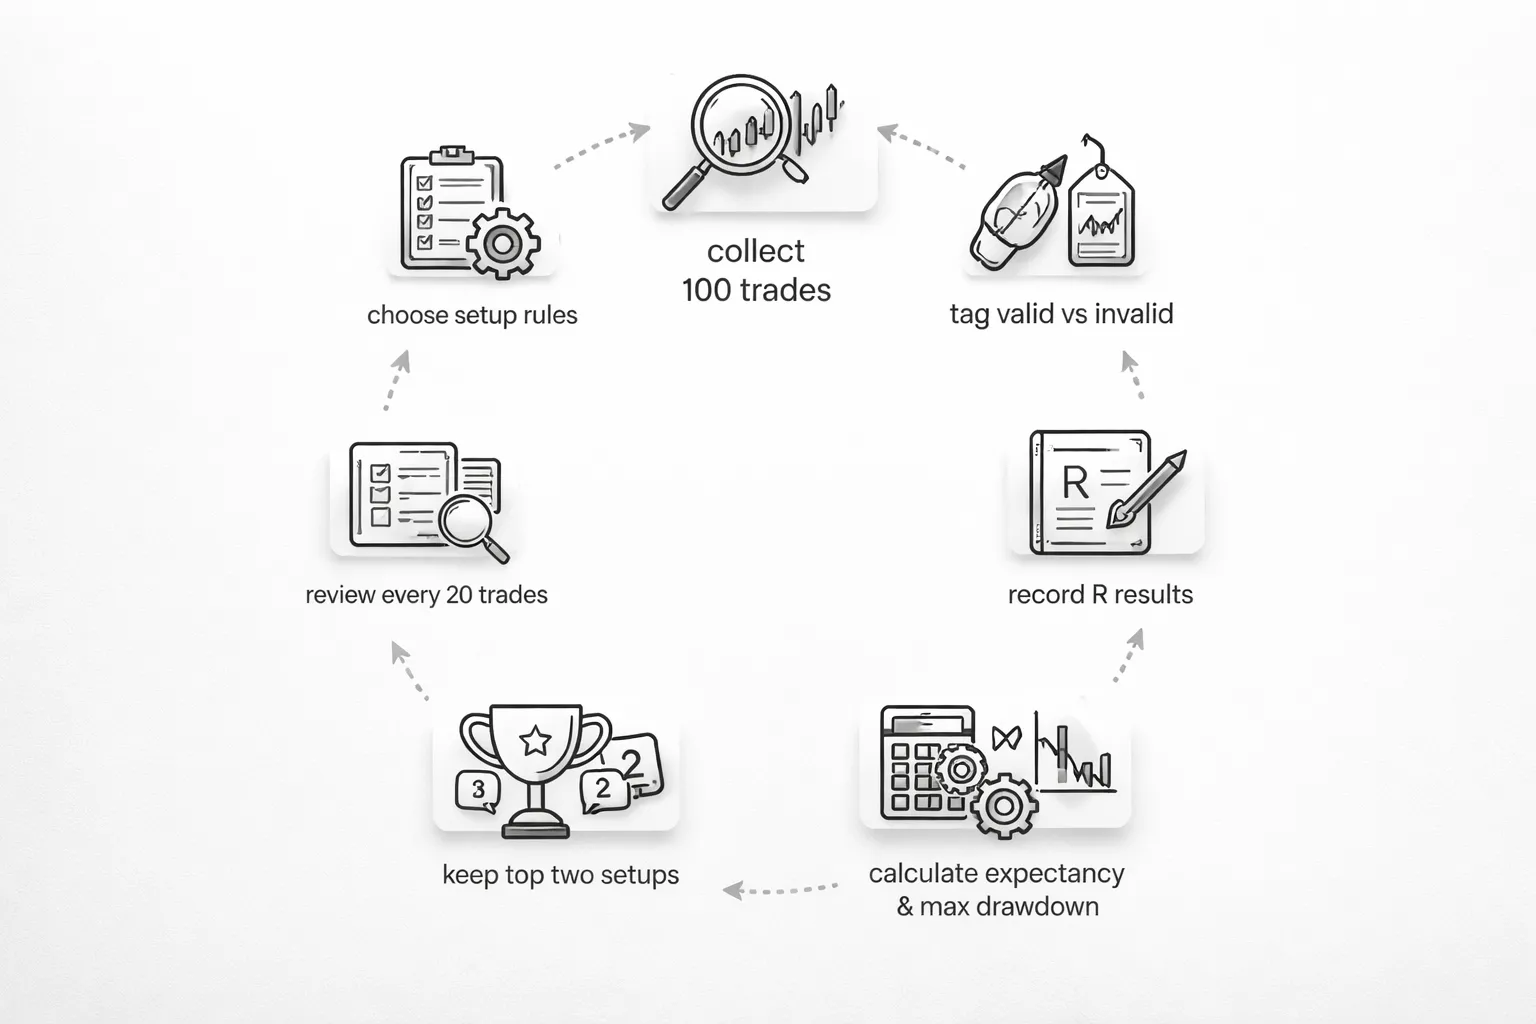
Tracking Performance Metrics: Expectancy, Drawdown, Streaks
Track outcomes in R. R means your risk unit per trade. If you risk 1R and make 2R, you made two times your risk. This normalizes results across position sizes.
- Win rate. Percentage of trades that hit profit versus stop.
- Average win in R. Mean R of winners.
- Average loss in R. Mean R of losers, should stay near -1R if you honor stops.
- Expectancy in R. Your average R per trade over a sample.
- Max drawdown. Largest peak to trough drop in cumulative R.
- Loss streak. Longest run of losses, plus how you behaved during it.
- Time in trade. Helps you see if you exit too early or hold too long.
Use this expectancy formula.
| Metric | Formula |
|---|---|
| Expectancy (R) | (Win rate x Avg win in R) - (Loss rate x Avg loss in R) |
Set a minimum sample. Aim for 50 to 100 trades per setup tag before you trust the numbers. Review every 20 trades or weekly. Separate valid trades from rule breaks. A rule break is not a loss, it is invalid data.
Track drawdown and streaks because they decide if you can hold the edge. If your worst loss streak is 8, you need rules that keep you trading through 8 without changing size or skipping valid signals. If your max drawdown is 15R, you need to decide if that fits your risk tolerance before you go live.
Keep the goal simple. Find your top two setups by expectancy and stability. Cut the rest. Then repeat the test with the tighter playbook.
Pros, Cons, and Common Myths About Technical Analysis in Forex
Strengths: structured decisions, repeatability, and timing
- It gives you rules. You can define your entry, stop, and exit in advance. You reduce impulse trades.
- It supports repeatable testing. You can measure win rate, average win, average loss, drawdown, and losing streak length on the same setup across many samples. Use it to decide if your edge survives real spreads and slippage. If you need a process, start with how to backtest a forex strategy.
- It improves timing. Fundamentals can tell you direction. Price action can tell you when to enter and where your trade idea fails. You can also time re-entries after pullbacks and breakouts with clear invalidation levels.
Limitations: regime changes, news shocks, and overfitting
- Regimes change. A trend system can bleed during ranges. A mean reversion system can break during strong trends. Your results depend on volatility and liquidity conditions.
- News shocks break patterns. CPI, rate decisions, and surprise headlines can jump price past your stop. Your chart does not warn you about the trigger. You manage this with position size, stop placement, and an event calendar.
- Overfitting is common. You can tune indicators to fit past data and still have no edge. More filters often reduce trade count and hide instability. Treat any small sample as noise.
Myths to avoid: “indicators predict the future” and “more signals = better”
- Myth: Indicators predict the future. Indicators summarize past price. They can help you classify trend, momentum, or volatility. They do not forecast. Your edge comes from how you use them with risk control and strict invalidation.
- Myth: More signals means better results. More trades often means lower quality trades, higher spread costs, and more exposure during bad regimes. Focus on a small set of setups you can execute the same way every time.
Beginner Mistakes to Avoid (So Your Analysis Doesn’t Fall Apart)
Chasing moves and entering late after big candles
Big candles attract beginners. They also increase your risk.
- You enter after the move. Your stop has to go wider, or you get stopped fast.
- Your reward shrinks because price already traveled far from the breakout area.
- Late entries often happen near short term exhaustion, especially after news spikes.
Fix it with rules you can execute.
- Set a maximum candle size you will trade. Example, skip entries when the trigger candle is larger than your last 20 bar average range.
- Require a retest. Let price break, pull back, then show acceptance.
- Place your stop where the idea breaks, not where the candle forces you to place it.
Ignoring spread, commission, and trading illiquid times
Costs decide if a small edge survives. Spread and commission hit every trade.
- Wide spreads turn good entries into bad entries.
- Stops trigger more often when spreads widen.
- Slippage rises when liquidity drops.
Illiquid windows create most of these problems.
- Session transitions and late hours often widen spreads.
- Minutes around major news often spike spreads and slip fills.
Use a simple cost checklist.
- Know your typical spread for the pair. Track it during the hours you trade.
- Skip trades when spread is above your threshold. Many traders use 1.5x to 2x their normal spread as a hard filter.
- Do not place tight stops during known spread expansion periods.
Drawing too many levels and seeing patterns everywhere
Too many lines destroy clarity. Your chart turns into a story you can rewrite after the fact.
- You can justify any entry because some line sits nearby.
- You stop trusting your plan because every level looks “valid”.
- You miss the level that matters, the one other traders also see.
Limit what you draw.
- Mark only the most recent swing high and swing low on your trading timeframe.
- Keep a maximum count. Example, no more than three levels above and three below current price.
- Prefer levels that show multiple clean reactions and clear space between them.
Build your base from support and resistance, then add one tool at a time.
Not defining invalidation (when your idea is wrong)
Without invalidation, your analysis never ends. You just keep adjusting.
- You move stops because you “still believe”.
- You add indicators to defend a losing trade.
- You hold until hope replaces structure.
Define invalidation before you enter.
- Pick one technical reason your trade works. Then define the exact price that breaks it.
- Place your stop at that price, plus a small buffer for spread and noise.
- Size the trade so the stop loss equals a fixed percent of your account. Example, 0.25 to 1 percent.
| Setup type | Clear invalidation |
|---|---|
| Breakout | Price returns and closes back inside the range, or breaks the last swing level that supported the breakout |
| Trend pullback | Price breaks the prior swing low in an uptrend, or prior swing high in a downtrend |
| Range trade | Price closes beyond the range boundary and holds, not just a brief wick |
FAQ
What is technical analysis in forex?
Technical analysis uses price and volume data to plan trades. You study trends, ranges, support and resistance, and chart patterns. You then define entry, stop loss, and take profit levels. It helps you trade with rules instead of opinions.
Does technical analysis work in forex?
It can work when you use a repeatable setup, solid risk control, and consistent execution. It fails when you overtrade, move stops, or ignore invalidation. Treat it as probability, not certainty. Track results over at least 50 trades per setup.
What chart timeframe should you use as a beginner?
Start with H4 or Daily for your main analysis. Use H1 for entries. Higher timeframes reduce noise and force fewer trades. Keep your process simple. Use the same timeframes every week so you can compare results and improve.
What are the most important technical analysis concepts to learn first?
- Market structure: swing highs and swing lows
- Trend and range: identify the state first
- Support and resistance: key reaction zones
- Invaldiation: define the level that proves you wrong
- Risk sizing: cap risk per trade
Do you need indicators to trade forex?
No. You can trade with price action and structure alone. Indicators can help you measure trend and volatility, but they lag price. If you use indicators, pick one or two, and use them for a single job, like trend filter or stop distance.
What indicators are most useful for beginners?
Use a moving average for trend direction and ATR for volatility based stops. Avoid stacking indicators that measure the same thing. If two tools give the same signal, you do not gain an edge. You gain false confidence.
How do you set a stop loss in technical analysis?
Place the stop at your clear invalidation level. For breakouts, put it back inside the range. For pullbacks, put it beyond the swing that defines the trend. Keep position size flexible so the stop fits the chart, not your feelings.
What is a good risk-reward ratio for forex trades?
Many traders target 1:2 or better. Your win rate and average win size must work together. A lower win rate needs higher reward. A higher win rate can use lower reward. Learn the math in risk-reward ratio.
How do you avoid false breakouts?
Wait for a candle close beyond the level, not a wick. Use clear invalidation back inside the range. Trade fewer breakouts in low liquidity hours. Do not chase after a large breakout candle. Your best trades often come on the retest.
How do you backtest technical analysis?
Pick one setup. Define entry, stop, exit, and filters. Mark at least 50 to 100 past examples on the same timeframe. Record R multiple per trade. Separate results by market state, trend or range. Remove rules that do not improve outcomes.
What are the biggest mistakes beginners make with technical analysis?
- Trading without a defined invalidation level
- Risking too much per trade
- Changing rules after a loss
- Using too many indicators
- Forcing trades in chop and low quality ranges
Conclusion
Conclusion
Technical analysis in forex comes down to three jobs. Define direction, define the level that proves you wrong, define the exit. Keep your rules simple. Execute the same process on every trade.
Start with one setup on one timeframe. Pick a market state. Trend or range. Use one trigger. Use one stop method. Risk a fixed percent. Log every trade and track R multiple.
After 30 to 50 trades, review the data. Check win rate, average R, and max drawdown. Separate results by trend and range. Keep rules that raise expectancy. Cut rules that do not.
Your final step is non negotiable. Place a stop before entry and size the trade to your risk limit. If you need a clear process, use this guide on how to place a stop loss.
-
Stop Loss vs Take Profit: Differences, Examples & Best Practices
5 months ago -
Forex Trading Psychology Tips: How to Stay Disciplined and Consistent
5 months ago -
Forex Order Types Explained: Market vs Limit vs Stop Orders
5 months ago -
How to Set Stop Loss and Take Profit (Step-by-Step)
5 months ago -
How to Start Forex Trading Step by Step (Beginner Roadmap)
5 months ago
-
- What is technical analysis in forex?
- Does technical analysis work in forex?
- What chart timeframe should you use as a beginner?
- What are the most important technical analysis concepts to learn first?
- Do you need indicators to trade forex?
- What indicators are most useful for beginners?
- How do you set a stop loss in technical analysis?
- What is a good risk-reward ratio for forex trades?
- How do you avoid false breakouts?
- How do you backtest technical analysis?
- What are the biggest mistakes beginners make with technical analysis?
-
How to Place a Forex Trade Step by Step (Your First Trade Explained)
3 months ago -
Forex Trading vs Crypto Trading: Which Market Is Better for Beginners?
3 months ago -
Forex Lot Size Calculator: How to Use It to Size Trades Correctly
5 months ago -
How to Calculate Position Size in Forex (Position Sizing Formula + Examples)
5 months ago -
Forex Leverage Explained: How It Works, Pros, Cons & Examples
5 months ago
-
Forex Trading Platforms Comparison: MetaTrader vs cTrader vs TradingView
5 months ago -
Is Forex Trading Legal in the United States? Rules, Regulators & What to Know
5 months ago -
Stop Loss vs Take Profit: Differences, Examples & Best Practices
5 months ago -
Forex Market Hours & Trading Sessions Explained (Best Times to Trade)
5 months ago -
Forex Leverage Explained: How It Works, Pros, Cons & Examples
5 months ago