Fundamental Analysis in Forex for Beginners: What Matters and Why

Forex moves when expectations change. Rates, inflation, jobs, and risk flows shift where money goes. Fundamental analysis helps you track those forces, so you can trade with context, not guesses.
This guide covers the few inputs that matter most for beginners. You will learn what fundamental analysis is in Forex, how it differs from technical analysis, and which data points move currency pairs. You will also learn how to link a release to a central bank path, how to judge whether news is priced in, and how to avoid common mistakes like trading headlines instead of surprises.
You will use the economic calendar as your starting tool. Follow this step-by-step guide on how to use the Forex economic calendar.
- In het kort: Fundamental analysis in forex means tracking what changes interest rate expectations, growth, inflation, and risk appetite.
- Focus on the path, not the print. One release matters when it shifts the central bank outlook.
- Trade the surprise, not the headline. Compare actual vs forecast vs prior, then check revisions.
- Use the economic calendar as your workflow. Filter by currency and impact, then map the next 1 to 3 key releases.
- Always check what is priced in. Look at recent trends, consensus ranges, and how price moved before the release.
- Separate level and change. A strong number that slows can weaken a currency if the market trades direction.
- Watch the data that moves rates. CPI, jobs, wage growth, retail sales, PMIs, and central bank speeches.
- Manage event risk. Know the release time, expected volatility, and your exit plan before the number hits.
- Use fundamentals to pick bias and key dates. Use technicals to time entries and define risk.
- Keep notes. Record the forecast, the surprise, the first move, and the follow-through to improve your read.
Next step: follow the step-by-step guide on how to use the Forex economic calendar.
What Fundamental Analysis Means in Forex (Beginner-Friendly Definition)
How currencies differ from stocks, and why macro factors dominate FX
Fundamental analysis in Forex means tracking the real-world forces that change a currency’s value. You focus on macro data and policy, not company earnings.
Stocks price a business. Currencies price an economy’s money. FX reacts most to what shifts capital flows and interest rate expectations.
- Central banks, rate decisions, guidance, balance sheet plans.
- Inflation, CPI, PCE, wage growth, inflation expectations.
- Growth, GDP, PMIs, retail sales, industrial production.
- Jobs, unemployment, payrolls, participation.
- Trade and flows, current account, energy imports, repatriation.
- Risk conditions, equity drawdowns, credit stress, volatility.
- Politics and geopolitics, elections, sanctions, conflict risk.
The “relative” nature of FX, you compare two economies at once
Every FX quote compares two currencies. You do not analyze one country in isolation. You compare what changes faster and what the market expects next.
- EUR/USD rises when EUR drivers improve more than USD drivers, or when USD drivers weaken more than EUR drivers.
- A “good” number can still sink a currency if the market expected better.
- A “bad” number can lift a currency if it reduces expected rate cuts less than the other side.
Use fundamentals to define the spread between the two economies. Focus on rate differentials, inflation differentials, and growth differentials. For a deeper example, see what moves USD/JPY.
Time horizons, intraday news spikes vs multi-week macro trends
Fundamentals work on two clocks. You need both.
- Intraday, data releases and headlines move price in seconds. The key inputs are the forecast, the surprise, revisions, and the press conference tone.
- Multi-week, themes drive trends. Examples include a change in central bank path, sticky inflation, recession risk, or a shift in global risk appetite.
Match your trade to the clock. Do not use a five-minute spike to justify a multi-week position without a clear policy or data trend behind it.
Fundamentals vs technicals vs sentiment, what each is best for
The Core FX Price Engine: Interest Rates and Expectations
Why rate differentials move pairs, carry and capital flows
FX prices track the gap between expected returns in two currencies. That gap starts with interest rates.
When the market expects higher rates in one country than another, money tends to move toward the higher expected yield. That can lift the higher yield currency and pressure the lower yield currency.
- Carry, traders borrow in a low yield currency and buy a higher yield currency. The trade works when the yield gap stays wide and volatility stays low.
- Capital flows, real money investors shift into government bonds, bills, deposits, and hedged or unhedged foreign assets based on yield and risk. These flows can last for months.
Practical read, the wider and more stable the expected rate gap, the more it can drive trend. The less stable it is, the more price whipsaws around data and central bank headlines.
Real rates vs nominal rates, why inflation adjusted yields matter
Nominal rates tell you the posted yield. Real rates tell you the yield after inflation. FX cares about purchasing power.
- If nominal yields rise because inflation jumps faster, your real yield can fall. That can weaken the currency.
- If inflation cools while yields stay firm, real yields rise. That can support the currency.
Track inflation expectations and real yield proxies. For the US, traders often watch TIPS real yields. For other countries, use inflation swaps, breakevens, and the central bank inflation path in its forecasts.
Forward guidance and market pricing, what swaps and futures imply
Spot FX moves on expectations, not yesterday’s rate. Central banks move markets most when they change the path.
Use market pricing to see what is already baked in. You want the gap between pricing and reality.
- OIS and swaps, show the expected average policy rate over time. Traders use them to infer the expected terminal rate and the timing of cuts or hikes.
- Rate futures, price meeting to meeting expectations. They help you map probabilities around key dates.
- Curve shape, a steep curve can signal more hikes. An inverted curve can signal cuts and growth stress.
Execution rule, if the central bank delivers what was fully priced, the currency often fades. If it delivers a surprise on the path, spot can trend hard.
For Fed events, map the expected path before the meeting and compare it to the statement, dots, and press conference. Use this framework in our FOMC meeting guide.
When higher rates can weaken a currency, growth fears and risk off
Higher rates do not guarantee a stronger currency. Context matters.
- Growth fears, aggressive hikes can raise recession risk. Markets can price faster future cuts. The currency can drop even as current rates rise.
- Risk off, in stress, investors reduce leverage and cut carry. High yield currencies often fall because they sit on the crowded side of risk.
- Financial stability, if higher rates threaten banks, housing, or government funding, the market can doubt the hiking path. FX reacts to that doubt.
- Terms of trade shock, if higher rates come with an energy shock or trade hit, real income falls. The currency can weaken.
Checklist for you, watch the rate path, not the headline rate. Watch whether real yields rise. Watch whether equities and credit signal stress. If risk cracks, assume carry unwinds fast.
Central Banks: The Most Important Fundamental Driver
Central Banks: The Most Important Fundamental Driver
Central banks set the price of money. FX prices the expected path of policy, not the last decision.
Your job is simple. Track what they will do next, how fast, and how long they will keep policy tight or loose.
What to listen for in statements, minutes, and press conferences
Start with the statement. It sets the message. Then read the minutes. They show the debate and the vote balance. Then watch the press conference. It reveals the reaction function in real time.
- Statement, look for changes in one line. Forward guidance, risk balance, and any new condition for the next move.
- Minutes, track how many members want to hike, cut, or hold. Look for phrases that signal urgency or patience.
- Press conference, focus on what the chair pushes back on. If the chair rejects market pricing, expect repricing in rates and FX.
- Projections, if available, compare the policy rate path to market pricing. The gap often drives the next move in the currency.
Use three inputs each time. The policy rate expectation for the next meeting. The expected peak rate. The expected first cut date.
Hawkish vs dovish language decoded, examples you can spot
Hawkish means tighter policy for longer. Dovish means easier policy sooner.
| What you read or hear | What it usually means | What you check next |
|---|---|---|
| “Inflation remains too high.” | Bias to hike or hold restrictive. | Front end yields, 2 year spread vs peers. |
| “Further tightening may be appropriate.” | Live hiking cycle. | Next meeting pricing, OIS or futures. |
| “Policy is restrictive.” | They think rates are already doing the job. | Language change from last meeting. |
| “We will be patient.” | Pause. Lower odds of near term hikes. | Peak rate expectations and timing. |
| “Data dependent.” | They want optionality. Vol can rise. | Next top data releases, inflation and jobs. |
| “Rates may need to stay higher for longer.” | They want to prevent early easing bets. | Terminal rate, cuts priced for next year. |
| “We see progress on inflation.” | They can slow hikes, or prepare cuts later. | Real yields, breakevens, inflation swaps. |
| “Risks are two sided.” | Less urgency to tighten. | Credit spreads and equity reaction. |
| “Financial conditions have tightened.” | Markets did some work for them. Less need to hike. | USD index, stocks, mortgage rates, spreads. |
Do not trade the word. Trade the change. If the same sentence stays, the market often ignores it. If one key phrase shifts, FX can trend for days.
Policy tools beyond rates: QE, QT, balance sheet, yield curve control
Rates are not the full story. Central banks move currencies with liquidity and term premium.
- QE, they buy bonds. Yields fall, liquidity rises. This often weakens the currency, especially if peers do not ease.
- QT, they let bonds roll off or sell. Yields can rise, liquidity tightens. This often supports the currency, if growth holds.
- Balance sheet size, watch the trend, not the level. A turning point can change the FX regime.
- Yield curve control, they cap yields at specific maturities. This suppresses local yields. It can pressure the currency if carry becomes less attractive.
- Funding tools, repo operations, term funding, liquidity facilities. These can stabilize credit without cutting rates. FX can firm if crisis risk fades.
Key practical read. If rates stay high but the central bank adds liquidity, you can get mixed signals. Yield support helps the currency, liquidity can hurt it. In that case, focus on real yields and the growth outlook.
Credibility and reaction functions, what they prioritize
Credibility decides how much the market trusts guidance. A credible bank moves FX with words. A weak one needs action.
- Inflation first, they tolerate weaker growth to hit the target. Currencies tend to hold up when inflation shocks hit.
- Growth and jobs first, they cut sooner when activity slows. Currencies can weaken when global risk rises.
- Financial stability first, they react fast to credit stress. Rate paths can flip quickly, carry trades unwind.
- FX stability first, common in smaller economies. They may hike into weak growth to defend the currency.
Track the reaction function with a small log. Write down what data they cite most, inflation, wages, jobs, credit, housing, or the exchange rate. Then compare it to what moves their decisions. Over time you will know which releases matter for that currency.
When the reaction function centers on employment, your focus shifts to labor data. This includes big reports like Non-Farm Payrolls. When it centers on inflation, your focus shifts to pricing pressures and real yields.
Central bank checklist you can use every meeting
- Compare market pricing before and after, next meeting odds, peak rate, first cut date.
- Mark the exact language changes in the statement.
- In minutes, count the dissent and note the direction.
- In the press conference, write down what the chair refuses to validate.
- Check real yields and the 2 year yield spread versus the closest peer.
- Check risk signals, equities, credit spreads, and funding stress.
- Check the balance sheet trend and any shift in QT or liquidity tools.
High-Impact Economic Indicators to Track (Without Getting Overwhelmed)
Inflation: CPI, Core CPI, PCE
Inflation drives rate expectations. Rate expectations move currencies.
- CPI (headline), market-moving in many countries. It reacts to energy and food swings. Use it to gauge near-term pressure and political sensitivity.
- Core CPI, strips food and energy. It tracks the sticky part. Markets use it to judge whether inflation will stay high.
- PCE and Core PCE, the key US gauge for the Fed. It uses different weights than CPI and often runs lower. If you trade USD, treat Core PCE as top-tier.
What matters by country:
- United States, Core PCE first, then CPI core and services. Watch month over month and the 3-month annualized trend.
- Eurozone, HICP and Core HICP. Watch services inflation and wage-linked categories. Energy can distort headline.
- United Kingdom, CPI and Core, plus services CPI. GBP reacts hard when services stays hot.
- Canada, CPI and core measures like trimmed and median. CAD follows whether core stays above target, not one-off headline drops.
- Australia and New Zealand, CPI and core trims. These currencies react when inflation surprises shift the next RBA or RBNZ step.
- Japan, CPI ex fresh food and ex energy. JPY cares about sustained core and wage follow-through, not one month of energy-driven CPI.
Keep it simple. Track three numbers: the latest month over month, the year over year, and a short trend like 3-month annualized. Then map it to the next central bank meeting.
If you need a tighter workflow, use an economic calendar and tag only inflation releases that can change the next rate decision.
Jobs Data: NFP, Unemployment, Wages, Participation
Labor data tells you if the economy can handle higher rates. It also tells you if inflation pressure will fade or persist.
- NFP or payrolls, a growth pulse. It is noisy and often revised. Treat big surprises as signal, small surprises as noise.
- Unemployment rate, a cycle indicator. A rising trend matters more than one print.
- Wage growth, the inflation bridge. If wages stay firm, services inflation tends to stay firm.
- Participation rate, the supply side. Rising participation can cool wages without a recession. Falling participation can keep wages hot even if growth slows.
What to watch when the numbers hit:
- Does job growth beat, but unemployment also rises. That often means the labor market loosens under the surface.
- Do wages accelerate while headline inflation cools. That can stop a dovish pivot.
- Do revisions erase the surprise. Markets often fade the first reaction when revisions land.
Growth: GDP, PMI or ISM, Retail Sales
Growth data helps you judge the direction of rates and risk appetite. You need to separate leading signals from lagging ones.
- PMI or ISM, leading. It moves expectations because it points to the next quarter, not the last one. New orders and employment subcomponents matter most.
- Retail sales, near-term demand. It matters when the economy runs on consumption, like the US and UK. Watch the control group if you trade USD.
- GDP, lagging. It confirms what already happened. It moves FX most when it forces a rethink of recession risk or a policy path.
Simple priority rule:
- If markets debate recession, weight PMI and retail sales more.
- If markets debate inflation persistence, weight wages and services inflation more.
- If markets debate policy credibility, weight central bank guidance and inflation trends more.
External Sector: Trade Balance, Current Account, Capital Flows
External data tells you if a currency has natural demand or needs constant funding.
- Trade balance, goods exports minus imports. It matters more for export-heavy economies and commodity currencies.
- Current account, broader than trade. It includes income flows. Persistent deficits can pressure a currency when global funding tightens.
- Capital flows, the real driver in many cycles. Portfolio inflows can support a currency even with a weak trade balance. Outflows can crush a currency even with a surplus.
Practical read:
- Surplus plus rising yields can create steady demand for the currency.
- Deficit plus falling yield support can create vulnerability during risk-off moves.
- Watch whether foreign buyers still fund local bonds. When they stop, the currency often reprices fast.
Credit and Housing: Rate Path, Growth, and Stress Signals
Credit and housing sit between policy rates and the real economy. They transmit tightening and easing.
- Credit spreads, a stress gauge. Wider spreads can tighten conditions without more rate hikes. That can cap a currency if growth risks rise.
- Bank lending and loan growth, the money channel. Slowing lending often leads slower growth and softer inflation later.
- Housing starts, permits, home prices, interest-rate sensitive. Housing turns early in many cycles. Weak housing can signal slower consumption and construction jobs.
- Mortgage rates and refinancing activity, the pressure point. Higher rates reduce demand fast. Lower rates can restart growth.
Use credit and housing as confirmation. If inflation cools but credit stress rises, markets often price earlier cuts. If housing stays resilient, markets often push cuts out.
How to Track This Without Getting Overwhelmed
- Pick your top 5 releases for the pair you trade. Track only those every month.
- For each release, write one sentence before it prints: what would change your rate view.
- After the release, update one thing only: the next central bank step, hike, hold, or cut.
- Ignore low-impact data unless it shifts the story. Most of it does not.
How News Actually Moves Forex: Forecasts, Surprises, and Revisions
Consensus vs Actual, the Surprise That Moves Price
Most news is priced in before it hits the screen.
The market trades the gap between expectations and reality.
That gap is the “surprise.”
- Consensus, the median forecast from economists.
- Actual, the printed result.
- Surprise, actual minus consensus, adjusted for what traders cared about that month.
Big move setup looks like this.
- Consensus leans one way and positioning follows.
- The print breaks that view.
- Rate expectations reprice fast.
- FX follows the rate path.
Track the forecast range, not just the single consensus number. A print inside a wide range can fade fast.
For your key releases, write down two numbers before the event.
- The consensus.
- The “needs to beat” level that would change the next central bank step.
Revisions and Second-Order Details
The headline number grabs attention. The details decide follow-through.
Many releases move twice.
- First on the headline.
- Then on revisions and internals.
Revisions matter because they change the trend.
- A “beat” with a large downward revision can turn into a net miss.
- A “miss” with a strong upward revision can remove the dovish signal.
Second-order details often drive rate pricing.
- Jobs reports, wages, hours worked, participation, prior months revised.
- Inflation, core vs headline, services vs goods, shelter, supercore if your central bank watches it.
- Growth, domestic demand, consumption, business investment, deflator components.
Your process stays simple.
- Pick one internal detail that maps to policy for each top release.
- Check that detail before you decide the move has legs.
Why “Good” Data Can Drop a Currency
Price moves on expectations and positioning, not on morality.
Three common cases cause a drop on “good” data.
- Already priced, consensus was too low, the market leaned long, the beat was not enough.
- Sell the fact, traders bought for days into the release, then take profit on the print.
- Policy reaction flips, the data looks strong, but not strong enough to force a hike, or it reduces tail risk so safe-haven demand fades.
Read the move through rates.
- If front-end yields fall after “good” data, the market heard “less hiking.”
- If yields rise and the currency drops, you likely saw profit-taking or risk-on flow overpowering the first reaction.
Event Volatility, Spreads, Liquidity Pockets, Slippage
News trading is a microstructure problem.
During the release window, pricing quality drops.
- Spreads widen because liquidity providers step back.
- Order books thin out, you hit air pockets.
- Stops trigger in clusters, moves jump.
- Slippage increases, you get filled away from your price.
Know the mechanics before you place risk.
- Spread risk, your entry and stop cost more.
- Gap risk, price can skip your stop level.
- Execution risk, limit orders may not fill, market orders may fill badly.
Use the calendar like a checklist, release time, expected impact, and prior volatility. Follow a step-by-step workflow from your economic calendar and log what actually happened at the spread and fill level.
If you cannot accept slippage, you cannot trade the first seconds. Wait for the second wave, when spreads normalize and direction shows in rates.
Risk Sentiment and Safe Havens (The Missing Piece for Many Beginners)
Risk-on vs risk-off, how correlations shift
Most beginners track one data point. The market trades a package.
Risk sentiment tells you if traders want growth exposure or protection. It changes correlations fast.
- Risk-on, traders buy higher yield and growth-linked assets. You often see stocks up, credit spreads tighter, volatility down. High beta FX tends to strengthen.
- Risk-off, traders cut leverage and reduce exposure. You often see stocks down, volatility up, credit spreads wider. Safe havens tend to strengthen.
- Correlations can flip. A currency can ignore its own data if sentiment dominates the flow.
- Your job is to identify the regime first, then judge the economic release inside that regime.
Do this before you trade. Check S&P futures, VIX, US 10-year yield, and the dollar index. Log the direction 15 minutes before the event. Compare it to the move after the event.
Safe-haven flows, USD vs JPY vs CHF
Safe havens do not react the same way. They have different drivers.
- USD can strengthen in risk-off because of global funding demand, reserve demand, and a dash for liquidity. It can also weaken if the shock forces large US rate cuts.
- JPY tends to benefit when carry trades unwind. It often strengthens when volatility spikes and yields fall.
- CHF tends to benefit when Europe faces stress and when capital looks for stability. Watch Swiss National Bank messaging because intervention risk can change the reaction.
Use a simple cross-check. In risk-off, if USD and JPY both strengthen, the market likely trades pure de-risking. If JPY strengthens but USD weakens, the market likely prices lower US rates.
| Asset move | What it often signals | FX bias that often follows |
|---|---|---|
| VIX up, S&P down | Risk reduction, deleveraging | JPY and CHF bid, high beta sold |
| US 10-year yield down fast | Growth fear, rate cut pricing | JPY bid, USD mixed |
| USD up with yields down | Liquidity squeeze | Broad USD strength, EM and high beta weak |
Commodity currencies, AUD, CAD, NZD and the growth link
AUD, CAD, and NZD often trade like global growth proxies. They can outperform in risk-on and underperform in risk-off.
- AUD tends to track China sentiment and industrial cycle pricing. Watch iron ore and copper, and big moves in Chinese equities.
- CAD tends to track oil and North American growth. Watch WTI crude, US data surprises, and Canada rate expectations.
- NZD tends to track risk appetite and local rate pricing. It can move hard when the market reprices the RBNZ path.
Do not treat them as pure commodity plays. Rates still matter. A strong commodity print can fail if the market fears recession or if local yields fall.
Equities, bonds, and the dollar, cross-market cues you can use
You need a small dashboard. It keeps you from trading one headline in isolation.
- Equities show risk appetite. Large index futures moves often lead FX during risk events.
- Bonds show growth and rate expectations. Fast yield drops usually signal flight to safety and easier policy pricing.
- The dollar reacts to both. It can act as a safe haven in liquidity stress, or weaken when the market prices aggressive Fed cuts.
Use a repeatable workflow.
- Step 1, mark the regime. Risk-on or risk-off based on equities and volatility.
- Step 2, check the rates impulse. Look at US 2-year and 10-year direction into the event.
- Step 3, trade the FX pair that matches the flow. In risk-off, JPY crosses often show cleaner moves than EUR/USD.
- Step 4, confirm with one more market. If USD strengthens, confirm with a dollar index uptick or broad USD strength across pairs.
If you want a pair-specific framework, read what moves GBP/USD and apply the same cross-market checklist.
Geopolitics and Structural Themes That Create Long Trends
Elections, fiscal policy, and debt dynamics: why FX reacts
Politics moves FX when it changes future policy. Policy changes growth, inflation, and interest rates. Rates drive yield gaps. Yield gaps drive currency demand.
Markets focus on three election outputs. Fiscal spending plans. Tax plans. Central bank independence.
- Fiscal expansion: You often get higher yields, a steeper curve, and more inflation risk. The currency can rise on yield support or fall if deficits and inflation premiums dominate.
- Fiscal tightening: You often get lower yields and weaker growth expectations. The currency can fall on lower yield or rise if it cuts risk premium.
- Debt stress: If debt servicing costs jump, FX prices a higher risk premium. You see it in wider sovereign spreads and a weaker currency.
What to track. Budget balance trends. Debt to GDP trend. Maturity profile. Auction demand. Sovereign CDS. The spread versus a benchmark, like BTP Bund for Italy, or any local curve versus US Treasuries for EM.
Use a simple check. If fiscal headlines hit, look first at the front end and the long end of the curve. Then look at sovereign spreads. Then check whether real yields moved, because FX tends to follow real yield differentials over time. For a deeper inflation lens, use this guide on inflation and exchange rates.
Sanctions, war risk, and energy shocks: transmission to currencies
Geopolitical shocks hit currencies through trade, energy, and capital flows. They also change risk appetite fast.
- Terms of trade: Energy importers pay more for the same supply. Their trade balance worsens. Their currency tends to weaken.
- Energy exporters: Export receipts rise when prices rise. Their currency can strengthen, if policy and capital flows allow it.
- Risk-off: Funding trades unwind. High yield and EM FX often sell off. JPY and CHF often outperform.
Sanctions add a second layer. They can cut export revenue, freeze reserves, limit payment channels, and trigger forced selling by foreign investors. That can break normal valuation signals.
What to track. Brent or WTI. European gas benchmarks when relevant. Shipping rates. Current account balance. Reserve levels. Cross currency basis and offshore onshore spreads, because they show funding stress and restrictions.
Regime changes: inflation eras vs disinflation eras and FX impacts
Long trends form when the macro regime shifts. You need to know what the market rewards in that regime.
- Disinflation regime: Markets reward stable prices and predictable policy. Carry and valuation matter more. High real yield currencies can grind higher if volatility stays low.
- Inflation regime: Markets reward credible inflation control and energy resilience. FX reacts more to commodities, wages, and supply shocks. Volatility rises, and safe havens get stronger bid in stress.
How you spot a regime change. Inflation stops mean reverting. Wage growth stays high. Fiscal policy stays loose. Supply constraints persist. Central banks stop forward guiding and start reacting meeting to meeting.
What to track. Core inflation and trimmed mean measures. Wage growth. Inflation expectations, like 5y5y. Real yields, not just nominal yields. Commodity baskets that match the country, like oil for importers and exporters.
Emerging market considerations: capital controls and political risk
EM FX can trade on rules, not fundamentals. Capital controls can block outflows and trap money. That can keep spot stable while pressure builds elsewhere.
- Multiple exchange rates: The official rate can diverge from offshore or parallel rates. Price discovery shifts to NDFs or black market proxies.
- Intervention risk: The central bank can sell reserves, tighten controls, or change settlement rules. Moves can gap.
- Political shock risk: Elections, protests, and policy pivots can trigger sudden repricing in risk premium.
What to track. FX reserve changes. Forward points and NDF pricing. Onshore offshore basis. Local rates versus inflation. IMF programs and review dates. External refinancing needs, like short term external debt versus reserves.
Practical rule. In EM, treat convertibility and access as part of the trade. If you cannot exit during stress, size smaller or avoid spot and use instruments that match the market structure, like NDFs where appropriate.
A Simple Step-by-Step Fundamental Workflow (Beginner Process)
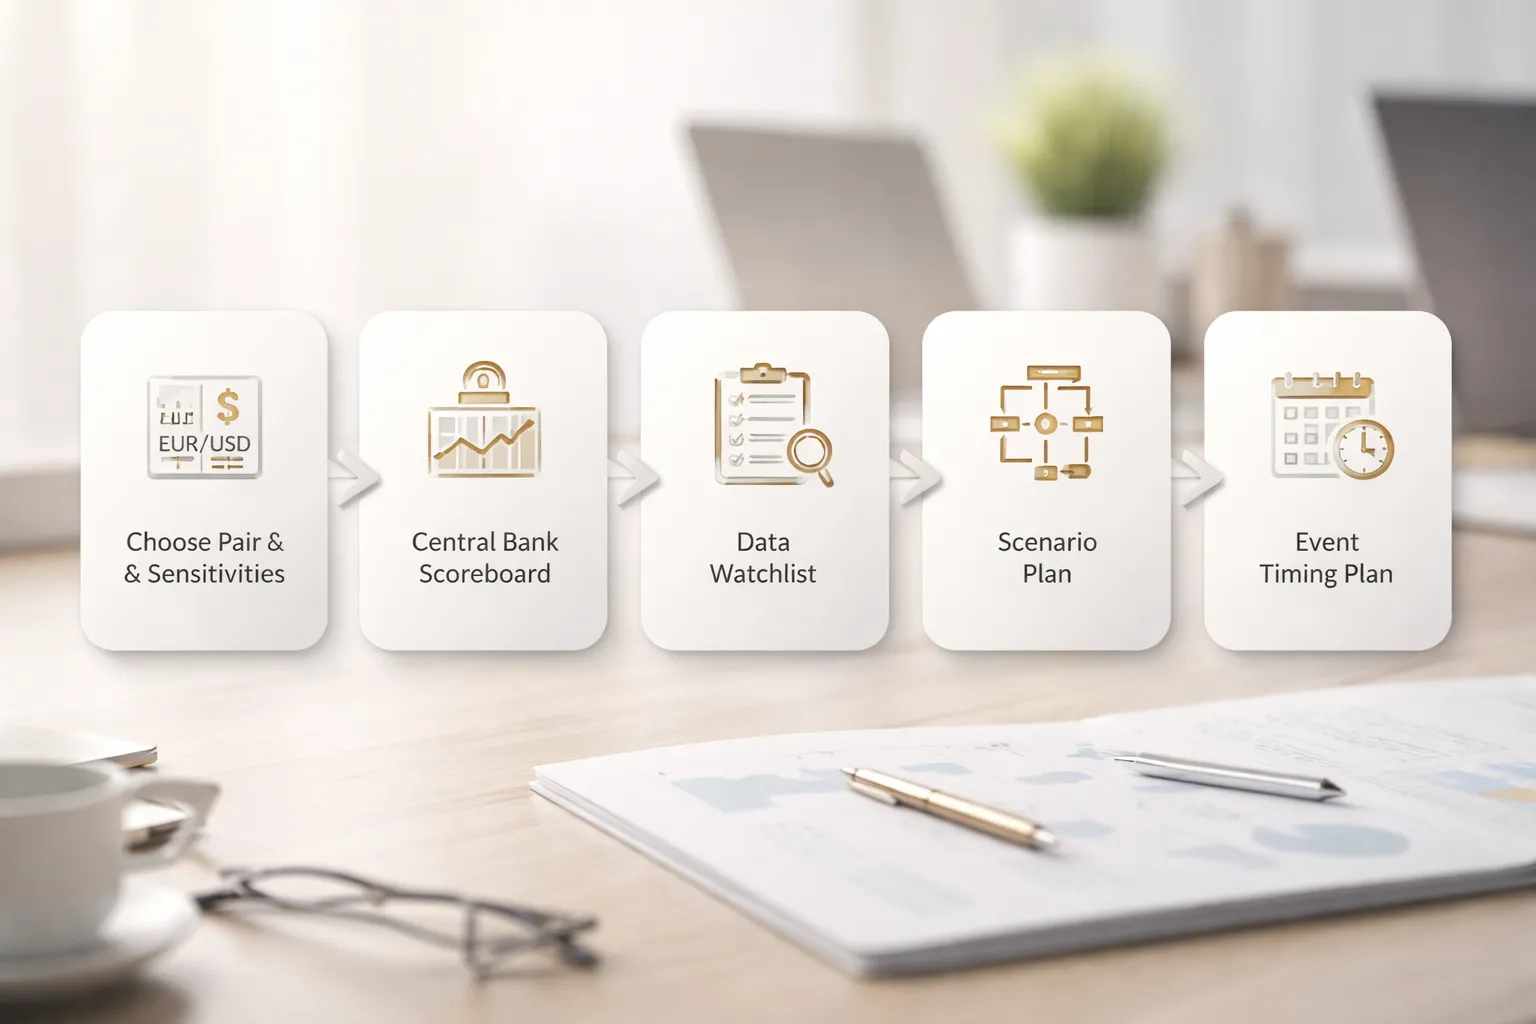
Step 1: Choose a pair, map each economy’s sensitivities
Start with one pair. Do not scan the whole market.
Write two short lists. One for the base currency. One for the quote currency. Focus on what changes rate expectations and capital flows.
- Growth: GDP trend, jobs, consumption, housing, credit growth.
- Inflation: CPI, core CPI, wages, services inflation, inflation expectations.
- Central bank reaction function: what it targets, what it tolerates, what forces its hand.
- Fiscal risk: deficit path, issuance needs, election cycle, debt sustainability.
- External balance: current account, trade, tourism, remittances.
- Terms of trade: oil, gas, metals, agriculture exposure.
- Risk regime: safe haven versus pro-cyclical behavior in stress.
- For EM: FX reserves, external debt, IMF dates, capital controls, onshore versus offshore pricing.
Then write one line that states the main driver for the pair right now. Example format, “This pair trades rates first, then risk, then data surprises.”
Step 2: Build a central bank scoreboard (trend, tone, constraints)
Central banks move FX through expected rate paths. Your job is to track what the market prices versus what the bank signals.
| Item | What you record | Why it matters |
|---|---|---|
| Trend | Hiking, cutting, on hold, tapering, tightening via balance sheet | Sets the direction of yield differentials |
| Tone | Hawkish, neutral, dovish, data-dependent, split committee | Moves expectations before actual changes |
| Constraints | Inflation stickiness, growth slowdown, FX weakness, financial stability, politics, debt service | Limits how far policy can go |
| Market pricing | Next meeting odds, 3 to 12 month implied path, terminal rate view | Price moves when reality forces repricing |
Update the scoreboard after each major speech, minutes release, and inflation or jobs print. Keep it short. One page.
Step 3: Create a watchlist of 5 to 8 recurring releases per currency
You need a repeatable set of inputs. Pick releases that change the central bank scoreboard.
- Inflation: CPI, core CPI, PPI, key wage tracker.
- Jobs: payrolls or employment change, unemployment rate, wage growth.
- Activity: PMI, retail sales, industrial production.
- Growth: GDP, quarterly details if available.
- Policy: rate decision, statement, press conference, minutes.
- Risk and credit: bank stress indicators, credit growth, lending surveys.
- External: trade balance, current account, reserves for EM.
Put those releases into a calendar. Use one source and stick with it. See economic calendar for the setup and filters that matter.
Step 4: Write scenarios, base case, upside, downside, invalidation
Scenario work stops you from reacting late. Write it before the data hits.
- Base case: what you expect over the next 1 to 4 weeks, and why.
- Upside: what would force a hawkish repricing for the base currency, or a dovish repricing for the quote currency.
- Downside: what would force a dovish repricing for the base currency, or a hawkish repricing for the quote currency.
- Invalidation: the specific condition that proves your thesis wrong, like “core inflation trend breaks lower for two prints,” or “central bank signals a pause and the market agrees.”
Attach one observable trigger to each scenario. Use numbers when you can, like CPI, wages, or meeting pricing. Avoid vague triggers like “risk-off.”
Step 5: Plan timing, pre-event, during release, post-event reassessment
Fundamentals still need timing. You plan around liquidity and scheduled risk.
- Pre-event: check current positioning cues you can observe, check recent trend in the data, write your scenarios, reduce size if the event can gap the market.
- During release: focus on the surprise versus consensus, and on the details the central bank cares about, like core services, wages, or participation. Avoid chasing the first spike if you cannot explain the repricing.
- Post-event: update your central bank scoreboard, compare market pricing before and after, and decide if the move matches your scenario or if you need to cut and reset.
Keep a simple log. Date, event, expectation, outcome, market reaction, what changed in your scoreboard. This builds pattern recognition fast.
Top-Down vs Bottom-Up Approaches (And Which Is Easier for Beginners)
Macro-first, start with the cycle, then narrow to pairs
This approach starts wide. You map global growth, inflation, and policy. Then you narrow to regions, then to central banks, then to a tradeable pair.
- Step 1, risk regime: risk-on or risk-off. Check equities, credit spreads, and oil.
- Step 2, growth gap: which economy accelerates, which slows. Use PMI trends, payrolls, retail sales.
- Step 3, inflation gap: sticky or easing. Use CPI core, wages, services inflation.
- Step 4, policy gap: who hikes, who cuts, who stays restrictive. Use rate decisions, minutes, speeches, OIS pricing.
- Step 5, pick the cleanest divergence: pair a hawkish bank versus a dovish bank, or a resilient economy versus a weakening one.
Macro-first works best when central banks drive price. It keeps you aligned with the biggest force in FX, relative rates.
Currency-first, start with one central bank, then build outward
This approach starts narrow. You pick one currency and track its main driver. Then you choose the best counterpart.
- Step 1, choose one bank to follow: Fed, ECB, BoE, BoJ, RBA, RBNZ, SNB, BoC.
- Step 2, define the bank’s reaction function: what data changes its path. Inflation, jobs, growth, financial conditions.
- Step 3, track market pricing: next meeting odds, peak rate, expected cuts. Use OIS, swaps, futures.
- Step 4, find the best contrast: match your currency against the one with the most different path.
- Step 5, trade around the calendar: focus on the releases that move that bank.
Currency-first works best when you want speed. You learn one playbook, then repeat it across weeks of events.
Which is easier for beginners
| Approach | Easier because | Harder because | Best use |
|---|---|---|---|
| Currency-first | Less scope. Fewer inputs. Faster feedback loop. | You can miss the global regime shift that overrides your theme. | Learning fundamentals. Trading one or two pairs. |
| Macro-first | Forces clean relative thinking. Avoids local tunnel vision. | More data. More moving parts. More ways to stall. | Medium-term positioning. Big policy turns. |
If you feel overwhelmed, start currency-first. Run one central bank scoreboard. Add macro-first checks once your log shows consistency.
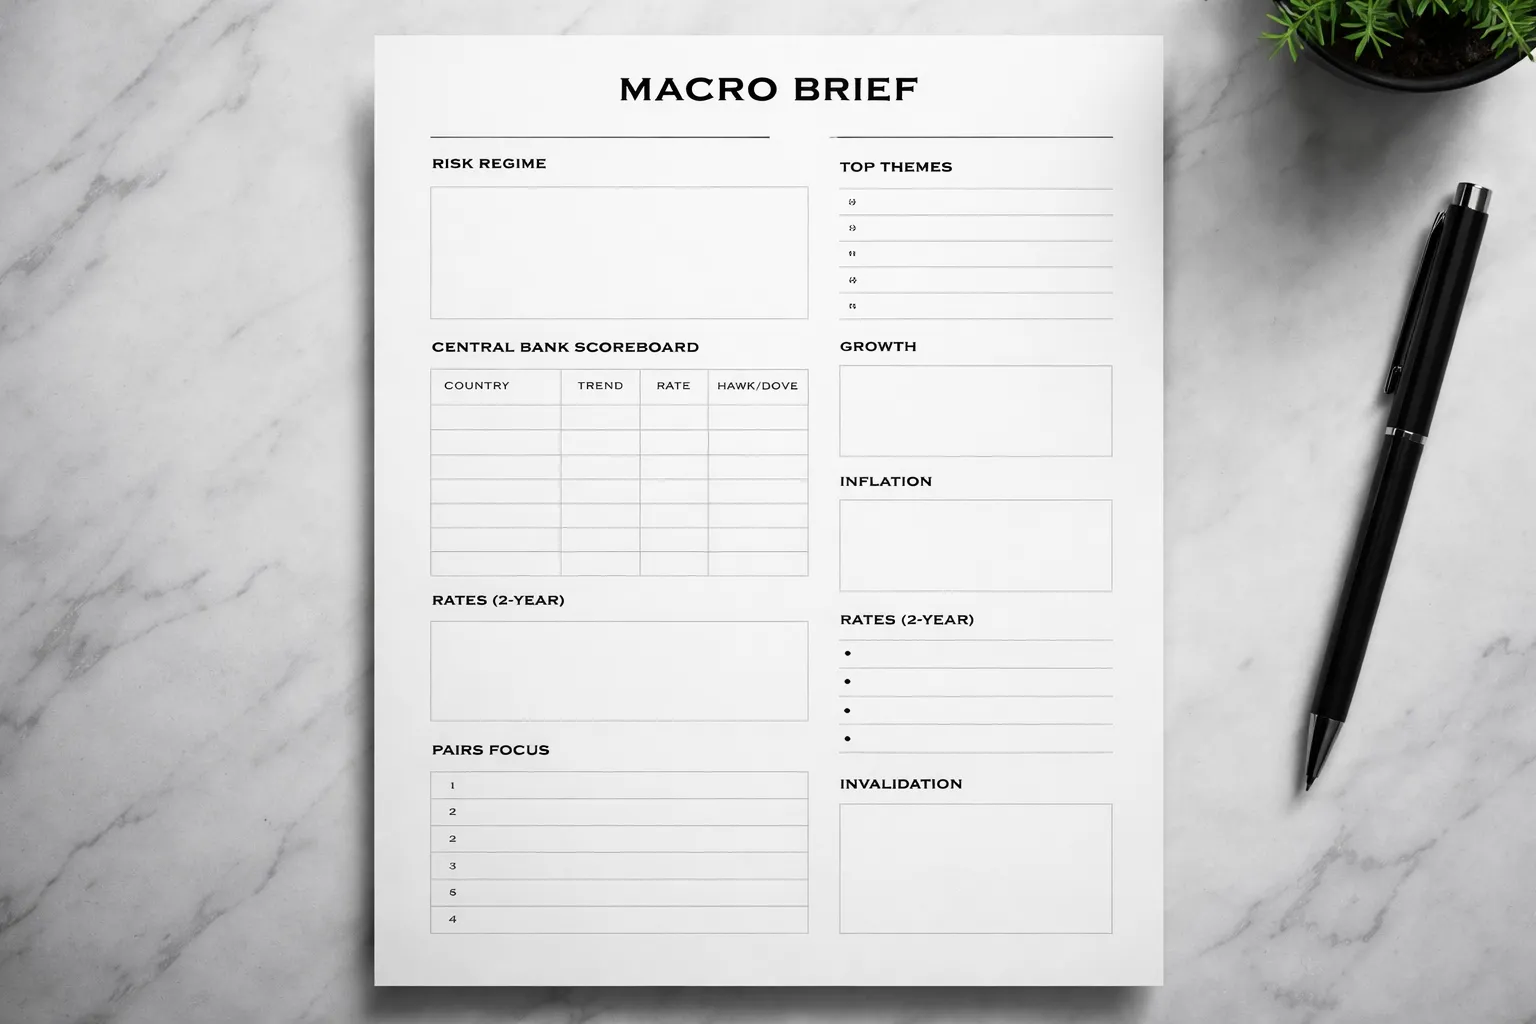
Avoid analysis paralysis, use a one-page macro brief
Limit yourself to one page. Update it weekly, then only after major data or a policy event.
- Risk regime: risk-on or risk-off. Evidence, 2 bullets.
- Top themes: 2 themes max. Example, cuts repricing, inflation persistence.
- Central bank scoreboard: 6 to 8 banks. Stance, next likely move, market pricing gap.
- Growth: US, Eurozone, UK, Japan, China. One line each, accelerating or decelerating.
- Inflation: which is sticky, which is easing. One line each.
- Rates: 2-year yield direction for each major. Up, down, flat.
- Event risks: next 7 days. Only high impact, only what can change your scoreboard.
- Pairs in focus: 3 pairs max. Narrative, key level, next catalyst.
- Invalidation: what would prove you wrong. One sentence per theme.
Keep your sources consistent. Use the same calendar, the same yield tenors, the same pricing tool. Do not add new dashboards mid-week.
Checklist, select pairs with clean fundamental narratives
- Clear policy divergence: one bank moves toward hikes or fewer cuts, the other moves toward cuts.
- Clean catalyst path: the next 1 to 3 releases can confirm or kill the view.
- Market pricing gap: your base case differs from forwards or OIS. Small gaps rarely pay.
- Aligned rates signal: 2-year yield spread trend supports the direction.
- No competing dominant driver: avoid pairs where politics, pegs, or liquidity shocks dominate.
- Simple positioning story: crowded or not. Extreme positioning raises event risk.
- Manageable volatility: ATR fits your stop and size. Skip pairs that force tight stops.
- One sentence narrative: you can write the driver in one line. If you cannot, you do not have a trade.
- Calendar control: you know the next data and central bank events. Use your economic calendar process.
If you trade majors, keep a short list. EUR/USD for relative rates and global risk, USD/JPY for yield differentials, GBP/USD when UK data and BoE pricing shift fast. See what moves EUR/USD for a driver map you can plug into your brief.
Practical Trade Planning: Turning Fundamentals Into Setups
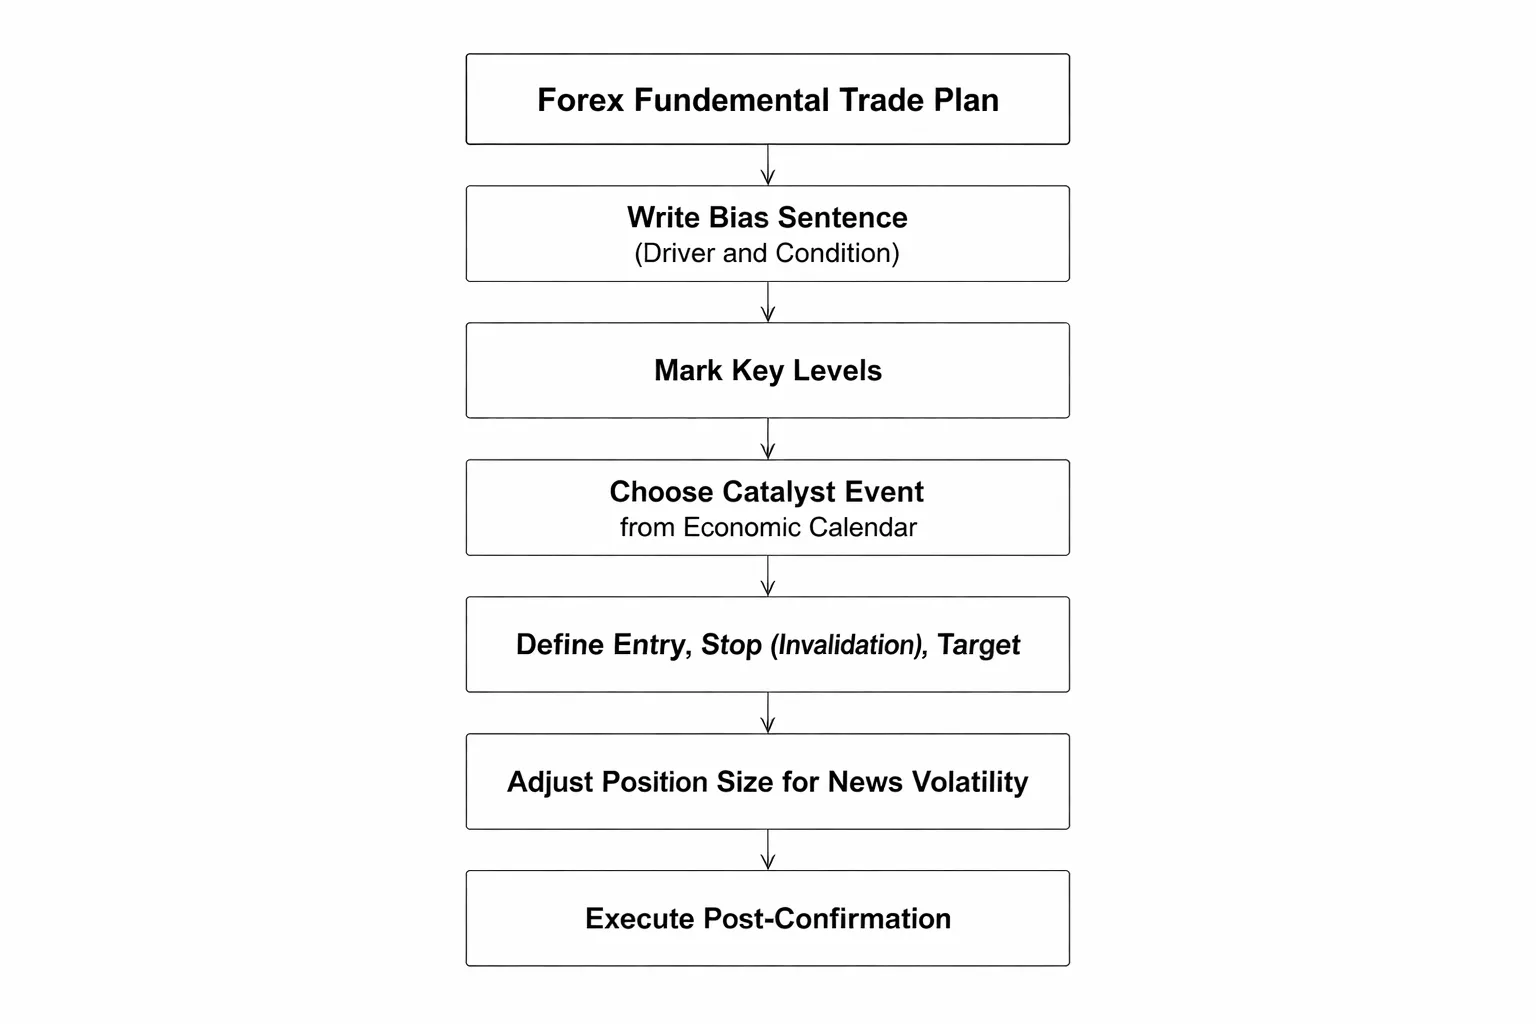
Directional Bias vs Entry Timing: Separating “What” From “When”
Your fundamentals give you bias. Your chart gives you timing.
Write your bias as one sentence. Include the driver and the condition.
- Bias: what you want to buy or sell, and why.
- Condition: what must stay true for that bias to hold.
- Timing: where you will act, and where you will exit if wrong.
Example framework you can reuse.
- Driver: rate expectations shift toward currency A.
- Bias: long A/B.
- Condition: the next data prints do not reverse that pricing.
- Timing: buy after price reclaims a key level, or on a pullback into it.
Do not force entries because you feel right on the macro. If your timing level does not trigger, you do nothing.
Using Key Levels and Invalidation Points to Stay Objective
Fundamentals can stay “right” while price moves against you. You need a line where you admit you are wrong.
Pick levels that map to decision points other traders respect.
- Prior day high and low.
- Weekly high and low.
- Last swing high and swing low on your trading timeframe.
- Round numbers only if they align with a prior swing.
Define three prices before you enter.
- Entry: the level that proves your timing is valid.
- Stop: the invalidation point, beyond the level that should not break if you are right.
- Target: the next liquidity area, often the next swing or weekly level.
Keep your stop logic clean. If your stop sits inside random noise, you built a bad setup. Move the entry or skip the trade.
Catalyst-Based Trades: Aligning Releases With Your Macro Thesis
Your best fundamental trades usually need a catalyst. Price needs fresh information.
Build each setup around one upcoming event and one expected market reaction.
- Event: CPI, jobs, central bank decision, speech, or minutes.
- Market focus: inflation, growth, labor, or risk.
- What matters: the part that changes rate pricing, not the headline.
Plan two scenarios and one no-trade outcome.
- Base case: data confirms your thesis, you trade in your bias direction.
- Flip case: data breaks your condition, you stand down or reverse if price confirms.
- No-trade: mixed release, low follow-through, or whipsaw price action.
Keep your process tied to rate expectations. If you need a refresher on the linkage, use this guide on how interest rates affect currency pairs.
| Release type | What to track | Typical FX reaction driver |
|---|---|---|
| Inflation (CPI) | Core, services, shelter, month-on-month trend | Terminal rate pricing, timing of cuts |
| Jobs (NFP, unemployment, wages) | Wages, participation, revisions | Growth and inflation persistence |
| Central bank decision | Statement tone, dots, forecasts, press Q&A | Forward path of rates, risk sentiment |
| PMI and activity data | New orders, prices paid, services vs manufacturing | Growth surprise and risk appetite |
Position Sizing Around News: Reducing Risk Without Missing Moves
News expands spreads and slippage. Your normal size becomes too large.
Control risk with simple rules.
- Risk a fixed percent or fixed dollars per trade, then adjust size to your stop distance.
- Use smaller size into high-impact releases. Add only after price confirms direction.
- Avoid tight stops right before the release. Volatility will hit them first.
- Place orders with a plan for slippage. If the fill ruins your risk, cancel.
Use a two-step approach when you want exposure but you respect the event risk.
- Pre-event: small probe with a wide, technical invalidation, or stay flat.
- Post-event: trade the break and retest of your key level with normal structure.
Keep your math visible. If your stop doubles because volatility rises, your position size must halve if you want the same risk.
Tools and Sources Beginners Can Trust (E-E-A-T Focus)
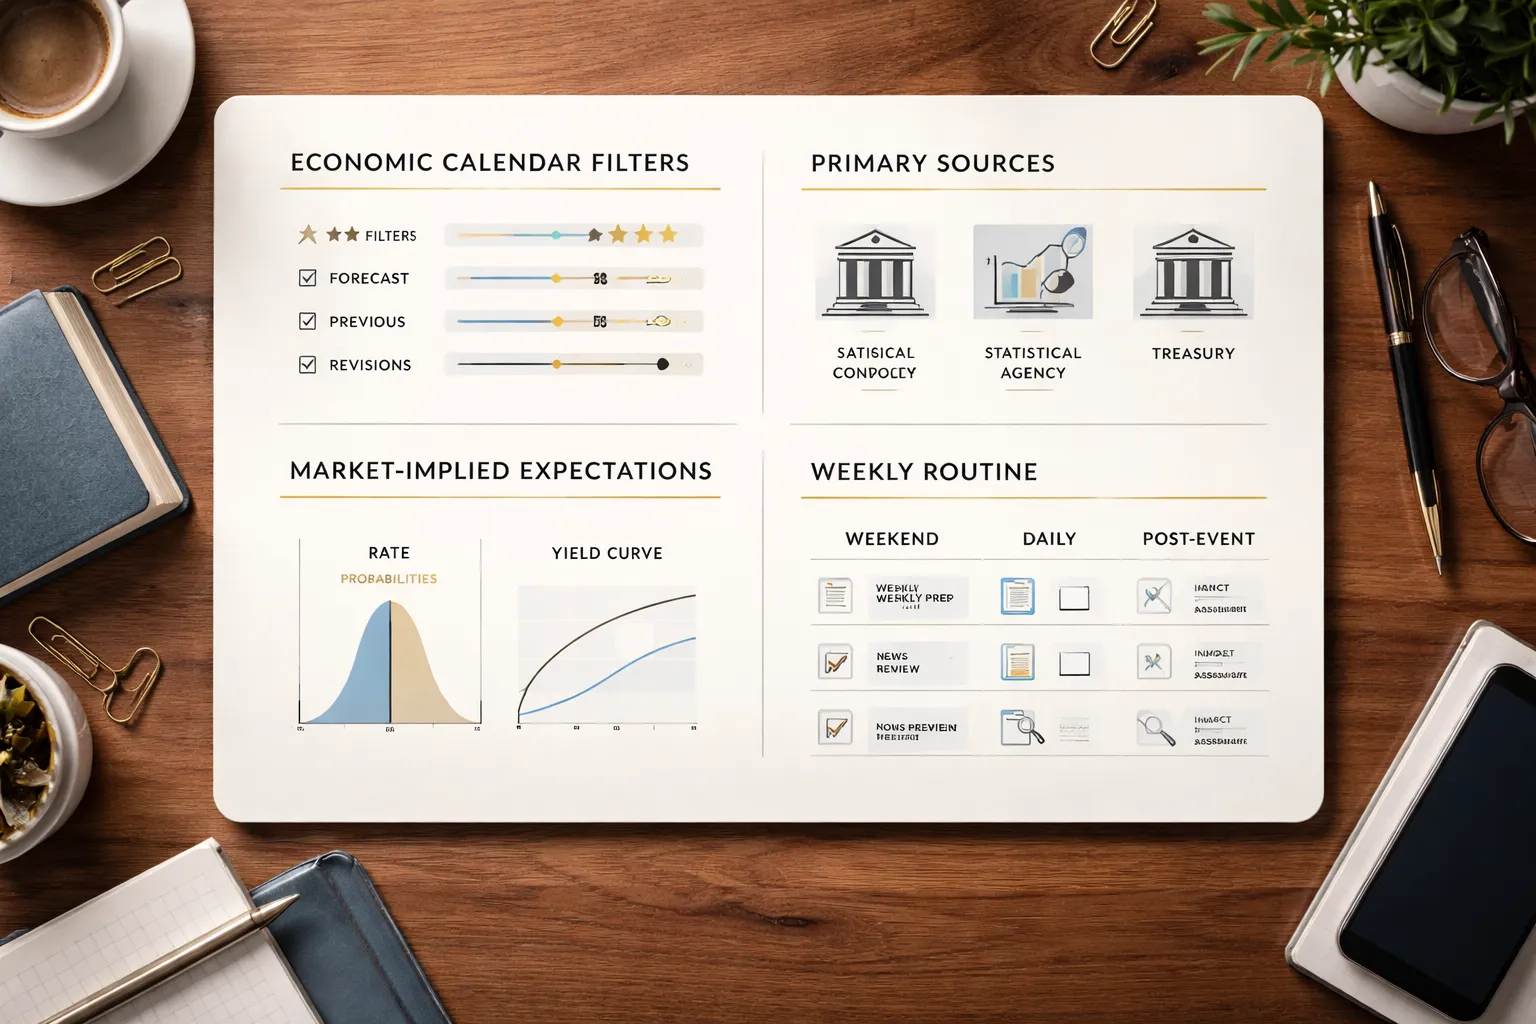
Economic Calendars: Use Filters That Protect Your Focus
Use one calendar. Stick with it. Consistency beats hunting for a better list.
Filter hard. You want fewer events, not more.
- Importance: show only high impact for the currencies you trade. Add medium only if you trade that specific release.
- Forecast: read it as the market baseline. Your job is to compare the print to this number, not to your opinion.
- Previous: check trend and base effects. If last month was an outlier, expect mean reversion risk.
- Revisions: treat revisions as part of the release. Some data moves more on the revision than the headline.
- Event type: separate rate decisions, CPI, jobs, GDP, PMIs, and speeches. Do not mix them in your head.
- Time zone: set it once. Match it to your platform time. Avoid avoidable mistakes.
For each high impact event, write one line in your plan. Baseline equals forecast. Risk window equals release time plus the next 30 to 60 minutes.
Primary Sources: Start With Official Releases
Use primary sources for anything that can reprice rates or growth. You get the cleanest wording, the full tables, and the exact timestamps.
- Central banks: policy statements, minutes, press conferences, speeches, balance sheet updates.
- Statistical agencies: CPI, labor reports, GDP, retail sales, trade, surveys.
- Debt offices and treasuries: auction schedules, issuance plans, fiscal updates.
Two rules keep you safe.
- Quote the document, not a headline. Headlines compress nuance and often miss the reaction function.
- Save the PDF link in your notes. You need an audit trail when you review trades.
If you trade EUR or USD often, anchor your view in rates and inflation first. Use interest rates and currency pairs as your core mental model.
Market-Implied Expectations: Track What Traders Already Priced
Fundamentals move price when reality diverges from expectations. Your edge comes from measuring expectations.
Focus on two tools.
- Rate probabilities: they show the odds of a hike, cut, or hold at the next meetings. Use them to judge surprise risk. A 90 percent priced outcome rarely shocks on the decision alone. The path and guidance still can.
- Yield curves: they summarize growth and inflation expectations. Watch the 2-year segment for policy expectations. Watch 5 to 10-year for longer trend and risk sentiment.
Use a simple workflow.
- Before a central bank meeting, record the current implied path for the next two meetings.
- After the decision, check what repriced. If the front end of the curve moved, the market changed its policy view. If it did not, the move may fade.
Keep it practical. You do not need complex models. You need to know what the market expected, and how far the new information pushed the curve.
Build a Weekly Routine You Can Maintain
You need a routine that fits your time. If you cannot repeat it, it will not help your trading.
| When | What you review | What you write down |
|---|---|---|
| Weekend | Next week’s high impact calendar for your pairs, central bank speakers, major data prints, risk events | Key event times, your no-trade windows, and two or three levels where you will act post-event |
| Weekend | Market pricing snapshot, rate probabilities, 2-year yields, major spreads that matter for your pairs | What the market expects, and what would count as a surprise |
| Daily | Today’s calendar, any revisions, any unscheduled headlines that change the rate path | One sentence, expectations unchanged or expectations shifted, and why |
| Daily | Your open risk, upcoming event windows, spread and volatility conditions | Position size check, stop distance check, and your plan to reduce exposure if needed |
| Post-event | Actual vs forecast, revision, and the move in front-end yields | Was it a real surprise, and did the market reprice the path |
Keep your sources clean. Use official releases for facts. Use market-implied tools for expectations. Use your chart for execution. This split keeps your analysis clear and your risk rules intact.
Common Beginner Mistakes in Forex Fundamentals (And How to Fix Them)
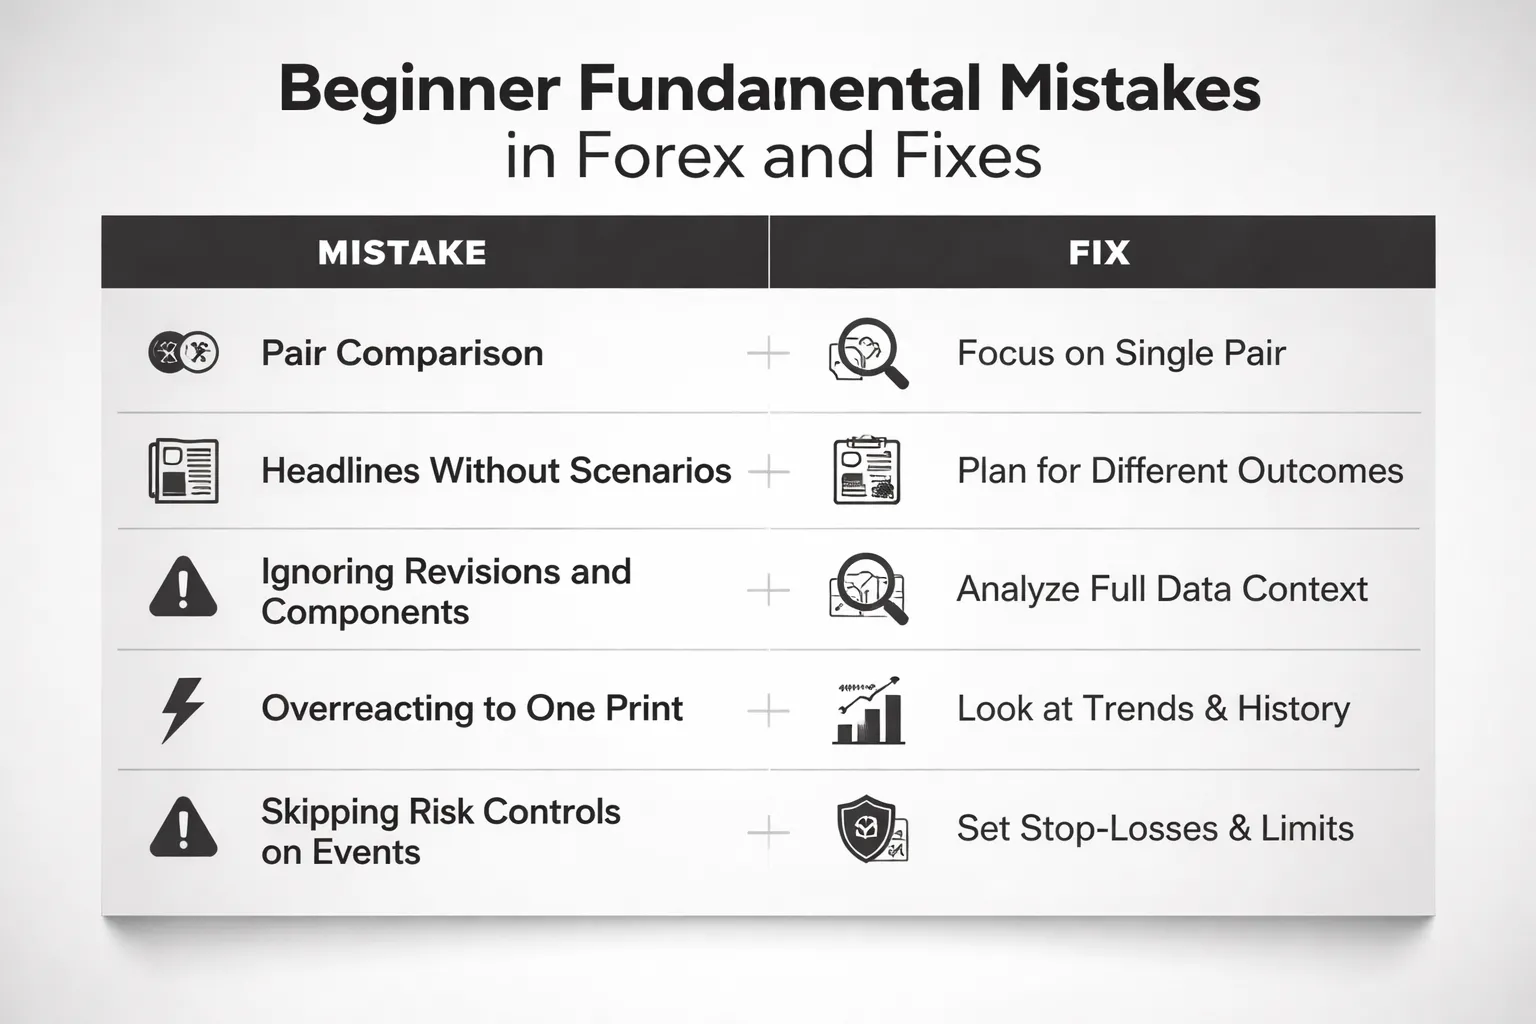
1) Focusing on one country and forgetting the pair comparison
FX prices a spread. Your chart reflects two economies and two policy paths.
- Mistake: You go long USD because US data prints strong, while the other side of your pair strengthens faster.
- Fix: Track both central banks, both inflation trends, and the rate differential. Anchor on what markets imply for each policy path, then compare changes.
- Quick routine: For your pair, write two lines. “Base currency: next policy step and why.” “Quote currency: next policy step and why.” Trade the gap, not the story.
2) Trading headlines without context or a scenario plan
Headlines move fast. Markets move on expectations, positioning, and the policy reaction function.
- Mistake: You buy or sell on the first number, with no plan for alternative outcomes.
- Fix: Build a simple scenario map before the release. Use official calendars and release pages for the facts. Use market-implied pricing for expectations, like OIS-implied policy rates and front-end yields for the reaction.
- Execution rule: Define your trigger. “I act only if the surprise also moves 2-year yields and reprices the next meeting.” If yields do not confirm, you reduce size or skip.
For a tighter event workflow, use this guide: how to trade forex news without getting wrecked.
3) Ignoring revisions, components, and forward guidance nuances
Markets trade the details. One headline number can hide the real signal.
- Mistake: You trade the top-line print and ignore revisions and subcomponents.
- Fix: Read the full release. Check revisions to prior months and key components that central banks watch. For CPI, split out core, services, and wages where available. For labor data, check participation, hours, and average earnings.
- Central bank filter: Track the latest statement, minutes, and press conference. Forward guidance can override one data print if it changes the expected path.
4) Overreacting to one data point instead of the trend
One print can be noise. Policy shifts need persistence.
- Mistake: You treat a single surprise as a new regime and chase price.
- Fix: Use rolling trends. For inflation, watch 3-month and 6-month annualized rates alongside year-on-year. For jobs, watch 3-month averages and wage trend. For growth, focus on breadth, not one survey.
- Trading rule: You size smaller on first signal. You size up only after confirmation across releases and rates pricing.
5) Skipping risk controls during high-volatility events
Event risk can break good analysis. Spreads widen. Liquidity thins. Slippage increases.
- Mistake: You trade normal size into major releases. You place tight stops in a spread-widening window. You hold leveraged positions through known risk without a plan.
- Fix: Set event rules. Reduce size, widen stops based on volatility, or step aside. Use hard invalidation levels from your chart, not arbitrary pip counts.
- Checklist: Know the release time, your max loss, your exit plan if spreads blow out, and the level where your thesis fails. If you cannot define those, you do not trade.
Pros, Cons, and When Fundamental Analysis Works Best
Strengths: Big-Picture Edge, Regime Identification, Catalyst Clarity
- Big-picture edge. Fundamentals tell you which currency should have demand over weeks and months. Rates, inflation, growth, and risk flows drive that demand.
- Regime identification. You can label the market. Tightening cycle vs easing cycle. Inflation shock vs growth scare. Risk-on vs risk-off. Your strategy changes with the regime.
- Catalyst clarity. You trade around known events. Central bank meetings, CPI, jobs data, fiscal headlines. You know what can change price fast, and what probably will not.
- Cleaner invalidation. A thesis has conditions. If data or policy breaks those conditions, you exit. You stop guessing.
Limitations: Timing Uncertainty, Crowded Trades, Narrative Shifts
- Timing uncertainty. You can be right and still lose. Price can move against you for days before it follows the macro logic. Leverage makes that problem bigger.
- Expectation risk. Markets trade the gap between results and forecasts. “Good” data can drop a currency if traders expected even better.
- Crowded trades. If everyone shares the same story, positioning gets one-sided. When the story cracks, the unwind turns violent. Spreads widen and stops slip.
- Narrative shifts. The driver can change fast. One week it is inflation. Next week it is recession risk. Then it is geopolitics. Your thesis must update or you will trade the old tape.
- Data is noisy. One release rarely settles a trend. Revisions happen. Seasonal effects distort. You need a series, not a single print.
When Fundamental Analysis Works Best
- Swing trading. Best when you hold days to weeks and can wait for follow-through after a catalyst. You use fundamentals to pick direction, then use charts to time entries.
- Position trading. Best in clear policy divergence. One central bank hikes while another pauses or cuts. Trends can persist for months.
- Event-driven strategies. Best when you define the event, the consensus, the surprise threshold, and your risk limits. You avoid random trades between releases and focus on scheduled volatility. Use an economic calendar to plan windows, scenarios, and no-trade periods.
How to Combine Fundamentals With Technicals for Higher-Quality Decisions
- Step 1, pick the bias with fundamentals. Write a one-line thesis. Example: “Higher expected rates support this currency until the central bank signals a pivot.”
- Step 2, map the levels on the chart. Mark weekly support and resistance, prior highs and lows, and the last major swing points. These become your risk and target zones.
- Step 3, define invalidation with price. Choose a level that proves your thesis wrong. Place the stop beyond that level, not at a round number.
- Step 4, wait for alignment. Trade when price breaks, retests, or rejects a key level in the direction your thesis expects. Skip trades when price sits mid-range.
- Step 5, size for event risk. Reduce size into high-impact releases, or stay flat. Assume spreads widen and fills worsen.
- Step 6, update the thesis after the release. Compare actuals to expectations and to the market reaction. If price rejects your thesis, treat that as information and step aside.
| Use case | Fundamentals give you | Technicals give you |
|---|---|---|
| Trend and regime | Direction and persistence drivers | Structure, trend validation, targets |
| Event trading | Catalyst, scenarios, surprise thresholds | Execution plan, invalidation, volatility context |
| Risk control | Known risk windows and headline sensitivity | Hard levels for stops and exits |
FAQ
What is fundamental analysis in forex?
It is the study of macro data and policy that moves currency demand. Track rates, inflation, growth, jobs, trade, and risk sentiment. You use it to frame direction, define catalysts, and set surprise thresholds for events.
What fundamentals matter most for beginners?
Start with central banks and rates. Then inflation prints, labor data, and growth surveys. Add risk sentiment and energy when they drive your pair. Ignore low impact releases until you can link them to policy or positioning.
How do interest rates move currencies?
Rates and expected rates drive yield differentials. Higher expected yields usually support a currency. What matters is the change in expectations, not the headline alone. Watch policy guidance, futures pricing, and yield moves around key events.
Which economic releases move forex the most?
It depends on the central bank reaction function. Often, CPI, jobs, GDP, and PMI. For some currencies, wages and retail sales matter. Track which releases shift rate pricing and yields in your market regime.
How do I use an economic calendar correctly?
Filter for high impact. Note the forecast, prior, and release time. Define your surprise threshold. Mark your risk window and expected volatility. Plan entry rules, stop distance, and invalidation before the number hits.
Do I need to read every news headline?
No. Focus on scheduled data and top policy headlines. Build a watchlist of recurring drivers for your pairs. Use alerts for central bank speakers and major geopolitical updates. Avoid chasing minor stories with no yield or policy impact.
How do fundamentals and technicals work together?
Fundamentals set the bias and identify catalysts. Technicals handle execution. Use structure to define entries and exits, trend tools to validate, and levels for stops. If price action contradicts your thesis, reduce risk or exit.
What is a “surprise” and why does it matter?
A surprise is the gap between actual and expected. Markets trade surprises because expectations are priced in. Track consensus and how much deviation moves yields and FX. Small misses can matter if positioning is crowded or policy is sensitive.
How do I avoid getting wrecked trading news?
Trade smaller size. Use wider stops or no stops only if you use hard exits and strict max loss. Avoid illiquid times. Know spread risk. Prefer waiting for the first move and then trading the break or pullback.
How long does a fundamental move last?
Event spikes can fade in minutes. Regime changes can last weeks or months. Use yields and rate pricing to judge persistence. If the driver shifts policy expectations, the move tends to last longer than a one off data beat.
What is the simplest fundamental workflow?
- Pick one pair.
- List its top 3 drivers.
- Track the next 3 high impact releases.
- Write scenarios and thresholds.
- Trade only when price confirms your thesis.
Which metrics should I track every week?
Rate expectations, 2 year yields, and key central bank dates. Inflation trend and labor tightness for policy pressure. Risk sentiment proxies like equity index direction and credit stress. For commodity FX, track oil or metals linked to that economy.
Where should I start if I want to trade events?
Start with one recurring release, like CPI or the central bank decision. Learn its typical volatility and spread behavior. Build a simple plan and back review outcomes. Use this guide on how to trade forex news without getting wrecked.
Conclusion
Conclusion
Fundamental analysis in forex comes down to one thing, relative change. Track what shifts the rate path, the growth outlook, and risk appetite faster than the market expects.
Keep your process tight. Pick one currency pair and one driver. Build a small dashboard and update it the same way every week.
- Rates: policy rate, swaps, and the next two to four central bank meetings.
- Inflation: CPI trend, surprises versus consensus, and core versus headline.
- Growth: jobs, PMI, and retail, focus on momentum.
- Risk: equity index direction, credit stress, and volatility.
- Flows and trade: current account, terms of trade, and key exports like oil or metals.
Final tip. Write a one page plan before each major release. Define your “beat, miss, or in line” thresholds, your invalidation level, and your max loss. Then log the outcome, including spreads and slippage, and refine the thresholds over 20 to 30 repeats.
If you want the mechanics behind these drivers, read what actually moves prices.
-
How Interest Rates Affect Currency Pairs (With Real Examples)
6 months ago -
Fundamental Analysis in Forex Explained (What Actually Moves Prices)
6 months ago -
What Moves EUR/USD? The Biggest Drivers You Should Watch
6 months ago -
Inflation and Exchange Rates Explained (Why Currencies Rise or Fall)
6 months ago -
How to Trade Forex News (NFP, CPI, FOMC) Without Getting Wrecked
6 months ago
-
- Central Banks: The Most Important Fundamental Driver
- What to listen for in statements, minutes, and press conferences
- Hawkish vs dovish language decoded, examples you can spot
- Policy tools beyond rates: QE, QT, balance sheet, yield curve control
- Credibility and reaction functions, what they prioritize
- Central bank checklist you can use every meeting
-
- Step 1: Choose a pair, map each economy’s sensitivities
- Step 2: Build a central bank scoreboard (trend, tone, constraints)
- Step 3: Create a watchlist of 5 to 8 recurring releases per currency
- Step 4: Write scenarios, base case, upside, downside, invalidation
- Step 5: Plan timing, pre-event, during release, post-event reassessment
-
- What is fundamental analysis in forex?
- What fundamentals matter most for beginners?
- How do interest rates move currencies?
- Which economic releases move forex the most?
- How do I use an economic calendar correctly?
- Do I need to read every news headline?
- How do fundamentals and technicals work together?
- What is a “surprise” and why does it matter?
- How do I avoid getting wrecked trading news?
- How long does a fundamental move last?
- What is the simplest fundamental workflow?
- Which metrics should I track every week?
- Where should I start if I want to trade events?
-
- Central Banks: The Most Important Fundamental Driver
- What to listen for in statements, minutes, and press conferences
- Hawkish vs dovish language decoded, examples you can spot
- Policy tools beyond rates: QE, QT, balance sheet, yield curve control
- Credibility and reaction functions, what they prioritize
- Central bank checklist you can use every meeting
-
- Step 1: Choose a pair, map each economy’s sensitivities
- Step 2: Build a central bank scoreboard (trend, tone, constraints)
- Step 3: Create a watchlist of 5 to 8 recurring releases per currency
- Step 4: Write scenarios, base case, upside, downside, invalidation
- Step 5: Plan timing, pre-event, during release, post-event reassessment
-
- What is fundamental analysis in forex?
- What fundamentals matter most for beginners?
- How do interest rates move currencies?
- Which economic releases move forex the most?
- How do I use an economic calendar correctly?
- Do I need to read every news headline?
- How do fundamentals and technicals work together?
- What is a “surprise” and why does it matter?
- How do I avoid getting wrecked trading news?
- How long does a fundamental move last?
- What is the simplest fundamental workflow?
- Which metrics should I track every week?
- Where should I start if I want to trade events?
-
How to Place a Forex Trade Step by Step (Your First Trade Explained)
4 months ago -
Forex Trading vs Crypto Trading: Which Market Is Better for Beginners?
4 months ago -
Forex Lot Size Calculator: How to Use It to Size Trades Correctly
6 months ago -
How to Calculate Position Size in Forex (Position Sizing Formula + Examples)
6 months ago -
Forex Leverage Explained: How It Works, Pros, Cons & Examples
6 months ago
-
Forex Trading Platforms Comparison: MetaTrader vs cTrader vs TradingView
6 months ago -
Stop Loss vs Take Profit: Differences, Examples & Best Practices
6 months ago -
Is Forex Trading Legal in the United States? Rules, Regulators & What to Know
6 months ago -
Forex Market Hours & Trading Sessions Explained (Best Times to Trade)
6 months ago -
Forex Leverage Explained: How It Works, Pros, Cons & Examples
6 months ago