How to Use the Forex Economic Calendar: A Step-by-Step Guide

Major economic releases move FX fast. If you trade without a plan, spreads widen, volatility spikes, and your entries slip. The forex economic calendar helps you see those risk windows before they hit.
This guide shows you how to use the calendar step by step. You will learn how to filter by country and currency, set your time zone, and rank events by impact. You will learn what “actual,” “forecast,” and “previous” mean, and how to read revisions. You will learn how to map events to the pairs you trade, plan trade windows, and set risk rules around high impact news.
If you want a deeper playbook for event trading, read how to trade forex news without getting wrecked.
Key Takeaways
- In het kort: Filter the calendar by country and currency, then set your time zone.
- Rank events by impact, build your week around high impact releases.
- Read the three numbers fast. Actual is the print, Forecast is the market baseline, Previous is the last print.
- Check for revisions. A revised prior can move price as much as the headline.
- Map events to your pairs. If you trade EUR/USD, focus on ECB, Fed, Eurozone CPI, US CPI, and US labor data.
- Plan trade windows. Decide what you will do 60 minutes before, at release, and 60 minutes after.
- Set hard risk rules around high impact news. Reduce size, widen stops only with intent, or stand aside.
- Track outcomes. Log forecast vs actual surprise, direction, and the first 5 to 30 minute reaction.
- Study the events that repeatedly move your market, start with Non-Farm Payrolls.
What a Forex Economic Calendar Is (and Why It Moves Markets)
Definition and what’s included
A forex economic calendar is a schedule of market moving events. It shows what will print, when it will print, and which currency it can hit.
You will usually see these fields: event name, currency, time, impact rating, previous, forecast, and actual.
- Data releases: inflation, jobs, growth, retail sales, surveys, trade, inventories.
- Central bank events: rate decisions, minutes, press conferences, testimony, speeches.
- Bond auctions: size, maturity, and results. Weak demand can push yields and move FX.
- Market holidays: thinner liquidity, wider spreads, slower fills.
- Revisions: prior data gets updated. Revisions can matter as much as the headline.
How markets price expectations
Price moves before the release because the market trades expectations.
Most calendars show a forecast, often called consensus. That number reflects what analysts expect, not what the market must do.
The key input is the surprise, the gap between actual and expected. Bigger gap, bigger reaction. Direction depends on the currency and the regime.
| Calendar field | What it means for your trade |
|---|---|
| Previous | Last reported value, often revised later. |
| Forecast (consensus) | The reference point the market compares the release against. |
| Actual | The print that triggers repricing if it differs from expectations. |
| Revision | Can change the story and override the new headline. |
For rate sensitive pairs, the surprise matters most when it shifts the expected path of policy rates. That is why CPI, jobs data, and central bank communication can dominate intraday moves.
Why volatility clusters around scheduled events
Scheduled releases create a predictable time where many traders act at once.
- Liquidity shifts: market makers pull quotes before the number. Depth drops.
- Spreads widen: your cost goes up right when you want precision.
- Order flow spikes: stops, breakout orders, hedges, and algorithms all hit together.
- Slippage rises: fills slip when price jumps across levels.
Plan for the microstructure, not just the headline. A clean directional view can still lose if you trade into a spread blowout or a stop sweep.
Economic calendar vs breaking news
The calendar helps you manage known risk. It tells you when a catalyst can hit and what the market expects.
It cannot predict unscheduled shocks. It will not warn you about surprise comments, geopolitical headlines, emergency policy moves, or sudden risk events.
Use the calendar to control timing and exposure. Use broader fundamentals to understand what tends to move a pair. Start with fundamental analysis in forex.
How to Read an Economic Calendar: Field-by-Field Breakdown
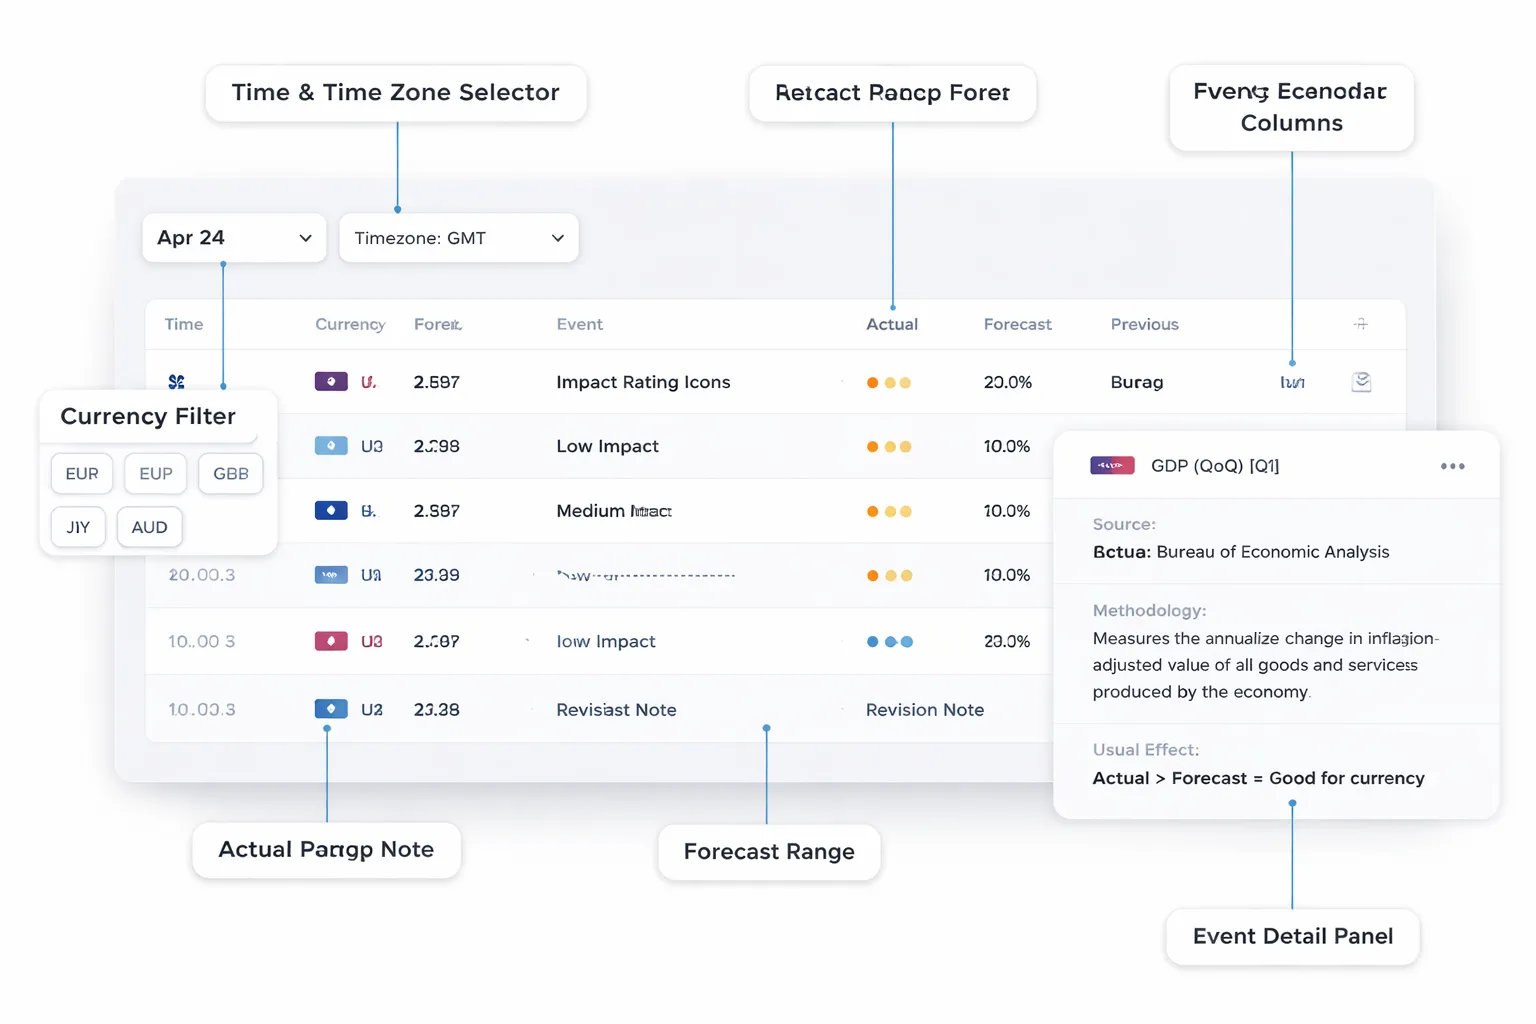
Time and Time Zone Conversion
Start with the time column. It controls your execution risk.
- Platform time vs local time: Many calendars default to New York time or broker server time. Set it to your local time and confirm it stays locked.
- Daylight saving traps: The US, UK, EU, and Australia switch on different dates. For a few weeks each year, events shift by one hour relative to your chart time. Mark those weeks in advance.
- Release minute matters: Some events hit at the hour, some at :30, some at 8:15, some at 8:30. Do not assume.
- All-day events: Summits, elections, and holidays can show as “All Day.” Liquidity and spreads still change, even without a single release time.
Currency and Country Filters, Map Events to the Pairs You Trade
Filter by currency first. Then check the counterpart currency in your pair.
- Direct mapping: USD events often move EUR/USD, GBP/USD, USD/JPY, USD/CHF, and USD/CAD.
- Cross mapping: EUR events can move EUR/GBP and EUR/JPY, even if USD stays quiet.
- Local vs global currencies: CHF and JPY react to risk sentiment and yields, not just domestic data. CAD tracks oil and US demand. AUD and NZD track China-linked growth signals.
- Use your pair’s drivers: Rate decisions, inflation, and labor data tend to matter most. See how interest rates affect currency pairs if you need the rate transmission basics.
Impact Ratings, Use Them, Do Not Obey Them
“Low, medium, high” is a rough flag. It is not a volatility guarantee.
- High impact usually means: central bank decisions, CPI, jobs, GDP, major speeches.
- Low impact can still move price: when positioning is crowded, liquidity is thin, or the data changes the rate path.
- Market regime matters: In rate-driven markets, inflation surprises hit harder. In risk-off markets, growth warnings can dominate.
- Pair sensitivity differs: A “medium” UK wage print can hit GBP harder than a “high” US second-tier release hits USD.
Actual vs Forecast vs Previous
These three columns tell you what the market expected and what it got.
| Field | What it means | How you use it |
| Forecast | Consensus estimate before release | Defines the baseline. Price often reflects it before the number drops. |
| Actual | Released value | Drives the first reaction. Focus on the surprise versus forecast. |
| Previous | Last reported value | Sets context and trend. It matters more when the series is turning. |
- Surprise size matters: A small beat may do nothing if the market already leaned that way. A large miss can break levels fast.
- Direction matters by indicator: Higher inflation often supports a currency if it implies higher rates. Higher unemployment often hurts. Always tie it back to the expected central bank response.
- Units matter: Some prints show m/m, q/q, y/y, annualized, or index levels. Do not compare the wrong line.
Revisions, Ranges, and Dispersion
The headline number can mislead. The details decide the trend.
- Revisions: Some releases revise the previous month. A big revision can outweigh the current “Actual.” Track both.
- Forecast range: Many calendars show a high and low estimate. Wide ranges signal uncertainty. Tight ranges raise the chance of a sharp reaction if the number lands outside.
- Dispersion: If analysts disagree, the market can whip after the release, then pick a direction as rates reprice.
- Underlying components: Core CPI vs headline CPI, wages inside jobs data, participation rate, and prior-month revisions can flip the message.
Event Descriptions and Methodologies
Read the event detail panel. It tells you what the indicator measures and why traders care.
- Source: Know who publishes it, such as BLS, BEA, Eurostat, ONS, BoJ, Fed, or private surveys.
- What it measures: Prices, jobs, output, sentiment, credit, or housing. Each links to policy in a different way.
- How it is calculated: Survey-based indicators can move on expectations. Hard data can move on revisions and seasonals.
- Coverage and timing: Some series lag by months. Others lead the cycle. Do not treat them as equals.
- Seasonal adjustment: Seasonals can distort month-to-month changes. Use y/y and trend context when seasonality is heavy.
- Central bank relevance: The calendar description often states why it matters. Translate that into one question, does it change the rate path or risk tone.
Economic Indicators Forex Traders Should Prioritize
Central bank decisions
Central banks move FX through two channels. Rate differentials and risk tone.
- Rate decision. The headline matters most when the market prices the wrong outcome. Track the implied probability from futures or OIS, then compare the decision to pricing.
- Statement language. Focus on forward guidance, inflation concern, growth concern, and any change to reaction function. Small wording shifts can reprice the next meeting.
- Dots and projections. For banks that publish paths, compare the median path to the market path, not last quarter. Watch the terminal rate, the year-end level, and any inflation forecast revisions.
- Press conference. Treat it as the real event. You want one takeaway, did the chair validate market pricing or push back on it.
If you trade G10, central bank events often outweigh every other release that week. If you want the mechanics, read how interest rates affect currency pairs.
Inflation data
Inflation sets the rate path. You should prioritize releases that central banks target or reference.
- CPI. Markets react to the miss versus consensus and to revisions. Look at the monthly annualized trend, not one print.
- Core CPI. Core drives policy sensitivity. A hot core print usually beats a soft headline for FX impact.
- PCE. For the US, core PCE links tighter to the Fed. It can confirm or overturn the CPI signal.
- Sticky components. Services, shelter, and wages-linked categories keep inflation elevated even when energy falls. If sticky parts stay firm, markets price cuts later and the currency can hold strength.
On your calendar view, tag CPI, core CPI, and PCE as high priority. Add the subcomponents in your notes, shelter, services ex housing where relevant, and trimmed mean or median measures if published.
Jobs data
Labor drives consumption and wage pressure. It also drives recession risk. You need the full set, not one headline.
- NFP or monthly employment. Focus on the three inputs that move pricing, headline change, prior revisions, and average hourly earnings.
- Unemployment rate. Small moves matter when the rate sits near cycle lows. Check whether the move came from employment or from labor force changes.
- Wages. Wages anchor services inflation. A wage beat can lift yields even when headline jobs miss.
- Jobless claims. Claims lead. They matter most when they trend for several weeks. Use them for setup, not for one-off spikes.
- Participation rate. Rising participation can cool wage pressure without a collapse in jobs. Falling participation can mask weakness.
Growth and sentiment
Growth data moves FX when it changes recession odds or alters the policy outlook.
- GDP. Treat it as confirmation. It often comes late. Watch the details, consumption, investment, and inflation deflators.
- PMIs. PMIs lead. They can reprice a currency fast because they hit earlier and signal turning points.
- Retail sales. Retail is a clean demand gauge. Focus on the control group where published, it maps better to GDP.
- Consumer confidence. Confidence matters when it swings hard and aligns with spending. Use it as context, not a trigger by itself.
Risk and liquidity events
Some calendar items do not change fundamentals. They change liquidity and positioning. That still moves price.
- Bond auctions. Weak auctions can lift yields and hit risk, especially in the US and core Europe. Watch bid-to-cover, tails, and indirect demand.
- Fiscal announcements. Budgets, funding plans, and debt ceiling style risks can move the currency through risk premium and rate expectations.
- Major holidays. Thin liquidity amplifies moves and widens spreads. Reduce size or avoid breakout trades when key centers close.
Country-specific market movers
Each currency has a short list of releases that consistently move it. Build your own list with three filters.
- Policy linkage. Prioritize the data your central bank cites. If the bank focuses on wages, make wages a top-tier event.
- Surprise history. Scan the last 6 to 12 releases. If one series regularly beats or misses and price reacts, it belongs on your priority list.
- Macro regime. In inflation regimes, CPI and wages dominate. In recession regimes, jobs, PMIs, and credit stress dominate. Update your list when the regime changes.
| Currency | High priority indicators to tag |
|---|---|
| USD | FOMC decision and press conference, CPI and core PCE, NFP and wages, ISM PMIs, Treasury auctions |
| EUR | ECB decision and press conference, Eurozone HICP, wage trackers where available, PMIs, major member CPI prints |
| GBP | BoE decision and minutes, CPI, average weekly earnings, labor market report, retail sales |
| JPY | BoJ decision and guidance, wage data, CPI Tokyo and national, MoF and yield policy signals, bond auctions |
| AUD | RBA decision and statement, CPI, jobs report, China PMIs and activity data, commodity-sensitive risk days |
| CAD | BoC decision and MPR, CPI, jobs report, retail sales, oil-sensitive risk events |
| NZD | RBNZ decision and projections, CPI, labor market report, dairy and risk tone days |
| CHF | SNB decision, CPI, risk sentiment drivers, Eurozone spillovers |
Keep your calendar simple. Flag the top three for each currency you trade, then treat everything else as context.
Step-by-Step: Economic Calendar Forex How to Use (A Repeatable Workflow)
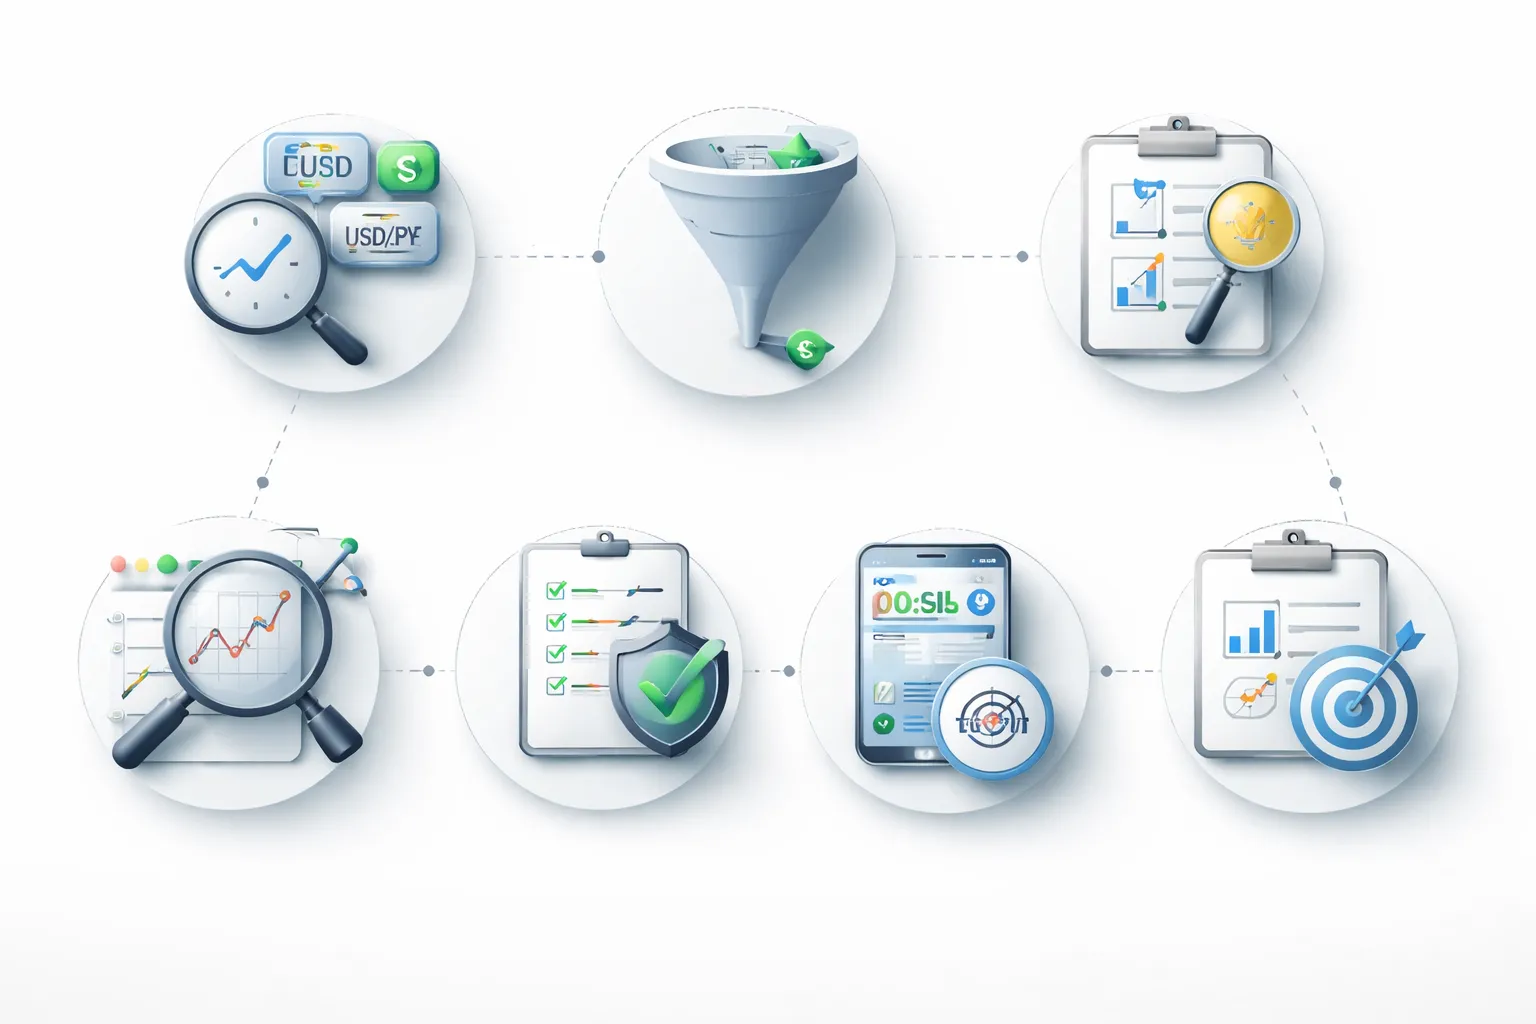
Step 1, Choose your trading universe: pairs, sessions, and holding period
Decide what you trade and when you trade it. Do this before you open the calendar.
- Pairs: pick 3 to 6 pairs. Focus on one USD pair and one cross you understand.
- Sessions: match your screen time to the pair. Asia for JPY and AUD, London for EUR and GBP, New York for USD and CAD.
- Holding period: define your default. Intraday, 1 to 2 days, or swing. Your holding period sets how far ahead you scan and how wide your risk must be.
Step 2, Filter the week: mark high-impact events and potential conflict days
Scan the week once. Then reduce it to a short list.
- Filter by your currencies only. Hide the rest.
- Mark high-impact releases and central bank events. These drive the week’s volatility.
- Flag conflict days. These are days with multiple major releases close together, or events on both sides of your pair.
- Note the exact time and your broker time zone. Set alerts 30 minutes before and 5 minutes before.
If you trade USD pairs, treat FOMC days as a separate category. Use this FOMC prep guide to plan around the decision, statement, and press conference.
Step 3, Build scenarios: stronger or weaker than expected and likely reactions
Do not trade the number. Trade the gap versus expectations.
- Write the consensus, the prior, and the range if your calendar shows it.
- Set three outcomes: above, near, below consensus.
- Define the first reaction you expect. Rates up usually supports the currency, rates down usually pressures it.
- Define the second reaction risk. Watch risk tone, equities, and yields. Some releases flip the first move fast.
Keep one line per scenario. Example format: “If CPI prints X above consensus, I expect Y pair to move in direction Z, then I look for continuation only if it holds above or below level L.”
Step 4, Check market context: trend, key levels, ATR, and recent volatility regime
Context decides whether the event becomes a trend day or a whipsaw.
- Trend: identify the direction on your higher time frame. Trade with it unless you have a clear reversal plan.
- Key levels: mark the prior day high and low, weekly high and low, and the nearest clean support and resistance.
- ATR: check daily ATR. Use it to judge whether your target makes sense and whether your stop is realistic.
- Volatility regime: compare the last 5 to 10 days range to the prior month. If ranges expanded, reduce size or widen stops, but do not do both.
Step 5, Define your plan: entry method, invalidation point, and profit-taking logic
Write the plan before the release. Keep it mechanical.
- Entry method: pick one. Breakout above or below a level, pullback after the first impulse, or retest of a failed level.
- Invalidation point: place it at the level that proves you wrong, not at a random pip count. Put it beyond a structure level and outside typical noise for that pair.
- Profit-taking: define targets using levels and ATR. Scale out at the first level, then trail behind structure or a moving stop rule you can follow.
- Risk: set a fixed percent per trade. Reduce size on central bank days and on conflict days.
Step 6, Execute with discipline: timing choices before, at, or after release
Pick one timing style. Each has a cost.
- Before release: you trade positioning. You accept gap risk and headline risk. Use smaller size and wider invalidation.
- At release: you trade the first move. Expect slippage, spread spikes, and fast reversals. Use hard rules for no-trade conditions, like spreads above your limit.
- After release: you trade confirmation. You wait for the first 5 to 15 minutes, then use levels and structure. You miss some moves, but you avoid many traps.
On high-impact events, your best edge often comes after the first reaction. Wait for price to show where it accepts.
Step 7, Post-event review: document outcomes, slippage, and whether the thesis held
Review each event you traded. Build a playbook.
- Record the actual print, the consensus, and the first 60-minute move in pips.
- Record spreads and slippage at entry and exit.
- Mark whether price respected your key levels.
- Grade your execution. Followed plan, broke plan, or changed plan mid-trade.
- Write one adjustment for next time. One line only.
This workflow stays the same every week. Your calendar becomes a filter, not a distraction.
3 Practical Ways to Trade Around Economic Releases
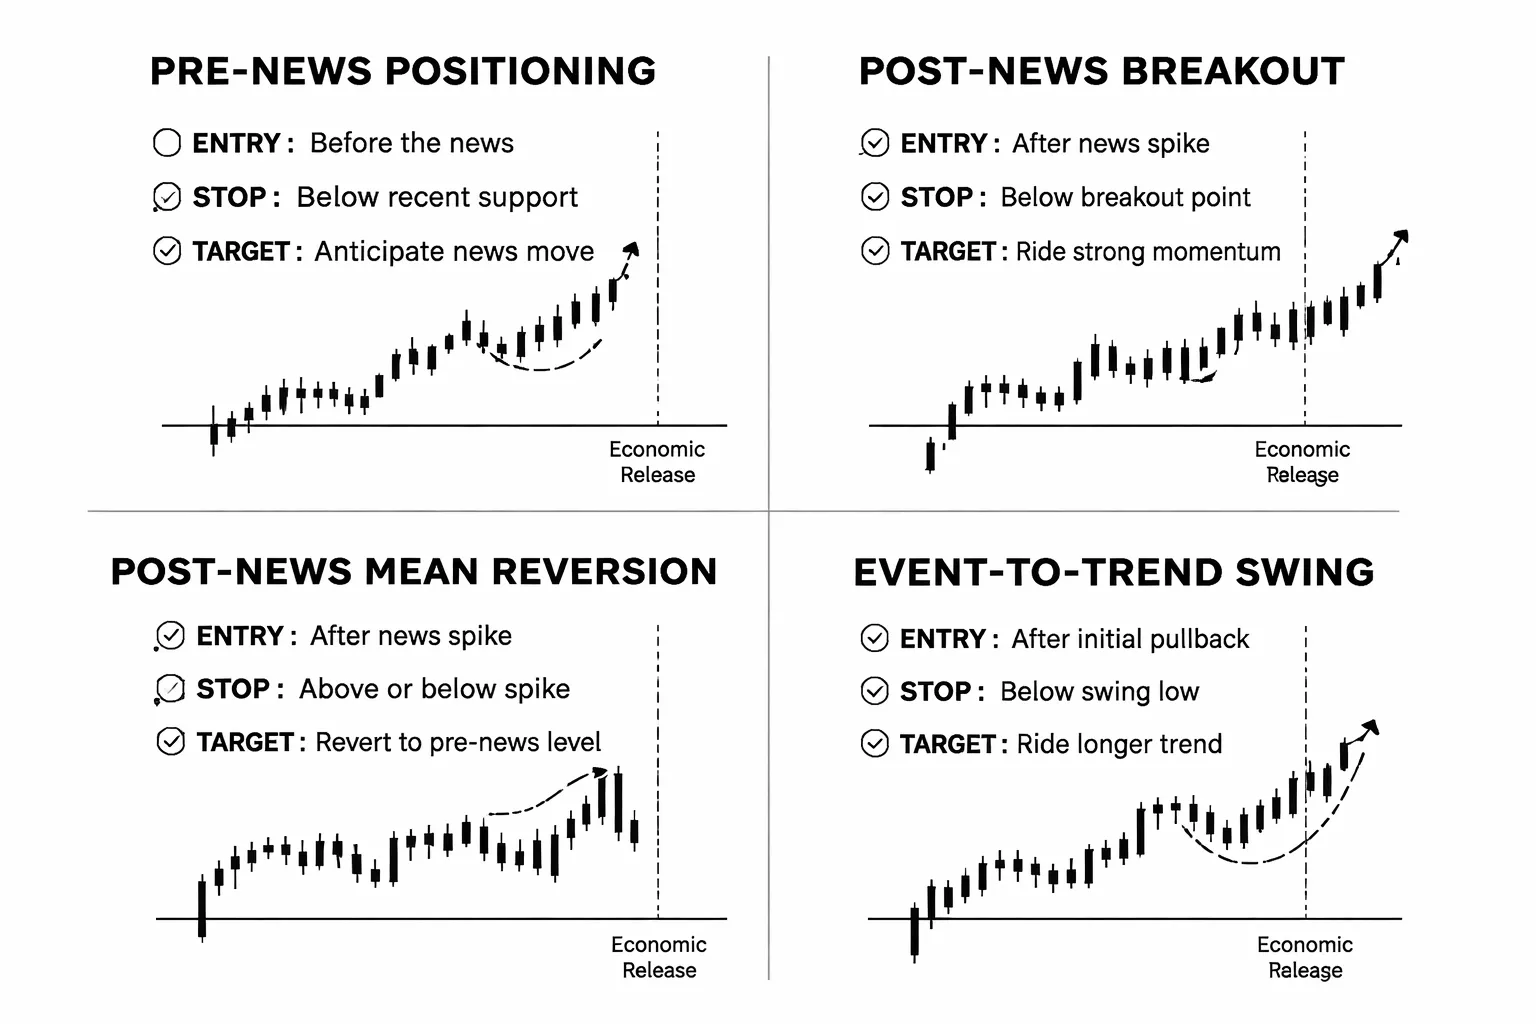
Pre-news positioning, when it works and when it becomes a coin flip
Pre-news trades try to capture the move before the data hits. Sometimes the market leaks a bias. Often it does not.
When it can work
- The event has a clear macro backdrop, and price trends into the release.
- Consensus has shifted for days, and related data already points one way.
- Liquidity stays stable, and spreads do not blow out in the hour before.
When it turns into a coin flip
- The release is a true surprise risk, like CPI, NFP, or a central bank decision.
- The pair sits in a tight range, and both sides have equal stops.
- You see fast pre-positioning candles with no follow-through.
Rules to keep it controlled
- Size down. Assume slippage at the release.
- Get flat before the print, unless you trade the release itself. Do not hold and hope.
- Use a hard invalidation level. If price hits it, exit. No debate.
Breakout approach, key levels plus volatility expansion after the release
This approach waits for the data, then trades the first clean expansion through a level.
- Mark key levels before the event, prior day high and low, London session high and low, and the last swing high and low on your trading timeframe.
- Measure the pre-news range. If the last 60 to 120 minutes compress, you often get a larger burst after the print.
- Wait for the first spike to show direction, then wait again. Let the first 1 to 3 minutes print.
- Enter only if price breaks a level and holds above or below it. You want acceptance, not a wick.
- Place the stop beyond the opposite side of the broken level, or beyond the spike low or high if that is tighter and still logical.
- Take partial profit into the next obvious level. Trail the rest behind structure, not behind hope.
Filters that improve results
- Skip if spreads widen beyond your limit.
- Skip if the first candle breaks both sides. That signals stop hunting and thin liquidity.
- Prefer breaks aligned with the higher timeframe trend.
Mean-reversion approach, fading overreactions with confirmation and risk controls
This approach fades the first move when it looks stretched and unstable. You need confirmation. You need a tight stop.
- Define your fade zone before the event, a prior swing level, a weekly level, or the edge of a multi-day range.
- Let the spike hit the zone. Do not step in front of it.
- Wait for a trigger, a rejection wick, a failure to hold above the level, or a lower high after the spike. Then enter.
- Place the stop beyond the spike extreme. If price takes the extreme, your idea is wrong.
- Target the midpoint of the spike first. Then target the pre-news price area if momentum dies.
Risk controls you should not skip
- Fade smaller. Spreads and fills hurt more in reversals.
- Avoid fading when the data creates a new regime, like a policy shift or a major inflation surprise.
- Stop trading after one loss on the event. The next attempt often becomes revenge.
If you trade CPI releases, learn the basics of how inflation impacts exchange rates so you know when a move can stick for days.
Event-to-trend strategy, using macro direction to bias swing trades over days or weeks
This strategy uses the calendar to set a directional bias. You then trade pullbacks and breaks after the market digests the news.
- Pick one theme, inflation, growth, or policy. Track only the events that change that theme.
- Write your base case before the week starts. Example, hawkish central bank bias, bullish currency, bearish counterpart.
- After each release, log the surprise and the 60-minute reaction. Then log the 24-hour follow-through. Follow-through matters more for swings.
- Build a bias score. Give +1 if data supports your base case, -1 if it hits against, 0 if noise. Update after each event.
- Trade only when price action matches the bias, higher highs and higher lows for longs, lower highs and lower lows for shorts.
- Use wide structure-based stops and smaller size. Swings need room.
- Reduce exposure ahead of the next high-impact release that can flip the theme.
| Method | Best for | Main risk | Your edge comes from |
|---|---|---|---|
| Pre-news positioning | Strong trend weeks | Surprise print and slippage | Clear bias plus tight invalidation |
| Post-news breakout | High-impact releases | Whipsaw through both sides | Level selection and acceptance after the spike |
| Post-news mean reversion | Range markets | Fading a real trend change | Waiting for rejection and using the spike extreme as the stop |
| Event-to-trend swing | Multi-day moves | Theme flips on the next release | Bias score plus price structure |
Risk Management for News and Calendar-Based Trading
Spread widening and slippage
News changes liquidity. Liquidity controls your spread and your fill.
Right before a high-impact release, spreads can widen fast. Your stop-loss sits in the market. If price gaps through it, your stop triggers but fills at the next available price. That is slippage. It can turn a planned 10 pip loss into 25.
Plan for worst-case fills on event minutes. Treat your stop as a risk cap, not a guaranteed price.
- Widened spread can hit your stop even if the chart never reaches it. Bid and ask move apart.
- Stop orders become market orders when triggered. In a spike, the fill can be far from your level.
- Gaps can skip levels on thin liquidity. Your platform may show no trades between prices.
Position sizing for event risk
Size for volatility, not for hope. High-impact events can move 1 to 3 times your normal range in minutes.
Use ATR or a simple volatility proxy to cut exposure. If today’s 14-period ATR on your trading timeframe is higher than your baseline, reduce size. If your planned stop must be wider to survive noise, reduce size again.
- ATR-based sizing, set stop distance as a fraction of ATR, then size so the dollar risk stays fixed.
- Volatility multiplier, if pre-event volatility is 2x normal, cut position size to 50 percent.
- Event bucket risk, cap total risk across correlated pairs. One USD event can move EURUSD, GBPUSD, USDJPY together.
Keep your risk per event small. Your edge comes from repetition, not from one release.
Order types in fast markets
Your order type decides what you control. Price or execution.
- Market orders, best for getting in or out fast. Worst for price control. Expect slippage on releases.
- Limit orders, you control price. You risk no fill while price runs away. Useful for mean reversion entries after the spike.
- Stop orders, you enter on momentum. You risk bad fills during the trigger. Use smaller size and wider invalidation.
- OCO orders, one-cancels-the-other bracket for breakout plans. It helps automation, but both sides can trigger in a whipsaw if your broker processes orders with delay.
If you trade the first minute, prefer rules that assume slippage. If you trade post-news, prefer limits and confirmed structure.
Managing open trades into events
Decide before the calendar hits. Do not improvise in the last minute.
- Hold if your trade already has room, your thesis matches the event risk, and you accept a worse fill on stops.
- Reduce if your trade sits near entry or your stop is tight versus expected spike range. Cut size, keep structure.
- Exit if the event can invalidate your setup, or if the pair tends to gap and whipsaw. Flat is a position.
- Hedge only if you have a defined hedge instrument and rules for removal. Most retail hedges add cost and delay decisions.
Use a simple rule set. Example rules you can adopt.
- Exit or cut size to half within 15 to 30 minutes of red-tier events if unrealized profit is less than 0.5R.
- Move stop to break-even only if structure supports it, not because news is near. Break-even stops get clipped by spread.
- Do not add to a position inside the event window. Add only after the first reaction forms a clear high or low.
If the release is a rate decision or inflation print, expect follow-through and repricing. Keep that in mind when you trade USD pairs, especially USDJPY. Link it to your macro view using what moves USD/JPY.
Broker and platform considerations
Your broker matters more during news than during calm sessions.
- Execution quality, check average slippage and rejected orders during major releases. Track it in your journal.
- Requotes and rejects, some brokers reject fast fills or requote. That breaks breakout systems.
- Trading halts and “close only” mode, platforms may limit order placement around extreme volatility. Plan for the inability to adjust.
- Stop handling, confirm how stops execute, server-side vs platform-side. Internet lag can block changes, server-side orders still work.
- Data feed and spreads, two brokers can show different spike extremes. Your backtest must match your live feed.
Test your setup on a demo during high-impact releases. Compare intended entry, actual fill, and worst spread. If the numbers break your risk model, change your approach or skip the event.
How to Customize Your Economic Calendar for Faster Decision-Making
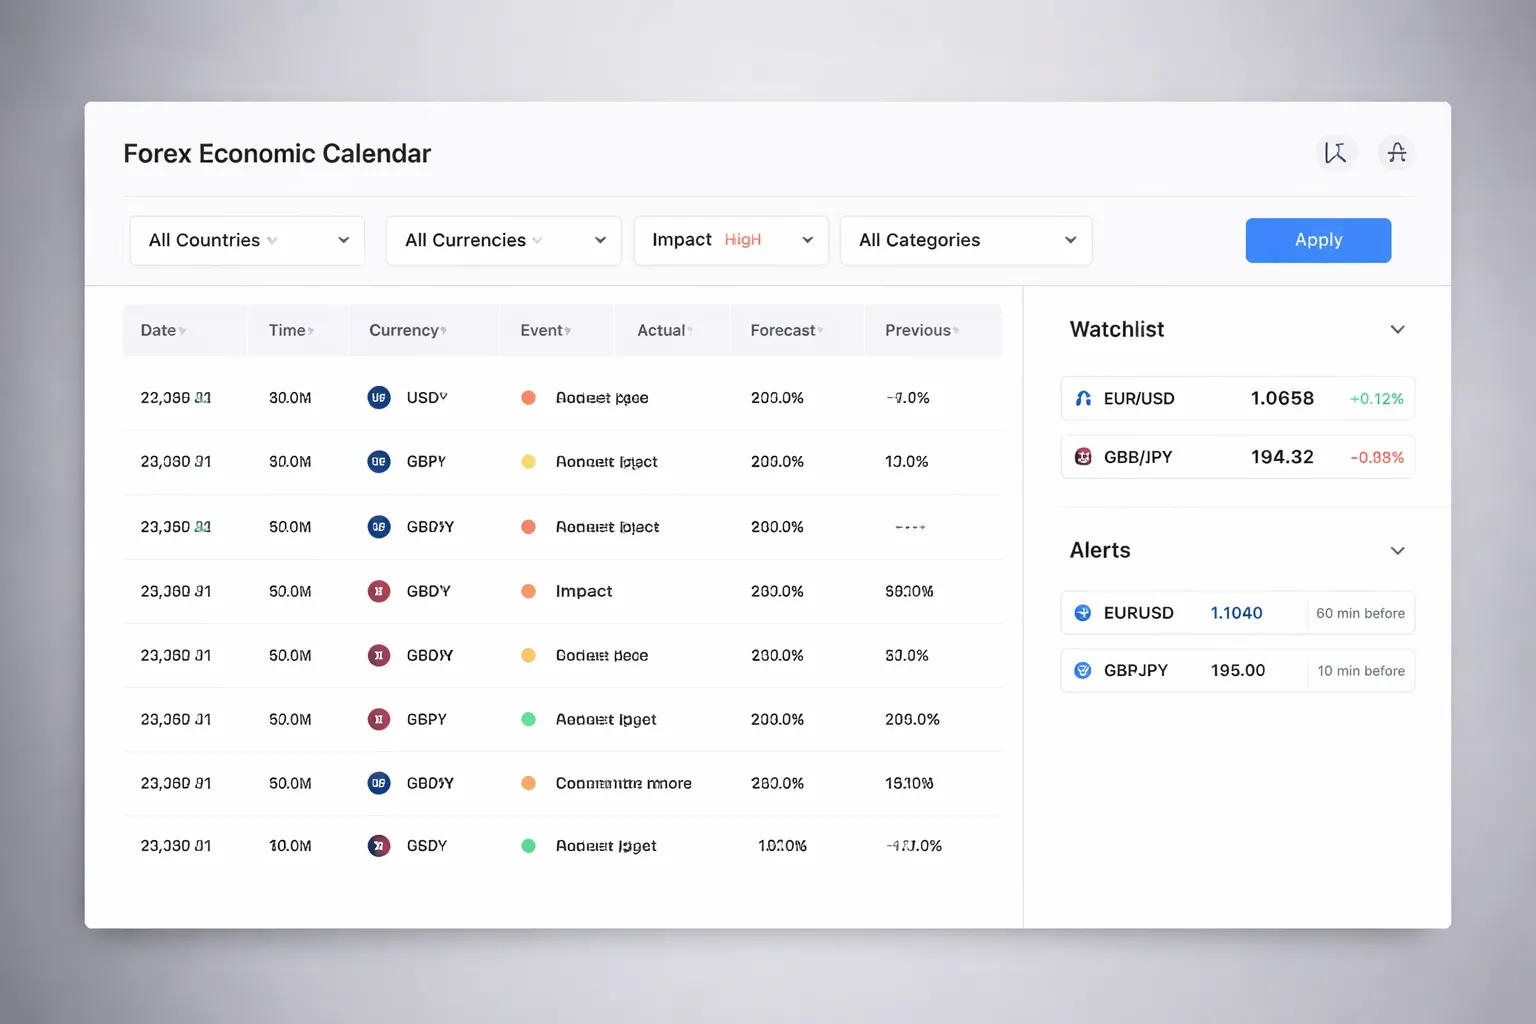
Setting Filters by Country, Currency, Impact, and Category
Start with your traded currencies. Hide everything else.
- Country and currency: Select only the countries tied to your pairs. Example, US, Eurozone, UK, Japan, Canada, Australia, New Zealand, Switzerland.
- Impact level: Keep high impact for execution days. Add medium impact for planning days. Turn off low impact unless you trade very short term.
- Indicator category: Focus on what moves FX most for your style. Rates, inflation, labor, growth, and central bank events.
- Time zone: Match your calendar to your platform time. One hour off breaks your plan.
Use one saved preset for each mode. Planning, trading, and risk-off.
Create Watchlists by Pair and Align Them to Sessions
Build views around pairs, not around countries.
- EURUSD view: Show US and Eurozone events only. Include ECB speakers and Fed speakers.
- GBPJPY view: Show UK and Japan events. Add any major US risk events if you trade it as a risk pair.
- Session alignment: Create presets for Asia, London, and New York. Show only events inside your trading window.
- Cut noise: Hide events that print outside your window. You can review them later in a recap view.
This setup cuts scroll time. It also reduces missed releases.
Alerts and Notifications: Lead Time and Alert Fatigue
Alerts must support execution. Too many alerts train you to ignore them.
- Use two lead times: 60 minutes for planning, 10 minutes for execution checks.
- Alert only high impact: Add medium impact only for the currencies you hold.
- Set a quiet window: No alerts outside your trading hours. You still see the events in the calendar.
- One alert per event: Disable follow-up alerts unless you trade the release itself.
Pair alerts with a checklist. Check spreads, margin, open orders, and your no-trade rules.
Use Historical Data Views to Contextualize Today’s Release
Today’s number matters less than the surprise versus expectations.
- Track the three core fields: actual, forecast, previous. Add revisions if the calendar shows them.
- Compare to recent prints: Use a 6 to 12 month view to see range and trend.
- Note regime changes: A 0.2 miss in CPI can matter more during a hiking cycle than during a pause.
- Map typical volatility: Mark how price behaved on the last few releases. Identify average spike, spread widening, and time to stabilize.
If you trade inflation releases, read the details in how inflation data moves currency markets.
Choose Reliable Calendar Sources: Consistency, Speed, Transparency
Your calendar is a data tool. Treat it like a price feed.
- Consistency: Use the same source every day. Mixing sources can shift times, labels, and impact ratings.
- Update speed: Check how fast actuals post during live releases. Slow updates lead to late decisions.
- Transparency: Prefer calendars that show source links, revision flags, and clear time zone rules.
- Coverage: Ensure it includes central bank speakers, rate decisions, and key surveys, not just scheduled data.
- Downtime plan: Keep a backup source bookmarked. Use it only when your primary fails.
Once you lock your filters, watchlists, and alerts, you react faster. You also trade fewer low-quality setups.
Common Mistakes When Using the Forex Economic Calendar (and Fixes)
Trading the Headline Without the Context: Guidance, Components, and Revisions
You lose money when you trade the first number and ignore what drives it.
- Fix: Check the full release. Look for prior, forecast, actual, and revision flags.
- Fix: Read the components that markets price most. For CPI, focus on core, services, and shelter. For jobs, watch average hourly earnings and participation, not just payrolls.
- Fix: Compare the result to market positioning. A small beat can still sell off if traders already priced it in.
- Fix: Treat guidance as the real event on central bank days. Rate decisions matter, but the statement, dots, and press conference often move the pair more.
- Fix: Log “first print” and “final read.” Some releases reshape the trend after revisions. Your calendar should show revision history or links to the source.
If you trade inflation events, keep your framework tight. Use this guide on how CPI moves currency markets to map which parts matter most.
Ignoring Correlations and Cross-Market Signals (DXY, Yields, Equities, Commodities)
FX reacts to rates and risk. Your calendar does not show that. You must.
- Mistake: You buy EUR/USD on a “USD miss” while US 2-year yields spike.
- Fix: Check US 2-year and 10-year yields before and after the release. Higher yields often support USD, even on mixed data.
- Mistake: You short USD/JPY on weak data while equities rally and real yields rise.
- Fix: Track risk tone. Equities up plus yields up often supports USD/JPY.
- Mistake: You trade AUD, CAD, or NOK from local data and ignore commodities.
- Fix: Confirm with the main driver. AUD with iron ore and China risk, CAD with oil, NOK with oil and European growth.
- Mistake: You trade USD pairs without watching DXY.
- Fix: Use DXY as a regime check. If DXY trends hard, single-pair signals fail more often.
Overtrading High-Impact Days: Set a Max-Trades and Max-Loss Rule
High-impact days create more signals. Most are noise.
- Fix: Set a hard cap. Example: max 2 trades per session, max 3 trades per day.
- Fix: Set a daily loss limit. Example: stop for the day at 1R to 2R drawdown, or 0.5% to 1% of account equity.
- Fix: Use an “A-setup only” rule around red events. If spread widens or candles print long wicks, you skip.
- Fix: Separate event trades from trend trades. If you miss the first move, wait for the post-news structure, not a late chase entry.
| Rule | Default | When to tighten |
|---|---|---|
| Max trades | 2 per session | NFP, CPI, FOMC, ECB, BoE days |
| Max daily loss | 1R to 2R | When spread or slippage increases |
| Cooldown | 15 to 30 minutes after a loss | After a news spike or stop run |
Misreading Time Zones and Embargo Times: Avoid Preventable Errors
Most calendar mistakes come from the clock.
- Mistake: You trade at the wrong time because your calendar shows local time, but your platform uses server time.
- Fix: Set one “truth clock.” Use UTC on your calendar and write the broker server offset on your plan.
- Mistake: You forget DST changes.
- Fix: Recheck time settings on DST weeks. Keep a reminder for US and UK DST shifts.
- Mistake: You place orders during an embargo window.
- Fix: Respect the freeze. Many brokers widen spreads before major releases. Do not modify stops and limits in the last 30 to 120 seconds before the number.
- Mistake: You ignore unscheduled risk.
- Fix: Flag “floating” events. Central bank speakers, geopolitical headlines, and surprise statements can hit outside the calendar.
Assuming “High Impact” Means One-Directional Moves: Whipsaws and Liquidity Gaps
High impact often means thin liquidity, fast repricing, and two-way spikes.
- Mistake: You market buy the breakout and get filled at the top of a wick.
- Fix: Wait for the first reaction to finish. Trade the second move, after spreads normalize and structure forms.
- Mistake: You set tight stops based on normal volatility.
- Fix: Size down or widen stops to event volatility. If you cannot size down, you skip the trade.
- Mistake: You ignore liquidity gaps.
- Fix: Avoid new entries in the first seconds after release. Use limit orders only if you accept non-fills and partial fills.
- Mistake: You treat a “beat” as bullish without checking the market’s focus.
- Fix: Identify the driver before the event. If inflation dominates, jobs may matter less. If recession fear dominates, “good news” can still sell risk assets.
Example Walkthrough: Planning a Trade Using the Calendar
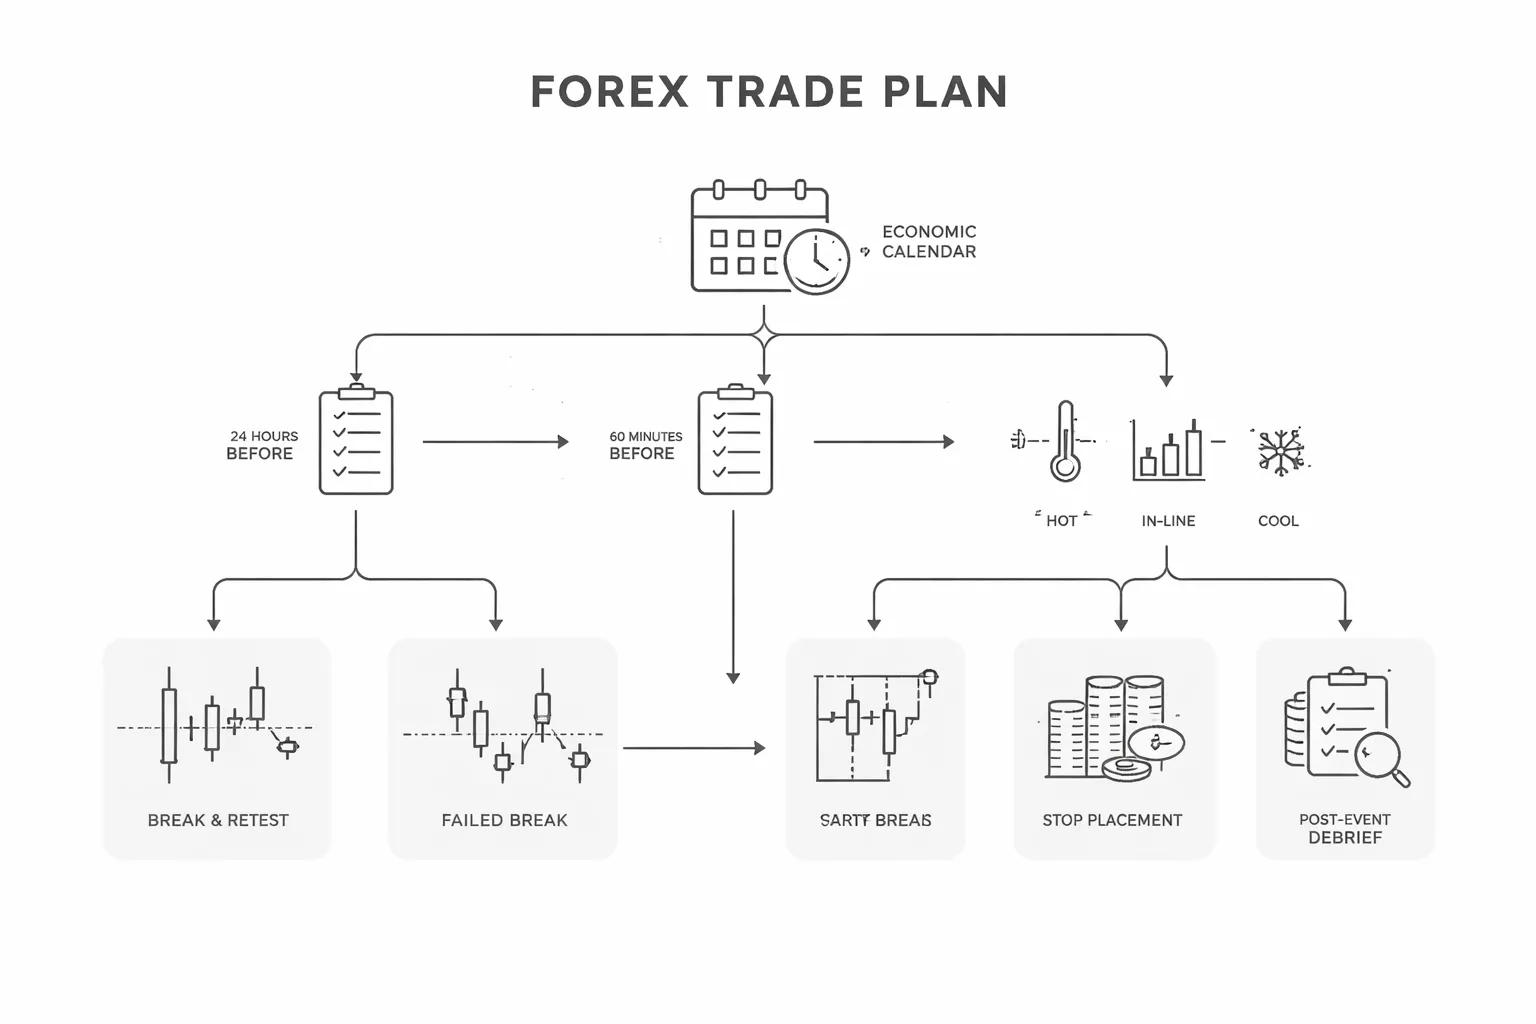
Pre-event checklist
Example event: US CPI release. Pair: EUR/USD. You plan the trade 24 hours before, then tighten the plan 60 minutes before.
24 hours before:
- Mark the release time in your calendar. Confirm your broker server time vs the calendar time.
- Check what the market cares about. If rates drive FX this week, CPI matters more than second-tier data.
- Read the consensus and the prior. Separate headline CPI, core CPI, and any sub-metric the market fixates on.
- Check the next major risk. If an FOMC event sits close, CPI reactions can fade fast. Use this FOMC volatility guide to set expectations.
- Map nearby liquidity. Identify the prior day high, prior day low, Asia range, and the current week high and low.
- Set rules for no-trade conditions. Example, skip if price sits mid-range with no clean levels, or if spreads stay wide before the release.
60 minutes before:
- Check where price sits vs your levels. If EUR/USD sits 10 to 20 pips below the prior day high, you may get a stop run into the number.
- Watch spreads and depth. If spreads widen early, reduce size or stand down.
- Confirm the exact data points and release format. Some releases include revisions that can flip the move.
- Pick your execution method. Decide now, do not improvise in the spike.
- Set alerts at the key levels. You want triggers, not screen-staring.
Scenario mapping
You need three outcomes. You need levels. You need confirmation.
| Scenario | Data outcome | Expected EUR/USD bias | Key levels to watch | Confirmation signals |
|---|---|---|---|---|
| A: Hot inflation | Core CPI above forecast, or headline and core both beat | USD up, EUR/USD down | Prior day low, Asia low, week low | First pullback fails below pre-release price, retest of broken support holds, 1 to 5 minute closes below the level |
| B: In-line | Near forecast, mixed components, small surprise | Chop, fade moves, range trade risk | Prior day high and low, midpoint of Asia range | Fast spike then full retrace, no follow-through after 5 to 10 minutes, spreads normalize |
| C: Cool inflation | Core CPI below forecast, broad softness | USD down, EUR/USD up | Prior day high, London high, week high | Break and hold above resistance, pullback holds above the level, higher low forms after the first impulse |
Level rule: you trade reactions at levels, not the print itself. The number creates speed. The level gives structure.
Execution and management
Entry triggers:
- Break and retest: Let the first impulse break a level. Wait for price to retest that level. Enter only if the retest holds.
- Failed break: If price spikes through a level and snaps back, enter in the direction of the snap once price reclaims the level and holds for 1 to 3 candles on your execution timeframe.
- Time filter: Avoid new entries in the first seconds after release. Give the market time to print a clean swing.
Stop placement:
- Place the stop beyond the swing that invalidates your thesis. For a short after a break and retest, the invalidation sits above the retest high, not one or two pips above entry.
- Size your trade off the stop distance. Keep risk fixed. Let position size change.
- Account for spread widening. If spreads expand by 2 to 5 pips around the release, add that buffer to your stop logic or reduce size.
Partial exits and trade management:
- Take a first partial at the next major level. Example, prior day low on a short, prior day high on a long.
- Move the stop only after price clears a level and holds. Do not move it to break-even in the noise.
- Hold the runner only if follow-through continues. If momentum dies and price returns to pre-release range, exit the rest.
- Set a time stop. If nothing develops after 15 to 30 minutes, close or reduce. News trades need speed.
Post-event debrief template
Log the trade the same day. Keep it short. Keep it factual.
- Event: CPI, country, timestamp, session.
- Market focus: inflation, growth, risk sentiment, central bank pricing.
- Forecast, actual, revisions: headline and core. Note any revision that mattered.
- Pre-plan: your three scenarios, your key levels, your no-trade rules.
- Execution: entry type, entry time, fills, spread at entry, slippage.
- Risk: stop distance, position size, dollar risk, R multiple at exit.
- Management: partials taken, stop moves, time stop used.
- Outcome: result in pips and R. Note if the trade followed the plan.
- What you missed: level you ignored, revision you missed, driver you misread.
- One fix: one rule change for the next similar event.
Pros, Cons, and When an Economic Calendar Isn’t Enough
Benefits: structure, preparedness, and better volatility awareness
- Structure: You know what matters today. You rank events by impact, currency, and session. You plan around them.
- Preparedness: You set scenarios before the release. You define levels, invalidation, and risk. You decide if you will trade the first spike or wait.
- Volatility awareness: You stop treating a random candle as a signal. You expect spread widening, slippage, and faster moves near the timestamp.
Limitations: unscheduled news, data revisions, and narrative-driven markets
- Unscheduled news: Headlines hit without a timestamp. Central bank leaks, geopolitics, surprise comments, and risk shocks can move price harder than scheduled data.
- Data revisions: Markets trade the revision, not the headline. A “beat” with a downward revision can still sell off. You must track prior and revision details, not just actual versus forecast.
- Narrative-driven markets: Price often follows the macro story. If the market cares about inflation persistence or growth scares, a single print may not change the trend. You need context on the dominant driver for your pair. Use a driver map like what moves EUR/USD to stay aligned with what the market is pricing.
When to stand aside: low liquidity, conflicting events, and unclear market pricing
- Low liquidity: You skip thin conditions. Holidays, late Friday, rollover, and pre-session hours can turn a clean release into noisy spikes and poor fills.
- Conflicting events: You avoid stacked releases that point in different directions. Example, strong jobs with weak wages, or inflation beat with dovish central bank guidance minutes later.
- Unclear market pricing: You stand down when you cannot state what the market expects and why. Watch for mixed positioning signals, indecisive trend, and choppy ranges ahead of the event.
What to pair with the calendar: technical levels, sentiment/positioning, and volatility tools
- Technical levels: Mark daily and weekly highs and lows, prior event spike levels, and obvious support and resistance. Use them for entry triggers and invalidation, not for predictions.
- Sentiment and positioning: Check if traders already lean one way. Crowded positioning can flip reactions. A good number can still trigger a sell-off if the trade got crowded.
- Volatility tools: Use ATR for realistic stop size, implied volatility for expected range when available, and a simple event range plan. Define a max spread, max slippage, and a time stop for post-release chop.
FAQ
What do “actual,” “forecast,” and “previous” mean?
Actual is the released number. Forecast is the consensus estimate. Previous is the last reported value, sometimes revised. Price often reacts to the gap between actual and forecast, plus any revision to previous.
Which events matter most for forex?
Focus on central bank decisions and guidance, inflation prints, and top-tier labor data. These shift rate expectations. For USD pairs, watch FOMC, CPI, and Non-Farm Payrolls first, then PMIs and retail sales.
How do I filter the calendar for my pairs?
Select your currency, then show only high-impact events. Add medium impact if you trade intraday. Hide low-impact data. If you trade EUR/USD, you need EUR and USD releases only, plus key risk events like major central bank speeches.
What time zone should I use?
Set the calendar to your platform or local time and keep it fixed. Check daylight saving changes for US, UK, and EU. A one-hour mismatch breaks your plan and can put you in a position seconds before a release.
How far ahead should I plan around a high-impact release?
Mark the event 24 hours ahead. Define your no-trade window, order rules, and max risk. Recheck 60 minutes before for leaks, revisions risk, and headlines. Tighten exposure 5 to 15 minutes before if you hold positions.
Should I trade the news spike or wait?
If you do not have a tested execution plan, wait. Spreads and slippage jump on release. Many traders trade the second move after the first spike, once spread normalizes and direction confirms with a clear high and low.
How do I set stops and targets using the calendar?
Use ATR for a baseline stop size. Use the event’s typical range if you track it. Set a max spread and max slippage rule. Use a time stop, exit if price chops without follow-through after your planned window.
Why does price drop on “good” data?
Markets price expectations in advance. If positioning gets crowded, traders sell the fact. Revisions can offset the headline. A strong number can still weaken a currency if it lowers future rate expectations or risk sentiment shifts.
What is the safest way to handle FOMC weeks?
Treat the decision, statement, and press conference as one event. Reduce size or stay flat into the release. Plan for a second volatility wave during Q&A. Use a tighter watchlist and clear levels. See how to prepare for FOMC volatility.
How do I manage weekend and holiday risk on the calendar?
Check for holidays that thin liquidity. Expect wider spreads and sharper moves. Avoid holding large positions into weekends when key elections, geopolitics, or emergency meetings loom. Reduce leverage and define a hard stop before market close.
Do low-impact events ever matter?
Yes, when liquidity is thin or when they confirm a bigger narrative. A low-impact release can move price if the market watches one theme, like inflation momentum. It can also trigger stops near key levels.
Conclusion
Conclusion
The calendar is your risk map. Use it to plan entries, exits, and position size before volatility hits.
- Start each week with a scan. Mark high-impact releases for the currencies you trade. Note the exact time and the session.
- Set a baseline. Write down consensus and the prior number. You need both to judge surprise and direction.
- Define a rule for exposure. Decide when you will reduce size, widen stops, or stay flat. Apply the same rule every time.
- Trade the reaction, not the headline. Wait for the first move, then check if price holds or reverses after spreads normalize.
- Track outcomes. Save the event, forecast, actual, and your result. Review monthly and drop setups that do not pay.
Final tip. Tie every event to one driver. Rates, inflation, growth, jobs, or risk sentiment. If you need a framework for rate-driven moves, read how interest rates affect currency pairs.
-
How Interest Rates Affect Currency Pairs (With Real Examples)
7 months ago -
Fundamental Analysis in Forex Explained (What Actually Moves Prices)
7 months ago -
What Moves EUR/USD? The Biggest Drivers You Should Watch
7 months ago -
How to Trade Forex News (NFP, CPI, FOMC) Without Getting Wrecked
7 months ago -
Inflation and Exchange Rates Explained (Why Currencies Rise or Fall)
7 months ago
-
- Step 1, Choose your trading universe: pairs, sessions, and holding period
- Step 2, Filter the week: mark high-impact events and potential conflict days
- Step 3, Build scenarios: stronger or weaker than expected and likely reactions
- Step 4, Check market context: trend, key levels, ATR, and recent volatility regime
- Step 5, Define your plan: entry method, invalidation point, and profit-taking logic
- Step 6, Execute with discipline: timing choices before, at, or after release
- Step 7, Post-event review: document outcomes, slippage, and whether the thesis held
-
- Pre-news positioning, when it works and when it becomes a coin flip
- Breakout approach, key levels plus volatility expansion after the release
- Mean-reversion approach, fading overreactions with confirmation and risk controls
- Event-to-trend strategy, using macro direction to bias swing trades over days or weeks
-
- Trading the Headline Without the Context: Guidance, Components, and Revisions
- Ignoring Correlations and Cross-Market Signals (DXY, Yields, Equities, Commodities)
- Overtrading High-Impact Days: Set a Max-Trades and Max-Loss Rule
- Misreading Time Zones and Embargo Times: Avoid Preventable Errors
- Assuming “High Impact” Means One-Directional Moves: Whipsaws and Liquidity Gaps
-
- Benefits: structure, preparedness, and better volatility awareness
- Limitations: unscheduled news, data revisions, and narrative-driven markets
- When to stand aside: low liquidity, conflicting events, and unclear market pricing
- What to pair with the calendar: technical levels, sentiment/positioning, and volatility tools
-
- What do “actual,” “forecast,” and “previous” mean?
- Which events matter most for forex?
- How do I filter the calendar for my pairs?
- What time zone should I use?
- How far ahead should I plan around a high-impact release?
- Should I trade the news spike or wait?
- How do I set stops and targets using the calendar?
- Why does price drop on “good” data?
- What is the safest way to handle FOMC weeks?
- How do I manage weekend and holiday risk on the calendar?
- Do low-impact events ever matter?
-
- Step 1, Choose your trading universe: pairs, sessions, and holding period
- Step 2, Filter the week: mark high-impact events and potential conflict days
- Step 3, Build scenarios: stronger or weaker than expected and likely reactions
- Step 4, Check market context: trend, key levels, ATR, and recent volatility regime
- Step 5, Define your plan: entry method, invalidation point, and profit-taking logic
- Step 6, Execute with discipline: timing choices before, at, or after release
- Step 7, Post-event review: document outcomes, slippage, and whether the thesis held
-
- Pre-news positioning, when it works and when it becomes a coin flip
- Breakout approach, key levels plus volatility expansion after the release
- Mean-reversion approach, fading overreactions with confirmation and risk controls
- Event-to-trend strategy, using macro direction to bias swing trades over days or weeks
-
- Trading the Headline Without the Context: Guidance, Components, and Revisions
- Ignoring Correlations and Cross-Market Signals (DXY, Yields, Equities, Commodities)
- Overtrading High-Impact Days: Set a Max-Trades and Max-Loss Rule
- Misreading Time Zones and Embargo Times: Avoid Preventable Errors
- Assuming “High Impact” Means One-Directional Moves: Whipsaws and Liquidity Gaps
-
- Benefits: structure, preparedness, and better volatility awareness
- Limitations: unscheduled news, data revisions, and narrative-driven markets
- When to stand aside: low liquidity, conflicting events, and unclear market pricing
- What to pair with the calendar: technical levels, sentiment/positioning, and volatility tools
-
- What do “actual,” “forecast,” and “previous” mean?
- Which events matter most for forex?
- How do I filter the calendar for my pairs?
- What time zone should I use?
- How far ahead should I plan around a high-impact release?
- Should I trade the news spike or wait?
- How do I set stops and targets using the calendar?
- Why does price drop on “good” data?
- What is the safest way to handle FOMC weeks?
- How do I manage weekend and holiday risk on the calendar?
- Do low-impact events ever matter?
-
How to Place a Forex Trade Step by Step (Your First Trade Explained)
4 months ago -
Forex Trading vs Crypto Trading: Which Market Is Better for Beginners?
4 months ago -
Forex Lot Size Calculator: How to Use It to Size Trades Correctly
6 months ago -
How to Calculate Position Size in Forex (Position Sizing Formula + Examples)
6 months ago -
Forex Leverage Explained: How It Works, Pros, Cons & Examples
6 months ago
-
Forex Trading Platforms Comparison: MetaTrader vs cTrader vs TradingView
7 months ago -
Stop Loss vs Take Profit: Differences, Examples & Best Practices
7 months ago -
Is Forex Trading Legal in the United States? Rules, Regulators & What to Know
6 months ago -
Forex Market Hours & Trading Sessions Explained (Best Times to Trade)
6 months ago -
Forex Leverage Explained: How It Works, Pros, Cons & Examples
6 months ago