What Moves USD/JPY? Rates, BoJ Policy, Yields and Risk-On/Risk-Off Explained

USD/JPY moves when the gap between U.S. and Japan interest rates changes. It also moves when the Bank of Japan shifts policy, when bond yields reprice, and when markets flip between risk-on and risk-off.
This guide breaks the pair into four drivers you can track in real time. You will learn how Fed expectations feed into U.S. Treasury yields, how BoJ decisions shape Japanese yields, and how yield spreads map to USD/JPY direction. You will also learn why carry trades push the pair higher in calm markets, and why stress can trigger fast yen buying. You will leave with a short checklist of data points to watch, and what each one tends to do to USD/JPY. For a broader framework, see fundamental analysis in forex.
Key Takeaways
- In het kort:
- USD/JPY tracks the U.S. Japan rate gap. Wider gap tends to push USD/JPY up. Narrower gap tends to pull it down.
- U.S. Treasury yields, especially the 2-year and 10-year, often lead the move. Higher yields tend to lift USD/JPY.
- BoJ policy sets the ceiling and floor for Japanese yields. Any shift toward tighter policy can strengthen JPY fast.
- Risk-on supports carry trades and can lift USD/JPY. Risk-off can trigger rapid yen buying and sharp drops.
- Watch the data that moves rates first. Price levels matter less than the change in the path for Fed and BoJ.
- Your USD/JPY checklist:
- U.S. 2-year yield: Best quick read on Fed pricing. Up tends to push USD/JPY up.
- U.S. 10-year yield: Drives broader dollar demand. Up often supports USD/JPY, especially in calm markets.
- Japan 10-year yield and BoJ operations: Higher JGB yields tend to support JPY and cap USD/JPY.
- Fed signals: Dot plot, pressers, and inflation focus. More hawkish pricing tends to lift USD/JPY.
- BoJ signals: Policy rate guidance, bond buying, and any tightening bias. Hawkish surprises tend to drop USD/JPY.
- U.S. inflation and jobs: CPI, PCE, NFP, wages. Hot prints tend to lift yields and USD/JPY.
- Japan inflation and wages: CPI, shunto wage outcomes, services inflation. Stronger trends raise BoJ tightening odds and support JPY.
- Risk gauges: S&P 500, VIX, credit spreads. Risk-off tends to strengthen JPY and pressure USD/JPY.
- Carry conditions: Stable volatility plus wide yield spread tends to keep USD/JPY bid.
If you trade event risk, use the forex economic calendar and focus on releases that can reprice the next Fed or BoJ step.
USD/JPY in one sentence: what it measures and why it moves
USD/JPY in one sentence
USD/JPY is the price of one U.S. dollar in Japanese yen, and it moves when U.S. money gets more or less expensive than Japanese money, and when investors want more or less safety.
What USD/JPY represents for traders, businesses, and policymakers
- Traders: a fast read on rate differentials, global risk appetite, and carry. Wide spreads and calm markets tend to lift USD/JPY. Narrow spreads and stress tend to lift JPY and push USD/JPY down.
- Businesses: a direct driver of import and export pricing. A higher USD/JPY raises Japan’s import costs, especially energy. A lower USD/JPY cuts import costs but can squeeze exporter revenue in yen terms.
- Policymakers: a channel into inflation and financial conditions. A weaker JPY can raise imported inflation and political pressure. A stronger JPY can cool inflation but hit growth via exports and risk sentiment.
Why this pair is especially sensitive to yields and global risk sentiment
- Yield gap matters more here: Japan has run low rates for decades, so changes in U.S. Treasury yields, especially 2-year and 10-year, can reprice the spread fast. USD/JPY often tracks that repricing.
- BoJ policy amplifies moves: tweaks to policy guidance, bond buying, or tolerance for higher JGB yields change how “anchored” Japan rates look. That shifts the carry trade math quickly.
- JPY acts as a funding currency: when volatility rises, leveraged positions unwind. That tends to create JPY buying and pushes USD/JPY lower, even if U.S. data stays firm.
- Risk-on and risk-off flows are large: equities down, VIX up, and wider credit spreads often bring repatriation and hedging flows into JPY.
A simple mental model: relative price of money plus relative safety demand
| Driver | What to watch | Typical USD/JPY effect |
|---|---|---|
| Relative price of money | U.S. 2-year yield, 10-year yield, Fed pricing, JGB yields, BoJ guidance | Wider U.S. yield advantage, USD/JPY up. Smaller advantage, USD/JPY down. |
| Relative safety demand | S&P 500 trend, VIX, credit spreads, liquidity stress signals | Risk-off, JPY up, USD/JPY down. Risk-on, JPY weakens, USD/JPY up. |
If you need a repeatable workflow, use an economic calendar for forex and anchor your USD/JPY plan around releases that shift Fed pricing, BoJ tightening odds, and volatility.
The core driver: U.S.–Japan rate differentials and FX hedging costs
How short-end rates transmit into spot FX
USD/JPY tracks the price of holding dollars versus holding yen. The quickest signal sits at the front end of the curve.
Watch the spread between U.S. policy expectations and Japan policy expectations. In practice, you proxy it with Fed funds futures and OIS versus Japan OIS, plus the BoJ policy rate and guidance.
When the market prices a higher Fed path, front-end U.S. yields rise. Holding USD assets pays more. Demand for USD increases. USD/JPY tends to rise.
When the market prices BoJ tightening or less easing, JPY funding gets less cheap. The yen strengthens. USD/JPY tends to fall.
- Fed hawkish repricing, higher front-end U.S. yields, USD/JPY up.
- BoJ hawkish repricing, higher Japan front-end yields, USD/JPY down.
- Volatility spikes, funding trades unwind, JPY strengthens even if the spread stays wide.
Why 2-year yields often beat 10-year yields for daily moves
Daily USD/JPY moves usually follow changes in policy expectations, not long-run growth views.
The 2-year yield reacts first to CPI surprises, payrolls, Fed speakers, and BoJ signals. The 10-year yield mixes in term premium and long-horizon inflation risk, which can move for reasons that do not matter for near-term carry.
Use this setup:
- Track U.S. 2-year and Japan 2-year yields, then watch the spread change after data.
- Confirm with Fed funds futures and OIS moves around meeting dates.
- Use the 10-year more for regime context, like a broad bond selloff or a flight to duration.
FX hedging basis and cross-currency swaps: when hedged returns flip flows
Many real-money investors hedge FX risk. Your spot view can fail if hedging costs change faster than yields.
A Japanese investor buying U.S. bonds often sells USD forward against JPY. The forward points reflect the rate differential, but the cross-currency basis can add or subtract cost. When USD funding stress rises, hedging dollars can get more expensive.
Practical impact:
- If hedged U.S. yields fall below JGB yields, Japanese demand for U.S. bonds can slow. That can reduce USD demand and cap USD/JPY.
- If hedged returns improve, Japanese buying of U.S. credit and Treasuries can increase. That can support USD/JPY.
What to watch:
- JPY cross-currency basis, especially 3-month and 1-year tenors.
- USD/JPY forward points and implied carry.
- Japanese life insurer flow headlines and MOF flow data as confirmation.
Carry trade mechanics: why high differentials can reinforce trends
A wide U.S. minus Japan rate spread creates carry. Carry attracts trend-following and yield-seeking flows.
Mechanics you should know:
- Traders borrow in JPY or sell JPY forward, then buy USD assets.
- As USD/JPY rises, mark-to-market gains attract more participation.
- As long as volatility stays low, carry looks stable and the trade scales.
This creates a feedback loop. Higher spreads plus low volatility often push USD/JPY higher for longer than you expect.
When the differential fails: positioning, liquidity, and already priced outcomes
Rate spreads matter, but your timing can still break if the market already holds the trade.
- Crowded positioning. If specs already sit long USD/JPY, even hawkish Fed news can trigger profit-taking.
- Liquidity gaps. Thin Tokyo or post-fix conditions can amplify stops and create moves that ignore the yield story for hours.
- Event risk premium. Ahead of FOMC, CPI, or BoJ meetings, traders reduce exposure. Spot can drift against the spread.
- Already priced. If Fed cuts or hikes sit fully priced in futures, the release must beat the implied path to move USD/JPY.
Build a simple checklist before you trade: change in the 2-year spread, change in hedging costs, implied path in futures, and positioning. If all four point the same way, the differential tends to lead.
Federal Reserve policy and U.S. data: the USD leg of the equation
Key U.S. releases that reliably move USD/JPY
USD/JPY reacts first to U.S. rates. Rates react first to U.S. data. Your job is to map each release to the part of the curve it hits and the Fed path it implies.
- CPI. The cleanest driver of real yields and the expected Fed path. Watch core CPI month-on-month, core services ex housing, and the 3-month annualized run rate. A hot print usually lifts front-end yields and pushes USD/JPY higher. A soft print does the opposite. Use this CPI guide if you want the trading mechanics.
- NFP. A rates and risk release in one. Focus on average hourly earnings, unemployment rate, and revisions. Payrolls alone can mislead. Strong wages tend to lift yields and USD/JPY. A weak report can hit yields, then spark risk-off, which can strengthen JPY and drop USD/JPY.
- ISM. Fast signal for growth momentum. ISM prices paid and services employment can move yields even when the headline misses. A rising prices paid reading can reprice inflation risk and support USD/JPY.
- Retail sales. Direct read on demand. The control group matters most because it feeds GDP tracking. Strong control can push yields up. Weak control can pull yields down, especially if markets already lean toward cuts.
How to read FOMC messaging
USD/JPY does not trade the decision, it trades the gap between what you expected and what the Fed signals next.
- Statement. Scan for changes to inflation language, labor market balance, and the risk assessment. A single line can shift the market from “higher for longer” to “patient” or back.
- Dots. Treat them as a distribution, not a promise. Watch the median for the next year, then count how many dots move. A small shift in the median with a big shift in dispersion still matters because it changes uncertainty premia in rates.
- SEP. Use it to connect dots to the Fed’s base case. Higher inflation forecasts with unchanged dots signals tolerance. Higher unemployment forecasts with lower growth often supports a more dovish path.
- Press conference. This is where the reaction function shows. Listen for pushback on easing, confidence on disinflation, and whether financial conditions matter. If the chair leans against market pricing, USD/JPY can move even without a rate change.
- Minutes. They matter when the meeting looked “clean.” Minutes can reveal how many wanted hikes, cuts, or a slower pace. They can also change the balance between inflation and growth risks.
Real yields vs nominal yields
USD/JPY often tracks nominal yield spreads. But the strongest moves can come when real yields change.
- Nominal yields move on growth and supply. They can lift USD/JPY even if inflation expectations rise at the same time.
- Real yields move on inflation surprises and Fed credibility. Higher real yields usually support the dollar because they raise the inflation-adjusted return on USD assets.
- Breakevens can flip the signal. If nominal yields rise because breakevens rise, the dollar response can fade. If nominal yields rise because real yields rise, USD/JPY tends to follow through.
| Move | What it often means | Typical USD/JPY bias |
|---|---|---|
| Nominals up, real up | Tighter expected policy, higher real return | Up |
| Nominals up, breakevens up | Inflation premium, less real tightening | Mixed |
| Nominals down, real down | Easier expected policy, lower real return | Down |
| Nominals down, breakevens down | Disinflation scare, growth risk | Down, with risk-off spikes possible |
Soft vs hard data, and why surprise indices move FX
Markets trade change. Surprise indices measure change versus expectations. USD/JPY responds because surprises reprice the Fed path and the front end of the curve.
- Soft data includes surveys like ISM, consumer confidence, and regional Fed prints. They turn first. They can move USD/JPY fast, but they can also mean-revert if hard data does not confirm.
- Hard data includes CPI, payrolls, retail sales, and PCE. They anchor the policy path. They usually produce cleaner follow-through.
- Nowcasting matters. If GDP trackers and inflation nowcasts lean hot, a “small beat” can still move markets because it confirms the trend. If nowcasts lean soft, the same print can land as noise.
- Trade the delta versus consensus. Don’t trade the level. Trade the surprise, then check if rates markets agree within minutes.
U.S. fiscal headlines and Treasury supply
Fiscal news hits USD/JPY through yields. The channel is supply, term premium, and auction outcomes.
- Refunding announcements can move the long end. More duration supply can push term premium higher and lift USD/JPY if Japan yields stay pinned.
- Auction tails and bid-to-cover matter. Weak demand can lift yields quickly. Strong demand can cap yields even with hot data.
- Debt ceiling and shutdown risk can create two-way moves. Risk-off can support JPY, but higher bill yields and front-end stress can support USD. Watch which force dominates in rates first.
- Fed balance sheet policy interacts with supply. Faster QT can tighten liquidity and pressure risk assets, which can strengthen JPY and pull USD/JPY lower even if yields hold up.
Bank of Japan policy: yield control, normalization, and communication shocks
From YCC to normalization, why small tweaks can create big FX moves
BoJ policy matters because Japan sits at the low end of global yields. Small BoJ changes can shift the whole JGB curve. That changes hedging costs, carry trades, and repatriation flows. USD/JPY can move fast when the market reprices Japan’s rate path.
Yield Curve Control, YCC, anchored long-end yields for years. When the BoJ widened the trading band or softened the “cap,” the signal mattered more than the basis points. Traders read it as permission for yields to rise. JPY often strengthened because the expected Japan U.S. rate gap narrowed.
Normalization usually comes in steps. First, less control of long yields. Then, reduced bond buying. Then, a policy rate move. Each step forces investors to reprice the terminal rate and the speed. Your edge comes from spotting which step the BoJ is trying to take, and whether the market already priced it.
BoJ tools that affect JPY: policy rate, bond buying, lending facilities, guidance
- Policy rate. A move out of negative rates, or a hike cycle, directly lifts front-end JPY yields. USD/JPY tends to fall when Japan front-end yields rise faster than U.S. front-end yields.
- JGB purchases and YCC operations. Fixed-rate purchase operations, scheduled buying, and changes to purchase amounts move the long end. Watch the 10-year and 30-year JGB yield reaction, then check if USD/JPY follows the rate spread move.
- Balance sheet intent. Signals about reinvestment, pace of buying, or tolerance for higher yields change term premia. Term premia shifts can move USD/JPY even if the policy rate stays put.
- Lending facilities. Funding programs can ease stress and keep Japanese rates low. That can weaken JPY by supporting carry conditions.
- Forward guidance. The BoJ often moves markets with language. “Patient,” “nimble,” “sustainable,” and “wage driven” matter. Guidance can reprice the next 6 to 18 months faster than any operation.
Inflation and wages: why Shunto drives BoJ expectations
The BoJ wants “sustainable” inflation. In practice, it watches wages. Shunto, the spring wage negotiations, acts as a focal point for that wage outlook.
Track three items.
- Headline CPI versus core measures. Markets react more when inflation breadth improves, not when one category spikes.
- Shunto outcomes. Strong base pay gains support the case that inflation can persist without temporary shocks.
- Services inflation. Services tend to link to wages. If services inflation stays firm, the market prices a higher probability of tightening.
If Shunto prints strong and services inflation holds, the market usually pulls forward BoJ hikes. That tends to support JPY and push USD/JPY lower, especially when U.S. yields stop rising.
BoJ reaction function: what would make the BoJ tighten or pause
You should map what the BoJ needs to see, then compare it to what data delivers.
- Tighten signals. Rising wage growth, firm services inflation, reduced downside growth risk, and less need to shield the JGB market from volatility. The BoJ also tightens faster when JPY weakness starts to feed domestic inflation expectations.
- Pause signals. Weak consumption, falling real wages, soft services inflation, global slowdown risk, or unstable JGB market functioning. A sharp risk-off episode can also tilt the BoJ toward caution, even if inflation stays above target.
For USD/JPY, focus on the change in the expected path. A small hike matters less than the message that more hikes can follow. The market trades the sequence.
Communication risk: how ambiguous wording creates volatility in USD/JPY
BoJ meetings can move USD/JPY even without action. Ambiguity forces fast repricing because positioning often leans one way.
- Watch the press conference. USD/JPY often reacts more to Q and A than to the statement.
- Separate “technical” from “signal.” The BoJ may label a YCC tweak as technical. The market may treat it as the start of tightening. That gap creates the move.
- Track the 2-year and 10-year Japan U.S. spreads in real time. If USD/JPY moves without spreads, the move likely comes from risk sentiment or positioning. If spreads lead, the move likely comes from policy repricing.
- Look for wording shifts. Changes around “sustainable inflation,” “wage price cycle,” and “market functioning” often precede action. Traders trade the words first.
Plan for two-way risk on BoJ days. Use levels tied to rates. If Japan yields jump and the BoJ sounds less dovish, respect the JPY bid. If yields fade after the press conference, USD/JPY can snap back hard. If you need a broader framework for rate driven FX moves, read what moves USD/JPY.
Bond yields that matter: which maturities to watch and how to read them
A practical yield dashboard, UST 2Y and 10Y vs JGB 2Y and 10Y
USD/JPY trades the rate gap. Build a small dashboard and check it first.
- UST 2Y. This is your Fed pricing gauge. It reacts fast to CPI, NFP, and Fed speak. It often leads USD/JPY on data days.
- UST 10Y. This is your long rate and term premium gauge. It matters most when the market trades growth, deficits, or supply. It can drive broader USD demand and risk tone.
- JGB 2Y. This tracks near term BoJ expectations, but it moves less because policy stays anchored. It still matters on BoJ days and inflation trend shifts.
- JGB 10Y. This is the BoJ pressure point. Watch it around YCC changes, bond buying operations, and language on market functioning. When it breaks higher and holds, JPY tends to strengthen.
Read them as spreads. Track UST 2Y minus JGB 2Y for front end policy divergence. Track UST 10Y minus JGB 10Y for broader yield carry and long run rate differences.
| What you watch | What it tells you | Typical USD/JPY bias |
|---|---|---|
| UST 2Y - JGB 2Y widening | Fed stays tighter than BoJ | Upward pressure |
| UST 2Y - JGB 2Y narrowing | Fed cuts priced in, BoJ tightens priced in, or both | Downward pressure |
| JGB 10Y breakout higher | BoJ tolerance for higher yields, less dovish stance | JPY bid, USD/JPY down |
| UST 10Y surge with steady 2Y | Term premium up, long end repricing | Often USD/JPY up, but watch risk tone |
Curve shape and recession odds, why an inverted U.S. curve can change USD/JPY behavior
When the U.S. curve inverts, the market expects slower growth and future cuts. That changes how USD/JPY reacts to yields.
- In a normal curve regime, higher UST 2Y and higher UST 10Y often support USD/JPY through carry.
- In a deep inversion regime, a spike in UST 2Y can tighten financial conditions and hit risk. Risk-off can boost JPY and cap USD/JPY.
- If the curve starts to re-steepen because the front end falls, USD/JPY can drop even if the 10Y holds up. That is a Fed cut story.
Keep it simple. Watch 2Y minus 10Y. If it is very negative, respect two-way risk. Rates can rise and USD/JPY can still fall if risk breaks.
Rate volatility, MOVE index and its knock-on effects in FX
Yields matter, but yield volatility often matters more for spot moves.
- MOVE up means the bond market struggles to price the path. FX hedging costs rise. Positioning shrinks. Liquidity worsens.
- High MOVE often brings risk-off bursts. That can support JPY even when the U.S. yield level looks USD positive.
- Low MOVE supports carry. That usually favors USD/JPY upside when the U.S. Japan spread stays wide.
Use MOVE as a filter. If MOVE rises fast, reduce confidence in clean yield to FX relationships and trade smaller.
Event-day yield moves, mapping CPI and NFP surprises to 2Y yield reactions
On CPI and NFP days, UST 2Y gives you the cleanest read on the Fed path. Your job is to map the surprise to the 2Y move, then check if USD/JPY confirms.
- Hot CPI often pushes UST 2Y up fast. If UST 2Y jumps and USD/JPY does not, the market may worry about risk or expect a later policy response.
- Soft CPI often drops UST 2Y. If USD/JPY falls with it, the move has rate support. If USD/JPY holds up, watch equities and real yields.
- Strong NFP with firm wages often lifts UST 2Y. The wage detail matters because it feeds core inflation and Fed reaction.
- Weak NFP or weak earnings often pulls UST 2Y down. If stocks also fall, JPY can strengthen more than yields alone suggest.
Plan your day with an economic calendar. Mark CPI, NFP, and Fed speakers. Then write down two levels before the release, UST 2Y and USD/JPY. After the release, judge the first 5 to 15 minutes by the 2Y reaction, then confirm with the next hour.
Risk-on / risk-off: safe-haven yen, funding currency dynamics, and correlation shifts
Why the yen can strengthen in stress even if Japan’s fundamentals look weak
In stress, investors cut leverage. They reduce foreign risk. They buy back yen to close funding trades.
Japan’s low rates make JPY a common funding currency. You borrow yen, then buy higher yielding assets elsewhere. When fear hits, that trade reverses fast. The reversal can push JPY stronger even if Japan growth looks slow.
Repatriation can add fuel. Japanese investors hold large overseas bond and equity portfolios. In drawdowns, some flows come home or get hedged. That supports JPY on risk-off days.
Equities, credit spreads, and volatility, the channels into USD/JPY
- Equities. When global equities drop hard, USD/JPY often falls as JPY strengthens. Watch S&P 500 futures and Nikkei futures for the first impulse.
- Credit spreads. Wider spreads signal tighter financial conditions. That usually pressures carry trades and supports JPY. Track US high yield spreads and IG spreads, direction matters more than the level intraday.
- Volatility. Higher implied vol raises hedging costs and forces de risk. JPY tends to benefit when equity vol jumps. VIX up, USD/JPY often down, even if US data looks firm.
- Cross asset confirmation. A clean risk-off tape often shows stocks down, credit spreads wider, vol up, and USD/JPY lower.
Carry unwind episodes, what they look like in price action and flows
- Fast downside. USD/JPY drops in sharp waves. Pullbacks stay shallow. The pair can ignore stable US yields for hours.
- JPY strength is broad. You often see JPY gains across crosses like AUD/JPY and MXN/JPY. That points to de lever and funding squeeze, not a Japan specific story.
- Widening basis and stressed liquidity. In deeper stress, funding markets tighten. Liquidity thins. Moves extend through stops.
- Position driven follow through. Once momentum starts, systematic selling and risk parity deleveraging can add to the move. You see bigger candles around US equity open and late day risk reduction.
When risk-on lifts USD/JPY vs when it supports JPY, regime checklist
- Risk-on lifts USD/JPY when US yields rise with equities. This is the classic pro growth tape. UST 2Y up, stocks up, USD/JPY up.
- Risk-on can still support JPY when Japan policy expectations tighten. If markets price less BoJ easing or more BoJ normalization, JPY can hold firm even with strong equities.
- Risk-off strengthens JPY when equities fall, credit spreads widen, and vol jumps. In that regime, yield spreads matter less in the short run.
- Check these four screens before you label the day. S&P futures direction, VIX direction, US HY spreads direction, UST 2Y direction. If three align, trade with the regime.
If you want a tighter framework for risk and rates working together, see risk sentiment and rate differentials.
Japan’s external balance: trade, energy prices, and terms-of-trade effects
Oil, LNG, and the import bill
Japan imports most of its energy. Oil and LNG prices hit Japan fast through higher import costs. That pushes the trade balance lower. It also raises demand for dollars to pay energy invoices. Both channels pressure JPY.
Watch three data points. Brent or WTI, Japan LNG benchmarks, and the yen value of those prices. If crude rises and USD/JPY rises with it, you often see an energy driven move. If crude rises but USD/JPY does not, check risk sentiment and rate spreads. One of them is offsetting the energy impulse.
- Fast signal: a sharp move in crude during Tokyo hours can lift USD/JPY before macro data prints.
- Second order signal: higher energy prices lift Japanese CPI, then markets price less BoJ easing and more policy normalization, but that tends to work with a lag.
Current account vs trade balance, what moves FX in practice
Traders cite the current account because it captures the full external picture, trade, services, and investment income. Japan often runs strong primary income surpluses from overseas assets. That can keep the current account positive even when trade runs a deficit.
For USD/JPY timing, the trade balance can matter more in the short run. It links to real time import demand for dollars. The current account matters more when it changes the medium term story about Japan as a net saver and capital exporter.
- Trade balance impact: reacts to energy prices and FX, tends to move with the cycle.
- Primary income impact: coupon and dividend flows, tends to be steadier, but can swing with global yields and corporate profits.
- What you track: trade balance for near term flow pressure, current account for regime shifts.
Use your calendar to map release days and avoid trading blind around them. See economic calendar for forex.
Seasonality and repatriation, fiscal year-end effects
Japan’s fiscal year-end sits on March 31. Japanese firms often repatriate funds for reporting, hedging, and balance sheet cleanup. That can support JPY in late March. You also see flows around interim reporting periods.
Do not treat this as a rule. The effect depends on where USD/JPY sits, how expensive hedging looks, and whether risk sentiment forces global deleveraging.
- Typical window: second half of March, sometimes starts earlier.
- Common tell: USD/JPY dips despite stable US yields.
- Caveat: strong risk-off can dominate and distort the usual pattern.
Weak yen feedback loop via imports and inflation
A weaker yen raises the yen cost of imports. Energy and food move first. That pushes headline inflation higher and squeezes households. It can also lift input costs for firms.
This can become self-reinforcing. Higher import inflation worsens the trade balance in yen terms, which can mean more ongoing demand for dollars. At the same time, higher inflation can change the BoJ reaction function. If markets doubt the BoJ will tighten enough, the yield gap stays wide and USD/JPY stays supported. If markets price a credible shift toward tighter policy, JPY can stabilize.
- What you watch: import price index, CPI ex fresh food, and wage prints.
- Market check: USD/JPY reaction to Japan CPI, if it rises on hot CPI, the market reads it as negative real income, not a BoJ catalyst.
For the inflation channel into FX pricing, see inflation and exchange rates.
Capital flows and positioning: what real money and speculators can change
Japanese investors: life insurers and pensions move size
Japan runs a large pool of savings. Life insurers, pension funds, and banks decide how much to hold in foreign bonds and how much to hedge back to JPY. Those choices can push USD/JPY even when headlines feel quiet.
- Unhedged foreign buying weakens JPY. If a Japanese investor buys U.S. Treasuries and leaves the FX open, they sell JPY and buy USD.
- Hedging can flip the flow. If they buy U.S. bonds but hedge the currency, they sell USD forward and buy JPY forward. That supports JPY, or at least slows USD/JPY.
- Hedging cost matters. High short term U.S. rates usually raise the USD hedge cost for JPY investors. When the hedge gets expensive, some investors reduce hedged exposure, or accept more FX risk. That often supports USD/JPY.
- Watch fiscal year timing. Japan’s fiscal year-end sits in March. Rebalancing and hedging changes often cluster in late Q1 and early Q2.
What you watch: Ministry of Finance weekly flow data, major life insurer investment plans, and cross currency basis as a proxy for hedge pressure.
Foreign buying of Japanese assets: when it supports JPY
Foreign investors can support JPY when they buy Japanese assets without hedging. The biggest swings usually come from two buckets, Japanese equities and JGBs.
- Equity inflows can lift JPY. A foreign buyer needs JPY to settle spot equity purchases. If they do not hedge, that creates direct JPY demand.
- JGB inflows matter when yield differentials shift. If global yields fall or Japan yields rise, overseas investors sometimes add JGB exposure. That can support JPY, especially if the move forces short JPY positions to cut.
- Hedged inflows mute the FX impact. Many foreign investors hedge JPY when buying JGBs. Then you see the flow in the bond market without much spot JPY strength.
What you watch: MOF weekly “securities investment” flows split by stocks and bonds, plus big weekly moves in USD/JPY that line up with those releases.
CFTC positioning: spot the crowded trade early
CFTC futures positioning gives you a clean read on speculative JPY exposure. It does not tell you timing. It does tell you when the trade gets one-sided.
- Large net short JPY raises squeeze risk. If specs pile into short JPY, any risk-off shock, lower U.S. yields, or BoJ repricing can force fast covering.
- Net long JPY can cap upside. If specs already hold long JPY, good news may not move the pair much. The market already paid for it.
- Track changes, not just levels. A steady build in shorts often supports grind higher USD/JPY. A sharp stop in that build often marks a turning point.
Practical use: combine CFTC with rate and yield moves. If U.S. yields rise but USD/JPY fails to follow and CFTC shows heavy JPY shorts, you have warning signs of fatigue.
Options skew and crowded trades: find asymmetry
Options markets show you where traders pay for protection. Skew often moves before spot, especially around event risk.
- Risk reversals signal fear direction. If JPY call demand rises versus JPY puts, the market pays up for JPY strength protection. That often lines up with risk-off hedging or squeeze risk.
- Implied volatility tells you how jumpy the market feels. Higher implied vol raises hedging activity and can accelerate spot moves once levels break.
- Look for “cheap” downside in USD/JPY late in a trend. If USD/JPY sits high, positioning looks crowded long USD, and JPY call protection gets more expensive, downside can become asymmetric. Moves lower can travel faster than moves higher.
What you watch: 1 week and 1 month USD/JPY implied vol, 25 delta risk reversals, and where large expiries sit versus spot.
Liquidity and sessions: timing changes price impact
USD/JPY reacts differently across Tokyo, London, and New York. Liquidity and the driver set change by session.
- Tokyo hours price local flows. You often see importer demand, exporter selling, and hedging adjustments. Moves can look choppy near fixings and around Japan data.
- London overlap lifts volume. Trend moves often start or extend when Europe joins. If the market wants to run stops, this window often delivers.
- New York hours reprice rates. U.S. data, Treasury auctions, and Fed speak hit here. USD/JPY can track 2 year and 10 year Treasury yields closely in this window.
- Thin liquidity amplifies spikes. Holidays, post-fix periods, and late Friday trading can exaggerate moves. Stops trigger easier. Reversals happen faster.
Practical check: when a move starts, note the session and the driver. If USD/JPY jumps in New York with yields, treat it as rates-led. If it jumps in Tokyo with no yield follow-through, suspect flow, hedging, or positioning.
For scheduled Fed catalysts that often reshape positioning, see what usually happens around FOMC and FX volatility.
FX intervention and policy jawboning: the wild card in USD/JPY
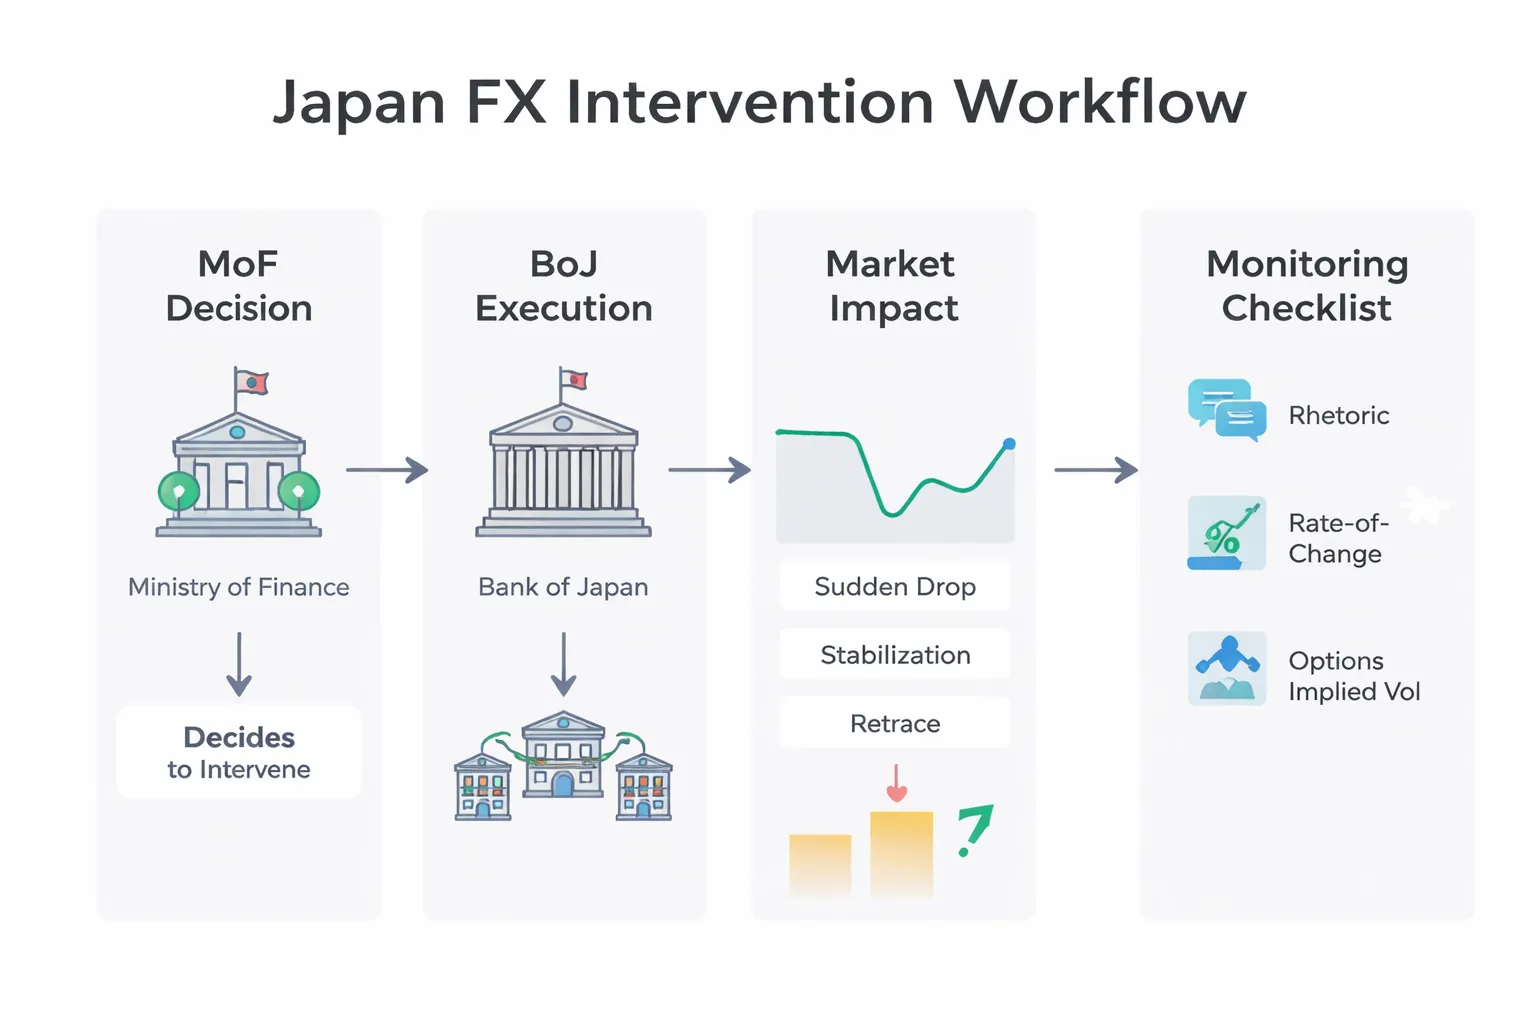
Who intervenes and how: MoF, BoJ execution, and signaling mechanics
Japan’s Ministry of Finance, the MoF, decides if Japan intervenes in FX. The Bank of Japan executes the orders as the MoF’s agent.
Intervention usually means Japan sells USD and buys JPY to slow or reverse a fast USD/JPY rise. Japan can also buy USD and sell JPY, but that is rarer in recent years.
Jawboning is the first line of defense. Officials use repeatable phrases like “excessive moves” and “stand ready to take appropriate action.” Traders treat this as a warning label, not a trade signal.
- MoF sets policy and size, funds the operation, and reports it later.
- BoJ places the trades, often through major banks, and aims for speed and impact.
- Signaling starts with comments, then “rate checks” rumors, then action if the move stays disorderly.
Common intervention triggers: speed, disorderly markets, and volatility spikes
Japan focuses more on pace than level. A slow grind higher can last. A sharp jump in minutes or hours pulls officials in.
- Rate of change. Large intraday gains, especially in Tokyo or early London, raise the odds.
- Disorderly price action. Thin liquidity, wide spreads, and one way flows.
- Volatility spikes. Sudden moves that force dealers to hedge and trigger stops.
- Political pressure. Yen weakness that hits import costs can increase urgency.
Intervention risk rises when USD/JPY rallies without fresh yield support. It rises again when the move becomes a headline trade and positioning crowds in.
How to monitor intervention risk: rhetoric, rate-of-change, and options pricing
Track three inputs. You want a quick checklist you can run in real time.
- Rhetoric. Watch MoF officials, Japan’s top currency diplomat, and BoJ comments about “excessive” or “speculative” moves. Note any shift from routine language to time specific warnings.
- Rate of change. Log the 1 hour and 4 hour move, and the day’s range. Fast climbs with little pullback raise the odds of an air pocket reversal.
- Options pricing. Watch implied volatility, especially 1 week and 1 month, and risk reversals for JPY calls. A rise in short dated implied vol and a turn toward JPY call demand signals hedging for a downside USD/JPY break.
Also watch the tape. Intervention often hits as a sudden, large drop with no obvious macro headline. If yields do not fall and the dollar stays firm elsewhere, suspect Japan action.
What typically happens after intervention: stabilization vs trend resumption
Intervention can change the path, but it rarely changes the macro driver. Rates and spreads still matter most.
- First phase. USD/JPY drops fast. Liquidity thins. Stops amplify the move. Short dated volatility jumps.
- Second phase. Price stabilizes. You often see a partial retrace as the market tests resolve.
- Outcome A, stabilization. Follow through selling continues if positioning was stretched and yields also roll over. The move can turn into a multi day correction.
- Outcome B, trend resumption. USD/JPY grinds back up if U.S. yields stay high and carry demand returns. You usually get a slower climb, with more two way trade, because traders respect headline risk.
Your practical takeaway. Treat intervention as a volatility event and a timing risk. Do not treat it as a new long term signal unless it aligns with the rates story you track in your broader fundamental analysis.
| Signal | What you look for | What it often means for USD/JPY |
|---|---|---|
| Harsher MoF wording | “Excessive,” “speculative,” “decisive action,” repeated in the same day | Higher tail risk of a sharp drop |
| Fast intraday climb | Large move in 1 to 4 hours, thin Tokyo liquidity | Higher odds of a sudden reversal |
| Short dated vol jump | 1 week implied vol up, JPY call demand increases | Market prices intervention or gap risk |
| Big USD/JPY drop, yields steady | USD/JPY falls hard, U.S. yields do not follow, DXY holds | Intervention or strong official signaling likely |
A practical framework to explain today’s USD/JPY move (step-by-step)
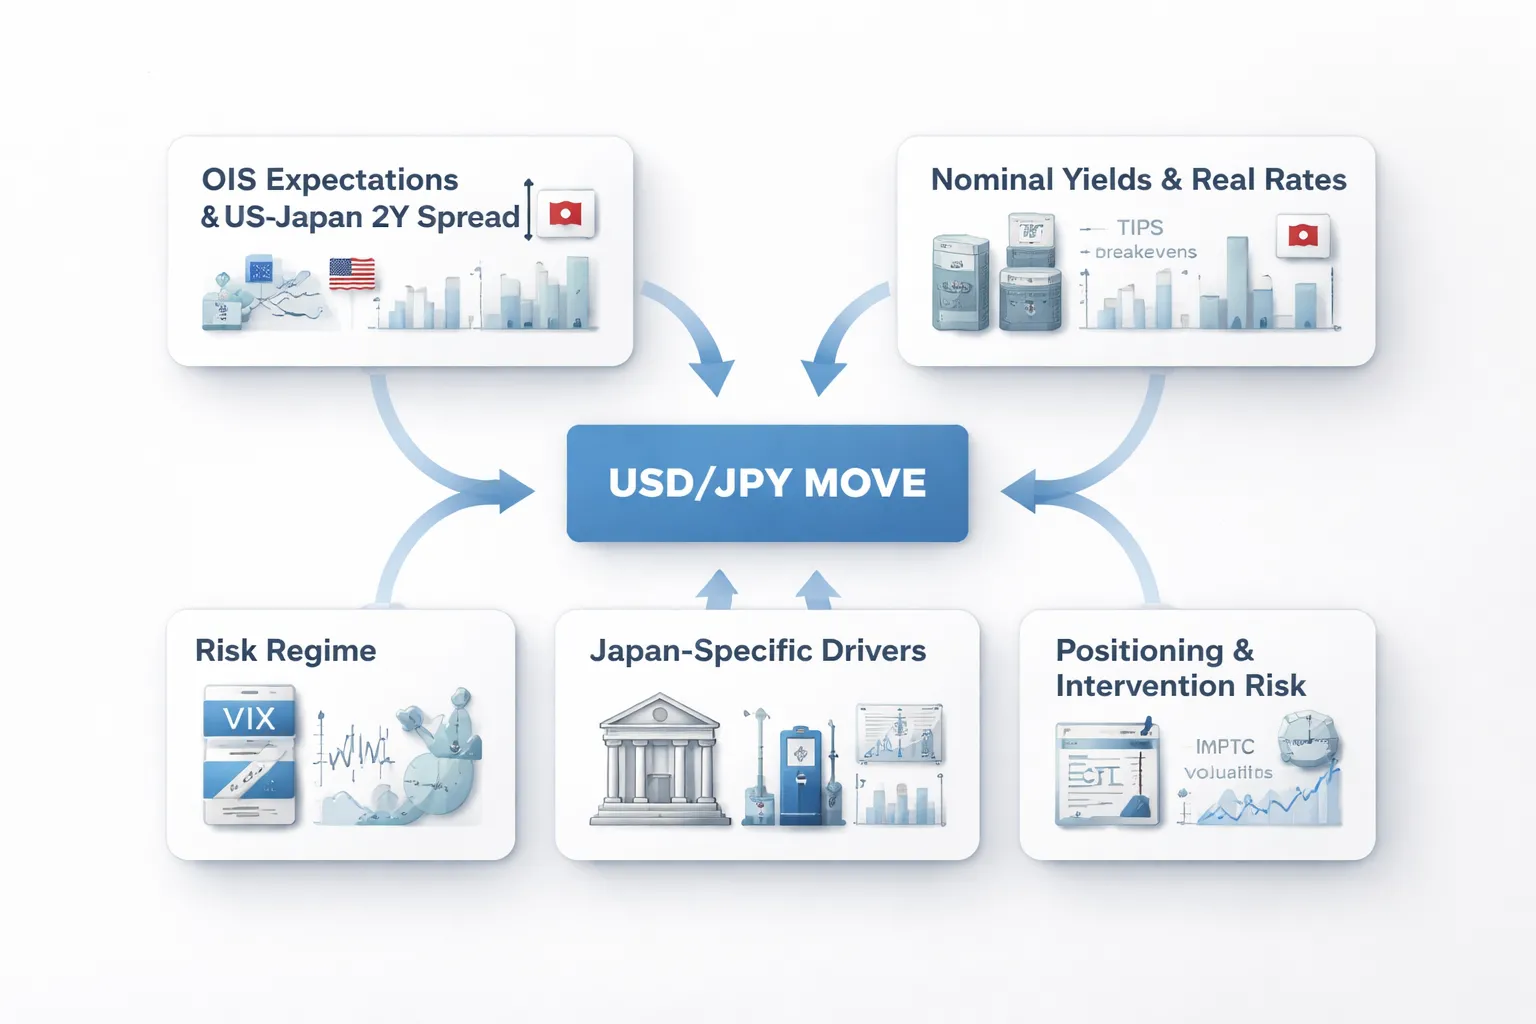
Step 1: Check rate expectations and the U.S.–Japan 2Y spread
Start with what drives USD/JPY most days, short rate expectations.
- Fed path: Check USD OIS for the next 1 to 12 months. Note the change since the prior close and since the Tokyo open.
- BoJ path: Check JPY OIS pricing. Focus on the next meeting and the next 6 to 12 months.
- 2Y spread: Track U.S. 2Y minus Japan 2Y. This is your baseline signal for direction.
- Read it fast: If the spread widens and USD/JPY rises, the move fits rates. If USD/JPY moves without the spread, look for non rates drivers.
Step 2: Confirm with yields and real rates
Then verify the rates story with cash yields, and separate nominal from real.
- U.S. yields: Check 2Y for policy, 10Y for duration. Map the timing of yield moves to the timing of USD/JPY.
- Real rates: Check 10Y TIPS real yield and breakevens. Rising real yields usually support USD/JPY. Rising breakevens with flat real yields often matters less.
- Japan yields: Check JGB 2Y and 10Y, and any sharp intraday shift tied to BoJ operations or YCC related language.
- Mismatch rule: If USD/JPY drops hard while U.S. yields hold and DXY holds, treat it as a Japan event risk move, often signaling or intervention risk.
Step 3: Classify the regime with risk-on or risk-off
Next decide if the market traded carry, or traded safety.
- VIX: Rising VIX usually supports JPY, pushes USD/JPY down. Falling VIX supports carry, pushes USD/JPY up.
- Equities: Use S&P 500 and Nasdaq intraday. Risk off usually shows up here first.
- Credit: Watch U.S. IG and HY spreads, or CDX levels. Credit stress often strengthens JPY even if yields do not move much.
- Practical filter: If equities dump and VIX jumps, you should downgrade any bullish USD/JPY rates signal.
Step 4: Scan Japan-specific drivers
Now check the items that move JPY even when U.S. rates do not.
- Policy headlines: BoJ comments on inflation, wage cycle, and bond purchases. Also watch MoF and top FX diplomat language.
- Energy and trade: Rising crude can hurt Japan’s terms of trade, often weakens JPY. Track Brent and LNG proxies if you trade Asia hours.
- Data surprises: CPI, wages, Tankan, GDP, and current account. Focus on surprise versus consensus, not the level.
- Execution tip: Use an economic calendar and mark the Tokyo time window where liquidity is thin and gaps happen.
Step 5: Assess positioning and intervention risk before you decide
Last, decide if flow and policy risk can override your macro read.
- Positioning: Check CFTC for broad USD and JPY exposure, and watch dealer notes for crowded carry signals.
- Options: Look at 1 week implied vol, risk reversals, and JPY call demand. A vol jump with JPY calls bid points to crash or intervention hedging.
- Intervention markers: Fast moves in 1 to 4 hours, large single prints, and reversals that ignore U.S. yields.
- Levels: Round numbers and recent highs matter because officials often react to speed and optics, not a single precise price.
- Decision rule: If rates and risk align, trade with the macro signal. If rates do not confirm and short dated vol spikes, treat the move as event driven and size down.
Common misconceptions and pitfalls when analyzing what moves USD/JPY
Myth: “The yen is always a safe haven”, when it does not behave that way
JPY does not rally in every risk-off tape. You need to check which force dominates, fear, rate differentials, or Japan-specific policy risk.
- Yield shock can override “safe haven”. If U.S. front end yields jump on Fed repricing, USD/JPY can rise even as equities fall.
- Japan policy risk can flip the script. If the market thinks the BoJ will stay easy while inflation runs, JPY can weaken during global stress.
- Funding logic matters. JPY often funds carry. In classic deleveraging, JPY strengthens. In a rates-led selloff, deleveraging can hit both risk assets and JPY.
- Watch what leads. If USD/JPY tracks 2 year spreads more than the VIX, you are in a rates regime, not a haven regime.
Myth: “Higher U.S. yields always mean higher USD/JPY”, why context matters
USD/JPY cares about the spread, the part of the curve, and the reason yields move.
- Front end beats back end. 2 year and 5 year moves usually explain more than 10 year moves. BoJ policy pins Japan front end, so U.S. front end changes the gap fast.
- Real yields versus inflation breakevens. If nominal yields rise because inflation expectations rise, USD support can fade. If real yields rise, USD/JPY tends to respond more cleanly.
- Risk parity days. Sharp yield spikes can trigger broad risk-off. That can cap USD/JPY or even reverse it if positioning unwinds.
- Level matters. Near key levels, officials and options hedging can dominate. You can see USD/JPY stall even with yields still rising.
Overfitting to single headlines, separating catalyst from narrative
Most USD/JPY “reasons” on news feeds come after the move. You need a repeatable filter.
- Time alignment. Match the timestamp of the headline to the first impulse move, not the continuation. Late headlines often explain a move that already happened.
- Cross-check with U.S. rates and Nikkei. If USD/JPY moves and U.S. yields do not, treat it as flow, options, or Japan policy chatter, not macro repricing.
- Confirm with short dated volatility. A jump in 1 week implied vol and risk reversals signals event pricing. That is different from a trend driven by rates.
- Separate “what happened” from “what changed”. A headline can be noise if it does not change the expected path of Fed, BoJ, or intervention risk.
- Use a simple macro checklist. If you need one, anchor on the same drivers you use in fundamental analysis, policy path, relative rates, growth risk, and positioning.
Ignoring hedging costs, why flows do not match simple yield comparisons
Spot USD/JPY does not trade off nominal yields alone. It trades off hedged returns and who must hedge.
- FX hedging can erase the yield pickup. When the USD/JPY cross-currency basis and short term funding costs move, the hedged yield advantage can shrink fast.
- Japanese investors hedge more than you think. Life insurers and real money often run high hedge ratios. Their incremental buying does not always create sustained USD demand in spot.
- Hedge ratio shifts create non-linear moves. A small change in expected hedging costs can trigger large rebalancing. That shows up as spot moves that look “disconnected” from yields.
- Month-end and fiscal-year effects. Repatriation, coupon flows, and hedging rolls can move USD/JPY even with stable macro inputs.
| Common pitfall | What to check instead |
|---|---|
| Calling every equity selloff “JPY-positive” | 2 year U.S. yields, 2 year spread, short dated USD/JPY vol |
| Assuming nominal yields drive spot | Real yields, curve segment, hedged return, basis |
| Trading the headline text | Timestamp, rate confirmation, options pricing shift |
| Ignoring flow mechanics | Month-end patterns, hedge rolls, positioning stress |
Tools, indicators, and a mini watchlist for ongoing USD/JPY tracking
Must-watch data series for USD/JPY
Track a small set of series. Check them daily. You want rate direction, relative yield, and risk pricing in one view.
- U.S. 2Y Treasury yield (UST 2Y): Your cleanest read on the near-term Fed path. Watch the daily change, the level, and the reaction to data prints.
- Japan 10Y JGB yield (JGB 10Y): Your best live signal for BoJ tolerance. Track spikes, ceiling behavior, and days when yields move without global catalysts.
- U.S. minus Japan short-rate pricing (Fed vs BoJ OIS): Use 1Y and 2Y OIS. Focus on the spread and how it reprices after CPI, jobs, and BoJ meetings.
- U.S. 2Y minus Japan 2Y spread: Simple, fast, and often tighter to spot than 10Y spreads. Use it as a baseline for “rate support” or “rate drag.”
- VIX: A fast risk barometer. Pair it with yield moves. VIX up with UST yields down often leans JPY-supportive.
- MOVE: Rates volatility. Higher MOVE can lift USD/JPY implieds and widen spot ranges, even if spot direction stays unclear.
- WTI crude: An input into Japan’s trade terms and global inflation tone. Treat it as a secondary driver. Use it to sanity check inflation narratives.
Options market clues you should read
Spot reacts to changes in expected ranges and hedging pressure. Options show that change early.
- Implied volatility term structure (1W, 1M, 3M): Rising front-end vol usually signals event risk or stress. A kink where 1W jumps over 1M often means the market expects a near-term catalyst.
- Event premium into key releases: Compare implied move to your typical realized move. When implied inflates, dealers hedge more aggressively around spot.
- Risk reversals (25-delta, 1W and 1M): This is your directional skew. A move toward USD calls versus JPY calls often confirms demand for upside protection in USD/JPY.
- ATM vol and spot together: Spot up with vol up can signal a crowded move with protection demand. Spot up with vol down often signals cleaner trend conditions.
Economic calendars that matter most for USD/JPY
Use the calendar to time your attention. You want releases that reprice the 2Y path and BoJ expectations.
- United States: CPI, core PCE, Nonfarm Payrolls, unemployment rate, average hourly earnings, ISM Services, retail sales, and the Fed decision with SEP and press conference.
- Japan: BoJ decision, press conference, Summary of Opinions, Tokyo CPI, national CPI, wage data, and MoF intervention-related communication.
- Rates focus: Prioritize releases that move UST 2Y first. If UST 2Y does not confirm the headline, treat the FX move as fragile.
- Schedule discipline: Use your forex economic calendar to tag “must-watch” events and set alert windows.
A simple weekly checklist to stay consistent
Run the same process every week. You reduce bias and you spot regime shifts earlier.
- Monday setup: Note levels for UST 2Y, JGB 10Y, 1Y and 2Y Fed and BoJ OIS, VIX, MOVE, WTI, and USD/JPY 1W and 1M implied vol.
- Define the driver: Write one line. “Rates-led,” “risk-led,” or “flow-led.” Update only if the data forces you to.
- Check the spread map: Track U.S. 2Y minus Japan 2Y daily. If spot diverges for more than a few sessions, look for flows, basis, or option hedging.
- Vol and skew scan: Log 1W and 1M ATM implied vol and 25-delta risk reversals. Mark changes, not just levels.
- Event plan: List the top three events and the expected sign for UST 2Y. If the sign flips, you change your USD/JPY bias.
- Post-event check: After each major release, confirm three items. UST 2Y reaction, OIS repricing, and whether implied vol and risk reversals follow.
- Friday review: Summarize the week in five bullets. What moved rates. What moved JGBs. What moved risk. What options priced. Where spot ended versus spreads.
FAQ
What is the single best driver to watch for USD/JPY?
Watch the U.S. 2-year Treasury yield. It tracks Fed policy expectations and usually leads spot. If UST 2Y moves up, USD/JPY tends to rise. If UST 2Y drops, USD/JPY tends to fall. Confirm with OIS repricing.
Why does USD/JPY often follow rate differentials?
Rate differentials drive hedging costs and carry returns. Wider U.S. minus Japan short rate spreads usually support USD/JPY. Narrower spreads usually pressure it. Use UST 2Y versus JGB 2Y, plus USD OIS versus JPY OIS, to gauge the move.
Which BoJ policy signals matter most?
Track three items. Yield curve control changes, policy rate guidance, and bond buying operations. A more hawkish BoJ, less buying, higher allowed yields, or tighter guidance, tends to support JPY and push USD/JPY lower. Dovish signals do the opposite.
Do long-end yields matter or mostly the front end?
Front-end yields usually matter more because they price policy. The long end matters when it shifts term premium and hedging behavior. Watch UST 10Y and JGB 10Y for regime changes, but keep UST 2Y as your primary signal for direction.
How does risk-on or risk-off move USD/JPY?
Risk-off often strengthens JPY through funding unwind and hedging demand, so USD/JPY can fall even if U.S. yields hold. Risk-on often weakens JPY, so USD/JPY can rise. Confirm with equity futures, VIX, and credit spreads.
Why can USD/JPY rise on bad U.S. data sometimes?
If the data hits global risk harder than it hits Fed pricing, JPY can weaken through capital flows and positioning. Also, if the market was positioned for worse, yields may not fall. Always check UST 2Y first, then risk gauges.
What economic releases move USD/JPY the most?
U.S. CPI, jobs, and retail sales, plus Fed decisions and dot plots. For Japan, BoJ meetings, inflation prints, wage data, and key MoF comments. Your edge comes from tracking how each release shifts UST 2Y and OIS pricing.
How do you use options to confirm a USD/JPY view?
Check implied vol and risk reversals. Rising implied vol signals event risk or stress. Risk reversals show demand for USD calls versus JPY calls. If spot rises but USD/JPY risk reversals do not, the move may lack conviction or hedge demand may fade.
What is the cleanest weekly process to stay consistent?
Run a simple checklist. First, what moved UST 2Y. Second, what moved JGBs. Third, what changed in risk. Fourth, what options priced, vol and skew. Fifth, where spot ended versus spreads. Keep one bias until the sign flips.
Where should you start if you want the core framework?
Start with the rate differential and risk lens, then add BoJ policy rules. Use this guide on USD/JPY drivers and rate differentials to map your daily checklist to data and price action.
Conclusion
Conclusion
USD/JPY moves on two levers. The U.S.-Japan rate gap and global risk.
Your job is to track what changes at the margin. Most days, spot follows spreads. When it does not, risk and options usually explain the gap.
- Start with rates. Watch U.S. front-end pricing and Treasury yields, then map them to USD/JPY.
- Add Japan. Track BoJ guidance, policy normalization signals, and the JGB curve, especially the long end.
- Overlay risk. Use equity direction, credit stress, and funding conditions to label the tape as risk-on or risk-off.
- Check positioning risk. Look at implied vol, skew, and barrier chatter before key events.
- Confirm with price. Compare where spot closes versus the move in yield spreads and risk assets.
Final tip. Keep one bias until the sign flips. Define the sign with your base drivers. If the rate differential widens and risk stays firm, you fade yen strength. If U.S. yields roll over, BoJ turns less dovish, or risk breaks, you cut USD/JPY longs fast.
If you want the broader framework across pairs, read fundamental analysis in forex.
-
How Interest Rates Affect Currency Pairs (With Real Examples)
7 months ago -
Fundamental Analysis in Forex Explained (What Actually Moves Prices)
7 months ago -
What Moves EUR/USD? The Biggest Drivers You Should Watch
7 months ago -
Inflation and Exchange Rates Explained (Why Currencies Rise or Fall)
7 months ago -
How to Trade Forex News (NFP, CPI, FOMC) Without Getting Wrecked
7 months ago
-
- How short-end rates transmit into spot FX
- Why 2-year yields often beat 10-year yields for daily moves
- FX hedging basis and cross-currency swaps: when hedged returns flip flows
- Carry trade mechanics: why high differentials can reinforce trends
- When the differential fails: positioning, liquidity, and already priced outcomes
-
- From YCC to normalization, why small tweaks can create big FX moves
- BoJ tools that affect JPY: policy rate, bond buying, lending facilities, guidance
- Inflation and wages: why Shunto drives BoJ expectations
- BoJ reaction function: what would make the BoJ tighten or pause
- Communication risk: how ambiguous wording creates volatility in USD/JPY
-
- Who intervenes and how: MoF, BoJ execution, and signaling mechanics
- Common intervention triggers: speed, disorderly markets, and volatility spikes
- How to monitor intervention risk: rhetoric, rate-of-change, and options pricing
- What typically happens after intervention: stabilization vs trend resumption
-
- What is the single best driver to watch for USD/JPY?
- Why does USD/JPY often follow rate differentials?
- Which BoJ policy signals matter most?
- Do long-end yields matter or mostly the front end?
- How does risk-on or risk-off move USD/JPY?
- Why can USD/JPY rise on bad U.S. data sometimes?
- What economic releases move USD/JPY the most?
- How do you use options to confirm a USD/JPY view?
- What is the cleanest weekly process to stay consistent?
- Where should you start if you want the core framework?
-
- How short-end rates transmit into spot FX
- Why 2-year yields often beat 10-year yields for daily moves
- FX hedging basis and cross-currency swaps: when hedged returns flip flows
- Carry trade mechanics: why high differentials can reinforce trends
- When the differential fails: positioning, liquidity, and already priced outcomes
-
- From YCC to normalization, why small tweaks can create big FX moves
- BoJ tools that affect JPY: policy rate, bond buying, lending facilities, guidance
- Inflation and wages: why Shunto drives BoJ expectations
- BoJ reaction function: what would make the BoJ tighten or pause
- Communication risk: how ambiguous wording creates volatility in USD/JPY
-
- Who intervenes and how: MoF, BoJ execution, and signaling mechanics
- Common intervention triggers: speed, disorderly markets, and volatility spikes
- How to monitor intervention risk: rhetoric, rate-of-change, and options pricing
- What typically happens after intervention: stabilization vs trend resumption
-
- What is the single best driver to watch for USD/JPY?
- Why does USD/JPY often follow rate differentials?
- Which BoJ policy signals matter most?
- Do long-end yields matter or mostly the front end?
- How does risk-on or risk-off move USD/JPY?
- Why can USD/JPY rise on bad U.S. data sometimes?
- What economic releases move USD/JPY the most?
- How do you use options to confirm a USD/JPY view?
- What is the cleanest weekly process to stay consistent?
- Where should you start if you want the core framework?
-
How to Place a Forex Trade Step by Step (Your First Trade Explained)
5 months ago -
Forex Trading vs Crypto Trading: Which Market Is Better for Beginners?
5 months ago -
Forex Lot Size Calculator: How to Use It to Size Trades Correctly
7 months ago -
How to Calculate Position Size in Forex (Position Sizing Formula + Examples)
7 months ago -
Forex Leverage Explained: How It Works, Pros, Cons & Examples
7 months ago
-
Forex Trading Platforms Comparison: MetaTrader vs cTrader vs TradingView
7 months ago -
Stop Loss vs Take Profit: Differences, Examples & Best Practices
7 months ago -
Is Forex Trading Legal in the United States? Rules, Regulators & What to Know
7 months ago -
Forex Market Hours & Trading Sessions Explained (Best Times to Trade)
7 months ago -
Forex Leverage Explained: How It Works, Pros, Cons & Examples
7 months ago