Forex Chart Patterns Explained (Head and Shoulders, Triangles, Flags)

Chart patterns help you spot trend shifts and continuation setups from price alone. In forex, they matter because price can move fast and leverage magnifies mistakes.
This guide breaks down three core patterns, head and shoulders, triangles, and flags. You will learn how to identify each pattern, where the key levels sit, and what must happen before you take a trade.
- How to mark the neckline, trendlines, and flag channel with clear rules.
- What a valid breakout looks like, and what makes it low quality.
- Where to place entries, stops, and targets, plus common failure signals.
Pattern trading fails most often from weak risk control. Use defined exits from the start. See stop loss vs take profit for practical placement rules.
Key Takeaways
- In het kort: Treat patterns as structured trade plans, not predictions.
- In het kort: Draw the key lines with rules, neckline for head and shoulders, trendlines for triangles, channel lines for flags.
- In het kort: Only trade breakouts that close beyond the level and show clean follow-through.
- In het kort: Skip low quality breaks, thin candles, no close past the level, instant snapbacks, or breakout into nearby support or resistance.
- In het kort: Define entry, stop, and target before you click buy or sell.
- In het kort: Use invalidation stops, beyond the pattern structure, not at round numbers.
- In het kort: Set targets from measured moves or the next key level, then manage risk around that distance.
- In het kort: Track failure signals early, breakout retests that fail, strong rejection candles, and a close back inside the pattern.
- In het kort: Risk control decides results more than pattern selection.
Head and shoulders works best when the neckline breaks and holds. Triangles need two clean touches on each trendline before you trust them. Flags need a sharp flagpole and a tight channel. If the structure looks messy, your edge drops.
Keep your levels aligned with market structure. Use support and resistance to spot the nearest barriers that can kill a breakout. If the breakout runs into a major level fast, reduce size, tighten the plan, or skip the trade.
What Are Chart Patterns in Forex and Why They Matter
Pattern basics, why price repeats
Chart patterns are recurring price structures. They form because traders react the same way to the same inputs. Stops cluster at obvious highs and lows. Breakout traders place entries beyond those levels. Mean reversion traders fade stretched moves back into ranges.
When price revisits a level, orders sit there again. That creates repeated shapes like head and shoulders, triangles, and flags. Your job is to map where orders likely stack and where they likely run.
Continuation vs reversal setups, classify fast
Sort patterns by what they try to do to the prior swing.
- Continuation. Price pauses, then resumes the trend. Common structures: flags and many triangles. You look for a clean impulse, then a controlled pullback, then a break in the trend direction.
- Reversal. Price fails to extend, then flips. Common structures: head and shoulders. You look for a trend, then weaker follow-through, then a break of the key support or resistance that held the move together.
Use one rule. If the pattern sits after a strong directional leg and holds most of that move, treat it as continuation. If it prints after an extended trend and starts breaking prior swing structure, treat it as reversal.
Timeframes and fractals, patterns exist on any chart
Patterns show up on all timeframes because markets move in swings. Smaller swings build larger swings. A flag on a 5 minute chart can be the pullback inside a 1 hour trend leg. A head and shoulders on a 4 hour chart can be noise inside a daily range.
Match the timeframe to your holding period. If you trade intraday, anchor your plan to 15 minute to 1 hour structure. If you swing trade, anchor to 4 hour to daily structure. Then use a lower timeframe only to refine entries and stops.
Forex-specific nuances, liquidity, sessions, tick volume
Forex trades 24 hours a day, five days a week. Liquidity shifts by session. That changes how patterns break.
- Session overlap matters. London, New York overlap often brings the cleanest breaks and follow-through. Asia can build ranges and false starts.
- Breakout timing matters. Many patterns break near session opens, major fixes, and scheduled data times because order flow spikes.
- Volume data is limited. Spot FX has no centralized volume. Platforms show tick volume. Use it as a proxy. Rising tick activity during the breakout supports the move. Flat tick activity often signals a weak break.
When patterns are least reliable
- Low volatility. Tight daily ranges produce fake breaks. If the pair barely moves, you get chopped around levels.
- News spikes. High impact releases can blow through structure, then reverse. Spreads widen and stops slip. Treat patterns as invalid during the spike. Reassess after the first reaction settles.
- Thin liquidity. Late Friday, holidays, and session gaps increase slippage and stop runs. Patterns can look perfect, then fail on a small order imbalance.
When conditions get worse, reduce risk, demand cleaner structure, or stand aside. Keep your risk rules tight and consistent. If you need a framework, use a simple risk management plan before you trade patterns live.
How to Identify and Validate Patterns Like a Pro
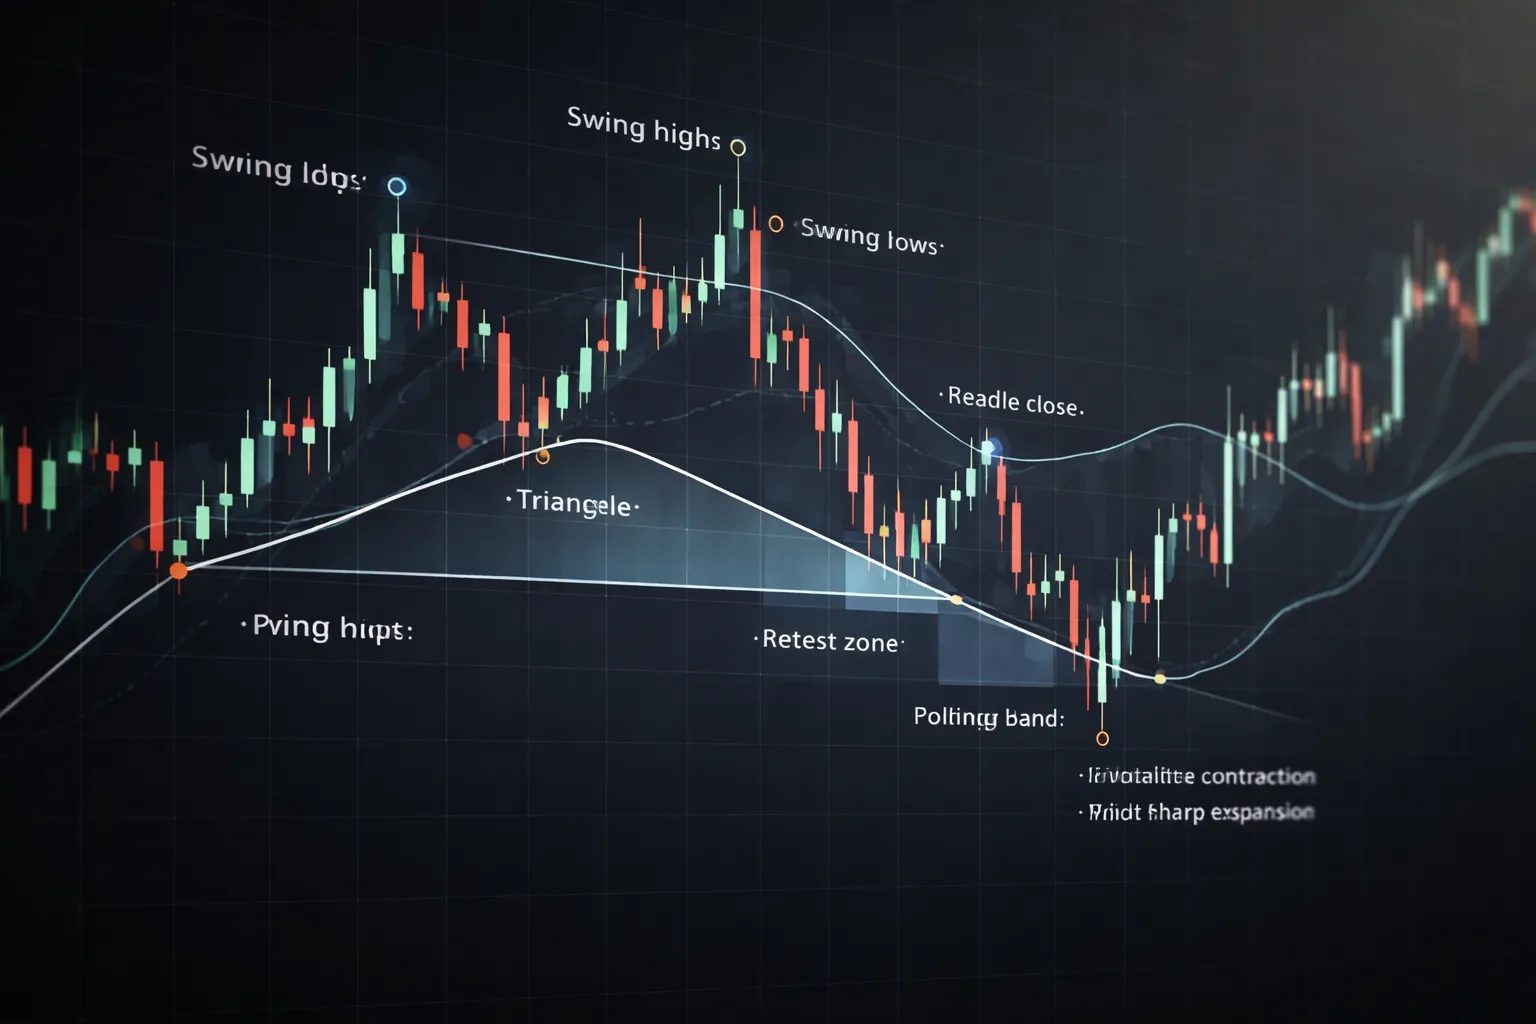
Drawing rules, swings, pivot points, and clean trendlines
Start with structure, not lines.
- Pick your timeframe first. Mark swings on that timeframe only. Do not mix a 5 minute swing with a 4 hour pattern.
- Use pivots you can see fast. A pivot high has lower highs on both sides. A pivot low has higher lows on both sides.
- Connect at least two pivots. A trendline needs two clean touches. A third touch strengthens it. Do not force a line through wicks to make it fit.
- Prefer bodies for structure. Use candle bodies to define the main slope. Use wicks as context for stops and liquidity, not for drawing every line.
- Keep angles realistic. If your line cuts through many candles, you drew it wrong. Redraw using the clearest pivots.
Support and resistance mapping, where patterns gain meaning
Patterns work best when they sit on a level that matters.
- Mark the last major swing high and swing low. These often act as decision points for breakouts and failures.
- Mark round numbers and prior session highs and lows. These levels attract orders and stop placement.
- Map the pattern to the level. Head and shoulders matters more if the neckline lines up with prior support. A triangle matters more if it compresses into a known resistance zone.
- Use one to three key levels. Too many lines turns into noise. If you cannot explain why a level matters, remove it.
Confirmation signals, candle close, retest, and momentum alignment
Trade the break after the market proves it.
- Wait for a close. A wick through a neckline or trendline is not a break. You need a candle close beyond the level on your trading timeframe.
- Check the breakout candle. It should close near its extreme. A weak close with a long opposing wick signals absorption.
- Use the retest as a filter. After the break, price often returns to the broken level. You want rejection, fast reclaim, or a clear hold. If price grinds back through, the break failed.
- Demand momentum alignment. Breakouts that work usually show expanding range and follow through. If volatility stays flat, treat the move as suspect.
- Match direction to the larger swing. A bull flag works best inside an uptrend swing. A bear flag works best inside a downtrend swing.
Quality checklist, symmetry, slope, volatility contraction and expansion
Use a checklist. It keeps you from seeing what you want to see.
Common misreads, confusing consolidation with a real setup
- Calling any range a flag. A flag needs a strong impulse leg first. If the move into the “flag” looks choppy, you likely have a range.
- Forcing head and shoulders. The head should stand out. The neckline should be clear. If you need to explain it, skip it.
- Ignoring context levels. A triangle in the middle of nowhere has less edge than one tightening into prior highs or lows.
- Trading the first break in thin conditions. Low liquidity turns breaks into stop runs. Wait for the close, then the retest.
- Overdrawing trendlines. If you redraw lines every few candles, you are reacting, not validating.
- Confusing compression with reversal. Compression can break either way. Trade the confirmation, not the guess.
Head and Shoulders Pattern (Regular and Inverse)
Structure Components
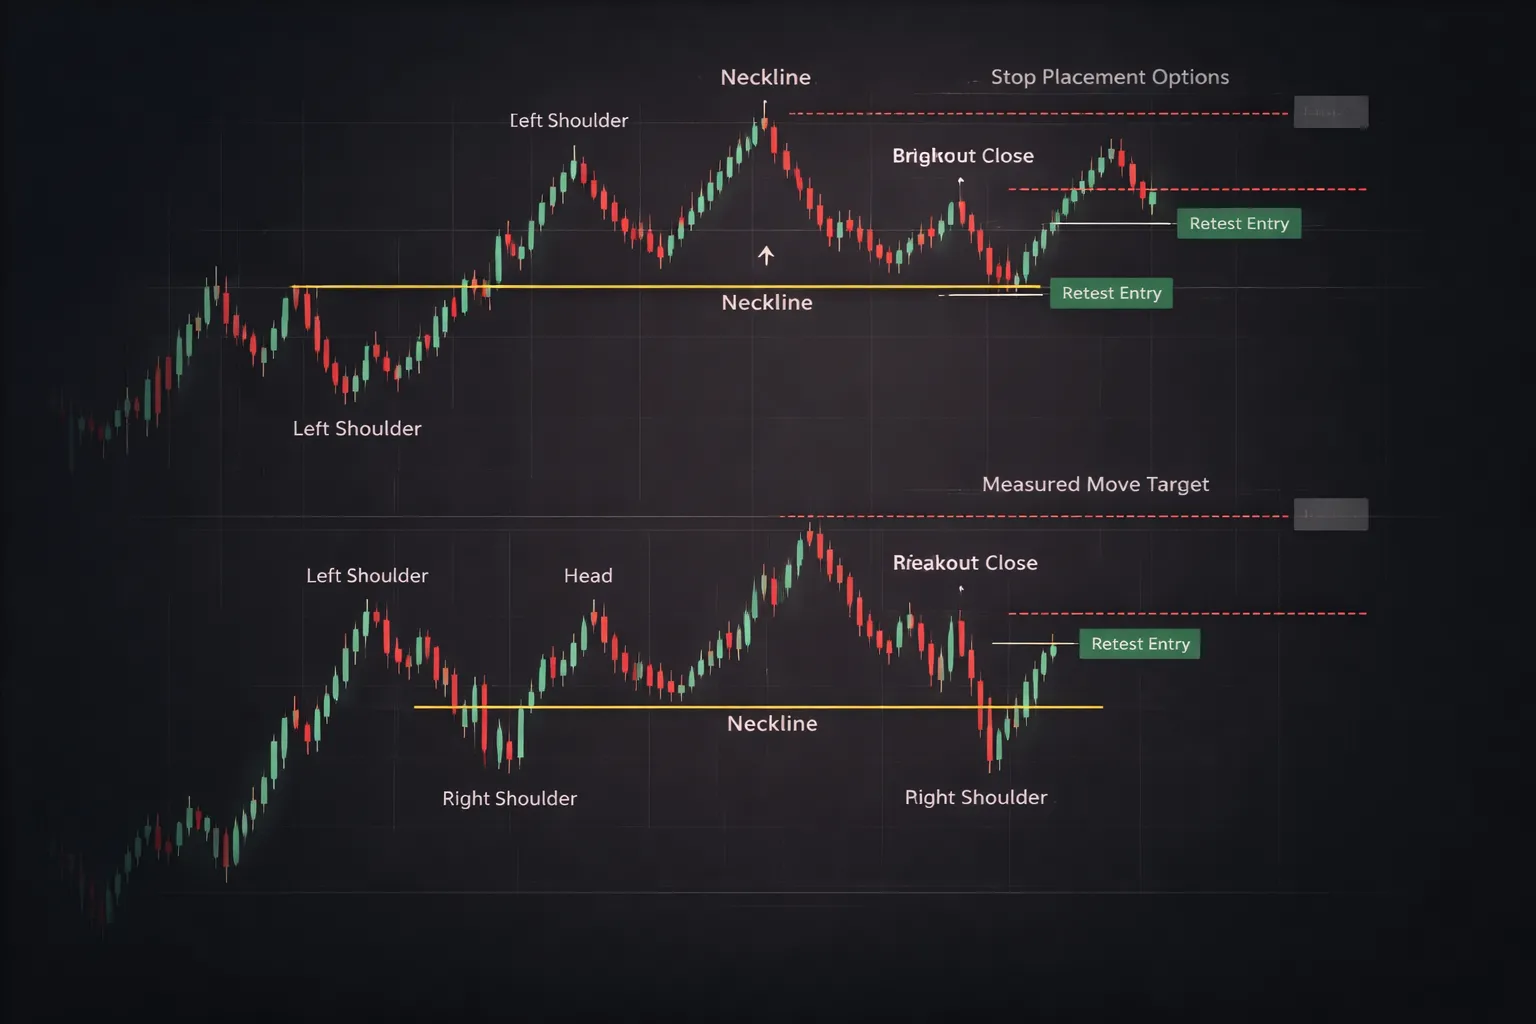
The head and shoulders has four parts. You need all of them to trade it with rules.
- Left shoulder. Price rallies, then pulls back. This pullback often sets the first neckline touch.
- Head. Price makes a higher high (regular) or lower low (inverse), then pulls back again.
- Right shoulder. Price fails to beat the head. This failure matters more than the exact shape.
- Neckline. A level drawn through the two pullback lows (regular) or two pullback highs (inverse). This is your trigger line.
Bullish vs Bearish Versions
Regular head and shoulders is bearish. You see it after an uptrend. Buyers push to a new high (the head), then fail to hold momentum. The right shoulder shows weaker demand.
Inverse head and shoulders is bullish. You see it after a downtrend. Sellers push to a new low (the head), then fail to extend. The right shoulder shows weaker supply.
Do not trade it in the middle of a range and call it a reversal. Location drives expectancy.
Neckline Behavior: Horizontal vs Sloping
A horizontal neckline gives cleaner structure. You can read it as a clear support or resistance flip.
A sloping neckline changes the trade.
- Down-sloping neckline in a regular pattern breaks earlier. It can signal fading strength, but it can also cut your target distance.
- Up-sloping neckline in a regular pattern needs stronger selling to break. You often get more false breaks.
- Up-sloping neckline in an inverse pattern breaks earlier. It can improve timing, but it can reduce measured move distance.
- Down-sloping neckline in an inverse pattern needs stronger buying to break. You often get more chop before release.
Keep the neckline anchored to the two reaction points. If you keep adjusting it, you are fitting, not trading.
Entry Approaches
- Breakout close. You enter after a candle closes beyond the neckline. This reduces premature triggers. It also risks worse price and more slippage in fast markets.
- Neckline retest. You wait for price to break, then retest the neckline, then reject it. This often improves risk to reward. It also increases the chance of missing a move.
For retests, demand proof. In a regular pattern, you want the neckline to hold as resistance. In an inverse pattern, you want it to hold as support.
Stop-Loss Placement
- Beyond the right shoulder. This is the standard stop. It keeps risk tighter. It fails more often in volatile pairs and around news.
- Beyond the head. This is a wider stop. It reduces stop-outs but lowers position size and reward ratio.
- ATR-based stop. Place your stop beyond the right shoulder by a volatility buffer, for example 1.0 to 1.5 ATR of your trading timeframe. This adapts to pair volatility. Use an ATR-based stop method when spreads expand or candles widen.
Do not park stops on the exact shoulder high or low. That is where other traders place them.
Targets and Trade Management
The basic target uses a measured move.
- Measured move. Measure the distance from the head to the neckline. Project that distance from the breakout point.
- Partials. Take partial profit at 0.5R to 1R, or at the next major swing level. This reduces stress and helps you hold the rest.
- Trailing stop. Trail behind lower highs in a regular pattern, or higher lows in an inverse pattern. You can also trail by ATR to avoid getting chopped out.
Match management to market conditions. Trend days pay the measured move. Range days pay the first clean push, then reverse.
Invalidation and Failure Signals
- Right shoulder breaks the head. The pattern is invalid. Exit any early short or long bias.
- No momentum on the break. A weak close beyond the neckline, followed by an immediate snap back, often signals a trap.
- Break and hold failure. Price breaks the neckline, then closes back inside and holds. That often leads to a move in the opposite direction.
- Retest acceptance. Price retests the neckline and starts building candles through it, not rejecting. That is not a retest entry, it is a failed setup.
- Heavy overhead or underfoot levels. If the measured move runs into major support or resistance fast, reduce size or take partials early.
Practical Example Workflow
- Step 1, confirm location. Regular pattern after an uptrend. Inverse pattern after a downtrend. Skip mid-range formations.
- Step 2, mark components. Identify left shoulder, head, right shoulder. Draw the neckline through the two reaction points.
- Step 3, check symmetry. The shoulders do not need to match, but the right shoulder must fail to take the head.
- Step 4, define the trigger. Decide breakout close or neckline retest. Write it down before price reaches the neckline.
- Step 5, set risk. Choose stop beyond right shoulder, beyond head, or ATR-buffered beyond the shoulder. Size your position from that distance.
- Step 6, set target. Plot the measured move. Mark nearby support or resistance that can block the move.
- Step 7, execute. Enter on your trigger. No chasing after the move extends.
- Step 8, manage. Take partials at planned levels. Trail the rest behind structure or ATR.
- Step 9, exit on invalidation. If price reclaims the neckline and holds, or if it breaks the head against your trade, get out.
Triangle Patterns in Forex (Ascending, Descending, Symmetrical)
What makes a triangle pattern
A triangle is compression. Price swings get smaller. Two boundaries converge. You get a series of lower highs, higher lows, or both.
Draw the boundaries with at least two clean touches each. Three is better. The apex is the meeting point of the lines. Most valid breaks happen before price reaches the apex.
Triangles store energy by reducing range. You trade the release, not the chop inside the shape.
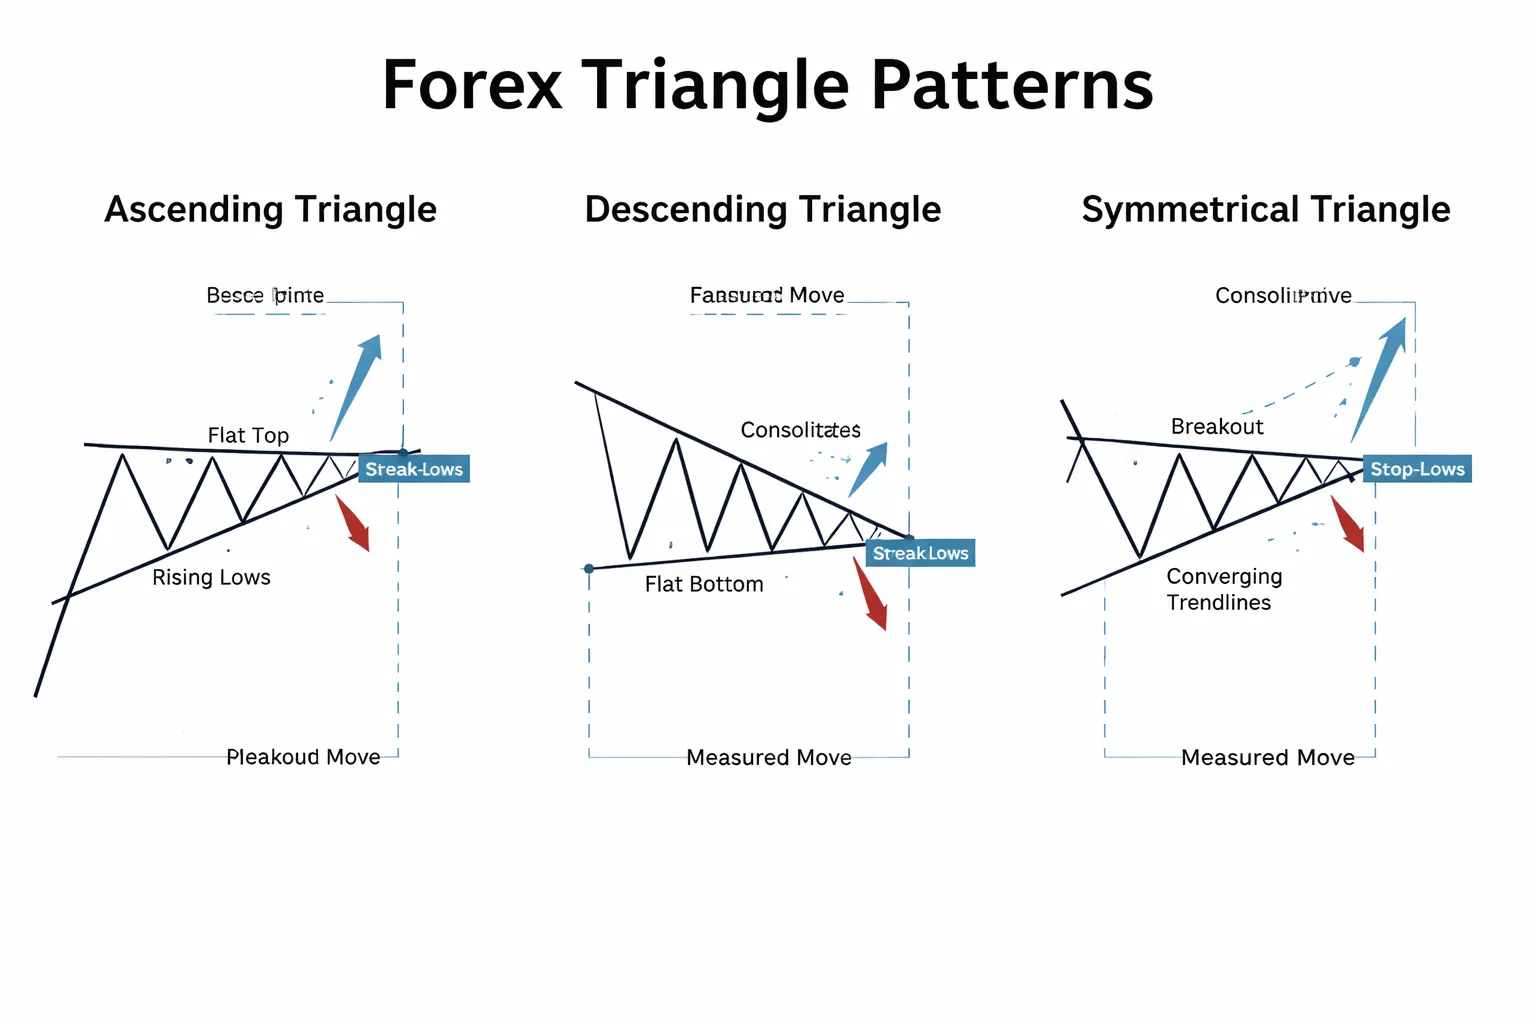
Ascending triangle logic
An ascending triangle shows buyers stepping up. You see higher lows pushing into a flat or near-flat ceiling.
- Structure: rising support line, horizontal resistance line.
- Bias: bullish, but you still need the break.
- Best use: continuation after an up move, or a base after a selloff.
Watch the highs. If price keeps failing at the ceiling but the lows keep rising, pressure builds. A strong break usually comes with wider candles and clean follow-through.
Descending triangle logic
A descending triangle shows sellers stepping down. You see lower highs pressing into a flat or near-flat floor.
- Structure: falling resistance line, horizontal support line.
- Bias: bearish, but you still need the break.
- Best use: continuation after a down move, or distribution after a rally.
Watch the lows. If price keeps holding the floor but rallies get weaker, sellers gain control. A clean break often runs stops under the floor and accelerates.
Symmetrical triangle logic
A symmetrical triangle shows balanced pressure. Highs fall. Lows rise. Neither side controls the range.
- Structure: falling resistance line, rising support line.
- Bias: neutral until the break.
- Best use: consolidation mid-trend, or pre-event compression.
Trade it like a breakout pattern. Do not assume direction from the shape alone. Use trend context and where the break happens relative to nearby support or resistance.
Entry tactics
- Break-and-close: enter after a candle closes beyond the trendline. You reduce false breaks. You often give up some price.
- Retest entry: wait for price to break, then retest the broken line and hold. You get better price and tighter risk. You may miss fast moves with no retest.
- Stop orders: place a buy stop above resistance and a sell stop below support. You catch momentum. You also get tagged by news spikes and spread widening. Use only when liquidity is stable.
Keep the triangle clean. If price pokes through both sides multiple times, skip it. The market already invalidated the compression.
Stop-loss logic
- Beyond the opposite trendline: for an upside break, your stop goes below rising support, for a downside break, above falling resistance. Simple and structure-based.
- Swing-based: place the stop beyond the last swing inside the triangle that should not break if the move is real. Often tighter, but easier to stop out.
- Volatility buffer: add an ATR-based buffer beyond your stop level to avoid noise. Use this when the pair whips, or when session overlap increases range.
Match your stop to your entry style. Break-and-close can use a wider structural stop. Retest entries can use tighter swing stops if the retest holds.
Targeting methods
- Measured move: take the triangle height at its widest point, project it from the breakout point.
- Next key level: target the next obvious support or resistance first. This often pays before the full measured move.
- Multi-target scaling: take partials at the first key level, hold the rest for the measured move. Trail behind new swings or a volatility rule.
If the next key level sits close, treat the measured move as optional. Structure beats geometry.
False breakouts and filters
- Time-of-day: favor breaks during liquid sessions. Skip thin periods where spreads widen and single orders can spike price.
- Momentum: look for strong candle bodies on the break, and follow-through on the next candle. Weak closes near the line signal risk.
- Structure: align the break with the higher timeframe. If price breaks up into a major weekly resistance, expect rejection.
Use a simple rule. If price breaks out and then closes back inside the triangle, treat it as failure. Cut the trade fast or stand aside.
Triangle vs wedge, fast distinction rules
- Trendline direction: triangles converge. One line can be flat. Wedges slope in the same direction.
- Bias: triangles are often continuation but can break either way. Rising wedges often break down. Falling wedges often break up.
- Shape: wedges usually contract while drifting up or down. Triangles usually contract without a strong drift.
- Trading plan: treat wedges as reversal risk. Treat triangles as breakout setups with confirmation.
Draw your lines with consistency. Use the same wick or body rule across the pattern. If you want a repeatable method, use a clear process for drawing trendlines before you trade triangles.
Flag Patterns in Forex (Bull Flags and Bear Flags)
Core anatomy: flagpole, consolidation channel, and continuation bias
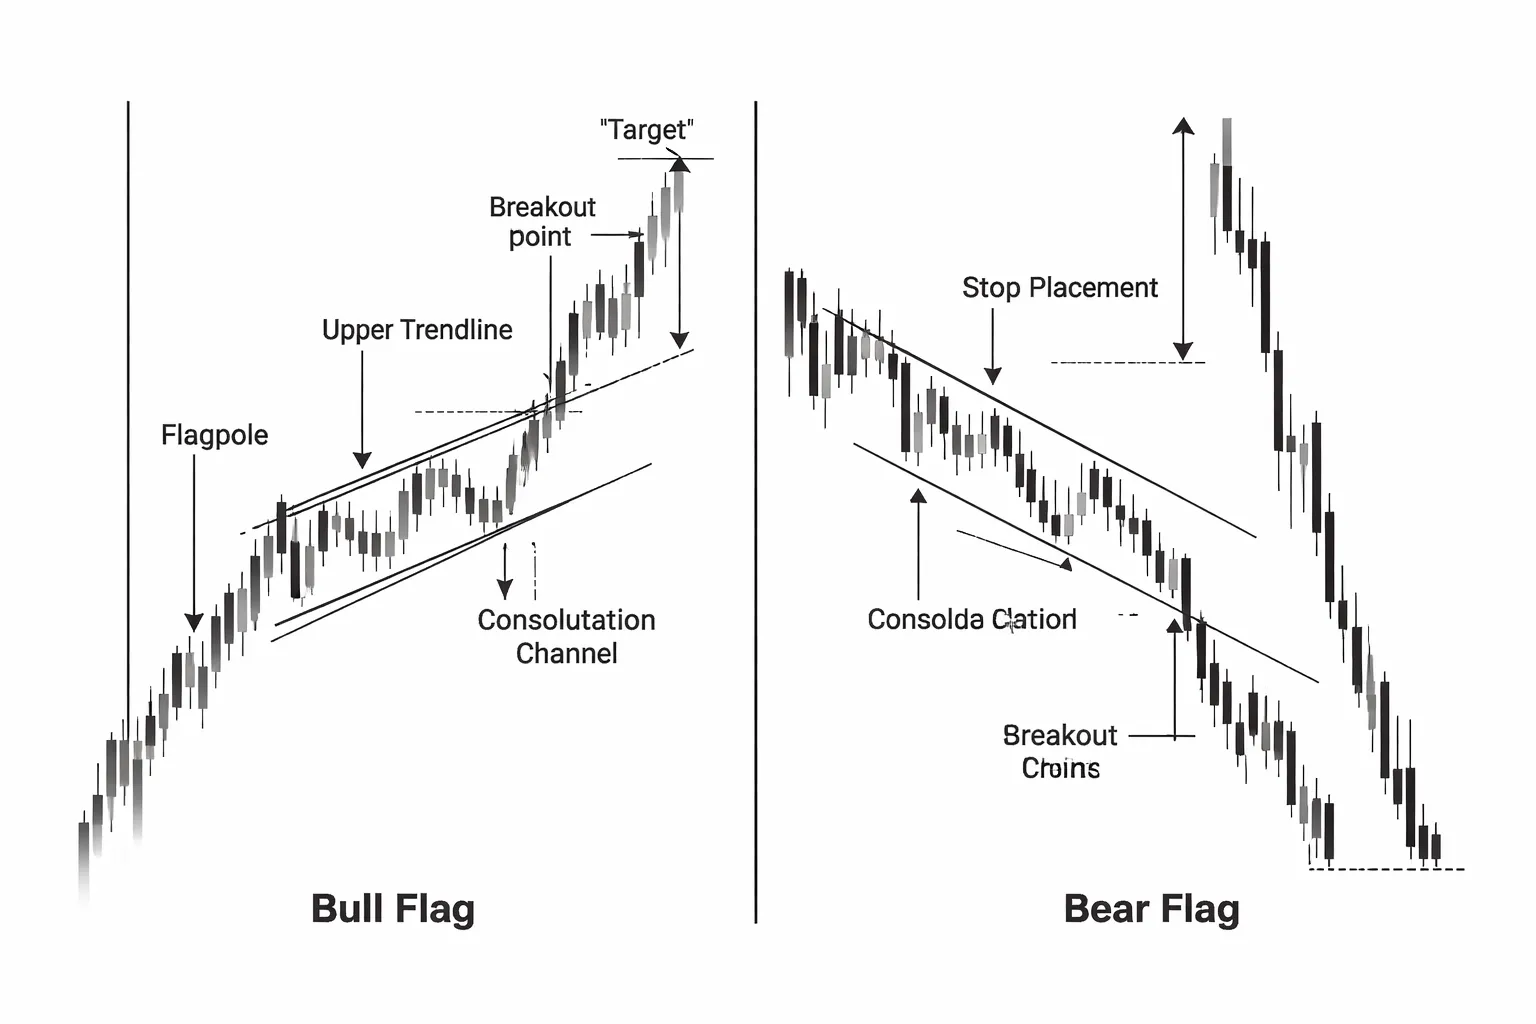
A forex flag has two parts.
- Flagpole: a sharp impulse move with large candles and little overlap.
- Flag: a short consolidation that slopes slightly against the trend, inside a channel.
The bias is continuation. Price often resumes in the pole direction because the pullback stays controlled and does not break key structure.
Bull flag mechanics: controlled pullback in an uptrend
A bull flag starts with an impulsive rally. Then price pulls back in a tight, downward-sloping channel.
- Higher timeframe trend points up.
- Pullback candles overlap and shrink. Momentum cools.
- Lows hold above a clear swing level, often the breakout area that formed the pole.
You want contained selling. You do not want a deep retracement that erases most of the pole.
Bear flag mechanics: relief rally in a downtrend
A bear flag starts with a sharp selloff. Then price bounces in a tight, upward-sloping channel.
- Higher timeframe trend points down.
- The bounce looks like a grind, not a V-shaped reversal.
- Highs stall under prior support that may act as resistance.
You want contained buying. You do not want a reclaim of broken structure.
Flags vs pennants: how to tell them apart quickly
- Flag: parallel channel lines. The consolidation looks like a small rectangle that tilts.
- Pennant: converging trendlines. The consolidation looks like a small triangle.
If your two consolidation lines meet, you have a pennant. If they stay parallel, you have a flag. Use the same wick or body rule for both lines so your read stays consistent. If you need a refresher, see trend lines and channels.
High-probability conditions: strong impulse, orderly pullback, and tight ranges
- Strong impulse: clear displacement. Large bodies. Break of a prior level.
- Orderly pullback: slow retrace. Small candles. Limited overlap outside the channel.
- Tight range: the flag stays compact versus the pole. You want compression, not expansion.
Skip flags that form after choppy price action. Flags work best when the pole shows real imbalance.
Entry options: breakout, pullback entry, and trend continuation confirmation
- Breakout entry: enter on a close beyond the flag channel in the trend direction. This reduces false breaks versus a simple touch.
- Pullback entry: after the breakout, wait for price to retest the broken channel line and hold. Then enter in the trend direction.
- Continuation confirmation: enter when price takes the last minor swing inside the flag, then closes back with momentum.
Pick one trigger and apply it the same way. Do not mix triggers mid-trade.
Risk control: invalidation levels, channel boundaries, and ATR-based stops
- Invalidation: bull flag invalidates if price breaks and closes below the lower channel and the prior swing support. Bear flag invalidates if price closes above the upper channel and the prior swing resistance.
- Channel stop: place the stop beyond the opposite side of the flag channel, not inside it.
- ATR stop: use a multiple of ATR to avoid noise, such as 1.0 to 1.5 ATR beyond the channel boundary. Size the position so the account risk stays fixed.
A tight flag can still spike. Your stop must sit where the pattern is wrong, not where it feels comfortable.
Target selection: pole projection, structure targets, and trailing approaches
- Pole projection: measure the flagpole height and project it from the breakout point.
- Structure targets: target the next higher timeframe swing level, supply or demand zone, or round number that already caused a reaction.
- Trailing: trail behind higher lows in a bull flag continuation, or lower highs in a bear flag continuation. You can also trail by ATR to stay in strong trends.
Do not force the full pole target if price hits a major level first. Respect nearby structure.
Failure patterns: when a flag becomes a reversal or range
- Deep retrace: the flag gives back most of the pole. That shifts odds toward a range or reversal.
- Channel break with follow-through against the trend: a clean opposite break and close, then a successful retest, often flips the setup.
- Expanding volatility inside the flag: wider swings signal loss of control. Continuation becomes less likely.
- Multiple failed breakouts: several pushes that snap back into the flag often lead to chop.
Treat a failed flag like new information. Do not keep a continuation bias after invalidation.
Trading Plan: Putting Head and Shoulders, Triangles, and Flags Into a Repeatable System
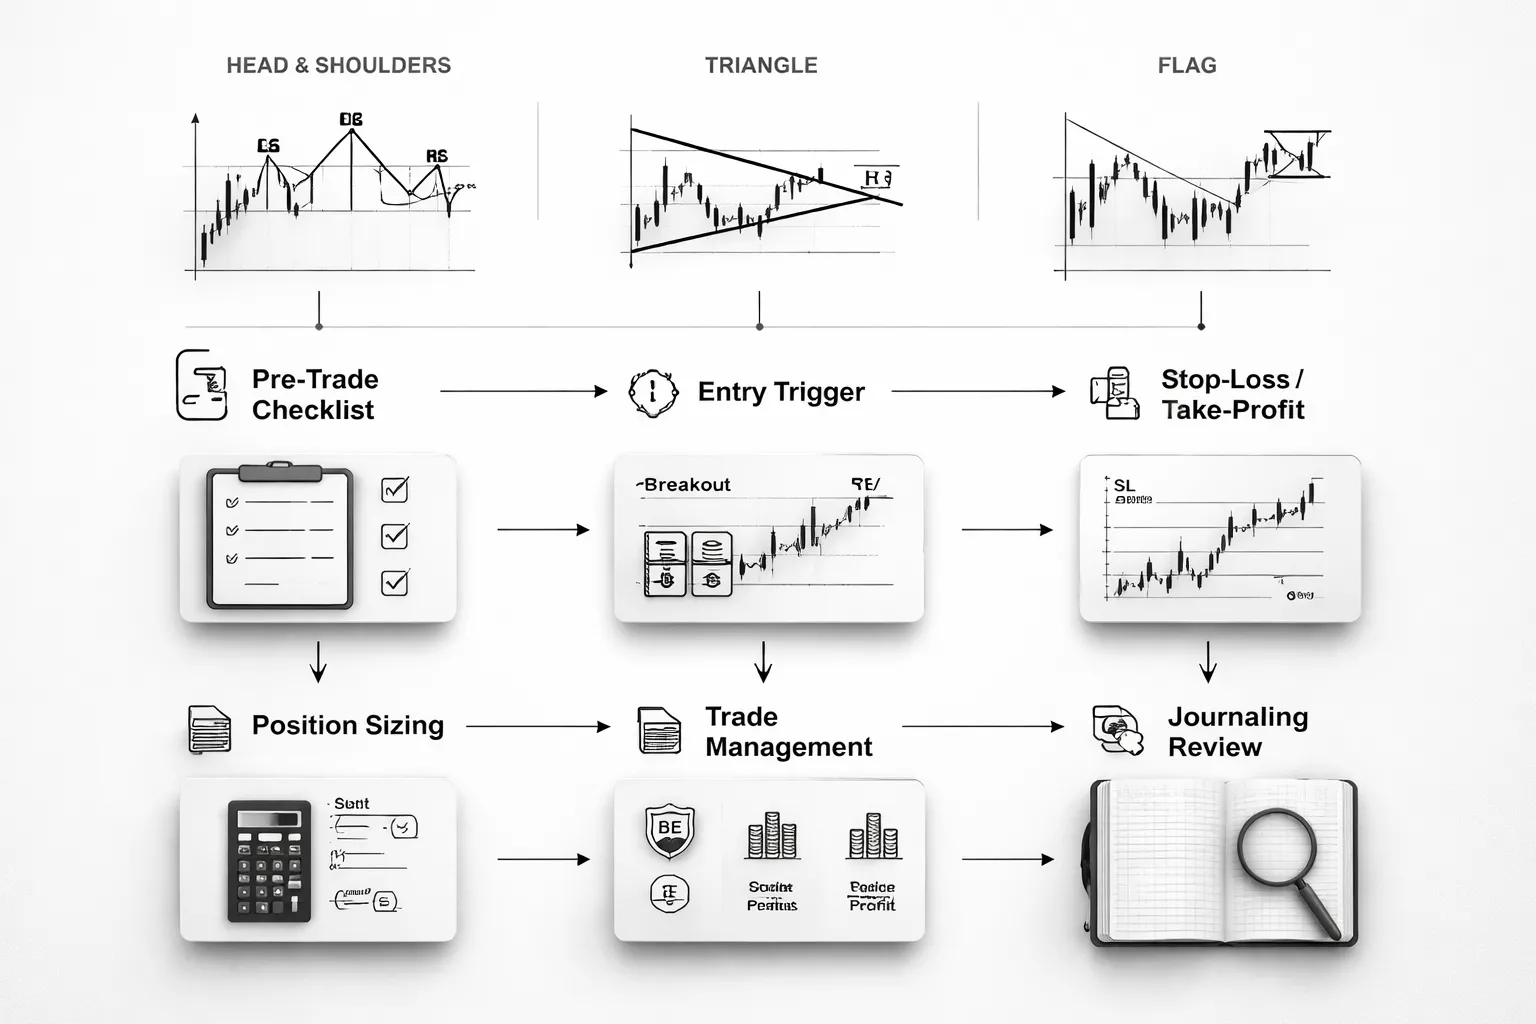
Pre-trade checklist: trend, level, pattern quality, and catalyst awareness
- Trend: Mark the higher time frame bias first. Use D1 or H4. Trade continuation patterns with the trend. Trade head and shoulders as a reversal only after the trend slows and structure breaks.
- Level: Draw the nearest swing high and swing low. Note round numbers and prior day high and low. Avoid taking a breakout straight into a major level.
- Pattern quality: Keep rules strict.
- Head and shoulders: Clear left shoulder, head, right shoulder. Neckline is clean. Right shoulder is weaker than the head. Space between swings is visible, not tight noise.
- Triangles: At least two touches on each side. Trendlines do not cut through many candles. Compression is clear.
- Flags: Strong impulse into the flag. Flag stays contained. Pullback looks controlled. No expanding swings.
- Catalyst awareness: Check the economic calendar. Avoid new entries right before high impact news on either currency. If you trade news, cut size and widen stops based on recent volatility.
Choosing entry triggers: aggressive vs conservative rules
- Aggressive breakout entry: Enter on break and close beyond the pattern boundary on your execution time frame.
- Use when the pattern sits in open space and volatility stays stable.
- Skip when price often spikes and snaps back on that pair and session.
- Conservative retest entry: Wait for break and close, then a retest that holds the broken level, then enter on rejection.
- Use when the level is major or the pair is prone to false breaks.
- Accept that you will miss some trades.
- Trigger rules by pattern:
- Head and shoulders: Trigger after neckline break and close. Conservative entry needs neckline retest that fails.
- Triangles: Trigger after trendline break and close. Conservative entry needs a pullback to the broken line that holds.
- Flags: Trigger after break of the flag boundary in the trend direction and close. Conservative entry needs a retest of the flag edge.
Position sizing basics: risk per trade, pip value, and leverage caution
- Risk per trade: Set a fixed percentage. Many traders use 0.25% to 1% per trade. Do not change it based on confidence.
- Define R: 1R equals the money you risk if the stop hits.
- Lot size formula: Position size equals account risk in currency divided by stop size in pips times pip value.
- Pip value check: Pip value changes with pair and account currency. Confirm it in your platform before you place the order.
- Leverage caution: High leverage does not change your edge, it increases error cost. Keep margin usage low so one spike does not force a liquidation.
Stop-loss and take-profit templates: clear if/then rules
- Stop placement templates:
- Head and shoulders short: If you enter on neckline break, place stop above the right shoulder swing high. If you enter on retest, place stop above the retest rejection high.
- Inverse head and shoulders long: If you enter on neckline break, place stop below the right shoulder swing low. If you enter on retest, place stop below the retest rejection low.
- Triangle breakout: Place stop beyond the last swing inside the triangle, on the opposite side of your trade. Avoid stops inside the triangle.
- Flag continuation: Place stop beyond the opposite side of the flag, or beyond the most recent swing that defines the flag. If price breaks the other side, the setup failed.
- Take-profit templates:
- Measured move: Head and shoulders target equals head to neckline distance projected from the break. Triangle target equals the base height projected from the break. Flag target often uses the impulse leg length.
- Structure target: First target at the next major swing level. If that level sits before your measured move, take partial profit there.
- If then rules: If the next level sits less than 1R away, skip the trade. If spread or session volatility makes your stop too tight, reduce size or pass.
- Execution detail: For step-by-step placement, use this guide on how to place a stop loss in forex.
Managing the trade: breakeven moves, partial profits, and trailing stops
- Breakeven rule: Move stop to breakeven only after price closes beyond a clear decision point, like a retest hold or a broken level turning into support or resistance. Do not move to breakeven just because you feel risk.
- Partial profits:
- Take 25% to 50% at 1R if the next major level is close or volatility is high.
- Keep the rest for the measured move or the next structure level.
- Trailing stop options:
- Swing trail: Trail behind new swing highs in shorts, or swing lows in longs, on the execution time frame.
- Level trail: Trail behind reclaimed levels after each break and retest in your favor.
- ATR trail: Use a fixed multiple of ATR only if you track it consistently and test the settings on your pair.
- Failure response: If price breaks back into the pattern and closes inside it, cut the trade or tighten risk based on your plan. Do not hold and hope.
Journaling and review: how to improve pattern execution over time
- Record the same fields every trade: Pair, session, time frame, trend direction, pattern type, entry trigger used, stop size in pips, risk in currency, target type, result in R, screenshots before and after.
- Tag common errors: Early entry, late entry, stop inside structure, ignored level, traded into news, moved stop too soon, took profit too soon.
- Track simple stats: Win rate, average win in R, average loss in R, expectancy, and maximum losing streak.
- Review cadence: Review weekly for execution errors. Review monthly for strategy changes. Change one rule at a time.
- Build your playbook: Save your best examples of each pattern. Write the exact trigger, stop, and exit that worked. Trade those conditions more. Drop the rest.
Tools and Indicators That Complement Forex Chart Patterns (Without Overfitting)
Market Structure Tools: Swing Points, Trend Filters, Higher Timeframe Bias
Patterns work best when you place them inside clear structure. Keep it simple.
- Swing points: Mark the last two swing highs and swing lows. Trade patterns that break and hold beyond a real swing, not a minor wiggle.
- Trend filter: Use one filter. A common choice is price vs. the 200 EMA on your trading timeframe. Trade continuation patterns with the trend. Trade reversals only at major swing levels.
- Higher timeframe bias: Define bias from one higher timeframe, like 4H for 1H trades, or Daily for 4H trades. Bias = higher timeframe structure, not your opinion. If the higher timeframe makes higher highs and higher lows, treat bearish patterns as lower probability.
Volatility Tools: ATR for Stops, Targets, Session Expectations
ATR gives you a volatility ruler. It stops you from using arbitrary stops and targets.
- Stops: Place the stop beyond the pattern invalidation point, then check it against ATR. If your stop is far smaller than recent ATR, you will get clipped. If it is far larger, your R multiple collapses.
- Targets: Compare your target distance to ATR. If your take profit needs 3x today’s ATR to hit, expect low hit rate unless you hold for multiple sessions.
- Session expectations: Track average range by session for your pair. London and New York often expand range. Asia often compresses. Trade breakouts when range expands, trade mean reversion and flag pullbacks when range contracts.
Use one ATR setting and keep it fixed. Do not optimize it per pair and timeframe. That is overfitting.
Momentum Confirmation: RSI and MACD Use Cases and Common Mistakes
Momentum indicators should confirm the story. They should not create it.
- RSI use cases: Look for divergence at key structure. Example, head and shoulders forms, price makes a marginal higher high on the right shoulder, RSI makes a lower high. Use it as a warning, then wait for your pattern trigger.
- MACD use cases: Use it to confirm trend strength. In triangles and flags, you want momentum to rebuild after consolidation. A fresh MACD histogram expansion after the break can confirm follow-through.
- Common mistakes: Treating overbought and oversold as sell and buy signals. Using divergence everywhere. Changing RSI length per pattern. Taking a pattern trade because RSI crossed 50 while structure disagrees.
Volume in Forex: Tick Volume Limits and Practical Alternatives
Spot forex has no central volume. Your platform shows tick volume. It tracks activity, not total traded size.
- How to use tick volume: Compare volume relative to recent bars. In breakouts, you want expansion. In flags, you want contraction during the pullback, then expansion on continuation.
- Limits: Tick volume differs by broker. Do not build rules that depend on exact volume values.
- Practical alternatives: Use range and close location. A wide bar that closes near the high on the breakout tells you more than a perfect volume threshold. You can also use time of day as a proxy for liquidity and follow-through.
Confluence Stacking: How Many Signals Are Too Many?
Confluence helps when each signal answers a different question. It hurts when signals repeat the same information.
- Use 3 checks max: Structure, volatility, momentum. If all three align, you have enough.
- Avoid duplicates: RSI, MACD, and Stoch all measure momentum. Pick one.
- Write hard rules: List what must be true to take the trade, and what blocks the trade. If you cannot explain the filter in one sentence, drop it.
- Test filters like trades: Add one filter, track expectancy change over a large sample, then keep or remove it. Use the same process you use to backtest a forex strategy.
Your goal is fewer, cleaner decisions. Most overfitting starts when you keep adding “one more” condition to avoid losses.
Risk, Limitations, and Real-World Considerations (E-E-A-T)
No Pattern Is Guaranteed, Think in Probability and Expectancy
A head and shoulders, triangle, or flag does not “work.” Your execution works.
You need two numbers, win rate and average win versus average loss.
Expectancy tells you if a pattern plus your rules has an edge.
Expectancy (per trade) = (Win rate x Avg win) - (Loss rate x Avg loss)
Most patterns fail often. You survive by keeping losses small and consistent. You grow by taking the same setup many times, with the same risk.
Macro Events Can Break Clean Patterns
Central bank decisions, CPI, and NFP can override any chart structure. Price can gap, spike, or reverse without respecting your levels.
- Central banks: Rate decisions, guidance, and press conferences can shift trends in minutes.
- CPI: Inflation surprises can reprice an entire currency fast.
- NFP: Liquidity can thin out, spreads can widen, and stops can fill worse than planned.
- Surprise spikes: Headlines, geopolitics, and risk-off moves can invalidate the “textbook” breakout.
Decide upfront how you handle event risk. You either avoid entries near scheduled news, reduce size, widen stops with smaller position size, or accept the volatility and trade it by design.
Backtesting and Live Execution Are Not the Same
Many pattern tests look great on charts and fail in real fills. Your edge must survive costs and execution.
- Sample size: A few trades prove nothing. Test across different market regimes and years.
- Spread: Breakouts often trigger at the worst time, when spreads widen. Include realistic spreads in your test.
- Slippage: Stops and entries can fill worse during fast moves. Model slippage, especially around news.
- Execution rules: Define the exact entry, stop, and target. “Enter on the break” is vague. Vague rules create fake results.
- Timeframe and session: Results can change by session. London and New York behave differently from late day ranges.
Use fixed risk per trade. Track MAE and MFE. If you cannot place a clean stop, you do not have a trade. Use a simple stop process, see how to place a stop loss.
Common Trader Pitfalls That Kill Pattern Trading
- Cherry-picking: You remember the clean winners and forget the messy losers. Log every trade and review the full set.
- Hindsight bias: You “see” the pattern after price moves. Force yourself to mark the level that confirms the setup before it happens.
- Pattern forcing: You redraw trendlines or ignore wicks to make a triangle fit. If the structure is unclear, skip it.
- Moving targets: You change exits mid-trade because price feels strong or weak. Write your exit plan before entry.
- Risk creep: You increase size after losses or after a win streak. Keep position size rules fixed.
Risk Disclaimer and Suitability
Forex trading involves leverage. Leverage can magnify gains and losses. Many retail traders lose money, often from oversizing and poor risk control.
Match the strategy to your skill and account size.
- If you are new: Trade small, use simple rules, and focus on one pattern and one market.
- If you trade live: Assume you will face slippage, spread spikes, and missed fills. Size your risk so one bad fill does not damage your account.
- If you cannot follow rules: Do not trade the pattern. The pattern will not fix discipline.
This content is educational. It is not financial advice. You are responsible for your decisions and risk.
Frequently Asked Questions
Do forex chart patterns work?
Sometimes. Patterns reflect order flow, but they fail often. Your edge comes from rules, not the drawing. Track results in your market and timeframe. Aim for a large sample, at least 50 to 100 trades, before you trust a setup.
What timeframe is best for head and shoulders, triangles, and flags?
Use one timeframe you can trade consistently. Higher timeframes reduce noise but give fewer trades. Lower timeframes increase costs and false breaks. Many traders start on H1 to H4, then adjust based on spreads, sessions, and your execution.
How do you confirm a head and shoulders pattern?
Mark the neckline, then wait for a close beyond it. Avoid early entries inside the right shoulder. Use a clear invalidation level above the right shoulder high for shorts, or below the low for inverse patterns. Skip messy, uneven shoulders.
How do you trade triangle breakouts without getting trapped?
Trade breakouts only when price compresses with clean touches. Wait for a candle close outside the triangle. Place your stop beyond the opposite side or beyond the last swing. Avoid entries during news spikes and low liquidity sessions.
How do you measure targets for patterns?
Use simple measured moves. Head and shoulders, measure head to neckline, project from the break. Triangles, use the base height. Flags, use the flagpole. Treat targets as zones, then manage exits with structure and your risk rules.
Where should you place your stop loss?
Place the stop where the pattern breaks. Head and shoulders, beyond the right shoulder. Triangles, beyond the last swing inside the pattern. Flags, beyond the flag structure. Do not place stops inside obvious liquidity pools near equal highs or lows.
What risk to reward should you use with chart patterns?
Use a ratio that fits the pattern and volatility. Many traders target 1R to 3R, but your win rate decides what works. Log your trades and adjust. Learn the basics in risk reward ratio.
Do patterns work better in trending or ranging markets?
Flags work best in trends. Triangles can work in both, but perform better when a strong trend feeds into the squeeze. Head and shoulders often marks exhaustion after a trend. Avoid forcing reversal patterns inside strong momentum moves.
What are the biggest mistakes traders make with these patterns?
- Trading before confirmation.
- Ignoring spread, slippage, and session liquidity.
- Placing stops too tight for volatility.
- Skipping a defined invalidation point.
- Changing rules mid trade.
- Overtrading every “almost” pattern.
Are forex chart patterns different from stock patterns?
The shapes look similar. The drivers differ. Forex reacts more to macro news, rates, and session flows. Costs matter more for short term trades. Test your rules on the exact pair, broker conditions, and timeframe you plan to trade live.
How many trades do you need to validate a pattern strategy?
Start with 50 trades per pattern and timeframe. 100 is better. Track entry type, stop size, session, spread, and outcome in R. If results depend on one or two outlier wins, your strategy lacks robustness.
Conclusion
Conclusion
Chart patterns help you structure trades. They do not predict price. Your edge comes from rules you can test and repeat.
- Define the pattern. Write exact criteria for head and shoulders, triangles, and flags. If two traders can label it differently, you will not get stable results.
- Standardize execution. Use one entry trigger, one stop method, and one exit plan. Keep position sizing fixed in R so you can compare trades.
- Track what changes results. Pair, session, spread, and volatility regime. Most pattern edges fade when costs rise or conditions shift.
- Validate with volume. Log at least 50 trades per pattern and timeframe, 100 if you can. Drop any setup that depends on a few large wins.
Final tip. Pick one pattern, one pair, and one timeframe. Backtest it, then forward test it with small size. If your average R stays positive after costs, scale up and keep your risk-reward ratio rules unchanged.
-
Stop Loss vs Take Profit: Differences, Examples & Best Practices
5 months ago -
Forex Trading Psychology Tips: How to Stay Disciplined and Consistent
5 months ago -
Forex Order Types Explained: Market vs Limit vs Stop Orders
5 months ago -
How to Set Stop Loss and Take Profit (Step-by-Step)
5 months ago -
How to Start Forex Trading Step by Step (Beginner Roadmap)
5 months ago
-
-
- Drawing rules, swings, pivot points, and clean trendlines
- Support and resistance mapping, where patterns gain meaning
- Confirmation signals, candle close, retest, and momentum alignment
- Quality checklist, symmetry, slope, volatility contraction and expansion
- Common misreads, confusing consolidation with a real setup
-
- Core anatomy: flagpole, consolidation channel, and continuation bias
- Bull flag mechanics: controlled pullback in an uptrend
- Bear flag mechanics: relief rally in a downtrend
- Flags vs pennants: how to tell them apart quickly
- High-probability conditions: strong impulse, orderly pullback, and tight ranges
- Entry options: breakout, pullback entry, and trend continuation confirmation
- Risk control: invalidation levels, channel boundaries, and ATR-based stops
- Target selection: pole projection, structure targets, and trailing approaches
- Failure patterns: when a flag becomes a reversal or range
-
- Pre-trade checklist: trend, level, pattern quality, and catalyst awareness
- Choosing entry triggers: aggressive vs conservative rules
- Position sizing basics: risk per trade, pip value, and leverage caution
- Stop-loss and take-profit templates: clear if/then rules
- Managing the trade: breakeven moves, partial profits, and trailing stops
- Journaling and review: how to improve pattern execution over time
-
- Market Structure Tools: Swing Points, Trend Filters, Higher Timeframe Bias
- Volatility Tools: ATR for Stops, Targets, Session Expectations
- Momentum Confirmation: RSI and MACD Use Cases and Common Mistakes
- Volume in Forex: Tick Volume Limits and Practical Alternatives
- Confluence Stacking: How Many Signals Are Too Many?
-
- Do forex chart patterns work?
- What timeframe is best for head and shoulders, triangles, and flags?
- How do you confirm a head and shoulders pattern?
- How do you trade triangle breakouts without getting trapped?
- How do you measure targets for patterns?
- Where should you place your stop loss?
- What risk to reward should you use with chart patterns?
- Do patterns work better in trending or ranging markets?
- What are the biggest mistakes traders make with these patterns?
- Are forex chart patterns different from stock patterns?
- How many trades do you need to validate a pattern strategy?
-
-
- Drawing rules, swings, pivot points, and clean trendlines
- Support and resistance mapping, where patterns gain meaning
- Confirmation signals, candle close, retest, and momentum alignment
- Quality checklist, symmetry, slope, volatility contraction and expansion
- Common misreads, confusing consolidation with a real setup
-
- Core anatomy: flagpole, consolidation channel, and continuation bias
- Bull flag mechanics: controlled pullback in an uptrend
- Bear flag mechanics: relief rally in a downtrend
- Flags vs pennants: how to tell them apart quickly
- High-probability conditions: strong impulse, orderly pullback, and tight ranges
- Entry options: breakout, pullback entry, and trend continuation confirmation
- Risk control: invalidation levels, channel boundaries, and ATR-based stops
- Target selection: pole projection, structure targets, and trailing approaches
- Failure patterns: when a flag becomes a reversal or range
-
- Pre-trade checklist: trend, level, pattern quality, and catalyst awareness
- Choosing entry triggers: aggressive vs conservative rules
- Position sizing basics: risk per trade, pip value, and leverage caution
- Stop-loss and take-profit templates: clear if/then rules
- Managing the trade: breakeven moves, partial profits, and trailing stops
- Journaling and review: how to improve pattern execution over time
-
- Market Structure Tools: Swing Points, Trend Filters, Higher Timeframe Bias
- Volatility Tools: ATR for Stops, Targets, Session Expectations
- Momentum Confirmation: RSI and MACD Use Cases and Common Mistakes
- Volume in Forex: Tick Volume Limits and Practical Alternatives
- Confluence Stacking: How Many Signals Are Too Many?
-
- Do forex chart patterns work?
- What timeframe is best for head and shoulders, triangles, and flags?
- How do you confirm a head and shoulders pattern?
- How do you trade triangle breakouts without getting trapped?
- How do you measure targets for patterns?
- Where should you place your stop loss?
- What risk to reward should you use with chart patterns?
- Do patterns work better in trending or ranging markets?
- What are the biggest mistakes traders make with these patterns?
- Are forex chart patterns different from stock patterns?
- How many trades do you need to validate a pattern strategy?
-
How to Place a Forex Trade Step by Step (Your First Trade Explained)
3 months ago -
Forex Trading vs Crypto Trading: Which Market Is Better for Beginners?
3 months ago -
Forex Lot Size Calculator: How to Use It to Size Trades Correctly
5 months ago -
How to Calculate Position Size in Forex (Position Sizing Formula + Examples)
5 months ago -
Forex Leverage Explained: How It Works, Pros, Cons & Examples
5 months ago
-
Forex Trading Platforms Comparison: MetaTrader vs cTrader vs TradingView
5 months ago -
Is Forex Trading Legal in the United States? Rules, Regulators & What to Know
5 months ago -
Stop Loss vs Take Profit: Differences, Examples & Best Practices
5 months ago -
Forex Market Hours & Trading Sessions Explained (Best Times to Trade)
5 months ago -
Forex Leverage Explained: How It Works, Pros, Cons & Examples
5 months ago