Support and Resistance in Forex: How It Works + Trading Examples

Most forex trades fail for the same reason. You enter where price has no structure. Support and resistance fix that. They mark zones where price often reacts, stalls, or reverses. You use them to plan entries, stop placement, and profit targets.
This guide shows you how support and resistance work in live charts. You will learn how to spot strong levels, draw them fast, and avoid weak lines that break on the first touch. You will also learn common trade setups, including bounces, breakouts, and retests, with clear rules for invalidation.
You will tie each setup to risk control, including where to place exits using stop loss and take profit levels. No theory dumps. Just levels, triggers, and execution.
Key Takeaways
Key Takeaways
- In het kort: Mark support and resistance where price reacted hard, multiple times, with clear swings.
- In het kort: Treat levels as zones, not single lines, and define your invalidation point before entry.
- In het kort: Trade three core setups, bounce, breakout, and retest, each with a specific trigger and stop.
- In het kort: Skip weak levels, those with few touches, messy structure, or lots of cuts through.
- In het kort: Your edge comes from execution, entry trigger, stop placement, and risk control, not from drawing more lines.
- Start with the higher timeframe. Mark the obvious swing highs and swing lows. Then refine on your entry timeframe.
- Count reactions. More clean touches usually means more attention from other traders.
- Reject levels that price slices through. If it broke before, assume it can break again.
- Use a bounce when price hits a level and rejects fast. Enter after a clear rejection candle. Place your stop beyond the zone.
- Use a breakout when price closes beyond the zone with range expansion. Avoid entries on the first spike. Wait for a close and structure shift.
- Use a retest when price breaks, then returns to the level and holds. Enter on the first clean hold. Invalidate if price closes back inside the zone.
- Set take profit at the next major level. If the next level sits too close, skip the trade. Your reward has to justify your risk.
- Keep risk fixed per trade. One bad level should not damage your account. Use clear stop rules; see how to place a stop loss.
What Support and Resistance in Forex Mean (and Why They Matter)
Simple definitions with real-market intuition
Support is a price area where declines often slow or stop because buyers step in.
Resistance is a price area where rallies often slow or stop because sellers step in.
They matter because they give you structure. You get clear places to plan entries, stops, and targets. You reduce random decision-making.
Think in zones, not single lines. Price rarely turns on one exact pip. Your job is to mark the area where reactions repeat.
The order-flow and liquidity explanation
Support and resistance form because orders cluster.
- Limit orders sit at planned prices. Buyers place buy limits near support. Sellers place sell limits near resistance.
- Stop losses cluster past obvious highs and lows. Long stops sit below support. Short stops sit above resistance.
- Breakout orders cluster at the same spots. Buy stops sit above resistance. Sell stops sit below support.
This creates two common outcomes.
- Hold. Limit orders absorb pressure. Price rejects and rotates back into the range.
- Break. Aggressive market orders plus triggered stops overwhelm resting limits. Price pushes through, then may retest the level from the other side.
That is why you often see spikes through a level. Liquidity sits there. The market trades into it, fills orders, then decides direction.
Support and resistance vs supply and demand zones
Support and resistance usually come from swing highs and swing lows. You mark where price turned before.
Supply and demand zones usually come from impulsive moves. You mark the base that launched a strong push.
| Concept | What you mark | How you use it |
|---|---|---|
| Support and resistance | Repeated reaction areas around prior highs and lows | Trade bounces, breaks, and retests with clear invalidation |
| Supply and demand | The origin of a sharp move, often a tight consolidation | Look for first return to the zone, then manage risk tightly |
In practice they overlap. A clean swing high can also be a supply zone. Keep your chart simple. Pick one method to mark levels and apply it the same way each week.
Why levels work across timeframes (and when they fail)
Levels work across timeframes because traders anchor to the same reference points.
- Institutions watch daily and weekly levels for positioning.
- Short-term traders watch intraday highs and lows for entries and stops.
- Algorithms key off prior highs, prior lows, and round numbers.
A level on a higher timeframe usually matters more because it reflects more traded volume and more decisions. A five-minute level can still work, but it fails faster.
Levels fail for specific reasons.
- High-impact news shifts price fast. Spreads widen and stops trigger. Old levels can break without clean structure.
- Strong trend pressure keeps pulling price through levels. You get shallow bounces and quick retests.
- Too many touches weaken a level. Each test consumes resting orders. The next test breaks more often.
- Wrong context. You trade a bounce into a nearby higher-timeframe level and your target has no space.
Use higher-timeframe levels to set the map, then use your entry timeframe to time the trade. If you want a step-by-step process, use a simple multi-timeframe analysis routine and keep your levels consistent.
The Psychology Behind Support and Resistance
How traders remember “important prices” and create self-fulfilling reactions
Traders anchor to obvious highs, lows, and recent turning points. They mark the same zones on their charts. They place orders in the same places.
That clustering creates visible reactions. You see bounces because limit orders sit at the level. You see breaks because stops stack behind the level. You see retests because new traders chase the move after the break.
- Prior swing high or low: traders expect a repeat reaction.
- Range edges: traders buy the floor, sell the ceiling, then flip after a clean break.
- Previous day, week, month high or low: many systems reference them, so liquidity concentrates there.
Support and resistance work best when many traders agree on the level and have room to act. They fail when orders at the level get consumed or when a bigger flow hits the market.
Break-even behavior, trapped traders, and forced exits
After a bounce, late buyers often enter near the top of the move. If price drops back to their entry, they exit at break-even. That selling adds supply right where price returns. The same happens on shorts after a failed breakdown.
Trapped traders amplify moves. A failed breakout traps breakout buyers above resistance. When price snaps back below, they dump to cut losses. Their exits become market sells and they fuel the drop.
Forced exits matter more than opinions. Stops and margin rules create urgency. That urgency turns a level into a fast move.
- Breakout traders: stops often sit just back inside the range.
- Range traders: stops often sit just beyond the range edge.
- Position traders: reduce risk when price closes back through a key level.
This is why levels often break, then retest, then run. First the stops trigger, then the trapped exits hit, then fresh traders enter on the retest.
Why round numbers (00 and 50) attract attention and liquidity
Round numbers act like magnets because traders use them for simple decisions. They set entries at 1.1000. They place stops at 1.0950. They target 1.1050.
Institutions also manage risk around clean numbers because they are easy to communicate and standardize across desks. That concentrates orders and creates deeper liquidity near 00 and 50 levels.
- More resting orders: limit buys, limit sells, take-profits.
- More stop orders: stops for both range and breakout traders.
- More hedging activity: larger players adjust exposure at obvious reference points.
Round numbers do not cause reversals by themselves. They create order density. Price reacts when that order flow meets aggressive buying or selling.
How news and sentiment can override technical levels
Levels reflect current positioning. News changes positioning fast. When a central bank surprises the market, order flow shifts from technical trading to repricing.
During high-impact releases, spreads widen and slippage increases. Liquidity pulls back. A level that holds in normal conditions can break in seconds because fewer resting orders absorb the hit.
- Scheduled news: traders reduce size, move stops, or avoid entries near levels.
- Surprise headlines: stops trigger in clusters and price gaps through zones.
- Strong sentiment trends: pullbacks into resistance sell harder, support breaks more often.
Plan for this. Know the calendar. If you trade around news, widen your margin for error and define your exits with clear rules. Use a proper stop placement process so one spike does not erase your edge, see how to place a stop-loss in forex.
Types of Support and Resistance Levels You’ll See in Forex Charts
Horizontal swing highs and lows (classic structure levels)
These are the cleanest support and resistance levels. You mark obvious turning points where price rejected and reversed.
- Swing high resistance: a peak where buyers failed and sellers took control.
- Swing low support: a trough where sellers failed and buyers stepped in.
- Use zones, not single lines: spreads, wicks, and volatility make exact prices unreliable.
- Prioritize levels with multiple reactions: two to three clean touches beats one extreme spike.
- Respect the “flip”: broken resistance often acts like support on the retest, and broken support often caps price on the retest.
Dynamic areas from trendlines and channels
Trendlines and channels track slope. They work best in clean trends with consistent pullbacks.
- Build from swings: connect at least two swing lows in an uptrend, or two swing highs in a downtrend.
- Validate with a third touch: two points draw a line, the third touch gives it trading value.
- Use a channel for targets: after drawing the main trendline, copy it to the opposite side to project likely reaction areas.
- Redraw when structure changes: if price accelerates or starts printing deeper pullbacks, your slope is outdated.
- Avoid forcing perfect fits: if you need to “hunt” for touches, the line is not real to the market.
Moving averages as dynamic reference points
Moving averages can act like floating support and resistance in trends. They lag. Use them as context, not as a signal by themselves.
- When they help: steady trend, repeated pullbacks that respect the same average, clear separation between price and the average.
- When they lag: range markets, sharp reversals, news spikes, and choppy sessions with frequent crosses.
- Best use: treat the average as an area where you look for price action confirmation near a known structure level.
- Keep settings consistent: do not optimize periods to “fit” the last week of data. Pick one approach and test it.
Fibonacci retracement zones (how to avoid overfitting)
Fibonacci levels often cluster with real structure. Alone, they do not predict reversals. Use them to refine an already valid level.
- Anchor correctly: measure the clear impulse leg, from swing low to swing high in an up move, and the reverse in a down move.
- Work with zones: the 38.2, 50, and 61.8 areas matter more as a band than as exact prices.
- Avoid overfitting: do not redraw anchors to make price “respect” your level. If the swing is unclear, skip the fib.
- Look for confluence: fib zone plus a prior swing, prior high or low, or a round number carries more weight.
Previous day, week, month high and low and session levels
These levels matter because many traders track them. They also map liquidity.
- PDH and PDL: previous day high and low. Useful for intraday breakouts, stop runs, and reversals.
- PWH and PWL: previous week high and low. Useful for swing context and bigger stop clusters.
- PMH and PML: previous month high and low. Useful as major reference points on higher timeframes.
- Session levels: Asia range high and low, London high and low, New York high and low. Range edges often act like support and resistance during the next session.
- Practical rule: treat these as trigger areas. Wait for a retest or a clear rejection before you commit size.
Pivot points and VWAP-style references (institutional-style anchors)
Pivots and VWAP-based tools create objective levels from price and volume or price ranges. They can reduce subjectivity when your chart looks crowded.
- Daily pivots: central pivot with support and resistance bands. Works best on liquid pairs during normal volatility.
- Use pivots as maps: they can help you set realistic intraday targets and identify overextended moves.
- VWAP-style anchors: anchored VWAP from a major swing, a weekly open, or a session open. Price often reacts around the mean in balanced conditions.
- Know the limit: in strong trends, price can ride away from VWAP. Do not fade trend strength because price is “far” from VWAP.
Multi-timeframe “major” vs “minor” levels (how to label them)
Your level is only as strong as the timeframe that created it. You need a labeling system so you do not treat every line the same.
- Major levels: drawn from weekly and daily swings, previous week and month highs and lows, and long-held range boundaries. You trade these with more patience and wider invalidation.
- Minor levels: drawn from 4H and 1H swings, intraday ranges, and session highs and lows. You trade these for tighter setups and smaller targets.
- Label by source: write “D1 swing high,” “PDL,” or “H1 range high.” This stops you from mixing signals.
- One chart rule: keep only the levels you can explain. If you cannot state why a line exists, remove it.
- Top-down workflow: mark major levels first on higher timeframes, then refine entries on lower timeframes. This fits cleanly with basic concepts in technical analysis in forex.
How to Identify High-Quality Support and Resistance Zones (Step-by-Step)
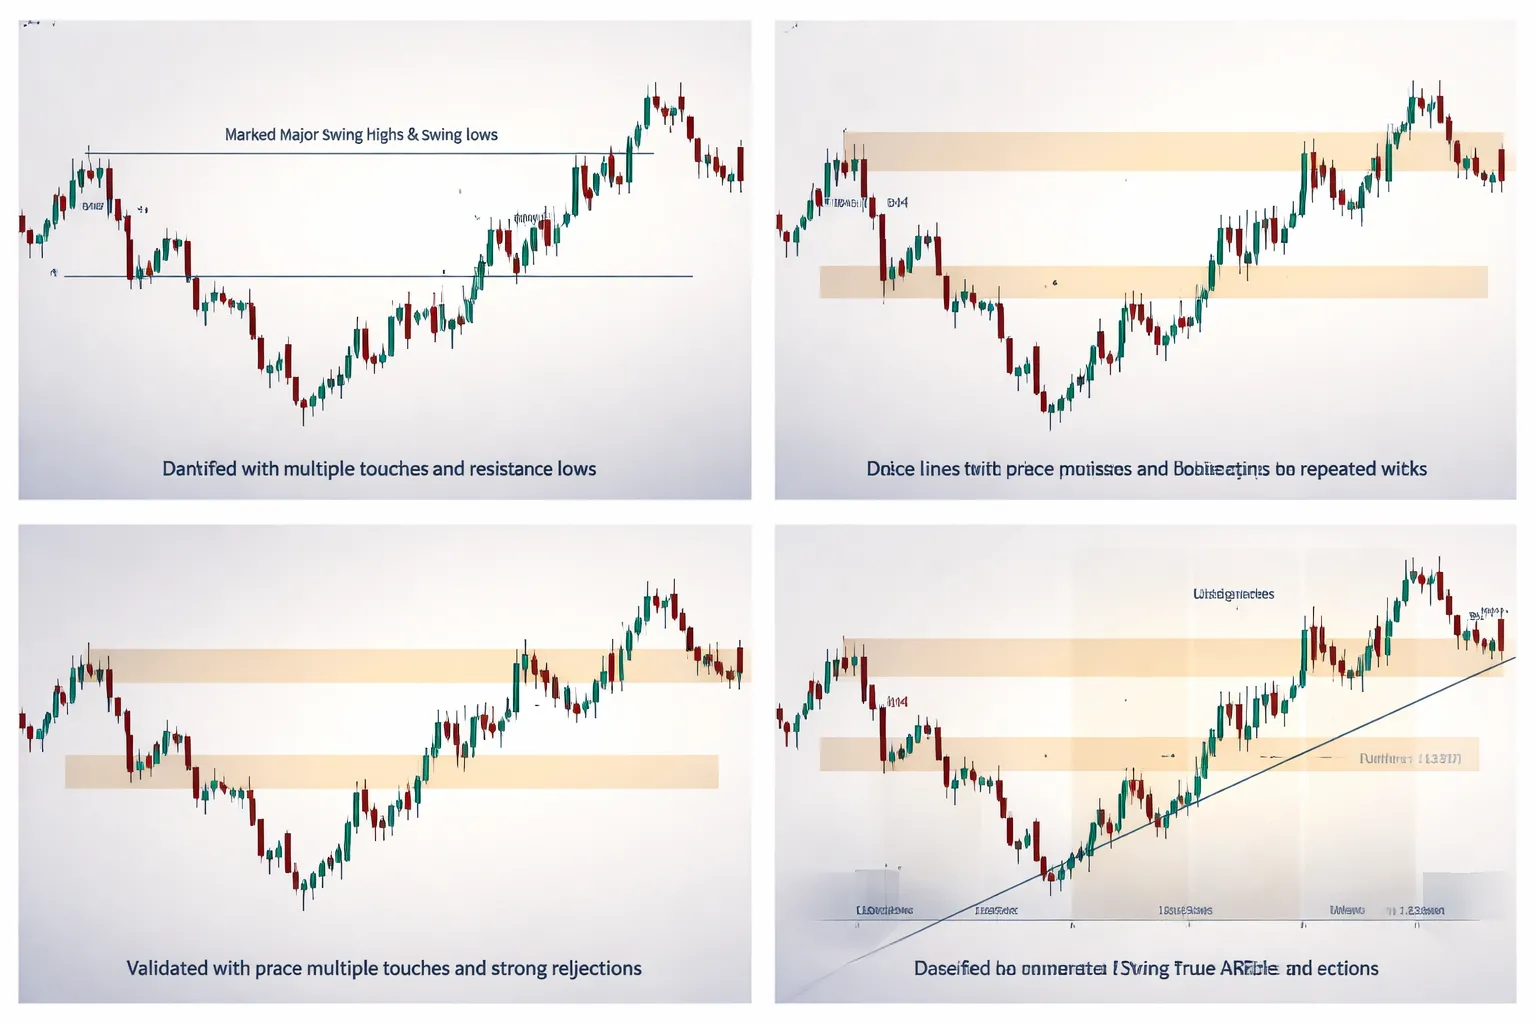
1) Start high, mark the obvious turning points
Open the higher timeframe first. Start with D1, then H4. Mark the swing highs and swing lows that changed direction fast and left a clear pivot.
- Mark the last major swing high and swing low.
- Mark the base of strong moves, where price paused then expanded.
- Mark prior day high and low if you trade intraday.
- Keep it sparse. If you need to zoom in to justify a level, you do not have a level.
2) Draw zones, not perfect lines
Support and resistance rarely sit on one price. They sit in an area. Draw a zone that covers where most reactions start, not the single extreme wick.
- Use candle bodies for the core of the zone.
- Add wicks only if price reacts from them more than once.
- Extend the zone to the right. Stop extending left once the structure becomes irrelevant.
3) Validate with touches and reaction strength
Count how price behaved at the zone. You want evidence of order flow, not a random stop.
- Touches: Two clean reactions can qualify. Three or more raises confidence, if the touches are spaced out.
- Reaction strength: Look for impulse away from the zone, large candles, or a fast rejection with follow-through.
- Clean approaches: A level works better when price approaches in a straight move, not after choppy back-and-forth.
- Time spent: If price sits inside the zone for long, the level weakens. It turns into a range, not a wall.
4) Measure zone width using volatility and wick frequency
A tight zone in a volatile pair fails. A wide zone in a calm session gives poor entries. Size it to current volatility.
- Check ATR on your trading timeframe. Use it as a reality check for how far price typically moves per candle or per day.
- Start with a narrow core around the bodies. Widen it only to include repeated wick turns.
- If wicks often pierce the level before reversing, widen the zone. If wicks rarely pierce it, keep it tight.
| Market condition | What you see at the level | How to set zone width |
|---|---|---|
| High volatility | Frequent wick spikes, larger candles | Wider zone, accept deeper taps |
| Low volatility | Small candles, tight swings | Tighter zone, expect cleaner bounces |
| News window | Fast breaks and snapbacks | Widen or stand aside until structure returns |
5) Spot fresh vs tested levels, and why fresh is not always better
A fresh level has not been revisited since the impulse left it. A tested level has seen multiple returns.
- Fresh: Often gives the first clean reaction. It can also fail fast because you have no recent confirmation.
- Tested: Offers proof of reaction. It can weaken after each touch as orders get filled.
- Prefer fresh levels when the move away was strong and clean.
- Prefer tested levels when each touch rejects hard and price does not accept inside the zone.
6) Find confluence without clutter
Confluence means two or three simple reasons line up. Do not stack indicators. Use structure first, then add one or two filters.
- Structure: swing high, swing low, range boundary, prior day high or low.
- Trend context: in an uptrend, prioritize support buys. In a downtrend, prioritize resistance sells.
- Round numbers: prices ending in 00 or 50 often attract orders. Use them as a secondary check.
- Time-of-day: London and New York opens can trigger breaks or rejections. Give more weight to reactions that occur during liquid hours.
Keep one chart rule. If confluence forces you to draw five extra lines, you lose clarity. You want fewer zones with higher intent.
7) Common drawing mistakes that ruin level quality
- Forcing lines: drawing a level because you want a trade. If price did not react clearly, skip it.
- Ignoring context: marking a level without trend, volatility, and session awareness. A level in chop behaves differently than a level in trend.
- Anchoring to noise: using tiny swings on low timeframes to build major zones. Start high, then refine.
- Using extremes only: anchoring every zone to a single wick. Wicks matter, repeated behavior matters more.
- Too many levels: turning the chart into a grid. If every price is a level, no price is a level.
Trend Context: Using Support and Resistance in Uptrends, Downtrends, and Ranges
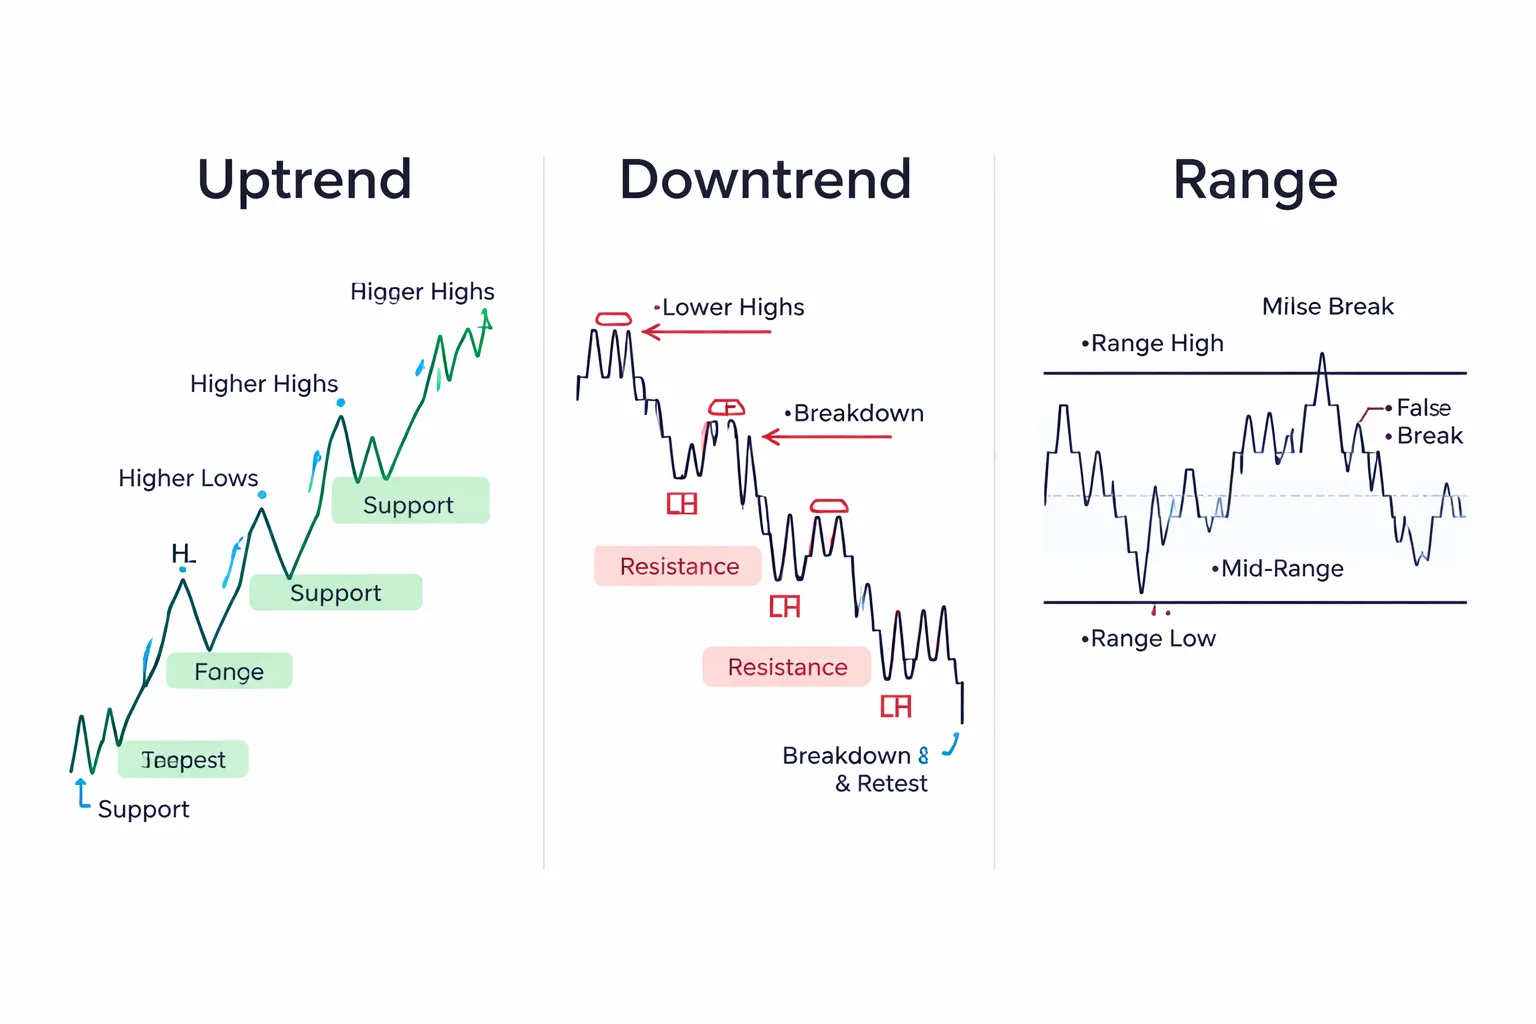
Uptrend mapping: higher highs, higher lows
In an uptrend, support matters more than resistance. Your key levels sit under price.
- Mark the swing lows that formed before each push to a new high. Those lows often become pullback floors.
- Draw a support zone across the bodies and multiple touches, not a single wick.
- Expect pullbacks to stall at the prior breakout area, the last higher low, or the next higher timeframe support zone.
- Treat the most recent high as resistance, but do not fade it just because it is “resistance”. In an uptrend, highs break often.
Practical filter. If price holds above the last higher low, you stay in pullback mode. If price closes below it and fails to reclaim it, you shift to trend damage.
Downtrend mapping: lower highs, failing rallies
In a downtrend, resistance matters more than support. Your key levels sit above price.
- Mark the swing highs that formed before each selloff. Those highs often become rally ceilings.
- Build resistance zones where price rejected more than once. Prior support often flips into resistance after a breakdown.
- Expect rallies to fail near the last lower high, the breakdown level, or a higher timeframe supply zone.
- Treat recent lows as support, but avoid buying them by default. In a downtrend, lows can keep breaking.
Practical filter. If price stays below the last lower high, you stay in rally mode. If price closes above it and holds, you watch for a shift to range or reversal.
Range behavior: boundaries, mid-range magnet, false breaks
In ranges, support and resistance act like walls. Price rotates between them.
- Define the range using the clearest repeated highs and lows on your main timeframe.
- Mark the mid-range. Price often snaps back to it after runs to either edge. It becomes a common stall point and take-profit area.
- Expect false breaks at both edges. Many breakouts poke past the boundary, then close back inside.
- Trade location. Entries near the edges give you clear invalidation. Entries in the middle give you noise.
If you want a structured approach for ranges, use a dedicated range trading strategy with fixed rules for entries, stops, and exits.
How to avoid trading against the dominant trend by accident
Most “support and resistance” mistakes come from mixing contexts. Use a simple checklist.
- Start one timeframe higher than your entry chart and label the market. Uptrend, downtrend, or range.
- Align your bias with structure. Higher highs and higher lows means you prioritize long setups at support. Lower highs and lower lows means you prioritize short setups at resistance.
- Do not countertrend trade at first touch in a strong trend. Wait for clear rejection and follow-through, or skip it.
- Use one invalidation level. If your trade idea dies when a key swing breaks, you have a clean exit. If you need three levels to “be sure”, you are guessing.
- Limit your levels. Too many zones push you into constant trades. That feeds overtrading.
When a range becomes a trend: early clues
Ranges end. You want evidence, not hope.
- Multiple closes outside the range. A single spike means little. Repeated closes show acceptance.
- Break and hold. Price breaks the boundary, then holds above it in an up move, or below it in a down move.
- Retest behavior changes. The old boundary flips role, resistance becomes support in an upside break, support becomes resistance in a downside break.
- New swing structure prints. First higher low after an upside break, or first lower high after a downside break.
- Range mid stops working. In a clean trend, price stops respecting the mid-range and starts trending away from it.
Trading Strategies Using Support and Resistance in Forex
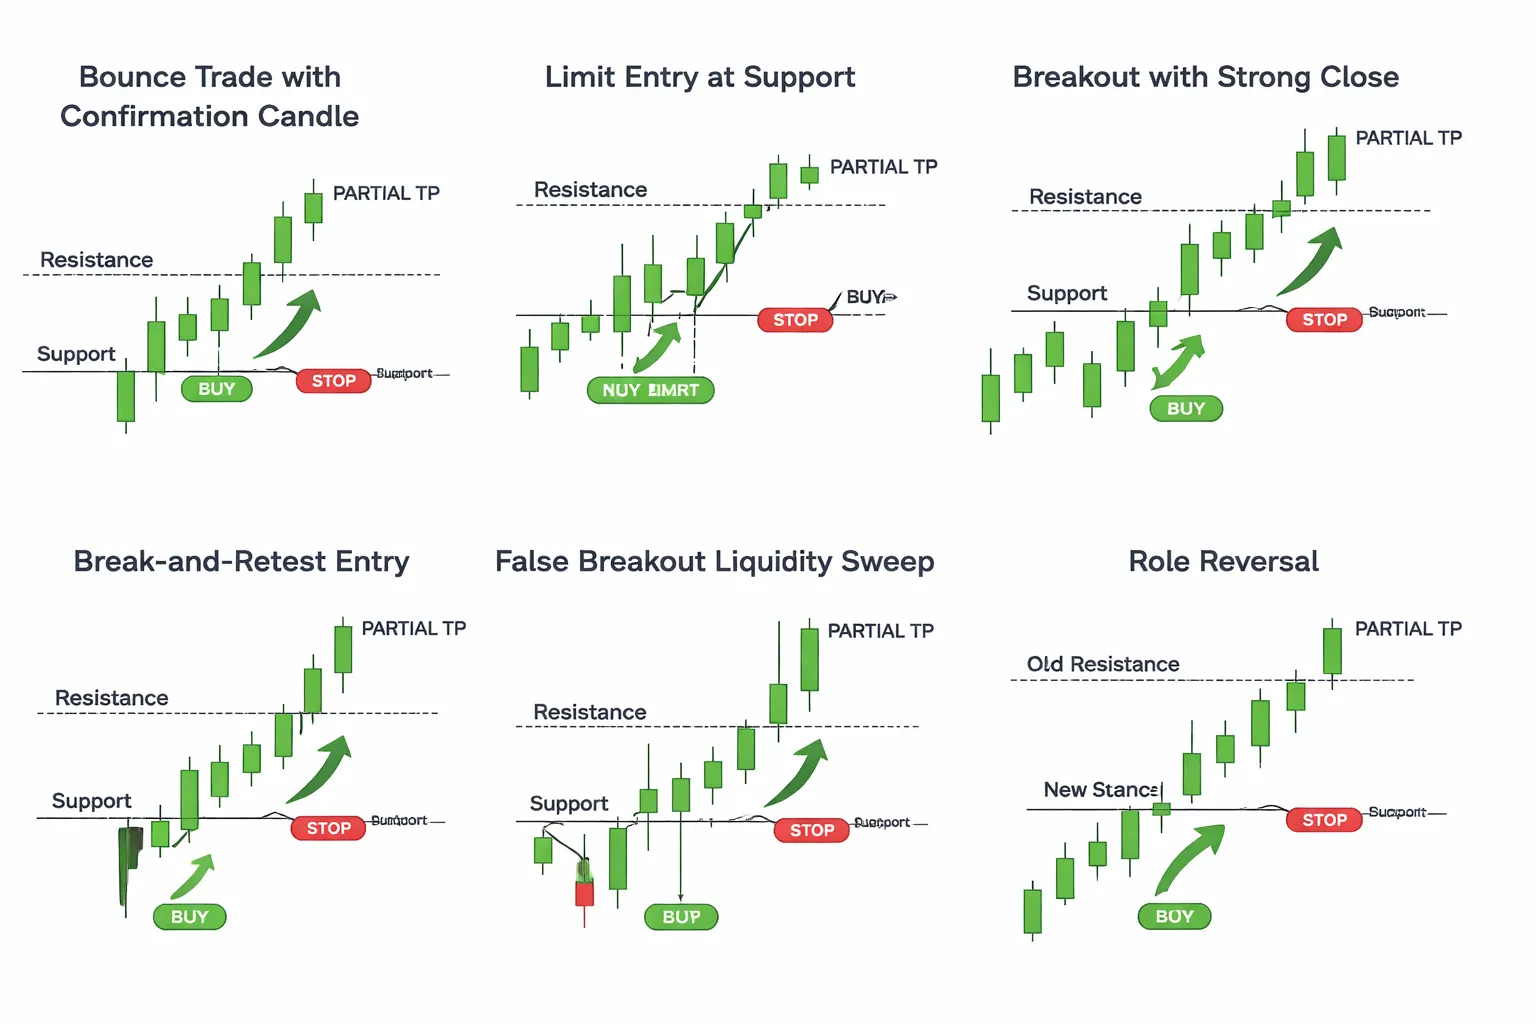
Bounce Trades at Support and Resistance
Bounce trades assume the level holds. Your job is to control where you enter and where you prove yourself wrong.
- Confirmation entry. Wait for a rejection at the level. Look for a clear wick rejection, an engulfing candle, or a break of a minor internal swing. Enter after the signal closes. Place the stop beyond the level and the rejection wick.
- Limit entry. Place a buy limit at support or sell limit at resistance. Use this when the level has produced clean reactions and price approaches with slowing momentum. Place the stop beyond the level. Keep size smaller because you enter without proof.
- When to avoid bounce trades. Skip if price hits the level with strong trend candles, large range expansion, or repeated taps that weaken the level.
Targets work best at the next obvious boundary. In ranges, scale out near the mid-range, then the far side. In trends, aim for the next swing high or swing low.
Breakout Trades
Breakout trades assume the level fails. You need momentum, a clean close, and room to run.
- Momentum criteria. Look for a wide candle close beyond the level, or multiple candles pressing and then closing through. Volume helps if you have it, but price action comes first.
- Space to target. You want clear air to the next level. If the next support or resistance sits close, the breakout has poor payoff.
- Where to enter. Enter on the close beyond the level, or on the next minor pullback if the candle is extended.
- When to skip. Skip breakouts that close barely beyond the level, break during low liquidity, or run straight into a higher timeframe level.
Break-and-Retest Entries
Break-and-retest trades aim to reduce false breakout risk. You trade the flip after the break.
- Clean retest signs. Price breaks, pulls back quickly, tags the level once, then rejects. The retest prints tight candles, wicks into the level, and closes back in the breakout direction.
- Drifting retest signs. Price leaks back toward the level with overlapping candles and no rejection. This often turns into a full reversal. Reduce size or stand aside.
- Execution. Enter on the rejection close, or use a limit at the retest level after the first rejection. Put the stop beyond the retest swing point, not inside the noise.
False Breakout (Liquidity Sweep) Setups
False breakouts trap late breakout traders. You fade the break after price fails to hold beyond the level.
- What you need. A clear push through support or resistance, then a fast return back inside the prior range. The best sweeps leave a strong wick outside the level and close back inside.
- Entry trigger. Enter after the reclaim closes, or after price breaks the micro structure formed during the sweep.
- Invalidation rule. The setup fails if price accepts beyond the level. Define acceptance as one or two candle closes beyond the level with follow-through. Place the stop beyond the sweep extreme.
- Targets. First target sits at the opposite side of the range or the nearest internal pivot. Take partials early if the move snaps back fast.
Role Reversal Trades
Role reversal means the old boundary flips. Old resistance becomes new support after an upside break. Old support becomes new resistance after a downside break.
- How to confirm the flip. Price returns to the level, holds it, then prints a higher low for bullish flips or a lower high for bearish flips.
- Best entries. Enter on the first clean retest with rejection. The edge drops after multiple retests.
- Stops and targets. Put the stop beyond the level and the retest swing. Target the next higher timeframe level or the next major swing.
Scaling In, Scaling Out, and Partials Near Key Levels
Support and resistance give you natural places to adjust risk. Use levels to manage the trade, not feelings.
- Scale out. Take partial profits at the next level. Reduce risk as price approaches known barriers. In ranges, take more off at mid-range and the opposite boundary.
- Move to protected risk. After price clears the next minor swing in your favor, tighten the stop or move it to a logical structure point. Do not move it to break-even if it sits inside the level noise.
- Scale in. Add only after confirmation. Add on the break of a fresh minor consolidation, or on a clean retest that holds. Keep total risk capped. Do not add if price churns at the level.
- Plan exits. Define your stop and take profit before entry. Use a fixed invalidation point and level-based targets. For a deeper framework, see stop loss vs take profit.
Entry Triggers and Confirmation Signals (What to Look for at the Level)
Candlestick clues at the level
Use candles to time entries, not to “predict.” You want proof that orders sit at the level.
- Pin bar (rejection). Long wick into the level, small body, close back inside the prior range. Stronger if the wick breaks the level and the close returns above support or below resistance.
- Engulfing. The current candle body covers the prior candle body and closes past it. Bullish engulf at support, bearish engulf at resistance. Stronger if it closes near the candle extreme.
- Strong close. For a hold, you want closes away from the level. For a break, you want a clean close beyond the level, not a wick poke.
Skip “pretty” candles that form mid-range. Context matters. The candle must form at the level you marked.
Market structure triggers: BOS and CHOCH
Structure gives you confirmation that control shifted.
- BOS (break of structure). Price breaks the most recent swing high in an up move, or swing low in a down move. Use it as continuation confirmation after a retest.
- CHOCH (change of character). Price breaks the prior swing in the opposite direction of the current leg. Use it as early reversal confirmation at a major level.
Practical entry flow for a reversal at support:
- Price sweeps below support or tags it.
- Price prints a rejection candle and closes back above the level.
- Price makes a CHOCH by breaking the prior minor lower high.
- You enter on the break, or on the first pullback that holds above the level.
Volume and tick-volume cues in spot FX
Spot FX has no centralized volume. Most platforms show tick volume. It measures activity, not true traded size.
- What tick volume can confirm. Relative participation. A breakout that closes beyond the level with higher-than-recent tick volume often shows commitment.
- What it cannot confirm. Exact order flow or “real” institutional size. Do not treat it as proof of accumulation or distribution.
- Useful read. Rising tick volume on the impulse away from the level, then lower tick volume on the pullback, supports a hold and retest setup.
Use volume as a filter, not a trigger. Price still decides.
Momentum filters (RSI, MACD) without indicator dependency
Momentum helps you avoid fighting strong moves. Keep it simple.
- RSI. Use 50 as a regime filter. Longs work better when RSI holds above 50, shorts work better when RSI holds below 50. For reversals, look for RSI to reclaim 50 after support holds, or lose 50 after resistance holds.
- MACD. Use the histogram for momentum shift. Expanding histogram in the trade direction supports continuation. A flip from negative to positive near support can support a long, but only after price confirms.
Do not take trades because RSI hit 30 or 70. Use the level and the close as the primary signal.
Wick vs close: did the level hold or break?
Define your rule before you trade. Most mistakes come from switching rules mid-trade.
- Level held. Price trades into the level but closes back on the expected side. You then want follow-through away from the level or a higher low, or lower high.
- Level broke. Price gets a clean close beyond the level and then holds beyond it. The best breaks retest the level and reject from the other side.
- Stop-run risk. Wicks often pierce obvious lines. Treat a wick through the level as “level noise” unless the close confirms the break.
If you trade breaks, require a close beyond the level. If you trade holds, require a close back inside plus a structure shift. Set the invalidation point first, then pick the order type. If you need a refresher on execution, see order types.
Risk Management for Support and Resistance Trading
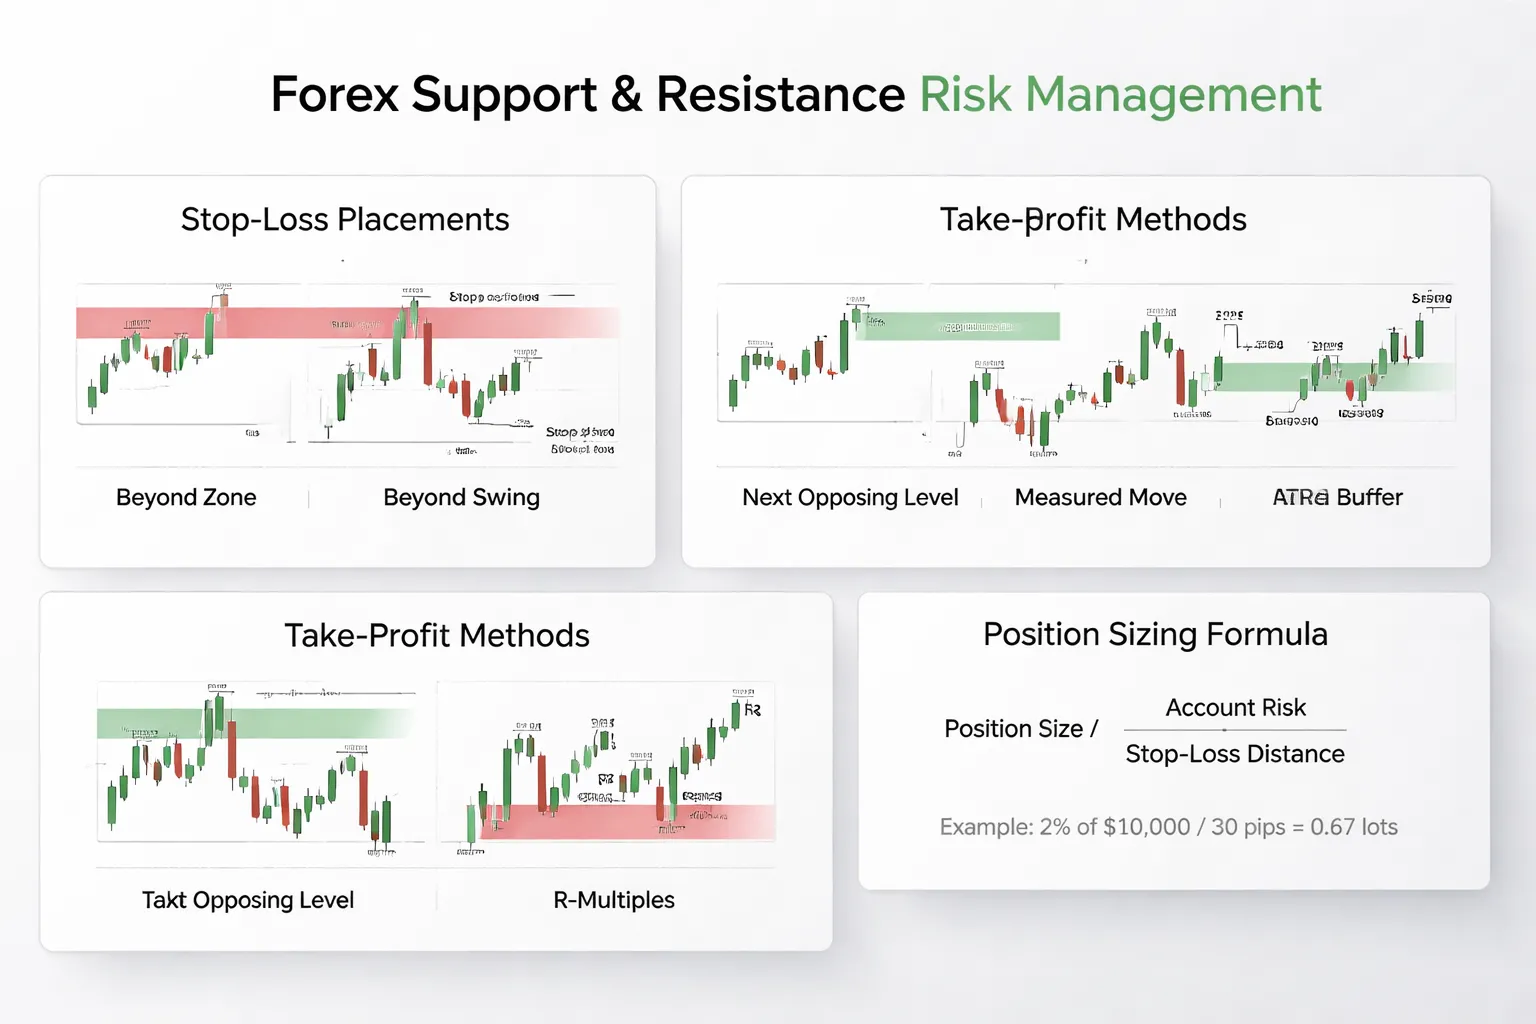
Stop-loss placement
Your stop defines your setup. Place it where the trade idea fails, not where it feels small.
- Beyond the zone: Put the stop outside the support or resistance area, past the furthest edge. Add a buffer so normal noise does not tag it. Use this for clean ranges and well-defined zones.
- Beyond the swing: Put the stop beyond the last swing low for longs, or the last swing high for shorts. Use this when the level aligns with recent structure and you want the market to prove a new low or high before you exit.
- ATR-based buffer: Use an ATR multiple as the buffer beyond the level or swing. Many traders use 0.25 to 1.0 ATR depending on timeframe and pair. Higher volatility needs a wider buffer. Lower volatility allows a tighter one.
Do not move your stop wider after entry. If the stop feels too far, reduce size or skip the trade.
Take-profit planning
- Next opposing level: For a long off support, target the next resistance. For a short off resistance, target the next support. If the next level sits too close, the trade has no room.
- Measured moves: Use the height of the range or the last impulsive leg. Project that distance from the breakout point. This fits breakouts and compression setups.
- R-multiples: Define targets in R, where 1R equals your stop distance. Common plans are partial at 1R, then hold for 2R to 3R into the next level. Keep it consistent across trades.
If you want a deeper guide, see how to set take profit in forex.
Position sizing with fixed risk
Risk a fixed percent of your account per trade. Most retail traders use 0.25% to 2%. Pick one number and stick to it.
- Step 1: Risk amount = Account balance x Risk %.
- Step 2: Stop size in pips = Entry price to stop price, converted to pips.
- Step 3: Position size = Risk amount / (Stop pips x Pip value per unit).
| Example | $10,000 account, risk 1% = $100. Stop = 25 pips. If pip value is $10 per standard lot, size = $100 / (25 x $10) = 0.40 lots. |
Your sizing must match your stop logic. Tight stop, larger size. Wide stop, smaller size. Never reverse that.
Minimum risk-reward guidelines
- Bounces (holds): Aim for at least 1.5R. Many bounce trades fail to reach far targets because price chops inside the range. If you cannot reach 1.5R before the next level, skip it.
- Breakouts: Aim for at least 2R. Breakouts win less often when you require a close beyond the level, so you need bigger winners to compensate. If the next opposing level blocks a 2R path, wait for a pullback entry or pass.
Track your own stats. If your win rate drops, raise your minimum R. If your win rate rises, you can accept slightly smaller R, but do it on data, not comfort.
Spread, slippage, and rollover
- Spread: Spread widens around news, session opens, and thin liquidity. Your stop and target trigger on bid or ask depending on direction. Build spread into your stop buffer, especially on tight levels and low timeframes.
- Slippage: Slippage hits stops and breakout entries most. Reduce it by avoiding market orders during high-impact releases, using limit orders when you can, and trading liquid sessions. Assume worse fills in your backtests, not best-case fills.
- Rollover and swaps: Holding past the daily rollover can add or subtract swap. It can also widen spreads for a short window. If your target sits close and rollover approaches, either take profit early or reduce risk.
Trading Examples: Support and Resistance in Forex (Walkthroughs)
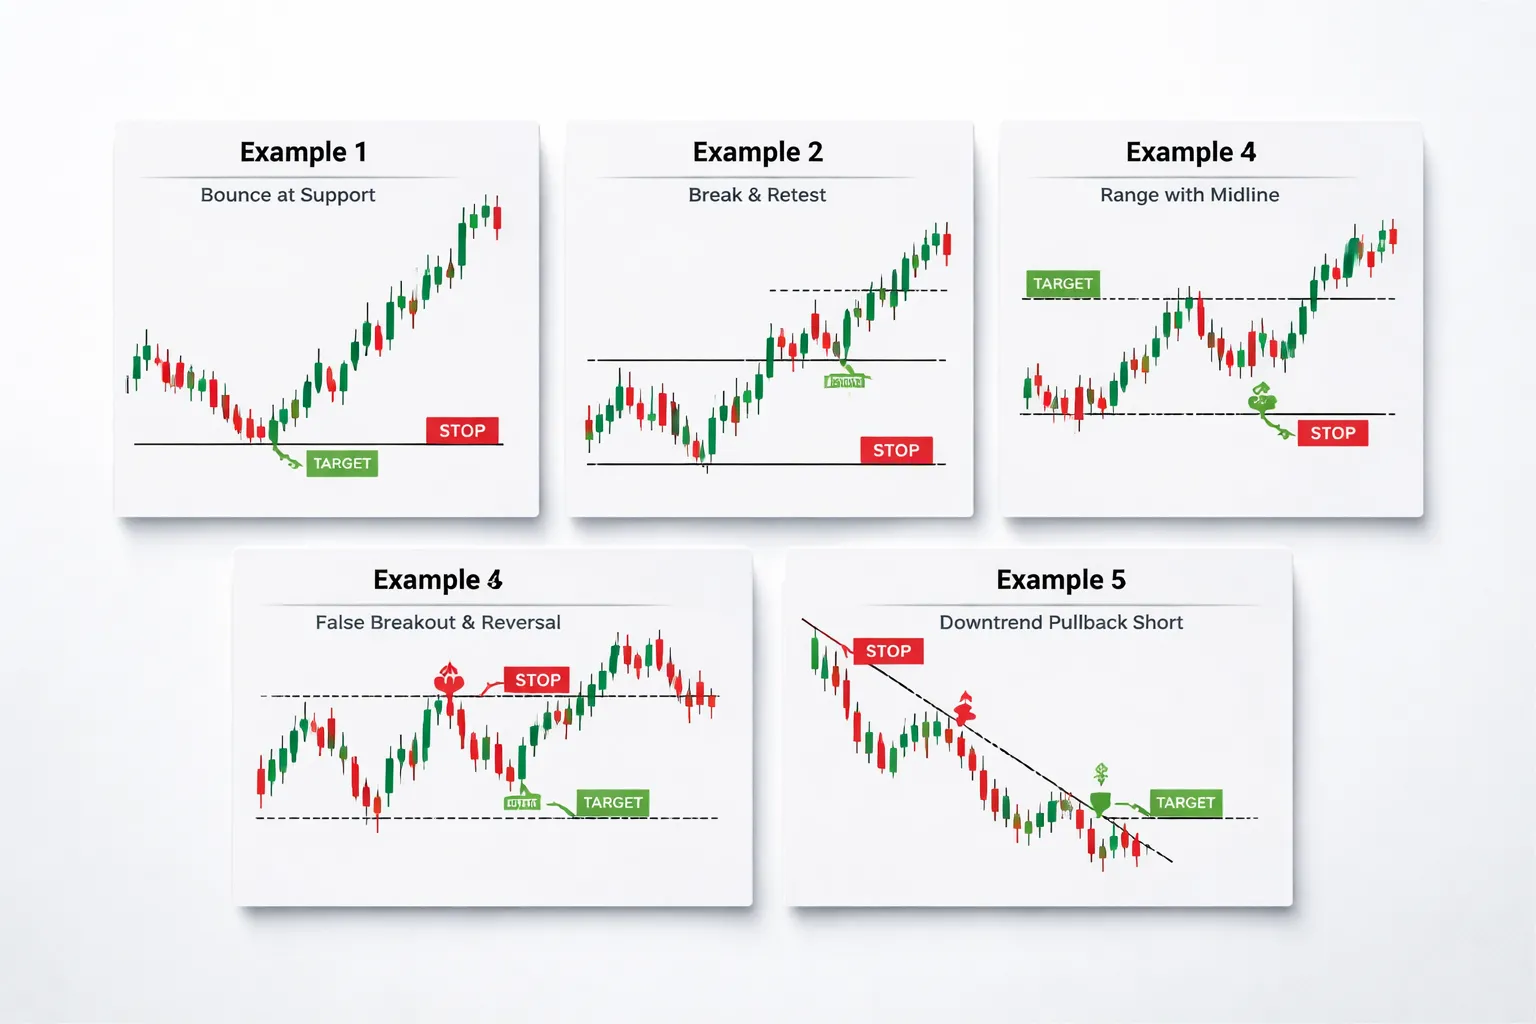
Example 1: Bounce Trade From Higher-Timeframe Support With Bullish Confirmation
Market: EURUSD
Timeframes: Identify level on H4 or D1. Execute on H1 or M15.
Setup: Price drops into a prior swing low zone that held at least two times. You wait for bullish confirmation at the level.
- Level: H4 support zone around the last clear impulse base and prior low.
- Confirmation: M15 or H1 bullish engulfing, or a strong rejection candle that closes back above the level.
- Entry: Buy on the close of the confirmation candle, or place a buy limit on a 50 percent pullback of that candle if spread allows.
- Stop: Below the support zone low, plus a small buffer for spread. Keep the stop outside the obvious wick low.
- Target 1: Nearest swing high or first resistance zone.
- Target 2: Next resistance, or trail behind higher lows if momentum stays strong.
Example 2: Break-and-Retest of Resistance Into Support in an Uptrend Continuation
Market: GBPUSD
Timeframes: Trend and key level on H4. Retest and entry on H1 or M15.
Setup: Price trends up, breaks a well-defined resistance, then pulls back to retest it as support.
- Level: H4 resistance that capped price at least twice, with clear swing highs.
- Break condition: H1 close above resistance, not just a wick. Prefer above-average range candle.
- Retest condition: Price returns to the level and holds above it, with smaller candles and reduced push down.
- Entry: Buy after a bullish rejection off the retest, or on a break of the retest candle high.
- Stop: Below the retest low, below the level. Avoid placing the stop right on the level.
- Target: Measure the last swing range and target the next H4 resistance. Take partials into the first push.
Example 3: Range Trade Between Defined Boundaries With Mid-Range Management
Market: USDJPY
Timeframes: Define range on H1 or H4. Execute on M15.
Setup: Price oscillates between clear support and resistance. You trade bounces, not breakouts.
- Level: Range support and range resistance with at least three reactions total across both sides.
- Entry at support: Buy after a rejection candle that closes back inside the range.
- Entry at resistance: Sell after a rejection candle that closes back inside the range.
- Stop: Outside the range boundary, beyond the rejection wick. Give room for spread expansion.
- Mid-range rule: Take partial profit near the 50 percent level of the range. Move stop to reduce risk after price clears mid-range with a close.
- Final target: Opposite boundary. Do not expect full-range moves every time.
Example 4: False Breakout Above Resistance (Stop Hunt) and Reversal Entry Plan
Market: XAUUSD or EURUSD (works best where liquidity runs stops fast)
Timeframes: Level on H1 or H4. Entry on M15.
Setup: Price spikes above resistance, then fails and closes back below. You fade the breakout after failure, not before.
- Level: H1 or H4 resistance with clustered swing highs and obvious resting stops above.
- Failure signal: M15 candle wicks above resistance and closes below it. Stronger if the next candle also closes below.
- Entry: Sell on the close back below resistance, or sell on a retest from underneath if price pops back up.
- Stop: Above the false breakout high. If that high breaks again, you are wrong.
- Target 1: Nearest intraday support.
- Target 2: Range low or next H1 support zone.
- Risk note: Avoid trading this during high-impact news. Spikes can extend and invalidate good structure.
Example 5: Downtrend Pullback Into Resistance With Trend-Aligned Short Setup
Market: AUDUSD
Timeframes: Trend on H4. Entry on H1 or M15.
Setup: Market prints lower highs and lower lows. Price pulls back into prior support that now acts as resistance.
- Level: Prior breakdown level, old support turned resistance. Align it with a swing high zone.
- Pullback condition: Retracement into the zone with slowing upside candles, then rejection.
- Entry: Sell on bearish rejection at the zone, or on break of the rejection candle low.
- Stop: Above the pullback swing high, not just above the zone.
- Target 1: Recent swing low.
- Target 2: Next H4 support. Consider trailing above lower highs if momentum continues.
- Volatility filter: If ATR expands fast, widen stop or skip the trade. Tight stops fail in high volatility. Use a volatility-based stop method if needed, see ATR-based stop loss sizing.
Common Pitfalls (and How to Avoid Them)
Trading Every Touch, Patience Improves Your Win Rate
Most level touches do nothing. Price can chop, front-run the level, or pierce it by a few pips and reverse.
If you trade every touch, you lower your average setup quality. You also overtrade. Fees and spreads start to matter.
- Trade fewer touches. Require a clear trigger, rejection wick, engulfing close, or break and retest.
- Define the “no trade” zone. If price approaches in tight chop, stand aside.
- Wait for the close. Use candle close on your entry timeframe, not an intrabar poke.
- Use a volatility filter. If ATR jumps, widen your stop or skip the trade. Tight stops fail during expansion.
Overdrawing Levels and Analysis Paralysis
If you draw ten lines, you will always find a reason to trade and a reason to exit. Your rules stop working.
- Limit your levels. Mark the closest 2 to 4 zones that matter for the next 1 to 3 sessions.
- Prioritize “proved” levels. Use levels with multiple clean reactions, strong impulse away, or a clear break and retest.
- Use zones, not single lines. Make the zone width match recent volatility, not your bias.
- One chart, one job. Identify levels on higher timeframes, execute on a lower timeframe. Do not redraw during the trade.
Ignoring the Economic Calendar and Event-Driven Volatility Spikes
News can turn a good level into noise. Spreads widen. Slippage jumps. Stops get hit even if your idea stays right.
- Check the calendar first. Treat high-impact events as a separate risk regime.
- Set a blackout window. Avoid new entries 15 to 60 minutes before major releases. Extend it for CPI, NFP, and central bank decisions.
- Reduce size or widen stops. If you must trade, cut risk. Use volatility-based distance, not a fixed pip stop.
- Expect level failure rates to rise. During news, price often breaks both sides before choosing direction.
Using Tiny Timeframes Without Higher-Timeframe Anchors
M1 and M5 levels break often. Micro structure changes fast. Your “support” can be one liquidity sweep.
- Anchor on higher timeframes. Mark key H4 and D1 levels first, then refine on M15 to H1.
- Trade in the direction of the higher-timeframe context. Countertrend level trades need stronger confirmation and smaller risk.
- Use confluence, not clutter. A clean higher-timeframe level plus a lower-timeframe trigger beats five minor lines.
Moving Stops Too Early or Widening Stops Emotionally
Early stop moves cut winners. Emotional widening turns a small loss into a large one.
- Move stops based on structure. Trail behind new swing highs or lows, not your fear.
- Set the invalidation point first. If price hits it, your idea is wrong. Exit.
- Do not widen a losing stop. If you need more room, you sized wrong or entered late. Take the loss.
- Plan partials and break-even rules. Use a fixed rule, for example move to break-even only after price reaches 1R and closes beyond the level.
- Use a consistent stop method. If you need help, see this guide on how to place a stop loss.
A Practical Checklist for Your Next Trade
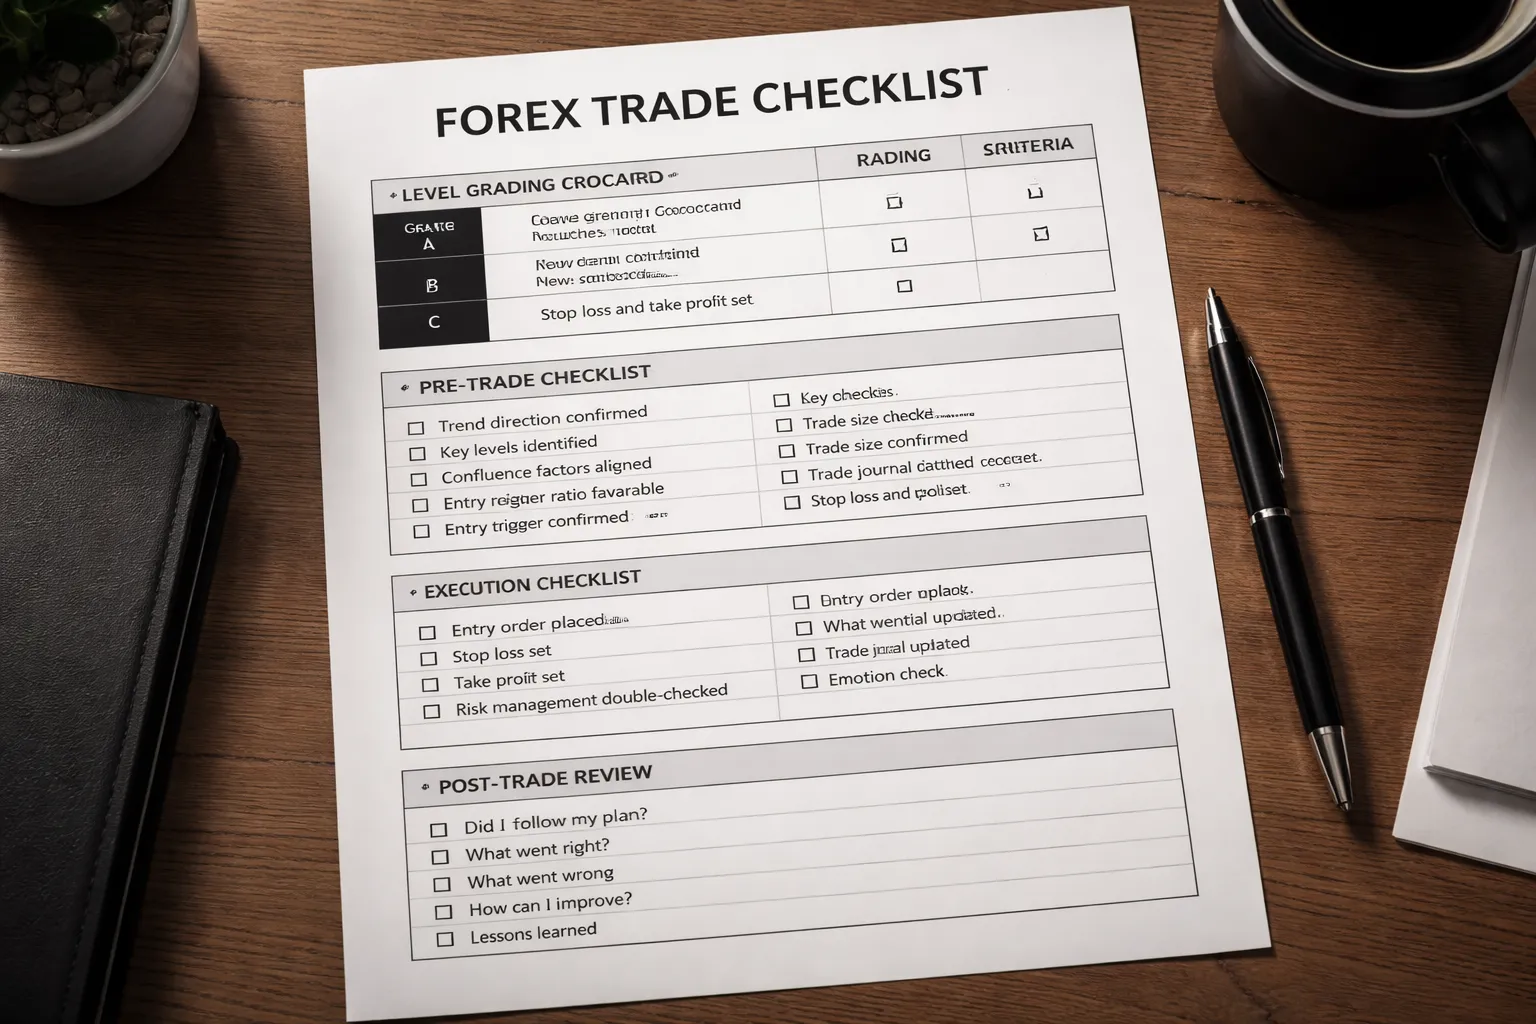
Level Grading Scorecard (A, B, C)
Grade the level before you plan the trade. You want clean levels that caused clear decisions. You want space to your target. You want reasons that stack.
| Factor | A Level | B Level | C Level |
|---|---|---|---|
| Touches | 3 to 6 clean touches. Similar price zone. No forced lines. | 2 to 3 touches. Zone looks valid but less proven. | 1 touch or many messy touches. Wide zone. Hard to define. |
| Reactions | Strong rejection. Fast move away. Clear candles. Leaves a swing. | Moderate reaction. Slower move away. Some chop. | Weak reaction. Price drifts. Breaks often. No clear swing. |
| Freshness | Not overtested. Last touch was clean. Few recent stabs. | Some recent tests. Still holds but shows wear. | Many recent tests. Level looks consumed. |
| Confluence | Level aligns with HTF structure, trend, round number, prior high or low, VWAP or MA, or a clear pattern. | One extra reason supports the level. | No confluence. Level stands alone. |
| Room to trade | Target has space of at least 2R before next barrier. | Room for 1.5R to 2R, next barrier is close. | Less than 1.5R to the next barrier. No edge. |
- Trade A levels with full size if the setup matches your plan.
- Trade B levels with reduced size or tighter rules.
- Skip C levels. You will force entries and donate spread.
Pre-Trade Checklist (Before You Mark an Entry)
- Trend. Define the higher time frame trend. Up, down, or range. Trade with it unless you have a reversal rule.
- Location. You want to buy at support and sell at resistance. Avoid the middle of a range.
- Volatility. Check ATR or your average candle size. Match stop size to current volatility. Avoid tight stops in high ATR.
- Session. Prefer London and New York for majors. Expect slower follow through in Asia unless the pair is Asia-driven.
- News risk. Check the calendar for red events on both currencies. If a major release hits within the next 60 to 90 minutes, reduce risk or stand aside.
- Spread and costs. If spread is high versus your stop, skip. Aim for spread under 10 percent of stop distance.
- Level grade. Write A, B, or C. If it is not A or B, you do not plan the trade.
Execution Checklist (Entry, Stop, Target, Size)
- Entry type. Choose one. Limit at the level, stop entry after a break, or market after a close and retest. Do not mix rules mid-trade.
- Trigger. Define the signal you need. Example, rejection wick plus close back inside the zone, or break and close beyond the level on your execution time frame.
- Stop logic. Put the stop beyond the invalidation point. It must sit past the level plus noise. Use a fixed buffer method you can repeat.
- Target logic. Set the first target at the next opposing level. Set the final target at the next major level. If the next level sits too close, skip the trade.
- Risk and size. Set risk per trade first, then calculate position size from stop distance. Do not size first.
- Minimum R. Require a minimum reward-to-risk. Many traders use 2R as a baseline. If your plan uses a different number, obey it. If it does not meet the rule, do not trade. See this guide on risk-reward ratio.
- Management rules. Write the exact rule for partials and break-even. Example, take 50 percent at 1R, move stop to break-even only after a close beyond the level.
- One last check. If you feel the need to widen the stop, cancel the order. Your entry is late or your idea is weak.
Post-Trade Review Prompts (Improve Your Levels)
- Did price respect your level zone, or did you draw it too tight or too wide.
- Was the level fresh, or had it been tested too many times before you entered.
- Did you trade the correct side of structure, with the higher time frame flow.
- Did your entry match your trigger, or did you front-run the level.
- Did volatility change after entry. Note ATR and candle size before and after.
- Did session timing help, or did you trade during thin liquidity.
- Did news distort the move. Record the event, time, and spread behavior.
- What did the next barrier do. Did price stall at the next support or resistance as expected.
- Was the loss clean. If price hit your invalidation point, your level read failed. If you broke rules, it is a process loss.
- Update your scorecard. Track A, B, C grades versus outcomes for 50 trades. Cut what does not pay.
- Log screenshots of before and after. Use a repeatable routine. If you need structure, use demo replays and routines.
FAQ
What is support and resistance in forex?
Support is a price zone where buying often slows a drop. Resistance is a price zone where selling often slows a rise. They form from prior swings, consolidation ranges, and repeated closes. Treat them as areas, not exact lines.
How do you find strong support and resistance levels?
Start on higher timeframes. Mark swing highs and lows, range edges, and clear rejection wicks. Count touches and clean reactions. Check if price also closes near the level. Strong levels align across timeframes and sit near round numbers.
Which timeframe works best for support and resistance?
Use the higher timeframe to draw, then the lower timeframe to execute. Many traders map levels on H4 or daily, then time entries on H1 or M15. Avoid drawing major levels only on very low timeframes, they break more often.
Are support and resistance lines exact prices?
No. Price rarely turns on a single pip. Use zones sized to recent volatility. If your stop needs to be 2 to 10 pips, your level is too tight for most pairs. Anchor the zone to closes and repeated rejections.
How do you trade a bounce at support or resistance?
Wait for price to reach your zone, then look for rejection. Use a trigger like a strong close back inside the zone, a break of a micro swing, or a clear pattern. Place the stop beyond the zone. Target the next level.
How do you trade a breakout?
Define your breakout by closes, not wicks. A common rule is one strong close beyond the zone, then a retest that holds. Enter on the retest or on continuation. Place your stop back inside the broken zone.
What is a support turned resistance flip?
After a clean break, old support can cap price on a retest. Old resistance can hold price on a retest from above. Trade the retest only if price rejects the zone and fails to reclaim it with closes.
Why do levels fail?
They fail when your zone is weak, trend pressure is high, or news expands volatility. They also fail when you mark levels on noise, not structure. Track whether breaks happen by close or wick. Adjust your rules to match.
How do you place stop loss and take profit using levels?
Put stops beyond the zone and beyond the swing that defines it. Take profit at the next major level, not an arbitrary number. If the next level is too close to cover your risk, skip the trade. Let structure set your targets.
Do indicators help with support and resistance?
Yes, but do not let them replace structure. Moving averages often act as dynamic support and resistance in trends. Use them as confluence. Keep your primary levels from price action. For trendline structure, see how to draw trendlines.
How many levels should you draw?
Fewer is better. Mark the nearest level above and below price, plus the next major level on each side. If your chart has many lines, you will hesitate and force trades. Keep only levels that show clear, repeated reactions.
Do support and resistance work in trending markets?
Yes, but you must respect direction. In uptrends, support matters more than resistance. In downtrends, resistance matters more than support. Use the trend to choose which levels to trade. Fade strong trends less often.
How do you tell a real break from a false breakout?
Use closes and follow-through. A false break often wicks through, then closes back inside and fails to retest. A real break tends to close outside the zone and hold on a retest. Log outcomes and refine your breakout rule.
Conclusion
Conclusion
Support and resistance give you a clean way to define risk, entries, and exits. Mark zones, not single lines. Trade from the higher time frame, then time your entry on the lower time frame.
- Pick your levels first. Use swing highs and lows, then refine into zones.
- Decide the play. Reversal at the edge, or breakout and retest. Do not mix both on the same level.
- Set risk before entry. Place your stop beyond the zone. Size your position to keep loss per trade fixed.
- Demand confirmation. For breakouts, require a close outside the zone and follow-through, then a hold on retest.
- Track outcomes. Log each level, setup type, stop distance, and result. Cut the patterns that do not pay.
Your final edge comes from repetition and measurement. Run a small sample, review it, then tighten your rules with a simple forex strategy backtest.
-
Stop Loss vs Take Profit: Differences, Examples & Best Practices
5 months ago -
Forex Trading Psychology Tips: How to Stay Disciplined and Consistent
5 months ago -
Forex Order Types Explained: Market vs Limit vs Stop Orders
5 months ago -
How to Set Stop Loss and Take Profit (Step-by-Step)
5 months ago -
How to Start Forex Trading Step by Step (Beginner Roadmap)
5 months ago
-
- Horizontal swing highs and lows (classic structure levels)
- Dynamic areas from trendlines and channels
- Moving averages as dynamic reference points
- Fibonacci retracement zones (how to avoid overfitting)
- Previous day, week, month high and low and session levels
- Pivot points and VWAP-style references (institutional-style anchors)
- Multi-timeframe “major” vs “minor” levels (how to label them)
-
- 1) Start high, mark the obvious turning points
- 2) Draw zones, not perfect lines
- 3) Validate with touches and reaction strength
- 4) Measure zone width using volatility and wick frequency
- 5) Spot fresh vs tested levels, and why fresh is not always better
- 6) Find confluence without clutter
- 7) Common drawing mistakes that ruin level quality
-
- Example 1: Bounce Trade From Higher-Timeframe Support With Bullish Confirmation
- Example 2: Break-and-Retest of Resistance Into Support in an Uptrend Continuation
- Example 3: Range Trade Between Defined Boundaries With Mid-Range Management
- Example 4: False Breakout Above Resistance (Stop Hunt) and Reversal Entry Plan
- Example 5: Downtrend Pullback Into Resistance With Trend-Aligned Short Setup
-
- What is support and resistance in forex?
- How do you find strong support and resistance levels?
- Which timeframe works best for support and resistance?
- Are support and resistance lines exact prices?
- How do you trade a bounce at support or resistance?
- How do you trade a breakout?
- What is a support turned resistance flip?
- Why do levels fail?
- How do you place stop loss and take profit using levels?
- Do indicators help with support and resistance?
- How many levels should you draw?
- Do support and resistance work in trending markets?
- How do you tell a real break from a false breakout?
-
How to Place a Forex Trade Step by Step (Your First Trade Explained)
3 months ago -
Forex Trading vs Crypto Trading: Which Market Is Better for Beginners?
3 months ago -
Forex Lot Size Calculator: How to Use It to Size Trades Correctly
5 months ago -
How to Calculate Position Size in Forex (Position Sizing Formula + Examples)
5 months ago -
Forex Leverage Explained: How It Works, Pros, Cons & Examples
5 months ago
-
Forex Trading Platforms Comparison: MetaTrader vs cTrader vs TradingView
5 months ago -
Is Forex Trading Legal in the United States? Rules, Regulators & What to Know
5 months ago -
Stop Loss vs Take Profit: Differences, Examples & Best Practices
5 months ago -
Forex Market Hours & Trading Sessions Explained (Best Times to Trade)
5 months ago -
Forex Leverage Explained: How It Works, Pros, Cons & Examples
5 months ago