How to Draw Trendlines in Forex (Step-by-Step Guide)

Trendlines help you read market direction and map key support and resistance. In forex, they work best when you draw them from clear swing highs and swing lows, then test them across timeframes. Most traders fail because they force lines to fit noise or they use too many points.
In this guide, you will learn how to draw trendlines step by step. You will learn how to pick valid swing points, connect them, and validate the line with clean retests. You will also learn when to use candle wicks vs bodies, how to handle false breaks, and the most common mistakes that ruin trendline trades. You will finish with a simple process you can repeat on any pair before you plan entries and set your stop loss.
Key Takeaways
- In het kort: Draw trendlines from clear swing points, then wait for clean retests before you trade them.
- Use at least two touches to draw the line, use three or more touches to trust it.
- Connect swing lows in an uptrend, connect swing highs in a downtrend.
- Start on higher timeframes to reduce noise, then refine on your trading timeframe.
- Use wicks when they form clean extremes, use bodies when wicks look random or oversized.
- Do not force a line to fit price. If you need to adjust it often, the line is weak.
- Validate with reactions. Price should respect the line with bounces, rejections, or clear pauses.
- Treat false breaks as information. Wait for a close back inside and a retest before you act.
- Place your stop beyond the structure that proves you wrong, not tight on the line.
- Combine trendlines with key horizontal levels for cleaner confluence, see support and resistance.
What Trendlines Are (and What They’re Not) in Forex
Trendlines show market structure
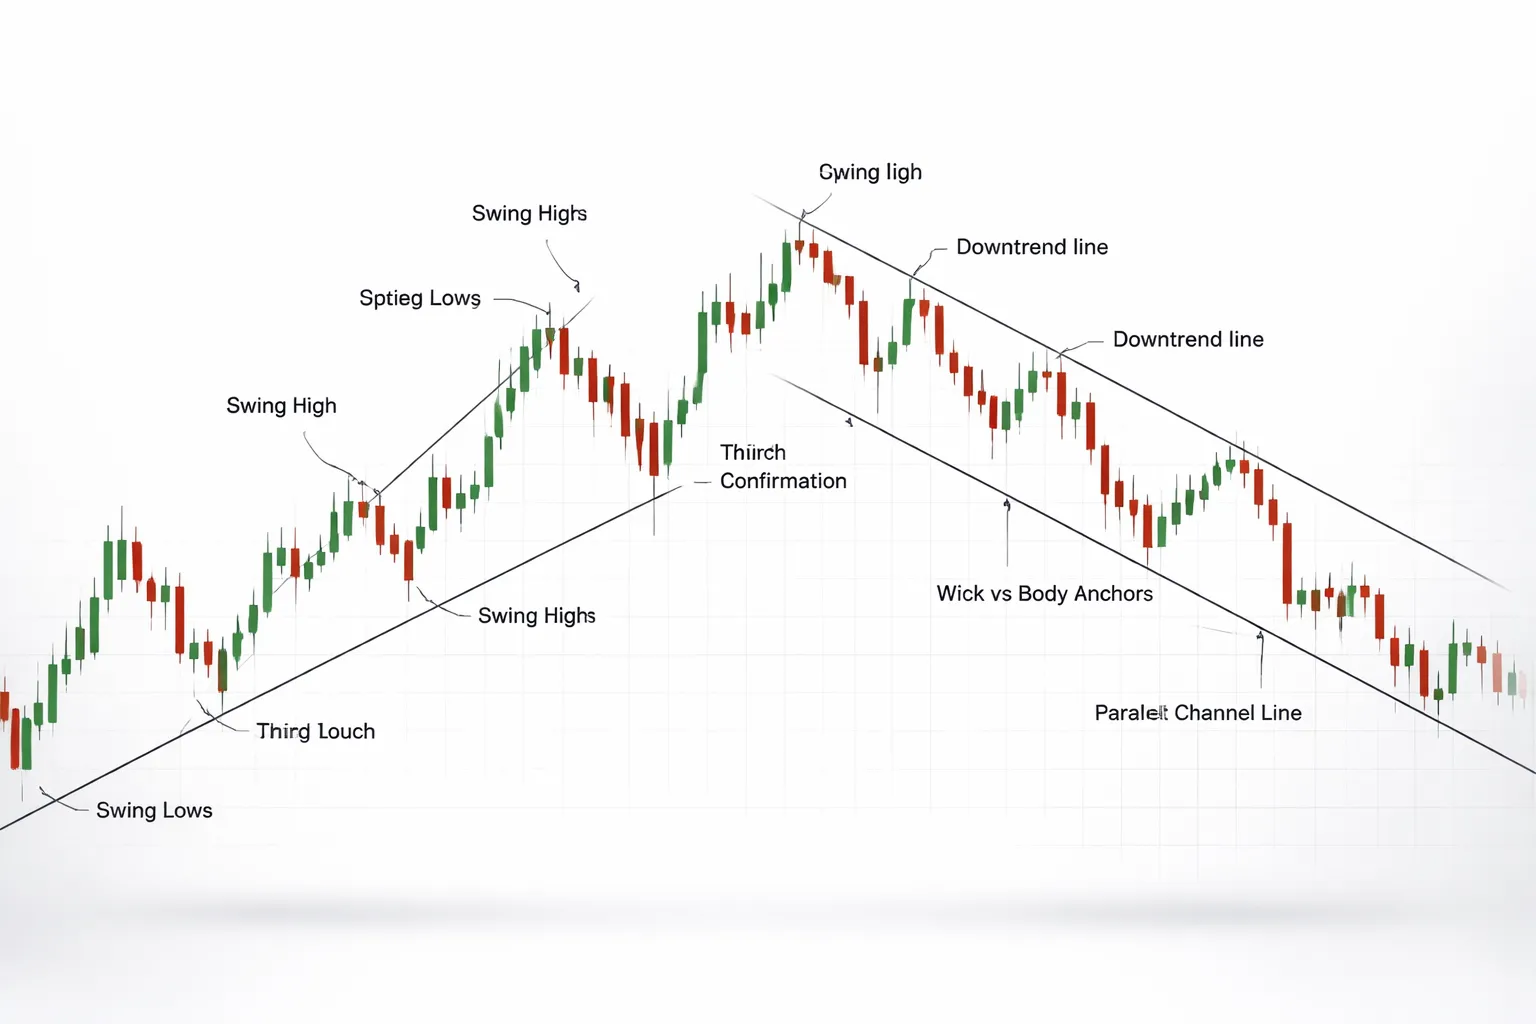
A trendline is a visual way to track swing structure.
- Uptrend: price makes higher highs and higher lows. Your trendline follows the rising swing lows.
- Downtrend: price makes lower highs and lower lows. Your trendline follows the falling swing highs.
You do not draw a trendline to predict. You draw it to measure whether structure stays intact or breaks.
Support and resistance roles, and why lines can flip
In an uptrend, the trendline acts like dynamic support. Buyers often step in near the line because it marks the current slope of higher lows.
In a downtrend, the trendline acts like dynamic resistance. Sellers often defend it because it marks the current slope of lower highs.
After a clean break and retest, the same line can flip roles.
- Break below an uptrend line, then retest from underneath. The line often acts as resistance.
- Break above a downtrend line, then retest from above. The line often acts as support.
This is the same logic as horizontal levels. Combine both for clearer confluence, see support and resistance.
Trendlines are zones, not exact prices
FX does not respect precision to the pip. Spread changes. Liquidity shifts. Wicks print through levels and snap back.
Treat your trendline as an area.
- Focus on clusters of touches, not a perfect fit.
- Judge reactions by closes and follow-through, not single wicks.
- Give your stop room beyond the swing that defines the line.
When trendlines fail
Trendlines work best in clean trends. They fail fast in these conditions.
- Ranging markets: structure alternates. Swings overlap. Price cuts through lines because no slope controls order flow.
- News spikes: sudden volatility runs stops on both sides. You get breaks with no retest and no follow-through.
- Thin liquidity sessions: late Friday, holidays, and quiet hours can print noisy wicks. Your line looks broken, then price snaps back.
In these conditions, reduce size, widen filters, or rely more on horizontal levels and higher timeframes.
Prerequisites Before You Draw: Chart Setup and Market Context

Choosing the right timeframe stack
Start with structure. Then drill down for entries.
- Weekly: mark the major swing highs and swing lows. These define the dominant slope and the market zones that matter.
- Daily: refine the same swings. You want clean pivots, not minor noise.
- H4 and H1: execute. Draw the actionable line that price respects right now. Use it to plan entries, stops, and invalidation.
Keep your trendlines consistent across this stack. If the weekly is flat or mixed, treat lower timeframe lines as short-term tools. Reduce expectations.
Selecting a clean chart
You need to see swings fast. Clutter hides them.
- Remove most indicators. Keep price, volume if you use it, and one volatility tool at most.
- Use one candle type. Standard candles work. Do not switch styles mid-analysis.
- Set a neutral template. Same colors, same background, same grid settings. You want repeatable reads.
- Zoom to show 100 to 300 candles. Too zoomed in creates fake “trends”. Too zoomed out hides usable pivots.
Identify trend vs range before you draw
Trendlines work best when order flow trends. In ranges, price cuts through lines.
- Uptrend: higher swing highs and higher swing lows. Impulse legs push up hard. Corrections pull back and hold above the prior swing low.
- Downtrend: lower swing lows and lower swing highs. Impulse legs push down hard. Corrections fail below the prior swing high.
- Range: swing highs stall at similar levels and swing lows stall at similar levels. Impulse legs fade fast. Corrections overlap prior candles.
Mark the last two to three clear swing points first. Then decide. If structure flips every few swings, skip trendlines and lean on horizontal levels.
Session and volatility considerations
Session flow changes how clean your line looks.
- London open: common expansion and fake breaks. Wait for the first impulse and the first pullback before you trust a fresh line.
- London and New York overlap: best liquidity and follow-through. Breaks and retests tend to behave.
- Late New York and Asia: more drift and stop runs. Expect more wick breaks and less continuation.
Add a volatility filter. Use ADR or ATR to know if the move has room left.
- If price already traveled most of its daily range, expect chop and mean reversion.
- If ATR expands fast, widen stops and reduce leverage. Tight lines break more often.
If you need a volatility-based stop framework, use the ATR-based stop loss guide.
Pick the right price type and data feed
Your trendline depends on the printed highs and lows. Those can differ.
- Bid and ask: many charts plot bid. Stops and entries can trigger on ask. Spreads widen in news and rollover. A “break” on one feed may not exist on another.
- Broker feed quirks: different liquidity providers print different wicks. Small differences change swing points, which changes your line.
- Daily candle close: broker server time changes the daily bar. That shifts pivots on D1 and weekly levels.
Pick one platform and one broker feed for analysis. Stay consistent. If you trade off MT4 or MT5, draw and execute on the same feed.
Step-by-Step: Trendlines in Forex—How to Draw Them Correctly
Use one chart feed. Use one time zone. Then draw. Trendlines fail when your inputs change.
Step 1: Locate meaningful swing points
You need clean pivots. Skip random bumps.
- Swing low: a low with at least one higher low on both sides. Two bars on each side works better on noisy pairs.
- Swing high: a high with at least one lower high on both sides. Again, two bars on each side filters chop.
- Spacing rule: the two anchor swings should not sit inside the same tight cluster. If the move between them is small, the line will be unstable.
- Timeframe rule: mark swings on the timeframe you trade. If you execute on H1, do not build your main line from M5 noise.
Step 2: Draw an uptrend line from lows
An uptrend line measures rising demand. Anchor it to swing lows.
- Find the first clear swing low that started the current leg up.
- Find the next higher swing low.
- Connect low to low. Extend the line to the right.
- Keep the line under price. If price sits below it for long, you picked the wrong anchors or the trend already changed.
Step 3: Draw a downtrend line from highs
A downtrend line measures falling supply. Anchor it to swing highs.
- Find the first clear swing high that started the current leg down.
- Find the next lower swing high.
- Connect high to high. Extend the line to the right.
- Keep the line above price. If price keeps living above it, the line does not describe structure.
Step 4: Decide wick vs body rules
Pick one method and stay consistent on that pair and timeframe.
- Wick-based lines: use extremes. Works well on slower markets and higher timeframes where wicks often mark true rejection.
- Body-based lines: use candle closes. Works well when spikes are common and wicks distort swing points.
- Practical rule: if you see frequent stop wicks around highs and lows, default to bodies. If price respects extremes cleanly, use wicks.
- Do not mix: do not anchor one point on a wick and the next on a close. That creates a line you can always justify after the fact.
Step 5: Validate with a third touch
Two points create a line. Three points make it tradable.
- Wait for a third touch where price reacts and moves away.
- Count it as a touch only if price reaches your line and rejects within a small tolerance.
| Market condition | Acceptable deviation from the line | What to look for |
|---|---|---|
| Low volatility, clean swings | 0% to 0.1% of price | Sharp rejection, small pierces, quick follow through |
| Normal volatility | 0.1% to 0.25% of price | Touch, stall, then move away with a clear impulse candle |
| High volatility, news prone pairs | 0.25% to 0.5% of price | Wick through is common, judge by closes and follow through |
Use the same tolerance every time. If you widen it on losing trades, you will keep bad lines alive.
Step 6: Adjust responsibly
Small refinement is fine. Constant redraws are data mining.
- Valid refinement: you anchored to a minor swing, then price prints a clearer swing that fits the same slope. Shift the anchor to the clearer pivot.
- Valid refinement: you switch from wick to body rules after you define your rule set. Then redraw all trendlines with the new method.
- Forcing a fit: you rotate the line to include a recent touch while breaking older touches. That is curve fitting.
- Forcing a fit: you move anchors after price breaks the line so the break disappears. Treat that as a new structure, not a fix.
Step 7: Add parallel channel lines
Channels help you plan entries, targets, and stops with the same slope.
- Draw your main trendline first. Do not change its slope.
- Copy it and move the copy to the opposite side of price action.
- In an uptrend, place the parallel line on swing highs. In a downtrend, place it on swing lows.
- Keep the channel tight. If you must move it often, the market is not trending cleanly.
- Use the channel for structure-based stops, then size the trade from your stop distance. See how to place a stop loss.
Advanced Trendline Techniques Most Traders Skip

Multiple timeframe confluence
Draw your primary trendlines on the daily first. Mark the clean swing highs and lows. Then drop to H4 or H1 for entries.
- Step 1: On D1, draw the external trendline from the two most obvious swings. Extend it right.
- Step 2: Mark the last confirmed daily swing low in an uptrend, or swing high in a downtrend. That is your structure anchor.
- Step 3: On H4 or H1, wait for price to touch or react near the daily line. Do not take trades in the middle of space.
- Step 4: Use the intraday chart to time the entry after rejection, a pullback, or a structure shift. Keep your stop tied to structure, not to a random pip count.
Rule: If the daily line and intraday line point in different directions, you trade smaller or you pass. Misalignment raises failure rate.
Internal vs external trendlines
External trendlines track the real market slope. You draw them from major swing points. Internal trendlines track momentum inside the trend. They break more often.
- External (conservative): Connect higher lows in an uptrend, lower highs in a downtrend. Use the cleanest swings. Expect fewer touches. Trust it more.
- Internal (aggressive): Use a steeper line that captures recent pushes. It gives earlier entries. It also produces more false breaks.
Use both. Treat the internal line as an early warning. Treat the external line as the level that must hold for the trend to stay intact.
Log vs linear scale on long-term FX charts
Most FX pairs move in tight percentage ranges on lower timeframes. Linear scale works fine on H1 to D1. On multi-year charts, linear can distort slope.
- Use linear for intraday and swing trading. Your trendline decisions stay consistent.
- Use log on weekly or monthly charts when the pair has made a large percentage move over years. Log keeps equal percentage moves visually equal.
Check both when you map long-term structure. If the trendline only looks valid on one scale, you treat it as weaker.
Fibonacci confluence and trendline clusters
Fibs can help, but they can also feed bias. You avoid that by fixing your process.
- Anchor rules: Pull fib from the last clear impulse leg, swing low to swing high in an uptrend, swing high to swing low in a downtrend.
- Pick one tool: Use retracement levels or extension levels, not both at once on the same decision.
- Define a cluster: A valid confluence zone needs at least two independent reasons, like an external trendline plus the 50 or 61.8 retracement.
- Precommit: Decide which fib levels matter before price reaches the zone. Do not add levels after the fact.
Keep the zone narrow. If your confluence area spans a wide range, it gives you no trade location. It gives you an excuse.
Trendline plus market structure breaks (BOS and CHoCH)
A trendline break alone means little. Price can pierce a line and continue. Structure tells you if the market actually changed.
- BOS (break of structure): In an uptrend, price breaks and closes above the last swing high. In a downtrend, it breaks and closes below the last swing low. That supports continuation.
- CHoCH (change of character): After an uptrend, price breaks below the last higher low. After a downtrend, price breaks above the last lower high. That signals a potential reversal.
Combine them with your trendline like this. First, price breaks the internal line. Then you wait for CHoCH. Then you look for a retest of structure or the external line. That sequence filters many fake breaks.
When you build the trade, place the stop beyond the structure point that confirms your idea. Then size the position from that stop distance. Use this stop loss and take profit guide if you need the full process.
How to Trade with Trendlines (Entry, Stop, Take Profit)
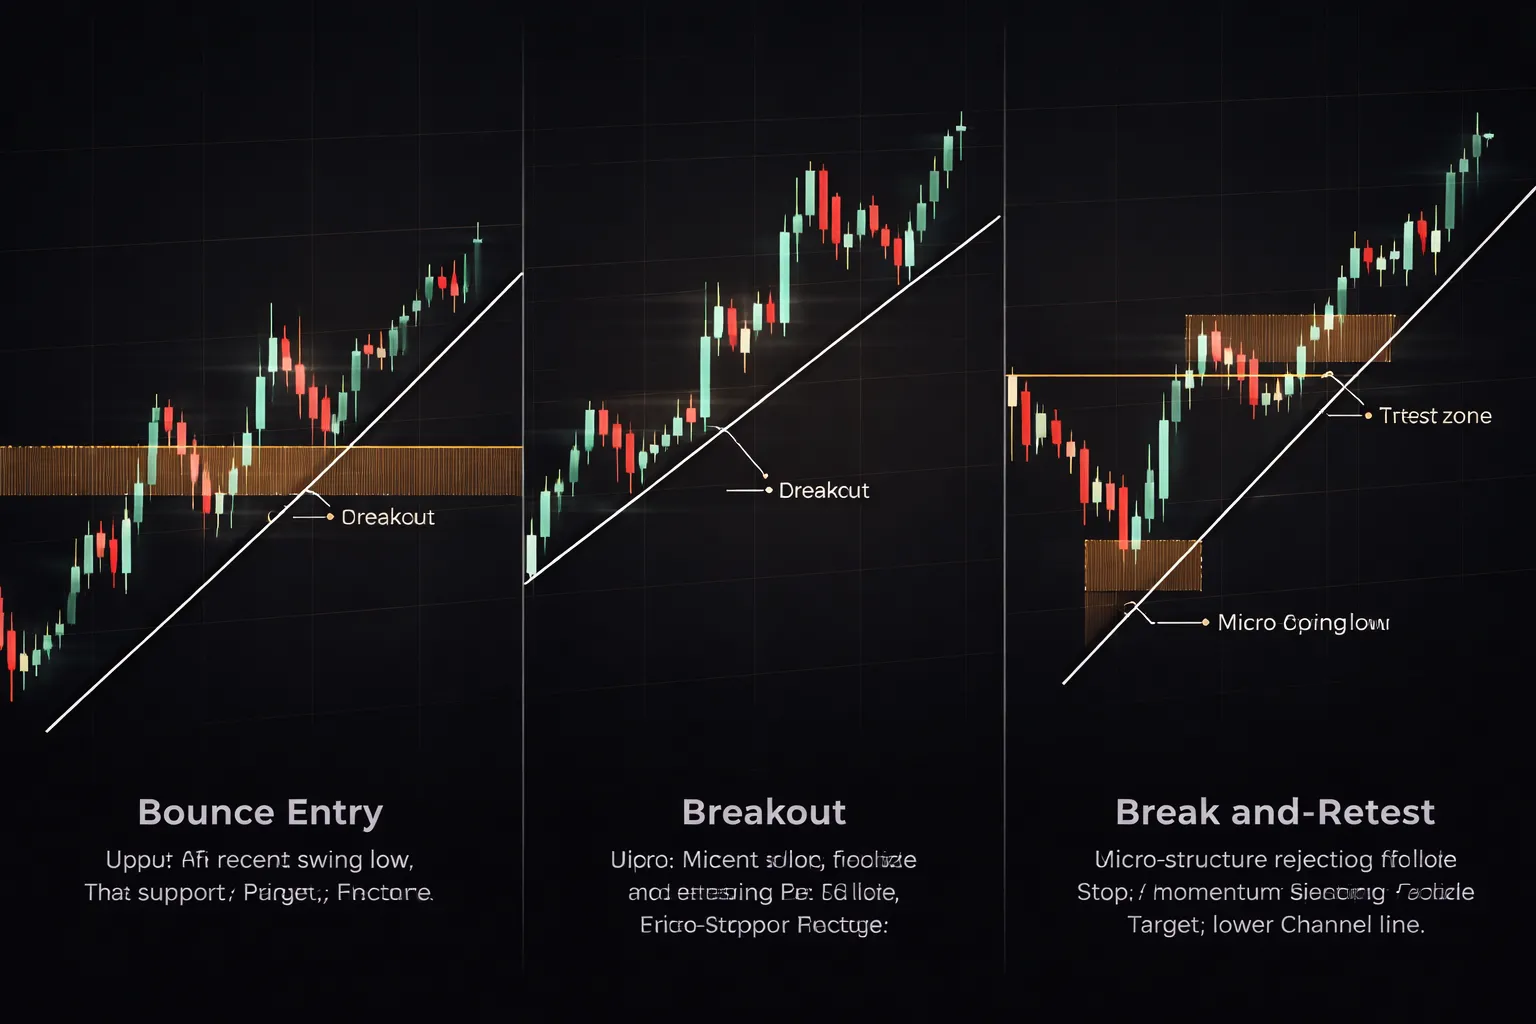
Bounce Setups (Entry Triggers Near the Line)
A bounce trade works when price respects the trendline and rejects it fast. You want proof, not a touch.
- Rejection candle entry. Wait for a clear rejection at the line, then enter on the break of the rejection candle high for longs, or low for shorts. Keep the candle small. Avoid entries after a large spike.
- Retest entry. Let price tap the line, bounce, then pull back and hold above the last micro swing for longs, or below it for shorts. Enter on the next push away.
- Micro-structure entry. Drop to a lower timeframe only after price hits the line. Look for a tight base, then a break of that base. Use the base low or high for the stop anchor.
Skip the first touch after a steep move. You often get a deeper pullback and sloppy candles.
Breakout Setups (Close Beyond the Line vs Wick-Throughs)
Most false breaks come from wicks through the line. Your rule should focus on closes and follow-through.
- Breakout rule. Treat the trendline as broken only after a candle closes beyond it. A wick through the line does not count.
- Follow-through rule. After the close beyond the line, require the next candle to hold beyond the line or to break the breakout candle high or low. If it snaps back inside fast, skip.
- Location filter. Breakouts near higher timeframe support or resistance fail more. If the breakout runs into a major level within your stop distance, skip.
- Momentum filter. You want expansion on the break, larger bodies, less overlap. If the break candle is tiny and sits in chop, skip.
Break-and-Retest Strategy (Valid Retest Zone and Entry Timing)
This is the cleanest way to trade trendline breaks. You trade the retest, not the break.
- Define the retest zone. Use a band, not a single line. The zone sits between the trendline and the last broken swing point or minor structure ledge.
- Valid retest. Price returns into the zone, stalls, then prints a new micro higher low for longs, or lower high for shorts. You want failure to reclaim the old side.
- Entry trigger. Enter on a break of the micro-structure that forms during the retest. If price slices through the zone with no pause, skip.
- Timing rule. If the retest does not happen within a few candles on your trading timeframe, the edge drops. Late retests turn into ranges.
Stop-Loss Placement (Beyond Swings vs Volatility Buffers)
Place the stop where your idea fails. Then size your position from that distance.
- Swing-based stop. Put the stop beyond the swing point that validates the setup. For bounces, that is the rejection low or high. For break-and-retest, that is the retest swing.
- Structure stop, not line stop. A trendline can be pierced. Structure matters more. If your stop sits right on the line, you will get tagged often.
- ATR buffer. Add a volatility buffer beyond the swing. A common rule is 0.5 to 1.0 ATR of your entry timeframe. Use a smaller buffer in tight trends and a larger buffer in news weeks.
- Hard invalidation. If you must widen the stop to survive normal noise, you either entered late or traded a weak touch. Skip instead of stretching.
If you need the mechanics, use this stop loss guide.
Take-Profit Methods (Structure, Measured Moves, Channel Targets, Trailing)
Pick a target method before you enter. Match it to the market type.
- Prior structure. Target the last swing high or low, supply or demand zone, or the base that caused the last impulse. This fits most trades.
- Measured move. For breakouts, measure the last consolidation range, then project that distance from the breakout point. Take partials at 1x range, then trail the rest.
- Channel target. If you can draw a clean parallel channel, aim for the opposite side. This works well in orderly trends.
- R-based exits. Take partial profit at 1R, move stop to breakeven only after price holds beyond a new structure point. Do not rush breakeven in choppy markets.
- Trailing logic. Trail behind higher lows in an uptrend or lower highs in a downtrend. Or trail by 1 ATR from the most recent swing. Use one method, keep it consistent.
Risk Management (Sizing, R-Multiples, When to Skip)
Trendlines help with timing. Your risk rules keep you in the game.
- Position sizing. Choose a fixed risk per trade, often 0.5 to 1.0 percent. Calculate lot size from stop distance. Wider stop means smaller size.
- Minimum reward. Aim for trades that can reach at least 2R based on nearby structure. If the next level sits at 1R or less, skip.
- Track outcomes in R. Log every trade as R gained or lost. This keeps analysis clean across different pairs and stop sizes.
- Skip low-quality touches. Skip touches in the middle of ranges, after multiple taps, during thin liquidity, or when candles overlap heavily. Skip when the line angle is extreme and price accelerates into it.
- One setup per line. After two clean touches and a third noisy touch, the line loses value. Treat later trades as lower probability.
Common Trendline Drawing Mistakes (and How to Fix Them)
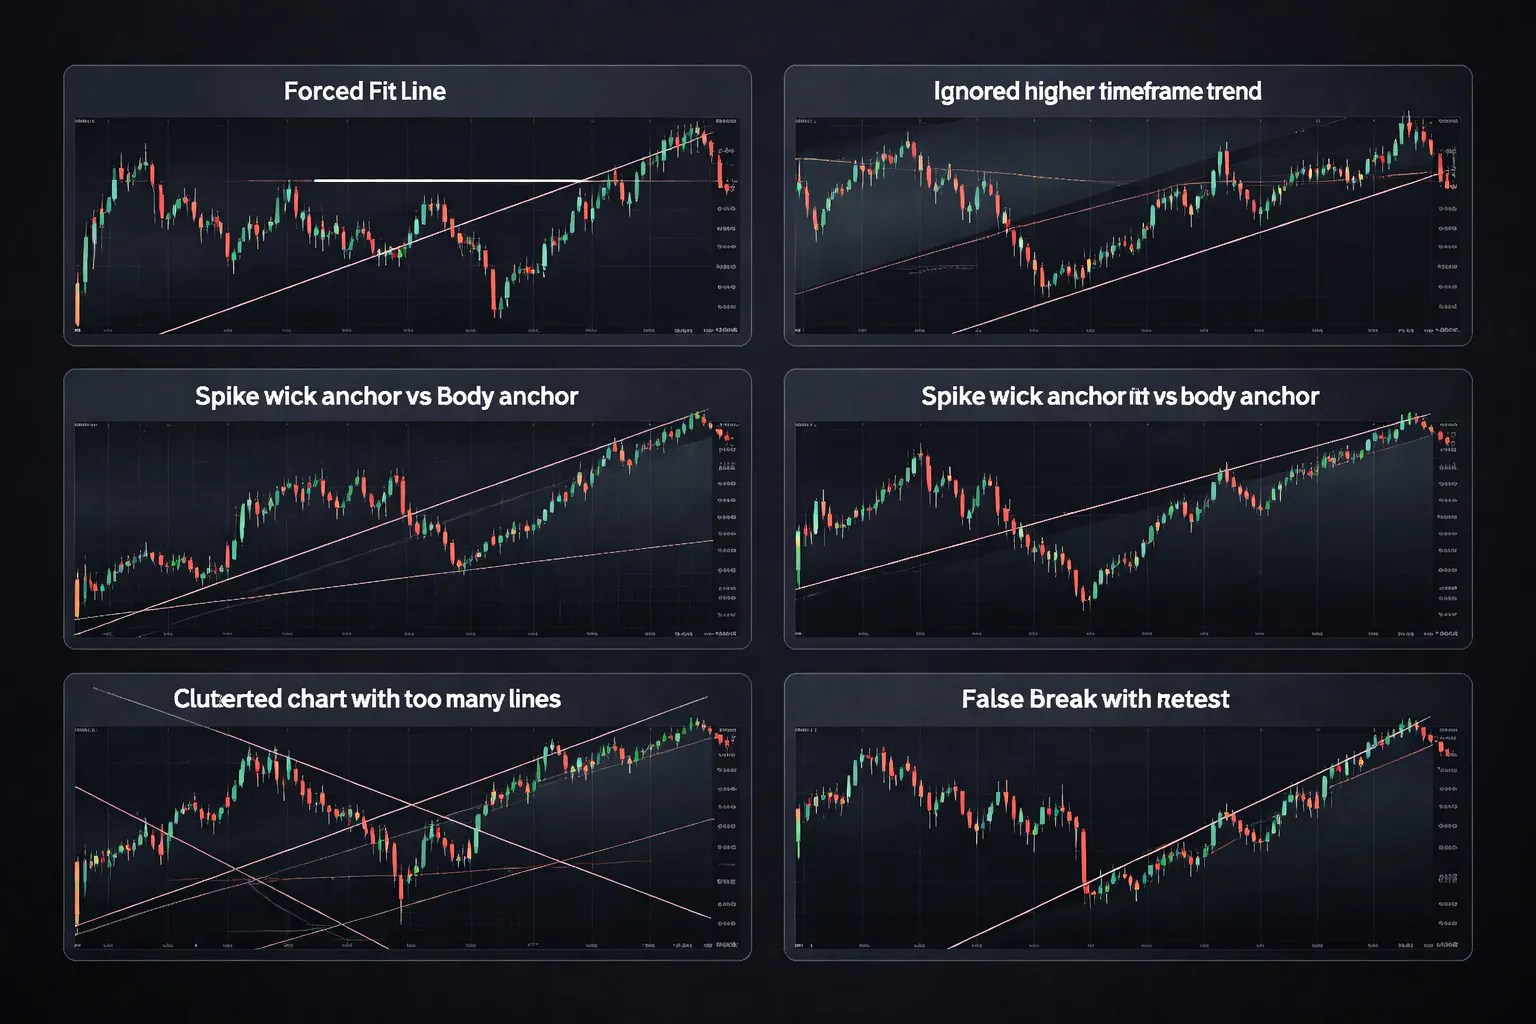
Forcing the line to fit price
Curve-fitting makes a trendline look right and trade wrong. You fix it with rules you can repeat.
- Anchor rule: Use swing points that stand out on your timeframe. If you need to zoom in to justify a touch, skip it.
- Two-point rule: Draw the line with two clean swings, then validate with a third touch. If you need to move the line after the third touch, reject it.
- Retest rule: Price must respect the line with a clear reaction. If price slices through with no pause, the line has no edge.
- Space rule: Prefer swings separated by time and distance. Tight clusters produce fragile lines.
- Edit limit: Allow one adjustment after you place the first two anchors. More edits equal curve-fit.
Ignoring higher timeframe structure
Most bad trendline trades happen when your line fights the anchor trend from a higher timeframe.
- Top-down order: Mark the trend and major swing highs and lows on the daily, then refine on H4, then execute on H1 or M15.
- Direction filter: Only take trendline trades that align with the higher timeframe swing structure. Higher highs and higher lows for longs. Lower lows and lower highs for shorts.
- Zone check: If your entry sits into higher timeframe support or resistance, reduce size, widen the stop, or skip.
- Line priority: If a lower timeframe trendline conflicts with a clean higher timeframe level, respect the higher timeframe.
Over-anchoring to extreme spikes
News wicks and thin-liquidity spikes distort anchors. They pull your line to a price that did not trade with volume.
- Outlier test: If one wick is much longer than nearby candles and price snaps back fast, treat it as an outlier.
- Body-first approach: Anchor to closes and candle bodies when spikes dominate. Use wicks when swings look consistent and clean.
- Two-line check: Draw one line using bodies, then one using wicks. If they diverge a lot, volatility is high and the line is low quality.
- Event filter: If the swing formed during major news, require extra confirmation, like a clear retest and rejection, before you trade.
Using too many lines
Extra lines create extra signals. Most of them are noise. Limit your chart on purpose.
- Maximum 3 lines per timeframe: One primary trendline, one counter-trend line, one channel line if it adds clear structure.
- Delete weak lines: Remove lines with overlapping candles, messy touches, or multiple small violations.
- Keep only tradable lines: A line must define risk. If you cannot place a logical stop beyond it, you do not need it.
- One idea per chart: If two lines point to different trades, keep the higher timeframe line and drop the rest.
Assuming every break is a reversal
Most breaks fail. Price often breaks, retests, then continues. You need filters for structure, momentum, and context.
- Structure first: Treat a break as real only after price also breaks a key swing high or low, not just the line.
- Retest requirement: Prefer a break, then a retest of the line, then a rejection. This reduces false breaks.
- Momentum check: A strong impulsive break with wide candles and clean follow-through has higher odds than a slow grind through the line.
- Location filter: Breaks into higher timeframe support or resistance fail more. Breaks that clear open space run more.
- Pattern context: If the break forms part of a clear reversal or continuation pattern, treat it with more confidence. Use your broader pattern rules from your Forex chart patterns guide.
Tools and Platform Tips for Drawing Trendlines Faster
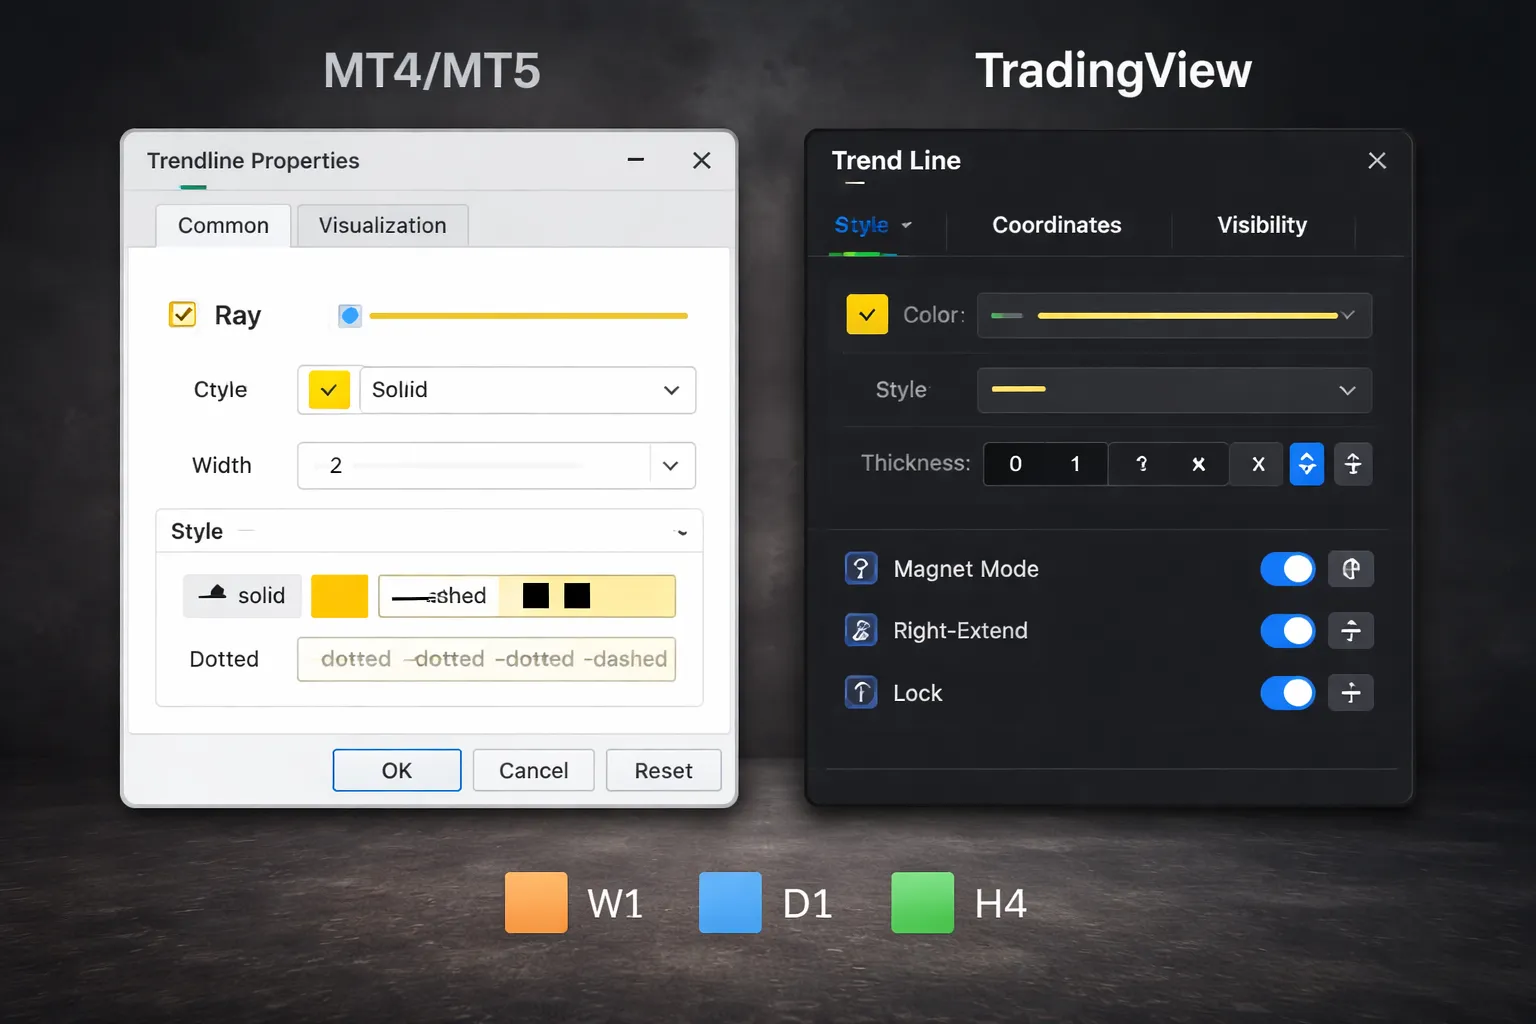
MetaTrader 4/5: Trendline tool settings, ray extension, and hotkeys
Set your defaults once. Stop reformatting every line.
- Set default style: Right-click any trendline, open Properties, set color, width, and style, then save as default for new objects.
- Use ray extension: Enable the option to extend the line to the right. You want the line to project into future price, not stop at the last anchor.
- Keep selection simple: Turn on object selection only when you edit lines. When you mark up levels fast, accidental drags create bad reads.
- Hotkeys to speed work: Learn your platform object shortcuts. Use the trendline hotkey if your broker template includes it, or assign one if your MT version supports custom shortcuts. If not, keep the Insert menu open and use the keyboard to navigate.
- Precise placement: Zoom in, place anchors on the swing points you already validated, then zoom out and recheck the angle in context.
TradingView: Magnet mode, right-extend, and locking lines
TradingView can be fast if you use the right toggles.
- Magnet mode: Turn it on when you place anchors. It snaps to highs and lows and reduces misclicks. Turn it off when you need to align to a wick cluster or body-only rule.
- Right-extend: Enable Right Extend on every trendline you plan to trade. You need a live reference for touches, breaks, and retests.
- Lock lines: Lock the trendline after you place it. This prevents accidental moves when you pan, zoom, or click near the line.
- Template your objects: Save a drawing template for trendlines with your colors and width. Apply it in one click.
Color-coding and labeling by timeframe
Use one simple system. Keep it consistent across pairs.
- Monthly and Weekly: Black or dark gray, thick line.
- Daily: Blue, medium thickness.
- H4 and H1: Orange, thin line.
- 15m and below: Light gray, thin line, only if you actively trade that timeframe.
- Label format: Add a short tag at the right side, like “W1 TL” or “D1 TL”, plus a note like “3 touches” or “wicks”.
This reduces bad decisions caused by mixing a short-term line with a higher timeframe one. It also helps you stay consistent under pressure, which ties into trading discipline and consistency.
Alerts on trendline touch and break
Alerts save screen time. They also stop you from chasing moves late.
- Touch alert: Set an alert when price hits the line. Use it to prepare, not to auto-enter. Decide first what confirms the trade, then wait for it.
- Break alert: Set an alert on close beyond the line when possible. A close filter cuts noise compared to an intrabar spike.
- Retest alert: After a break, clone the line or keep the same line and set a second alert near the retest zone. Many clean setups come from break plus retest.
- Buffer: Add a small price buffer based on the pair’s normal spread and recent ATR. Tight alerts fire too often, loose alerts arrive late.
On TradingView, right-click the line and add an alert tied to the drawing. On MT4/MT5, use price alerts near the line, or an alert indicator that reads object values. Test alerts during active hours first.
Manual vs automated trendlines: pros, cons, and reliability checks
Auto trendlines look clean. They also fail in real conditions.
- Manual pros: You control swing selection, timeframe priority, and wick versus body rules. You can align the line to what price respected most.
- Manual cons: You can force a fit. You can redraw lines to match your bias. You need rules.
- Automated pros: Fast scanning across many pairs. Useful for idea generation and alerts.
- Automated cons: Algorithms often anchor to irrelevant pivots, ignore structure shifts, and redraw as new candles print. That changes your “level” after the fact.
Use reliability checks before you trust any line, manual or automated.
- Anchor quality: Both points must be clear swing highs or swing lows on your chosen timeframe.
- Touch count: Prefer three clean reactions over two. Count touches that produce a move, not tiny pauses.
- Space: Price should have room to move between touches. Crowded chop makes trendlines meaningless.
- Confluence: Check if the line aligns with horizontal support or resistance, or a prior range edge. Confluence matters more than a perfect angle.
- Stability: If the tool redraws the line as new data prints, treat it as a scanner, not a trigger.
Practical Examples to Build Confidence (What to Look For)
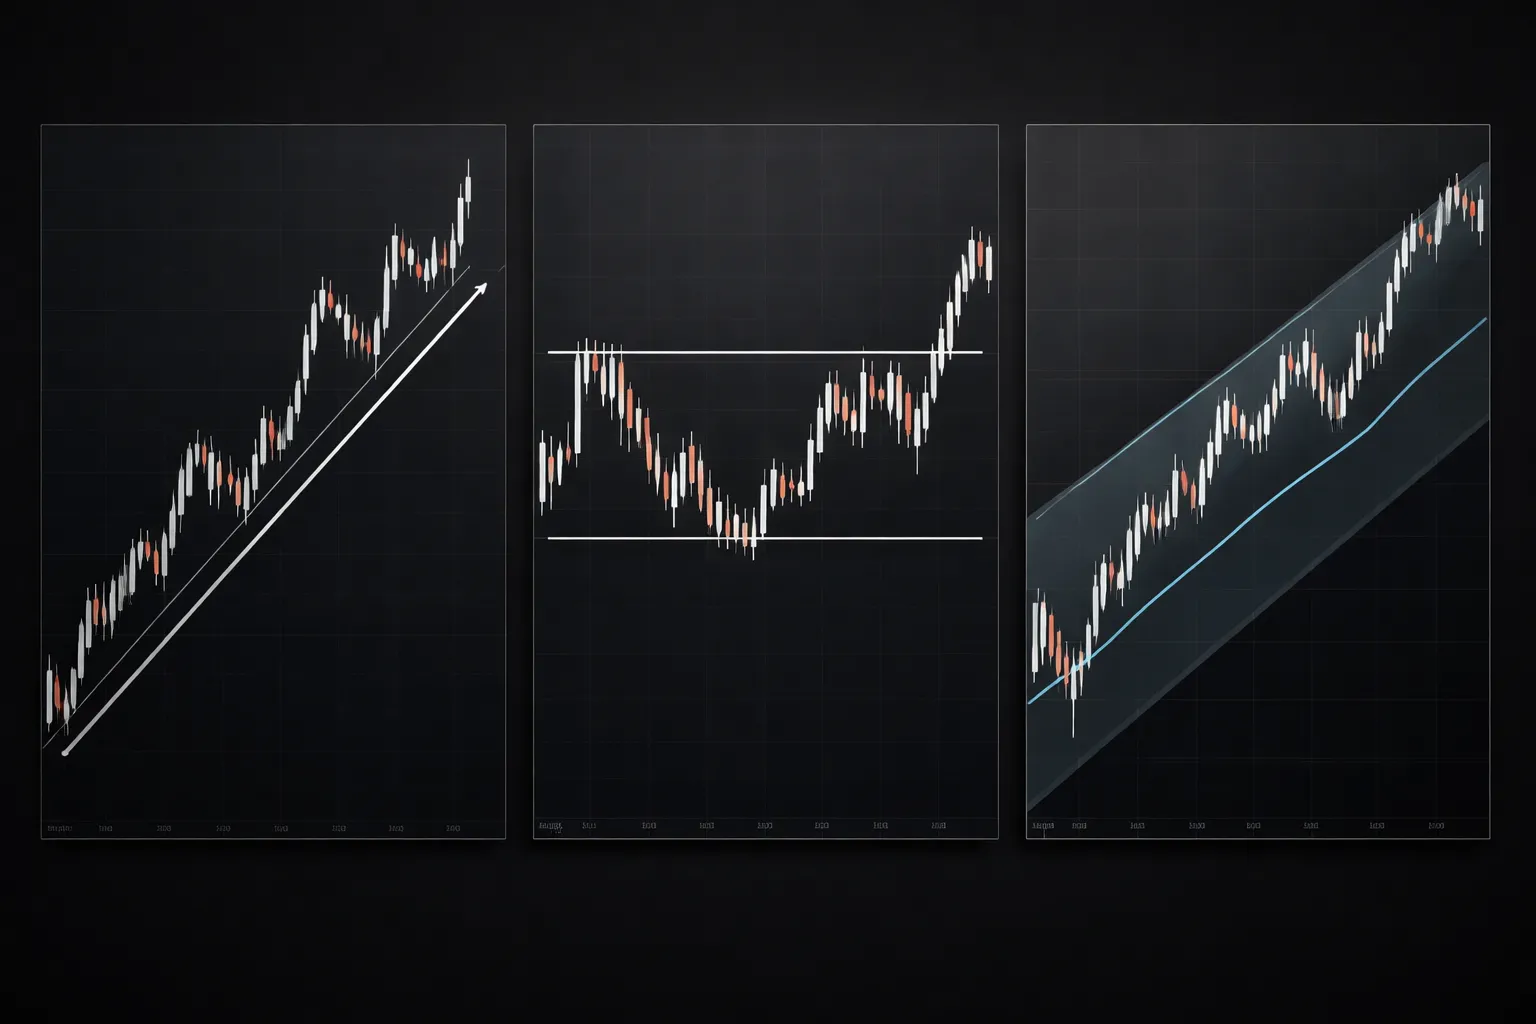
Example of a clean uptrend, multiple touches and a disciplined channel
You want a trendline that price respects without you adjusting it.
- Timeframe: Start on H4 or Daily. Drop to H1 only to refine entries.
- Anchor points: Connect the first two clear higher lows that follow a strong impulse up.
- Validation: Wait for the third touch. Count it only if price leaves the line and travels.
- Distance: Measure swing size between touches. If swings overlap, you have chop, not a clean trend.
- Channel check: Copy the line to the top of price action to form a parallel channel. If multiple highs tag the copied line, your trend structure holds.
- What to ignore: One deep wick through the line during a news spike, if the close stays above and the next swing continues up.
What you look for is repeatable behavior. Touch, rejection, continuation. No constant redrawing.
Example of a downtrend with corrective pullbacks, identifying the best anchor points
Downtrends tempt you to anchor to extreme wicks. That often breaks the line too early.
- Find the impulse: Mark the first strong drop that breaks a prior support or range floor.
- Choose anchors on structure: Use the swing highs that form after each corrective rally. These highs often align with prior support turned resistance.
- Keep the slope believable: If your line is too steep, price will “break” it during normal pullbacks.
- Confirm with a lower high sequence: You want at least two lower highs connected, then a third touch or near-touch that rejects.
- Entry context: Favor sells after the pullback fails and price prints a clear lower high. Place invalidation above the swing high, not “some pips” above the line.
Your goal is to map the pullback ceiling. You do not need a perfect fit, you need consistency.
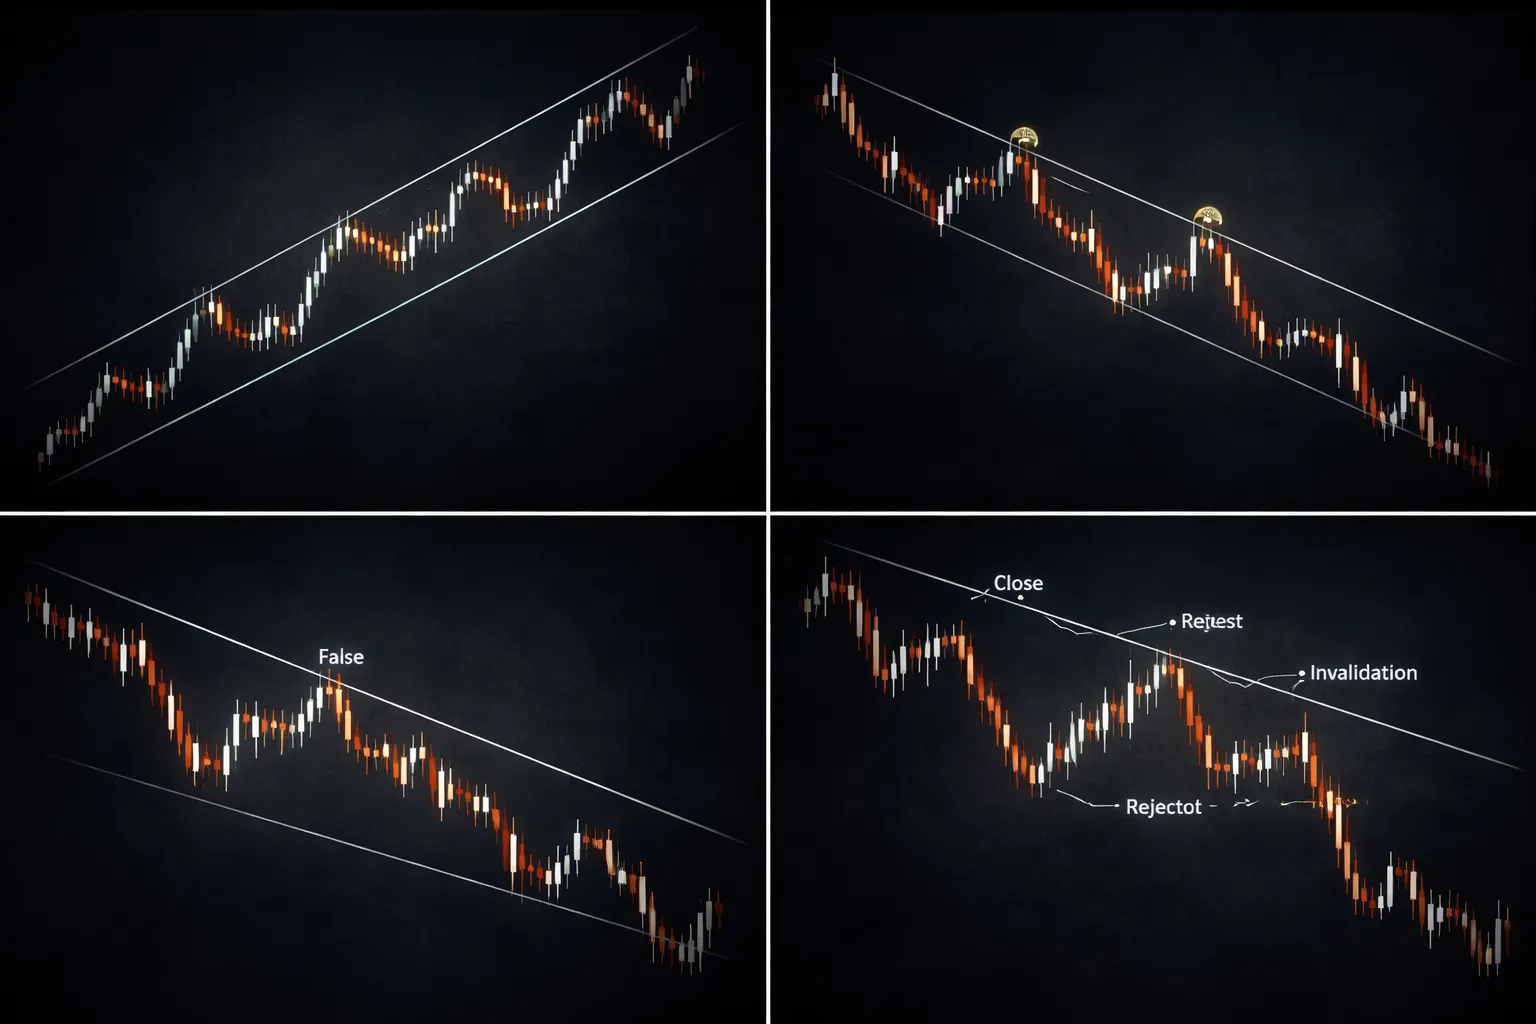
Example of a false breakout, what confirmation would have kept you out
False breakouts happen when you treat the first poke through the line as a signal.
- Common trap: Price wicks through the trendline, triggers breakout entries, then closes back inside.
- Filter 1, close location: Require a candle close beyond the line on your execution timeframe. No close, no trade.
- Filter 2, follow-through: After the close, price should push and hold beyond the line for at least one more swing. One candle is noise.
- Filter 3, broken structure: In an uptrend break, you want a lower low, not just a line break. In a downtrend break, you want a higher high.
- Filter 4, retest behavior: The clean breakout retests the line and rejects in the breakout direction. The false breakout snaps back through fast.
These checks slow you down. They also keep you out of most trendline traps.
Example of a trendline break that becomes support or resistance, mapping the retest
This is the highest confidence use of a trendline. Break, retest, decision.
- Step 1, mark the break: Draw the trendline from validated swing points. Wait for a clear close beyond it.
- Step 2, map the retest zone: Treat the line as an area, not a razor edge. Use the last swing point near the line as your reference.
- Step 3, look for rejection: On the retest, price should fail to reclaim the old trend side and then move away with momentum.
- Step 4, define invalidation: Put the stop beyond the retest swing, not just beyond the line. The swing defines the risk.
- Step 5, align with horizontal levels: If the retest happens at prior support or resistance, your setup improves. If it happens in empty space, reduce size or skip.
If you need help building screen time for these patterns, use a structured routine from practice with demo and replays.
Pros, Cons, and When to Use Alternatives
Strengths
- Simplicity. You need two clean swing points and a third touch or retest to judge if the line matters.
- Visual clarity. A good line shows direction, pullbacks, and where your retest may happen. You can spot a broken trend fast.
- Structure-based decision making. You can plan entries, stops, and targets around a retest swing. You can define invalidation in price terms, not in indicator terms.
Limitations
- Subjectivity. Two traders can draw different lines from the same chart. Small differences change your entry and stop distance.
- Timeframe dependency. A line that looks clean on H4 can fail inside M15 noise. A line drawn on M15 can mean nothing on D1.
- Volatility distortions. News spikes and wide wicks can pierce the line and snap back. If you treat every pierce as a break, you will overtrade.
When horizontal levels outperform trendlines
Use horizontals when the market trades in a box and keeps reacting at the same prices.
- Range conditions. Price bounces between clear support and resistance. A trendline adds little because the slope keeps changing.
- Key S/R zones. Round numbers, prior highs and lows, and consolidation edges often control price better than a diagonal line.
- Retests with multiple touches. If price hits the same level three to five times, trade the level first. Treat the trendline as context.
For a structured approach, see this support and resistance range trading strategy.
When moving averages or regression channels may be better
- Moving averages for trend strength. Use a 20 or 50 EMA when you need a repeatable filter. If price holds above the MA and pulls back into it, you can stay with the trend even when a trendline breaks early.
- Regression channels for noisy trends. Use them when swings look uneven and you want an objective slope and a volatility band. You can frame mean reversion to the midline and manage targets at the outer band.
- When structure is messy. If you cannot mark clean swings, trendlines become guesswork. A moving average or channel gives you a consistent reference.
FAQ
How many touchpoints do you need for a valid trendline?
Use two swing points to draw it. Require a third touch to validate it. More touches raise confidence. If price cuts through the line often, your anchor points are weak or the market has no clean structure.
Should you draw trendlines using wicks or candle bodies?
Start with wicks because they show extremes where price rejected. Switch to bodies when wicks are long and random. Stay consistent on that chart. If you mix rules, your line will drift and signals will change.
Which timeframe should you draw trendlines on?
Draw on higher timeframes first, then refine on your trading timeframe. Use daily and 4H for swing trades. Use 1H and 15M for day trades. Let higher timeframe lines act as the main boundaries.
How far can price break a trendline and still be “valid”?
Do not use a fixed pip rule. Use structure. Treat a break as valid when you get a close beyond the line and the next pullback fails to reclaim it. In volatile pairs, add an ATR-based buffer.
What is the best way to trade a trendline?
Trade the reaction, not the line. In an uptrend, buy after a bounce and a clear trigger candle. Place your stop beyond the last swing low. Set targets at prior highs or a channel boundary. See stop loss vs take profit.
Why do my trendlines keep getting broken?
You likely forced the line, used weak swing points, or ignored the higher timeframe. You may also trade during news or low liquidity. Redraw using the clearest swings. If swings look uneven, use a channel or regression line.
Can you draw multiple trendlines on the same move?
Yes. Use a primary line for the main trend and a steeper line for acceleration. When the steep line breaks, it often signals a slowdown, not a reversal. Keep both lines until price breaks the primary line.
Do trendlines work in ranging markets?
They work poorly when price chops without clear swings. You will get frequent false breaks. In ranges, prioritize horizontal support and resistance, then use a channel to frame the top and bottom of the range.
What is the biggest trendline mistake traders make?
They adjust the line to fit the latest price action. That destroys the signal. Lock your anchor points on clear swings. If the line fails, accept it and redraw from new structure. Do not “save” a broken line.
Conclusion
Conclusion
Trendlines work when you draw them from clear structure and you keep them fixed. Start on a higher timeframe. Mark obvious swing highs and lows. Connect two clean points, then require a third touch to confirm.
Do not chase price. If price breaks the line and fails to respect it on a retest, the line is done. Redraw from the new swing structure.
Your final step is risk control. Use the trendline to define the trade idea, then place your stop beyond the swing that supports your line, not on the line itself. Set a target at the next major support or resistance. Follow a simple process for stop loss and take profit.
- Anchor: Use obvious swings, avoid minor noise.
- Confirm: Wait for a third touch, then trade reactions.
- Reject: Do not “save” broken lines, redraw.
- Protect: Stop goes beyond structure, target goes to structure.
-
Stop Loss vs Take Profit: Differences, Examples & Best Practices
5 months ago -
Forex Trading Psychology Tips: How to Stay Disciplined and Consistent
5 months ago -
Forex Order Types Explained: Market vs Limit vs Stop Orders
5 months ago -
How to Set Stop Loss and Take Profit (Step-by-Step)
5 months ago -
How to Start Forex Trading Step by Step (Beginner Roadmap)
5 months ago
-
-
- Bounce Setups (Entry Triggers Near the Line)
- Breakout Setups (Close Beyond the Line vs Wick-Throughs)
- Break-and-Retest Strategy (Valid Retest Zone and Entry Timing)
- Stop-Loss Placement (Beyond Swings vs Volatility Buffers)
- Take-Profit Methods (Structure, Measured Moves, Channel Targets, Trailing)
- Risk Management (Sizing, R-Multiples, When to Skip)
-
- Example of a clean uptrend, multiple touches and a disciplined channel
- Example of a downtrend with corrective pullbacks, identifying the best anchor points
- Example of a false breakout, what confirmation would have kept you out
- Example of a trendline break that becomes support or resistance, mapping the retest
-
- How many touchpoints do you need for a valid trendline?
- Should you draw trendlines using wicks or candle bodies?
- Which timeframe should you draw trendlines on?
- How far can price break a trendline and still be “valid”?
- What is the best way to trade a trendline?
- Why do my trendlines keep getting broken?
- Can you draw multiple trendlines on the same move?
- Do trendlines work in ranging markets?
- What is the biggest trendline mistake traders make?
-
-
- Bounce Setups (Entry Triggers Near the Line)
- Breakout Setups (Close Beyond the Line vs Wick-Throughs)
- Break-and-Retest Strategy (Valid Retest Zone and Entry Timing)
- Stop-Loss Placement (Beyond Swings vs Volatility Buffers)
- Take-Profit Methods (Structure, Measured Moves, Channel Targets, Trailing)
- Risk Management (Sizing, R-Multiples, When to Skip)
-
- Example of a clean uptrend, multiple touches and a disciplined channel
- Example of a downtrend with corrective pullbacks, identifying the best anchor points
- Example of a false breakout, what confirmation would have kept you out
- Example of a trendline break that becomes support or resistance, mapping the retest
-
- How many touchpoints do you need for a valid trendline?
- Should you draw trendlines using wicks or candle bodies?
- Which timeframe should you draw trendlines on?
- How far can price break a trendline and still be “valid”?
- What is the best way to trade a trendline?
- Why do my trendlines keep getting broken?
- Can you draw multiple trendlines on the same move?
- Do trendlines work in ranging markets?
- What is the biggest trendline mistake traders make?
-
How to Place a Forex Trade Step by Step (Your First Trade Explained)
3 months ago -
Forex Trading vs Crypto Trading: Which Market Is Better for Beginners?
3 months ago -
Forex Lot Size Calculator: How to Use It to Size Trades Correctly
5 months ago -
How to Calculate Position Size in Forex (Position Sizing Formula + Examples)
5 months ago -
Forex Leverage Explained: How It Works, Pros, Cons & Examples
5 months ago
-
Forex Trading Platforms Comparison: MetaTrader vs cTrader vs TradingView
5 months ago -
Is Forex Trading Legal in the United States? Rules, Regulators & What to Know
5 months ago -
Stop Loss vs Take Profit: Differences, Examples & Best Practices
5 months ago -
Forex Market Hours & Trading Sessions Explained (Best Times to Trade)
5 months ago -
Forex Leverage Explained: How It Works, Pros, Cons & Examples
5 months ago