How to Backtest a Forex Strategy (Tools, Data & Process)
Backtesting turns a trading idea into numbers. You run your forex strategy on past price data, log every trade, and measure results. You learn if the edge is real, or if wins came from luck.
In this guide, you will learn the exact process to backtest a forex strategy. You will learn which tools to use, which data you need, and how to set rules so your test stays clean. You will also learn what to record, which metrics matter, and which mistakes ruin results. If your strategy uses fixed exits, review your take profit rules first with take profit levels.
Key Takeaways
- In het kort: Backtest one strategy, on one market set, with fixed rules.
- In het kort: Use clean, high-quality data that matches your timeframe and session.
- In het kort: Log every trade, then judge performance with a small set of hard metrics.
- In het kort: Separate in-sample and out-of-sample results, then forward test before you go live.
- In het kort: Avoid lookahead bias, curve fitting, and rule changes mid-test.
Key takeaways
- Write your rules first. Entry, exit, stop, take profit, position size, and no-trade conditions. No exceptions.
- Pick the right test type. Manual for discretion, automated for rule-based systems. Keep execution rules the same either way.
- Use data that fits your method. Same timeframe, same broker-like spread, and realistic slippage assumptions.
- Test enough samples. Aim for a trade count that reduces noise, then verify across different market regimes.
- Track the metrics that control risk. Win rate, average win, average loss, expectancy, profit factor, max drawdown, and streak length.
- Measure stability, not peak results. A strategy that holds up across pairs and periods beats a perfect curve on one dataset.
- Split your timeline. Build on in-sample data, validate on out-of-sample data, then forward test on recent charts.
- Log everything. Screenshot, time, pair, setup type, spread, news context, and rule compliance. This shows where results come from.
- Do not optimize until the base rules work. If you optimize, change one variable at a time and retest from scratch.
- Keep your chart reading consistent. If your strategy uses patterns, standardize how you mark structure. Use a single reference guide for forex chart patterns so you do not change definitions mid-test.
What backtesting means in forex (and what it can’t prove)
Backtesting vs forward testing vs paper trading
Backtesting checks your rules on past data. You use it first. You want fast feedback and a baseline you can measure.
Forward testing runs the same rules on new, unseen market data. You use it after backtesting. You want proof that the edge survives current conditions.
Paper trading executes trades in a live platform with live spreads and execution logic, but no real money. You use it to test the full workflow. You want to catch platform mistakes, order errors, and discipline leaks.
- Use backtesting to validate rules, filters, and risk logic on a large sample.
- Use forward testing to confirm the backtest did not overfit.
- Use paper trading to rehearse execution, timing, and rule compliance under real-time pressure.
What a backtest can realistically validate
A backtest can validate whether your strategy has a repeatable edge. It does this by measuring outcomes over many trades, across different periods, with the same rules.
- Edge: win rate, average win vs average loss, expectancy per trade, profit factor.
- Risk profile: max drawdown, average drawdown, time to recover, worst run of losses.
- Behavior: how results change by session, pair, volatility, and spread level.
- Rule clarity: whether you can apply entries and exits the same way every time. If you cannot, the strategy is not testable yet. Use one reference for pattern rules, for example a guide to candlestick patterns, and do not change definitions during the test.
A backtest also helps you set realistic expectations. You learn what losing streaks look like. You learn the drawdown you must tolerate to access the edge.
What backtesting cannot prove
A backtest cannot prove you will make money live. It cannot prove your broker fills will match history. It cannot prove your future market will behave like the sample.
- It cannot prove execution: slippage, partial fills, requotes, and spread spikes change results.
- It cannot prove you will follow rules: hesitation, revenge trades, and early exits break the system.
- It cannot prove stability: a strategy can work in one regime and fail in another.
Limitations unique to forex backtests
Forex is decentralized. There is no single official price or volume feed. Your results depend on the data source and broker conditions.
- Different feeds: candle highs and lows vary by broker. This changes stop-outs and triggers.
- Variable spreads: spread widens at rollover, during news, and in thin liquidity. Fixed-spread assumptions inflate performance.
- Execution model: market makers and ECN style pricing behave differently. Your backtest may not reflect your live account.
- Tick quality: many retail datasets approximate ticks. This hurts accuracy for scalping and tight stops.
When backtesting is misleading
Some conditions produce clean charts and unrealistic fills. Your backtest can look stable, then fail fast in live trading.
- News spikes: stops slip, spreads jump, and price gaps through levels. Bar data hides the path price took.
- Illiquid sessions: late New York, rollover, and some cross pairs can print erratic wicks and wide spreads.
- Regime shifts: rate cycles, volatility changes, and trend to range transitions can erase an edge.
- Curve fit filters: extra indicators and tight parameter tuning can match history and fail forward.
To reduce false confidence, separate results by period, session, and volatility. Track performance before and after major macro shifts. If the edge only exists in one narrow slice, treat it as fragile.
Prerequisites: define your strategy in testable rules
Turning an idea into unambiguous entry and exit criteria
A backtest needs rules your platform can execute without interpretation. If you cannot code it, you cannot test it.
- Define the setup. List every condition that must be true to allow a trade.
- Define the trigger. Specify the exact event that opens the trade. Use one price and one time reference, for example, “buy at the next bar open” or “buy on a stop at X.”
- Define the data you read. Candle type, indicator inputs, lookback length, and the price used, close, high, low, or bid, ask.
- Define order type. Market, limit, stop. State whether you allow partial fills, slippage, and spread impact.
- Define one trade per signal logic. Can you stack positions, pyramid, or only hold one position per pair.
- Define exits as rules. Stop loss, take profit, time based exit, or signal based exit. Write the priority if multiple exits can trigger on the same bar.
Keep rules binary. Each line should evaluate to true or false.
Specifying risk management: position sizing, stop logic, and trade management
Most strategy failures come from vague risk rules. Your backtest should treat risk as part of the system, not a setting you tweak later.
- Position sizing. Fixed lots, fixed dollar risk per trade, or fixed percent risk. State the exact formula. Include how you convert pips to money and how you handle different quote currencies.
- Stop placement. Fixed pips, ATR multiple, structure based, or time based. Define the exact reference candle and distance.
- Stop execution. Decide whether stops fill at the stop price or at the next available price. Include slippage and spread.
- Take profit logic. Fixed R multiple, fixed pips, or trailing logic. Define when and how the trailing stop updates, every tick, every bar close, or only when price moves X.
- Trade management. Break even moves, partial closes, and scaling rules. Specify trigger thresholds and order sizes.
- Risk limits. Max open trades, max risk across positions, daily loss stop, and max consecutive losses before a pause.
If you use R multiples, define R as your initial stop distance. Keep it consistent. Use a single reference for risk reward, then compare results across periods. If you need a refresher, link your rules to a clear risk reward framework.
Defining the trading universe: pairs, sessions, and timeframes
Do not backtest “forex” as a single market. Your results depend on the pairs, hours, and timeframe you trade.
- Pairs. List the exact symbols. Decide whether you include majors only, or also crosses and exotics.
- Session filter. Define start and end times in a single timezone. Specify whether you trade London only, New York only, overlap, or 24 hours.
- News handling. Decide whether you block trades around high impact events. Define the window, for example, no entries 30 minutes before and after.
- Timeframe. Choose the chart timeframe and the execution timeframe. If you use M15 signals and execute on M1, state it.
- Data source assumptions. Decide whether your test uses bid candles, ask candles, or mid. Spread and execution differ across brokers.
Keep the universe stable during testing. If you change pairs or sessions mid test, treat it as a new strategy variant.
Writing assumptions down (market conditions where the strategy should and shouldn’t work)
Write your edge hypothesis in plain terms. Then define the conditions that support it and the conditions that break it. This reduces hindsight tuning.
- Volatility regime. State whether you expect performance in low, normal, or high ATR environments. Add a rule if you filter by volatility.
- Trend versus range. Define how you classify trend and range using objective measures, for example, moving average slope threshold or ADX level.
- Spread sensitivity. Note if the strategy needs tight spreads. Define a maximum spread filter if required.
- Session behavior. State if you rely on breakout hours, overlap liquidity, or quieter ranges.
- Failure modes. List when you stop trading, for example, after a drawdown level, after a central bank week, or during holidays.
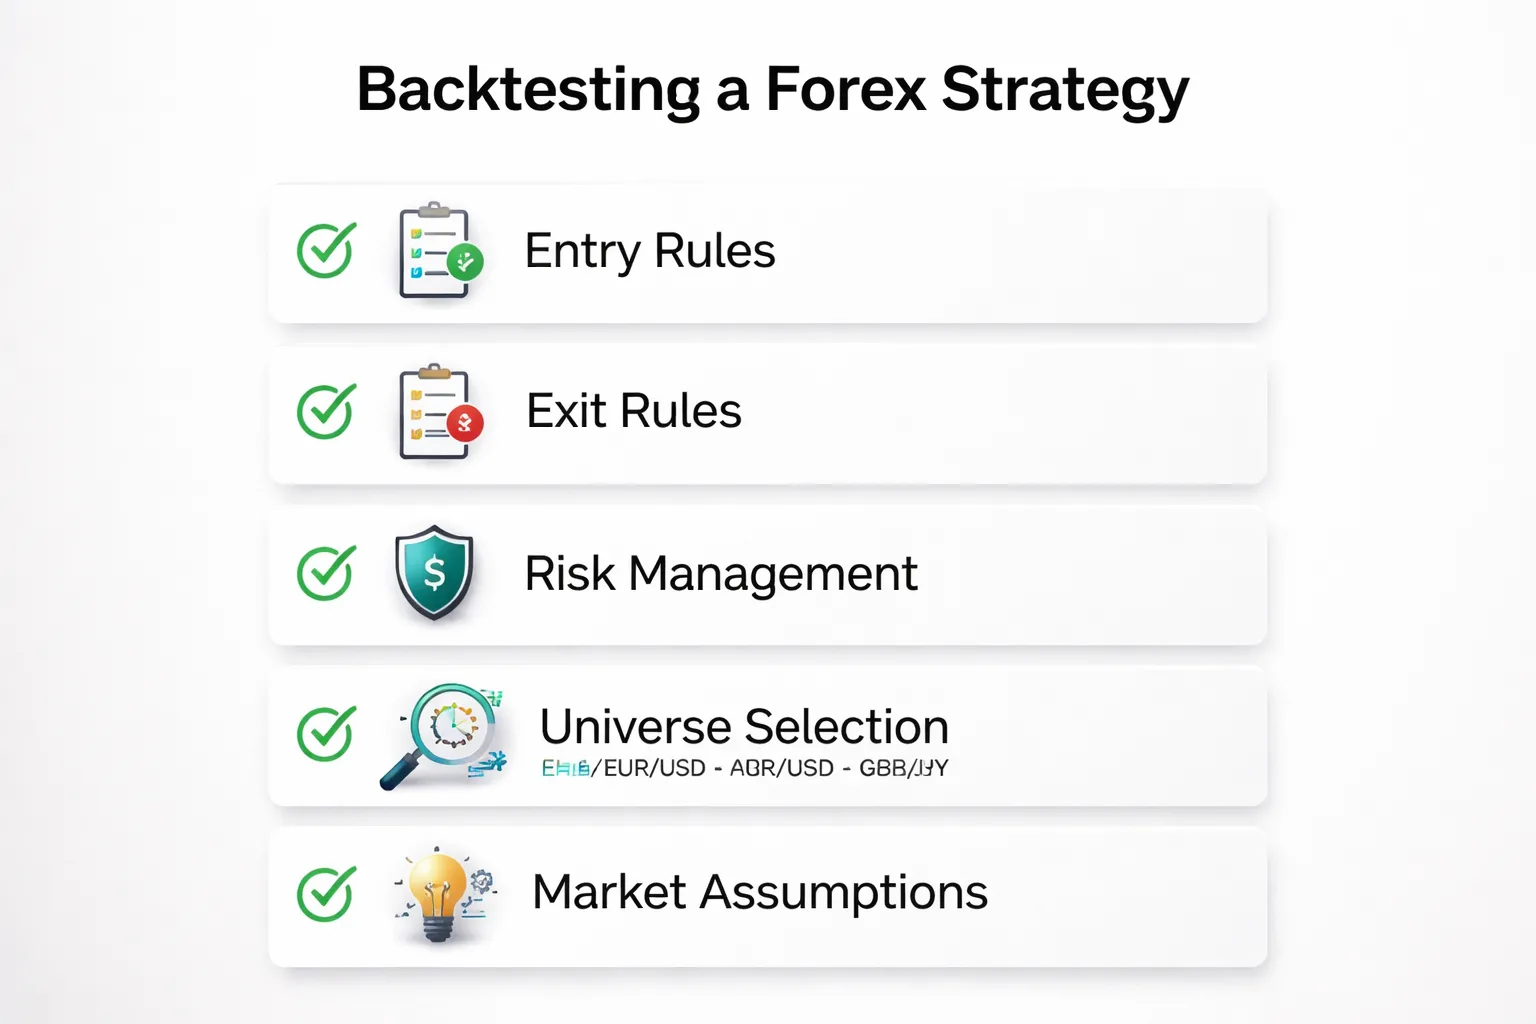
| Item | Write it as a testable rule |
|---|---|
| Entry trigger | Price, time, and order type, with exact bar reference |
| Exit priority | Stop vs target vs time exit, defined order of execution |
| Risk per trade | Fixed lot or % risk formula, with pip value conversion |
| Trade management | Exact thresholds for trailing, break even, and partials |
| Universe | Pairs, session hours, timeframe, and broker pricing assumptions |
| Market assumptions | Volatility, trend or range definition, spread limits, news rules |
Historical forex data: what to use and how to validate it
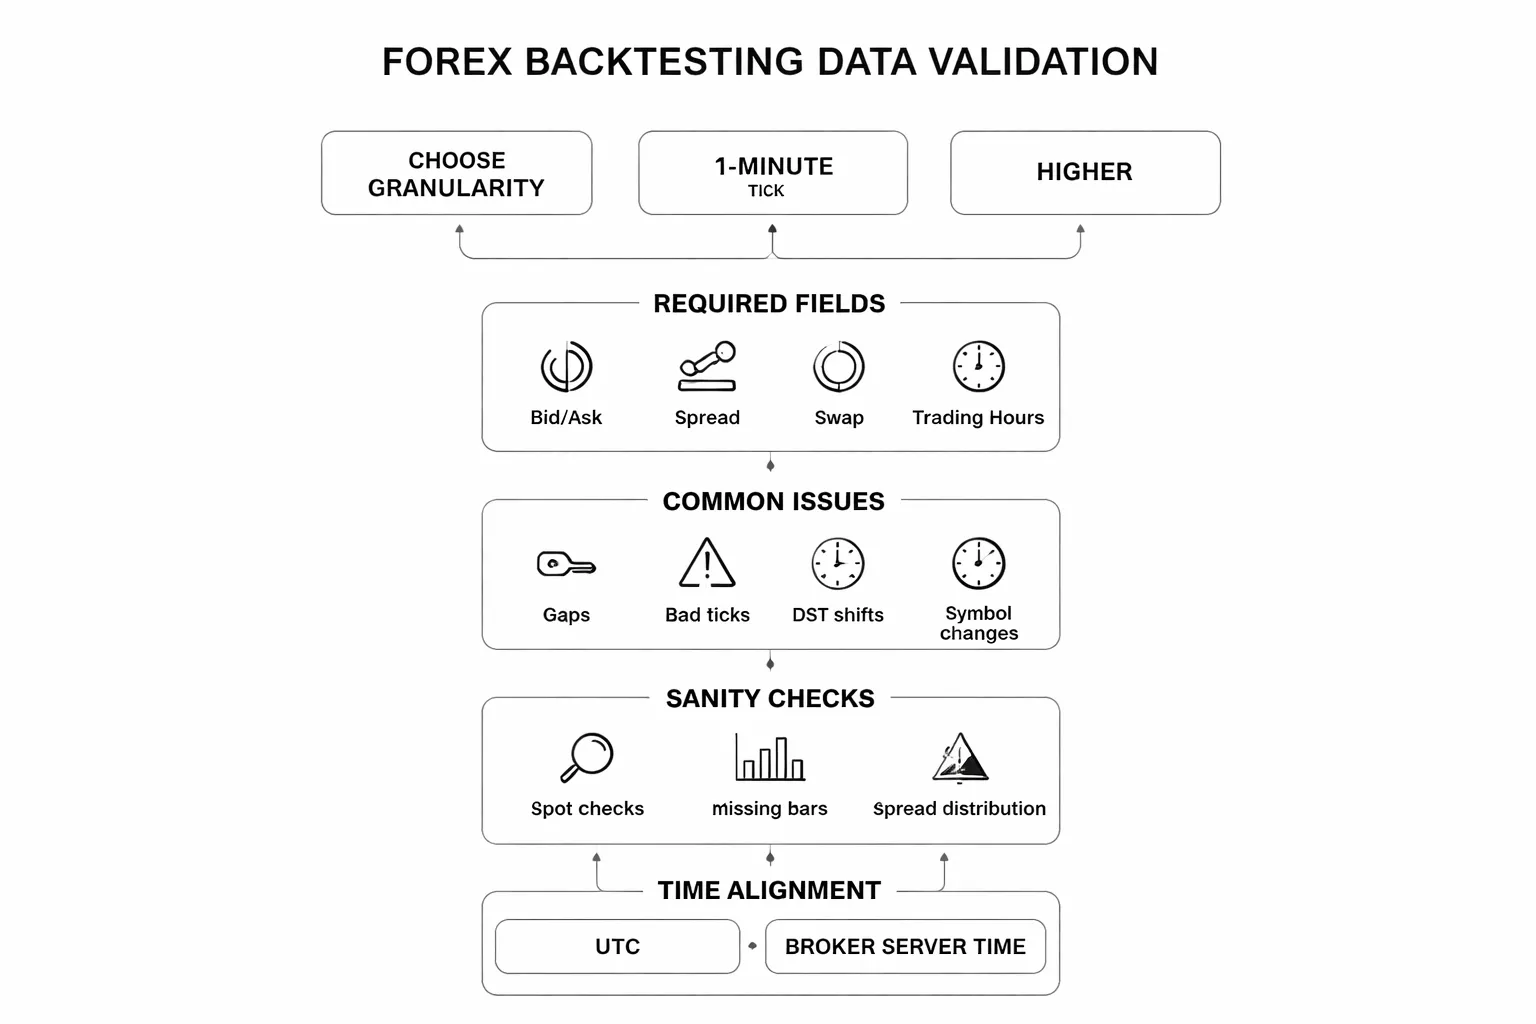
Choosing data granularity, tick vs 1-minute vs higher timeframes
Your data timeframe must match your execution rules. If your strategy enters and exits on bar close, you can test with 1-minute or higher. If you use intrabar triggers, tight stops, or scalping logic, you need tick data.
- Tick data, best for scalpers, spread sensitive systems, stop and limit fills that depend on the exact sequence of quotes. It is heavy, slower, and harder to clean.
- 1-minute data, best for most retail systems. You can model intrabar moves with OHLC, but you will still miss tick level spread spikes and quote jumps.
- 5-minute to 1-hour data, best for swing systems with wide stops and end of bar execution. You must accept less accurate fills and fewer signals on microstructure effects.
If you cannot explain why you need tick, use 1-minute. Then confirm your edge holds when you add realistic spreads and slippage.
Key data fields you need, bid/ask, spreads, swaps, and trading hours
Forex backtests fail when you test on mid price only. You trade the bid and ask. Your data must let you reconstruct that.
- Bid and ask quotes, required for correct entries, exits, stops, and limits.
- Spread, either as explicit bid/ask or a spread series. Use variable spreads, not a single constant, if your strategy trades around session opens or news windows.
- Swap rates, needed for any hold time past rollover. If you hold for days, swap can flip your expectancy.
- Rollover time, usually 5pm New York, but it depends on broker server time.
- Trading hours and session rules, especially for indices and CFDs, but also for forex around holidays and low liquidity periods.
Also store symbol metadata. Contract size, pip size, and minimum price increment must match your broker.
Common data issues, gaps, bad ticks, DST shifts, and symbol changes
- Gaps, missing minutes or hours create fake signals and clean fills. Mark gaps and skip trading through them, or fill them with a rule you document.
- Bad ticks, single quotes with huge spikes create false stop outs and false breakouts. You must detect and filter them.
- DST shifts, daylight saving changes move session boundaries and rollover in your charts. If your strategy uses “London open” or “New York close,” DST errors will rewrite your trade list.
- Symbol changes, brokers rename pairs or change suffixes. Some feeds shift from EURUSD to EURUSD.i or similar. Map symbols so you do not mix series.
- Price format changes, 4-digit to 5-digit quoting changes pip math and stop distances if your code assumes one format.
How to sanity-check data quality before testing
Run checks before you run a backtest. You want to catch feed errors, timezone drift, and spread problems early.
- Spot checks, pick 20 random timestamps. Compare your data to a second source, or to your broker chart. Check bid, ask, and spread.
- Missing bar checks, count bars per day. For 1-minute data you expect 1440 minutes for full day coverage, minus known maintenance windows. Flag days with abnormal counts.
- Spread distribution, compute median, 95th percentile, and max spread per session. If your max spread is extreme during liquid hours, you likely have bad quotes.
- Return distribution, compute minute-to-minute returns. Flag outliers beyond a set multiple of typical volatility. Review those timestamps for bad ticks.
- High-low integrity, for each bar ensure high is not below open or close, and low is not above open or close. Fix or remove corrupted bars.
- Rollover behavior, inspect spreads and price jumps around rollover. Many feeds widen spreads hard. Your test must reflect it, or you must block trading there.
Keep a log of every filter and fix. If you cannot explain a cleanup rule, do not use it.
Aligning broker/server time and session filters for apples-to-apples results
Your session filters depend on server time. Your broker charts can run on GMT+0, GMT+2, or a shifting offset. You must align your data clock to your execution assumptions.
- Pick one time standard, UTC is the cleanest. Convert everything to it, including your session windows.
- Map broker server time, record the broker offset and DST policy. Apply the same offset to historical data used for testing.
- Define sessions by UTC times, then convert to server time only for execution. This reduces DST mistakes.
- Match bar close time, a “daily” candle depends on server timezone. If your rules use daily levels, you must use the same daily cut as your broker.
- Apply the same trading hours, if your plan blocks Asian session or trades only London, enforce it with the aligned clock. Keep it consistent with your written rules in your trading plan.
When your time alignment is right, your backtest trades will match what you would have seen live. When it is wrong, your results will look clean and fail in execution.
Tools to backtest a forex strategy (manual, platform-based, and coded)
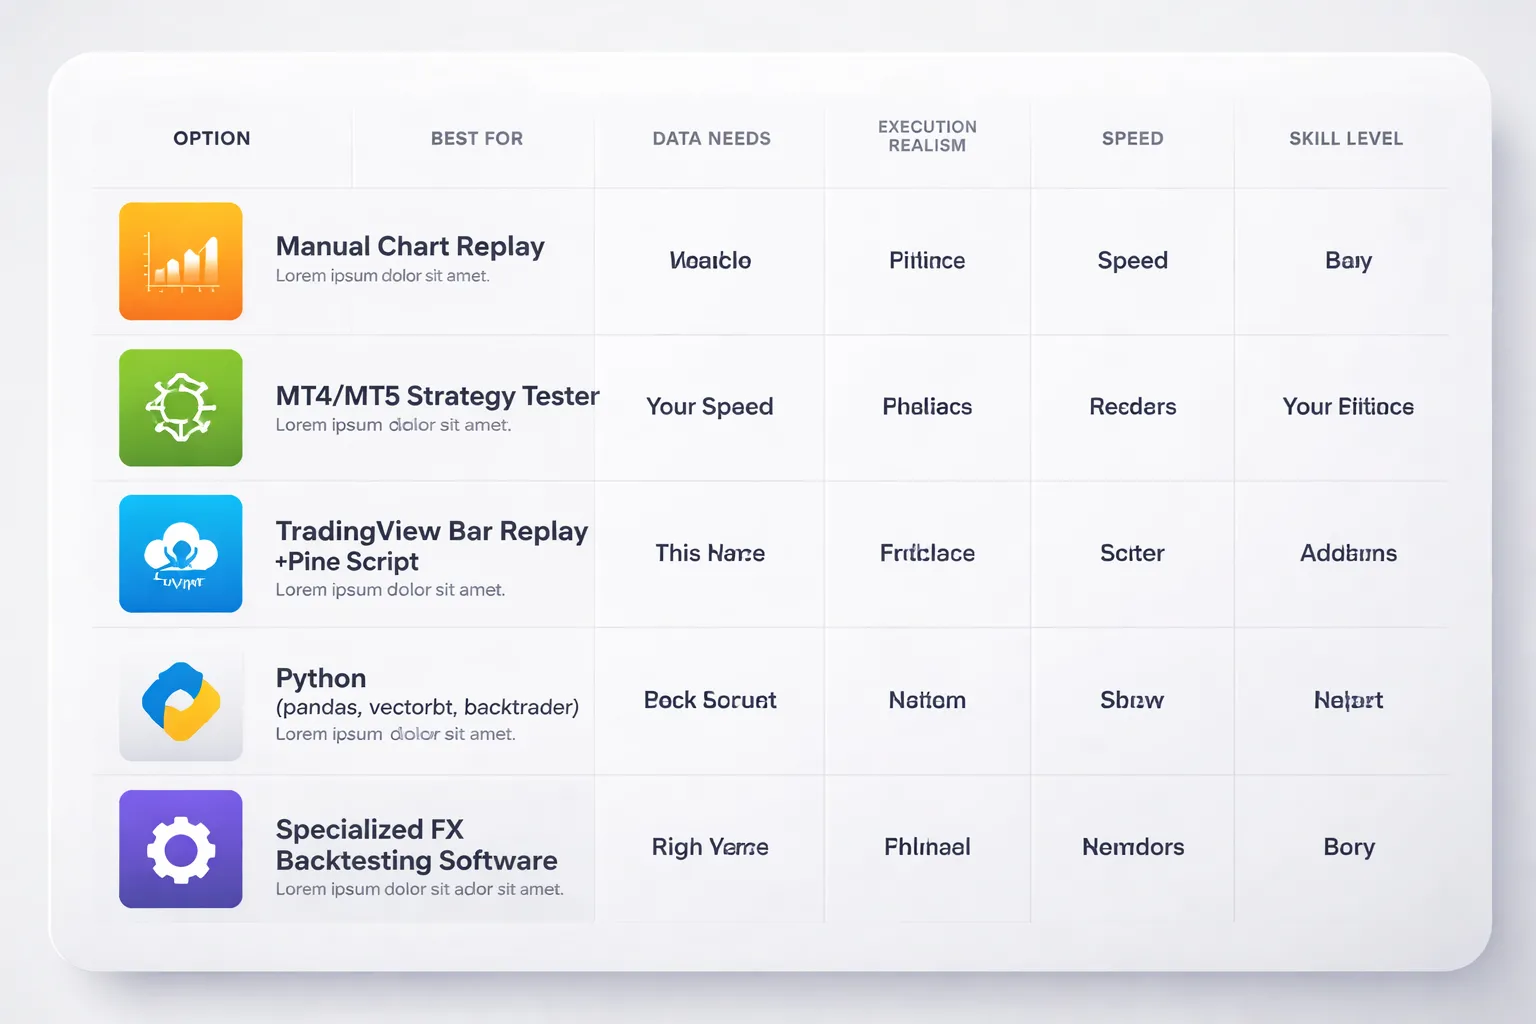
Manual backtesting with chart replay
Manual replay fits discretionary trading. It also fits rule sets that depend on context, like structure, multi-swing patterns, and “only trade after a sweep” type filters.
- Best for: price action, pattern trading, support and resistance, discretionary trade management, session based rules.
- What you capture well: chart context, missed trades, rule breaks, decision speed, realistic “in the moment” reads.
- What you will miss: exact spread effects, tick by tick fills, partial fills, broker specific execution.
- Minimum kit: a replay tool, a trade log, and a strict checklist for entry, stop, take profit, and management rules.
- Workflow: set the correct trading session and daily cut, hide future candles, replay bar by bar, log every signal, log every skip, screenshot key cases.
If your edge depends on judgment, start here. Then validate the core rules with a more automated test if possible.
MT4 and MT5 Strategy Tester
Strategy Tester works when you can code the rules as an EA. It gives fast iteration and clear stats. It also adds execution assumptions that can mislead you if your modeling is weak.
- Strengths: fast runs, parameter sweeps, repeatable results, broker symbol compatibility, easy export of reports.
- Limitations: results depend on data quality, spread model, slippage model, and tick modeling. Many builds hide execution problems behind optimistic assumptions.
- Best use cases: mechanical entries and exits, indicator systems, fixed stop and target, time filters, simple trailing rules.
Setup checklist:
- Match symbol and contract specs to your broker, digits, point value, swap, commission.
- Set test period and enforce your session rules, including no trade windows.
- Choose the highest fidelity tick option available in your platform build, then confirm how it generates ticks.
- Use variable spread if supported, otherwise test with a conservative fixed spread.
- Add commission and realistic slippage. Hard code it if the tester ignores it.
- Validate on multiple years, then forward test on a later segment with no parameter changes.
- Export trades, then spot check fills on the chart. Do not trust the equity curve alone.
TradingView Bar Replay and Pine Script
TradingView replay helps you practice execution and log trades. Pine Script helps you test rules that fit TradingView’s order model. It works well for higher timeframes and simple execution logic.
- When it is sufficient for FX: H1 and above, swing systems, indicator based rules, fixed stop and target, time based filters, single position logic.
- Where it breaks: tick level triggers, stop hunting logic, spread sensitive scalps, news spike behavior, complex multi order execution.
- Practical tip: use Bar Replay for discretionary review, use Pine for rule consistency checks. Treat fills as approximate unless you model costs and slippage.
Python backtesting stacks (pandas, vectorbt, backtrader)
Python fits you if you want control. You can clean data, model costs, and run large test sets. You also take on engineering work and data responsibility.
- Use pandas: quick research, signal prototypes, position sizing tests, performance breakdowns.
- Use vectorbt: fast parameter sweeps, portfolio style research, many variants across many pairs.
- Use backtrader: event driven testing, more realistic order handling, multi timeframe logic, custom analyzers.
- Who should use it: systematic traders, quant minded discretionary traders, anyone who needs multi pair validation and strict cost modeling.
- What you must model: spread, commission, swap, session hours, slippage, order type behavior, and latency assumptions.
Specialized FX backtesting software
Specialized tools cost more. They can save months if your strategy depends on execution detail.
- Multi-currency support: you need this if your rules reference correlated pairs, baskets, or risk caps across symbols.
- Tick modeling: you need accurate tick replay, not synthetic ticks from bars, for scalping and tight stops.
- Execution model: you need configurable spread, commission, swap, slippage, stop and limit behavior, and partial fills if your method relies on them.
- Session and calendar control: you need trading windows, holiday filters, and news blackout windows if they sit in your rules.
- Audit trail: you want a full trade ledger with timestamps, reason tags, and screenshots or chart states for review.
Buy features that match your edge. Do not pay for complexity you will not use.
Tool selection matrix
| Strategy type | Your skill level | Best tool | Why it fits |
|---|---|---|---|
| Discretionary price action, pattern filters | Beginner to advanced | Manual chart replay | Captures context and decision rules you cannot code cleanly |
| Mechanical indicator rules, fixed SL and TP | Intermediate | MT4 or MT5 Strategy Tester | Fast iteration and repeatable stats if data and costs are set right |
| Higher timeframe swing system, simple execution | Beginner to intermediate | TradingView Bar Replay plus Pine Script | Quick review and basic automation with acceptable fill assumptions |
| Multi-pair system, portfolio risk rules, research heavy | Intermediate to advanced | Python with pandas and vectorbt | Scale testing across pairs and parameters with strong analytics |
| Event-driven logic, complex orders, multi-timeframe rules | Advanced | Python with backtrader | More realistic order handling and custom execution logic |
| Scalping, tight stops, spread sensitive execution | Intermediate to advanced | Specialized FX backtesting software | Tick replay and execution modeling reduce false performance |
Pick the simplest tool that can model your rules and your costs. If you struggle to follow rules under replay, fix that before you optimize anything. Use your log to build discipline, then reinforce it with deliberate practice and strong routines, see forex trading psychology tips.
The step-by-step process to backtest a forex strategy
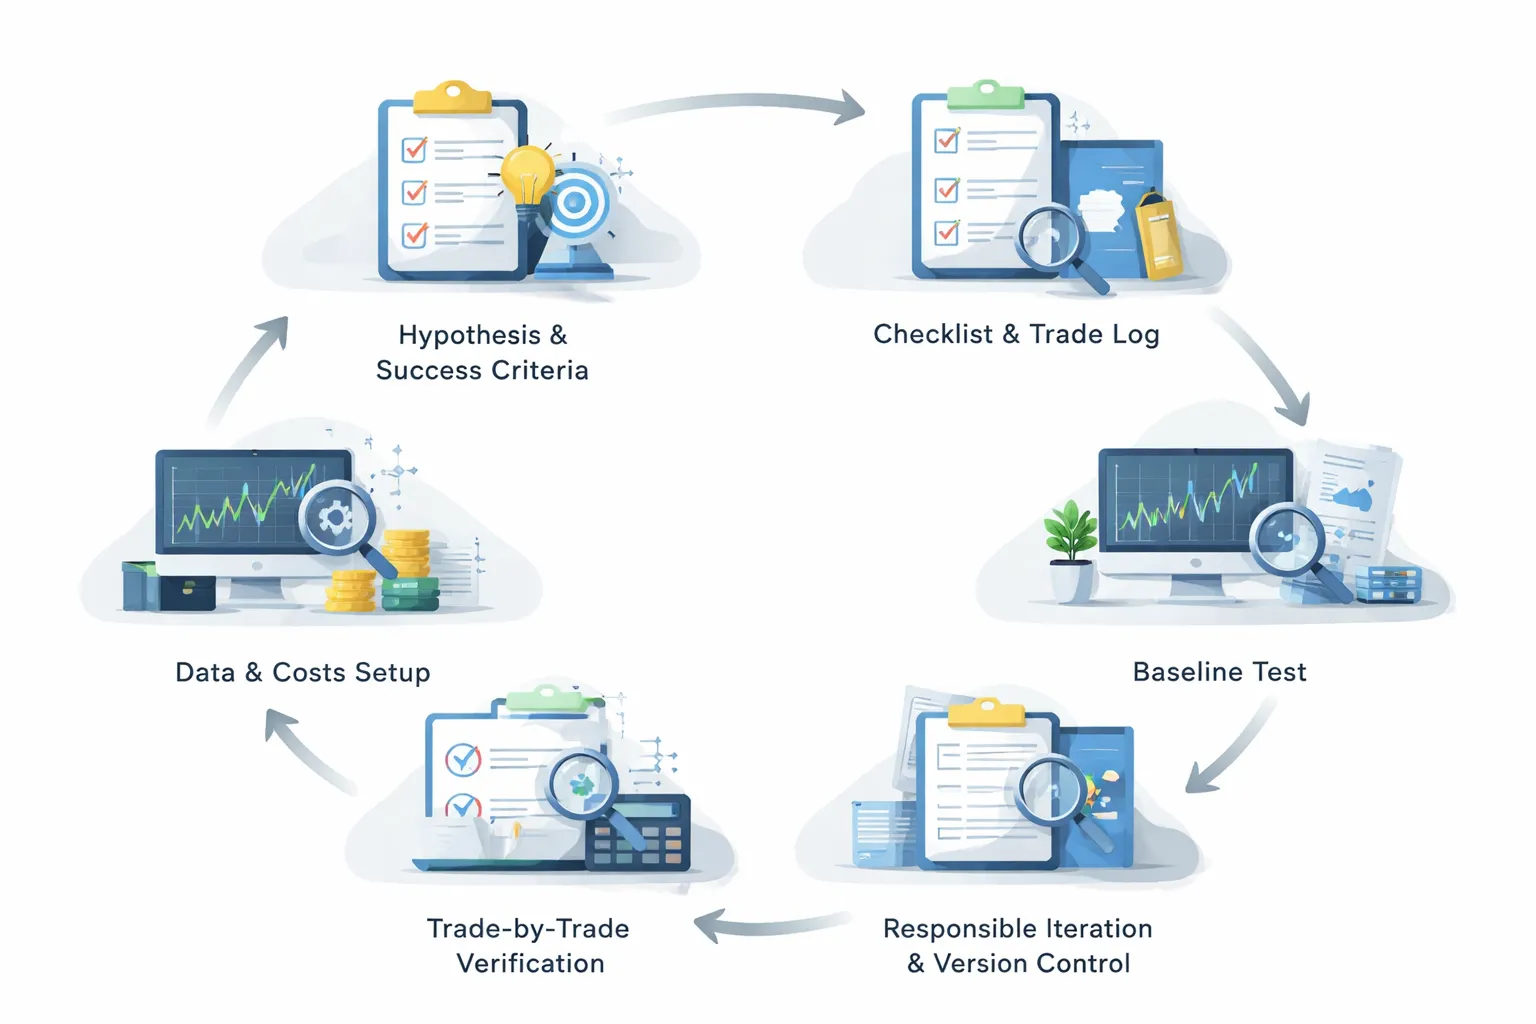
Step 1: Write the hypothesis and define success criteria
Start with one clear idea. Write it in plain language. If you cannot explain it in two sentences, you cannot test it.
- Market: pair(s), session, timeframes.
- Setup: what must be true before you look for an entry.
- Trigger: the exact entry condition.
- Exit: stop, target, and any trailing or time stop rules.
- Risk: fixed percent, fixed lot size, or fixed cash risk per trade.
- Filters: news, volatility, spread, time of day, trend filter.
Define success before you run a test. Use hard numbers.
- Sample size: minimum trades, for example 100 to 300, more if the strategy trades less often.
- Max drawdown limit: a level you can tolerate in live trading.
- Expectancy: average R per trade, after costs.
- Win rate and average win loss: so you understand the payoff profile.
- Stability checks: results hold across pairs or years, not one short window.
Use R as your base unit. One R equals your initial stop distance. This keeps results comparable across pairs and volatility regimes.
Set a minimum risk reward expectation that matches your system. If you need a refresher, review your risk-reward ratio.
Step 2: Build a rules checklist and a trade log template
Turn the strategy into a checklist you can follow without judgment.
- Entry conditions, written as yes or no items.
- Stop placement rule, with one method only.
- Target placement rule, with one method only.
- Position sizing rule, with the exact formula.
- Management rules, including when you do nothing.
- Invalidation rules, so you know when to skip.
Build a log template before you test. Record enough to audit every trade later.
- Date, time, pair, session.
- Timeframe for signal and timeframe for execution.
- Entry price, stop price, target price.
- Spread at entry, slippage assumption, commission.
- Position size, risk in cash, risk in R.
- Result in pips and R.
- Reason codes, one for entry, one for exit.
- Rule compliance, pass or fail.
- Screenshot links if you use manual review.
Step 3: Import or prepare data and set trading costs
Bad data makes good ideas look great. Lock down your inputs.
- Choose data type: bar data for higher timeframes, tick data for scalping and tight stops.
- Set the test window: include different regimes, trends, ranges, and high volatility periods.
- Clean the data: remove duplicates, fix time zone alignment, confirm weekend gaps.
- Confirm candle construction: broker time affects daily and weekly levels.
Model costs like you will pay them.
- Spread: use variable spreads if your platform allows it, especially around session opens and news.
- Commission: set per lot or per million, matching your account type.
- Slippage: set a fixed value or a distribution, then apply it to stops and market orders.
- Swap: include overnight financing if you hold trades for days.
- Execution rules: decide if you allow limit fills inside the spread, and keep it consistent.
Step 4: Run the first baseline test (no optimization yet)
Test the strategy as written. Do not tune parameters. You need a clean baseline.
- Use one pair and one timeframe first.
- Use fixed risk, for example 1R per trade, so you can compare periods.
- Keep all filters turned on, as written in the checklist.
- Run the test from start to finish with no rule changes.
Export results and store them. Save the equity curve, trade list, and settings.
| Metric | What to check |
|---|---|
| Trades | Enough count to reduce noise. |
| Expectancy (R) | Positive after spread, commission, slippage, swap. |
| Max drawdown | Within your limit and not concentrated in one short period. |
| Profit factor | Acceptable for your style, but do not chase a single number. |
| Avg win and avg loss | Matches your rule design and target stop structure. |
Step 5: Verify trade-by-trade correctness (spot-check signals and fills)
Backtests fail most often here. Your goal is to confirm the engine followed your rules.
- Pick 20 to 50 trades across the whole test period.
- Check each signal candle against your checklist.
- Confirm entry price logic, stop placement, and target placement.
- Confirm the fill model, spread, and slippage assumptions.
- Check edge cases, session opens, rollovers, and high spread moments.
Look for common errors.
- Lookahead: using future candle values for today’s signal.
- Wrong bar: signal on close, but executed on the same bar open.
- Indicator repainting: signals change after the fact.
- Stops and limits: filled when price never traded there after costs.
- Data gaps: missing ticks can hide stop-outs.
If you find one mismatch, stop. Fix the rule logic or the settings, then rerun the baseline.
Step 6: Iterate responsibly: refine rules, retest, and version-control changes
Change one thing at a time. Track every change. Keep your baseline intact.
- Create versions, for example v1.0, v1.1, v1.2.
- Log the exact change, the reason, and the expected effect.
- Retest on the same in-sample window first, then recheck spot samples.
- Run an out-of-sample test on a different period or pair.
- Reject changes that improve one period but break another.
Avoid parameter fishing. Use wide steps, not tiny increments. If a strategy only works with one exact setting, it will likely fail live.
When the rules stabilize, repeat on more pairs and more market regimes. Then forward test on demo with the same costs and execution assumptions.
Modeling real trading conditions (costs, execution, and constraints)
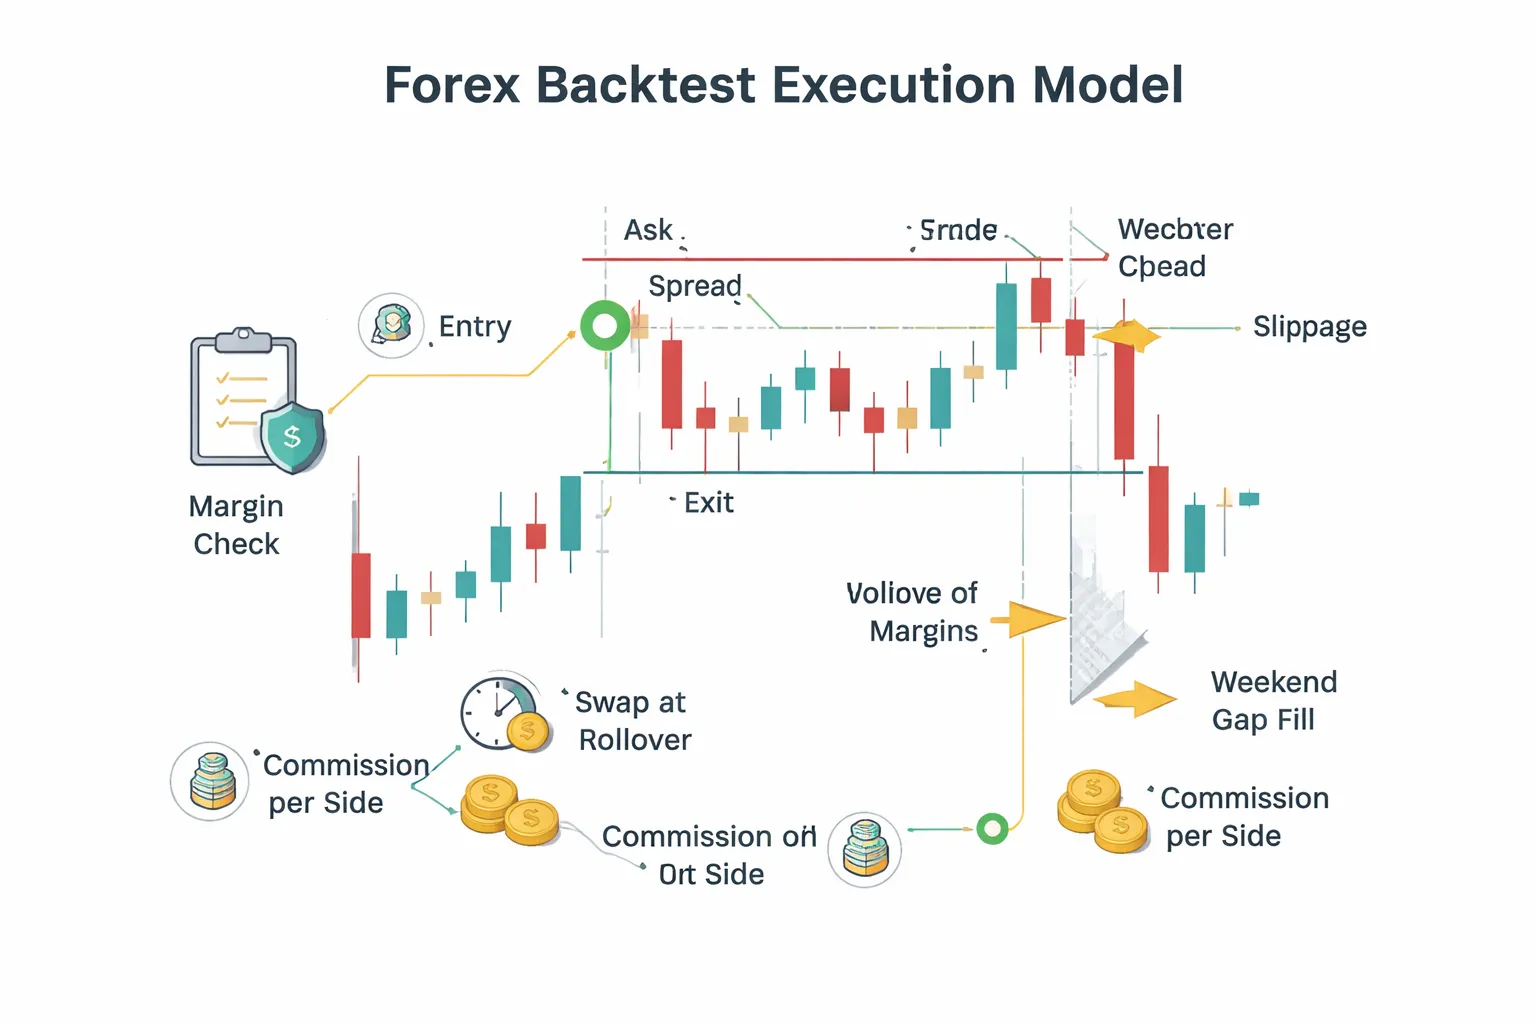
Spread, commission, and swaps: include them the right way
Your backtest must pay the same costs you pay live. If you skip them, your edge will look larger than it is.
- Spread. Apply spread at the time of entry and exit. Use bid and ask prices, not mid. If you only have OHLC mid candles, subtract spread on buys and add spread on sells when you simulate fills.
- Variable spread. Do not hardcode one number. Use historical tick or quote data when possible. If you cannot, use a time-of-day spread schedule, wider at rollover and news, tighter in liquid sessions.
- Commission. Charge it per side, per lot, in account currency. Apply it when you open and when you close. If your broker uses commission plus raw spread, model both.
- Swaps. Apply financing at rollover for every open position. Use long and short swap rates, in points or account currency. Add the triple swap day your broker uses. Do not assume swaps are small, they can flip a marginal system negative.
- Currency conversion. If your account currency differs from the quote currency, convert commissions, swaps, and PnL using the rate at the time of the charge.
Slippage models for FX: fixed, volatility-based, and worst-case
Slippage is your hidden cost. It spikes when liquidity drops and when price moves fast.
- Fixed slippage. Add a constant number of pips per fill. Use different values for major pairs and crosses. Use a larger number for stops than for limits.
- Volatility-based slippage. Tie slippage to recent volatility. Example: slippage in pips equals k times ATR(14) in pips, capped at a max. This model reacts to news and session shifts.
- Worst-case assumptions. Stress test. Multiply spread and slippage by 2 to 5 during rollover, news windows, and illiquid hours. If the strategy breaks under mild stress, it is fragile.
Market hours, rollover, and weekend gaps: handle edge cases
FX is not truly 24/5 in practice. Liquidity, spreads, and fills change by hour.
- Session filters. If your rules only work in liquid hours, enforce that constraint. Do not let the backtest trade Sunday open spreads or late Friday drift unless you allow it live.
- Rollover. Mark a daily rollover time. Widen spreads and apply swap there. Treat it as a high cost window, not a normal trading minute.
- Weekend gaps. If you hold positions into the weekend, allow gaps on the open. Your stop may fill worse than its level. Model a gap fill at the first tradable price.
- Data holes. Detect missing bars or quotes. Either remove those periods from testing or block trading through them. Do not let the engine assume perfect continuity.
Order types and fill logic: market vs limit/stop and partial fills
You need fill rules that match your execution.
- Market orders. Fill at the next available bid or ask plus slippage. Do not fill at the signal bar close unless you trade that exact print.
- Limit orders. Fill only if price trades through your level. Use bid for sell limits and ask for buy limits. If your data is candle-based, define a consistent rule for intrabar ordering and keep it conservative.
- Stop orders. Trigger when price reaches the stop level, then fill with slippage. On gaps, fill at the gap open price, not at your stop price.
- Partial fills. In spot FX retail, you often get full fills, but size can matter on some venues. If you trade larger size, add a partial fill model or a max size per tick rule. If you cannot model it, cap your trade size to realistic retail levels.
- One order per bar rules. Prevent impossible behavior, like entering and exiting at the same price on the same bar without a tick model. Decide whether stops or targets get priority when both hit inside one bar, then apply the same rule every time.
Position sizing realism: minimum lot sizes, leverage, margin calls, and max exposure
A backtest that ignores sizing constraints lies about risk and survivability.
- Minimum lot and step. Enforce your broker’s minimum and increment, like 0.01 lots with 0.01 steps. Round sizes down, not up.
- Leverage and margin. Calculate required margin per position using contract size, price, and leverage. Block trades that exceed free margin.
- Margin calls. Simulate liquidation. If equity drops below maintenance rules, close positions at the next tradable price with slippage. This matters for grid and martingale systems.
- Max exposure. Set limits on total lots, total notional, and total risk across correlated pairs. A EURUSD and GBPUSD long is not two independent bets.
- Risk per trade consistency. Use a position size method you can execute, like fixed fractional risk based on stop distance. Keep it stable across tests, the same way you would trade live. This pairs well with a rules-based system like a breakout trading strategy where stop distance can vary by volatility.
How to analyze backtest results like a professional
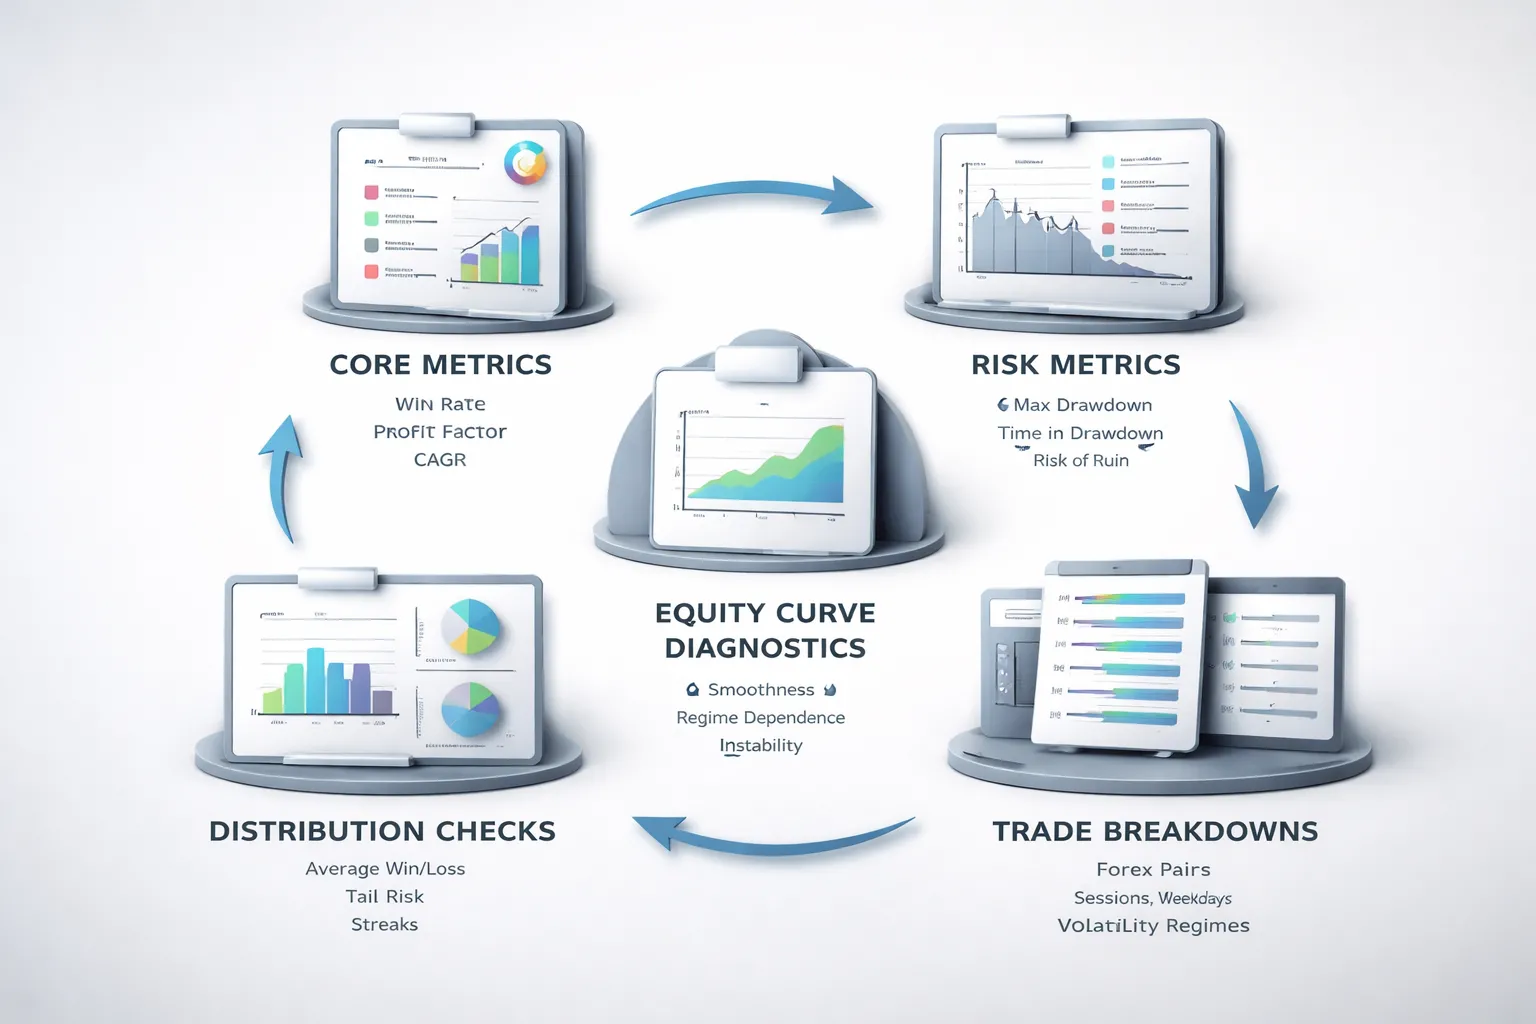
Core performance metrics you should trust
Start with the numbers that explain your edge. Ignore raw net profit until these make sense.
- Win rate. The percent of winning trades. High win rate does not mean high returns. It often means small wins and large losses.
- Expectancy. The average amount you make per trade in R. Use this formula: Expectancy = (Win% × Avg Win in R) − (Loss% × Avg Loss in R). You want a positive value that stays stable across different samples.
- Profit factor. Gross profit divided by gross loss. Treat it as a quality check, not a guarantee. Watch how it changes when spreads rise or filters change.
- CAGR. The annualized growth rate. It helps you compare strategies with different test lengths. Do not accept CAGR without drawdown context.
Risk metrics that matter in real trading
Returns do not keep you alive. Risk does.
- Max drawdown. Measure it in percent and in R. Then compare it to your planned risk per trade. If you risk 1R per trade and your historical max drawdown is 25R, plan for worse.
- Time in drawdown. Track how long it takes to recover to a new equity high. Long drawdowns break discipline and increase execution errors.
- Ruin risk. Estimate the chance your account hits a failure level, like a 30 percent drawdown or margin stop out. Use your win rate, payoff ratio, and risk per trade. If ruin risk looks high, reduce risk or tighten strategy rules.
Do not pick a strategy because max drawdown looks small in one run. Re-test it across different years and market conditions.
Distribution analysis, where most backtests fail
Averages hide pain. You need to see the full distribution.
- Average win and average loss. Check the payoff ratio, Avg Win divided by Avg Loss. Then check the median win and median loss. If the mean looks good but the median looks weak, a few outliers drive results.
- Tail risk. Find the worst 1 percent of trades. Note their R loss and the market conditions around them. Tail losses often come from news spikes, gaps, and volatility expansion.
- Streak behavior. Record max losing streak and the 95th percentile losing streak. Size your risk so you can survive that streak with margin and discipline intact.
If your strategy relies on wide stops, adjust stops using volatility rules you can execute, like an ATR based stop loss approach.
Equity curve diagnostics you can act on
The equity curve shows if your edge is steady or fragile.
- Smoothness. Look for a steady slope, not sharp jumps. Sharp jumps often mean a few rare trades drive most profit.
- Regime dependence. Split the test into trending periods and ranging periods. If the strategy only works in one regime, label it as conditional. Then add a regime filter or accept long flat periods.
- Instability signals. Watch for performance that collapses after small rule changes, small cost changes, or a different broker feed. That usually means overfitting.
- Quick stability check. Re-run with higher spread, higher slippage, and different start dates. If expectancy flips negative, the edge is thin.
Trade breakdowns that reveal the real edge
Aggregate results lie. Break trades into groups and look for consistency.
- By pair. Rank pairs by expectancy and drawdown contribution. Remove pairs that add drawdown without adding expectancy. Also check correlation, since clustered trades can inflate risk.
- By session. Separate Asia, London, and New York. Many strategies depend on liquidity and volatility. Your fills and spreads also change by session.
- By weekday. Check Monday and Friday behavior. Some systems degrade due to gaps, positioning flows, or thin liquidity.
- By volatility regime. Segment trades by ATR percentile or rolling volatility. Many strategies fail when volatility expands. Others fail when volatility compresses.
Keep what works across segments. Cut what only works in one narrow pocket of the data.
Robustness testing to avoid overfitting and false confidence
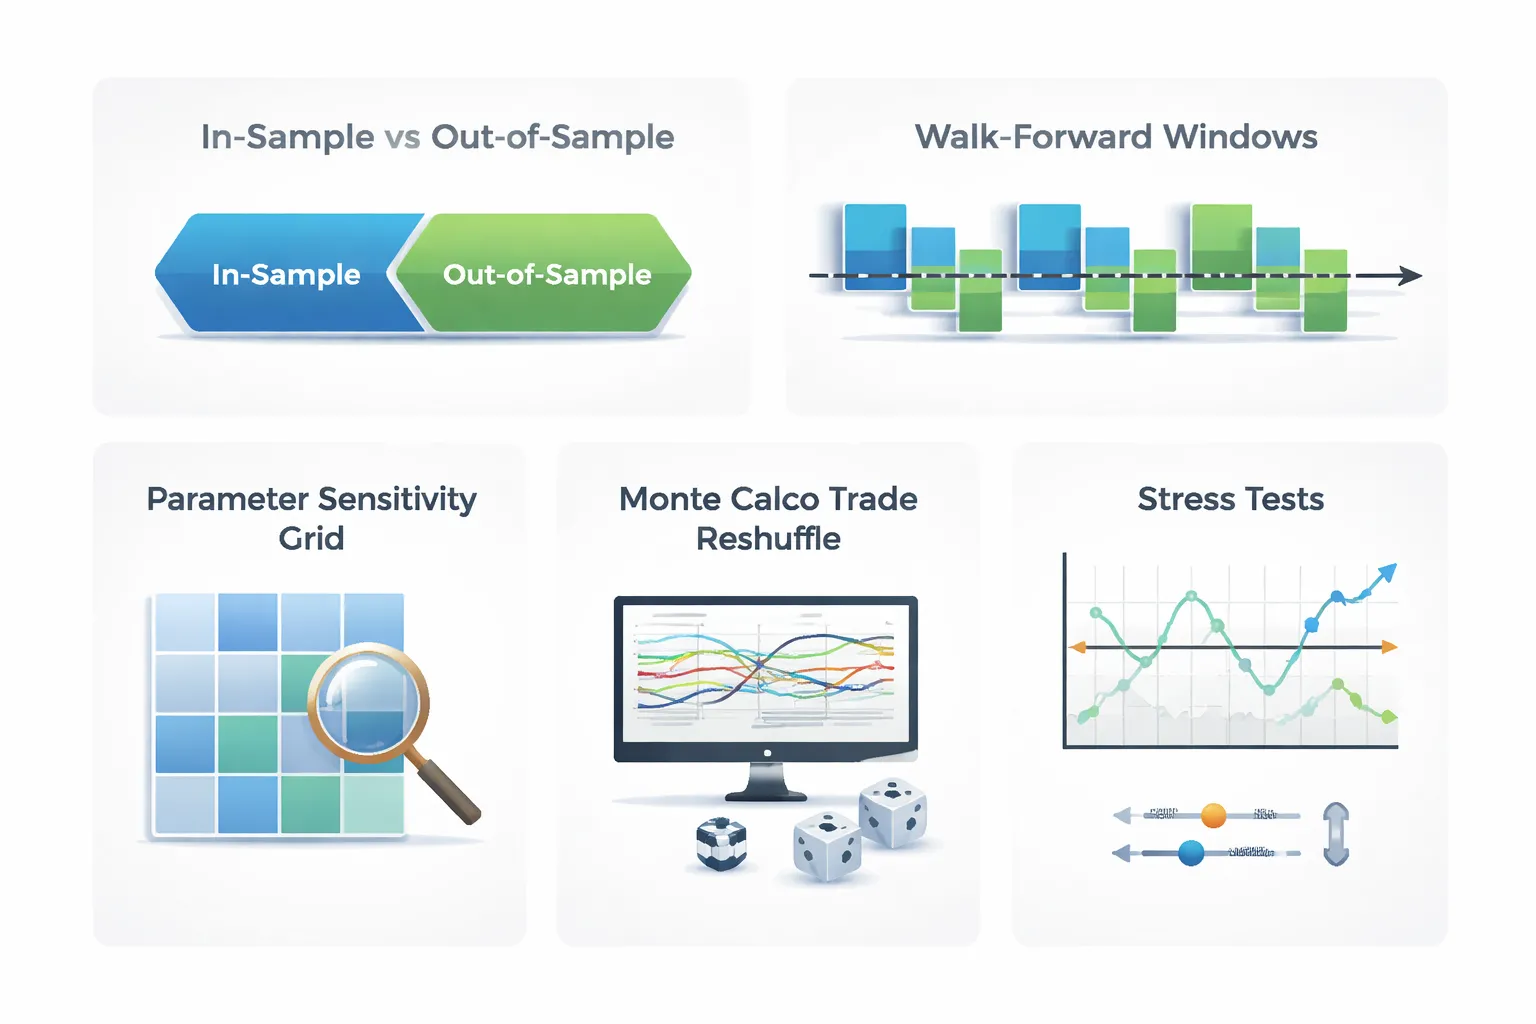
In-sample vs out-of-sample splits
Overfitting happens when you tune rules to the past until they look perfect. Robustness testing stops that.
Split your FX history into a build set and a test set. You change the strategy only on the build set. You judge it on the test set.
- Time split. Example, 2014 to 2020 in-sample, 2021 to 2024 out-of-sample. This matches how you will trade, forward in time.
- Multiple OOS blocks. Example, 2014 to 2018 IS, 2019 OOS, then 2014 to 2019 IS, 2020 OOS, then 2014 to 2020 IS, 2021 OOS. This reveals when performance breaks.
- Regime split. Keep one high-volatility period and one low-volatility period as separate test sets. Do not let both regimes sit only inside in-sample.
- Pair split. Build on one group of pairs, test on a different group. Example, build on EURUSD and GBPUSD, test on AUDUSD and USDCAD. Use this only if the strategy logic should generalize across majors.
Use the same costs model in both sets. Do not relax spreads or slippage in out-of-sample.
Walk-forward analysis
Walk-forward analysis tests if your strategy survives time, not just one lucky split.
- Pick a training window, example 3 years.
- Pick a test window, example 6 months.
- Optimize or tune only inside the training window.
- Lock parameters and run the next 6 months with no changes.
- Roll forward and repeat until you cover the full history.
Combine all test windows into one equity curve. Evaluate that curve, not the in-sample curves. If walk-forward collapses after costs, you have a fragile edge.
Parameter sensitivity testing
A strategy that works only at one exact setting usually fails live.
Test ranges around every key parameter. Look for stable plateaus, not peaks.
- Stops and targets. Sweep stop size and take profit size in small steps. If one stop value wins and the neighbors lose, treat it as noise.
- Filters. Sweep lookbacks for trend, momentum, or volatility filters. Prefer wide ranges with similar results.
- Entry thresholds. If you use RSI, breakout distance, or candle size rules, shift the threshold. Your edge should not vanish with a minor change.
Report sensitivity with a small table. Keep it simple.
| Parameter | Tested range | What you want to see |
|---|---|---|
| Stop loss | 0.8x to 1.5x ATR | Similar profit factor and drawdown across many steps |
| Lookback | 10 to 60 bars | No single sharp “best” setting |
| Threshold | Small shifts around your rule | Win rate and expectancy stay in the same zone |
Monte Carlo simulations
Your backtest gives one path. Live trading will not follow that path. Monte Carlo shows how ugly it can get.
- Trade reshuffle. Randomly reorder trades thousands of times. Keep each trade return the same. This isolates sequence risk.
- Bootstrap sampling. Sample trades with replacement to create new histories. This tests dependence on a small set of big winners.
Track the distribution of max drawdown, time to recovery, and worst losing streak. Use conservative percentiles. If the 95th percentile drawdown breaks your risk limit, lower leverage or drop the strategy.
Stress tests: spreads, slippage, liquidity
Most backtests fail because costs rise when the market gets fast. Stress your assumptions until they hurt.
- Widen spreads. Multiply typical spreads by 1.5x to 3x. Test around news hours and session opens.
- Add slippage. Apply fixed slippage per trade, then test variable slippage based on ATR or candle range.
- Delay fills. Enter one bar later for market orders. For stop entries, shift the fill worse by a set number of pips.
- Reduce liquidity. Remove trades during the last hour of Friday and the first hour of Monday. Thin liquidity punishes tight stops.
- Kill the best fills. If your backtest assumes you always get the high or low, replace those fills with the close or a worse price.
If the strategy only works with perfect execution, it is not ready. If it still holds with harsher costs, you can size it with more confidence. If you need a simple baseline system to compare against, start with a rules-first plan like our beginner roadmap.
Common backtesting mistakes in forex (and how to fix them)
Lookahead bias and repainting indicators
Lookahead bias enters when your code uses future data to make past decisions. It hides in multi-timeframe logic, bar indexing, and indicator values that update after the candle closes.
- How it sneaks in: Using a higher timeframe candle value before that candle has closed. Reading the current bar close while you still trade inside the bar. Calling an indicator that repaints its past signals.
- What it looks like in results: High win rate. Small drawdowns. Clean equity curves. Few losing streaks.
- Fix: Trigger entries only on closed candles. Use confirmed higher timeframe data only after the higher timeframe bar closes. Lock signals at close and store them. If an indicator repaints, remove it or rewrite it to use only confirmed values.
If you use RSI or similar oscillators, ensure you compute and trade the value from the last completed bar, not the current forming bar. For a quick check, see our RSI indicator settings guide.
Survivorship bias and curve fitting
Survivorship bias means you test on a cleaned dataset that ignores failures. Curve fitting means you tune rules to match the past noise.
- How it sneaks in: Testing only recent years that suit your strategy. Ignoring pairs with poor history or broker changes. Optimizing settings until the backtest looks perfect.
- Why “perfect” systems fail live: The market shifts. Your tuned parameters stop matching. Small changes in spread or volatility break the edge.
- Fix: Split your data. Use in-sample to build, out-of-sample to verify. Run a walk-forward test. Stress test parameters, widen them and see if performance holds. Prefer fewer parameters over more.
Ignoring execution realities: spread spikes, requotes, and news volatility
Your backtest can show profits that never existed. Execution costs and slippage can erase the edge.
- What traders ignore: Spread widening at rollover. Spread spikes around news. Slippage on stop orders. Partial fills on thin liquidity. Requotes and rejected orders on market execution rules.
- Fix: Model variable spreads if you can. If you cannot, inflate costs. Add slippage on entries and exits. Penalize stop fills. Run tests with worst-case spread during your trading hours. Filter out high-impact news windows if your live plan avoids them.
| Backtest assumption | Better assumption |
|---|---|
| Fixed 0.8 pip spread | Session-based spreads, add spikes near rollover and news |
| No slippage | Add slippage to market orders and stops |
| Stops fill at exact price | Stops fill worse during fast moves |
| Instant fills | Add latency or bar-close execution only |
Small sample sizes
Small samples produce fragile conclusions. A strategy can look great on 40 trades and fail on the next 400.
- Minimum trade count: Aim for at least 200 trades per pair and timeframe before you trust a baseline read. If your strategy trades less, extend the test period or add pairs with the same rules.
- Multi-regime coverage: Include trends, ranges, high volatility, and low volatility. Include rate cycle changes if your data spans them.
- Fix: Report results by year and by volatility regime. Track longest losing streak. Track max drawdown duration. If the edge only appears in one short window, treat it as unproven.
Over-optimizing filters
Extra rules often raise the backtest and reduce robustness. Filters can remove losing trades and remove future winners at the same time.
- Warning signs: Many thresholds. Many time filters. Many indicator confirmations. Performance collapses when you change one setting.
- Fix: Add one rule at a time and measure its impact on out-of-sample results. Keep rules that improve multiple metrics, not just net profit. Prefer filters that reduce drawdown without cutting trade count too hard.
- Rule of thumb: If a filter improves results only in-sample, delete it. If it works across pairs and years with similar settings, keep it.
From backtest to live trading: a practical validation workflow
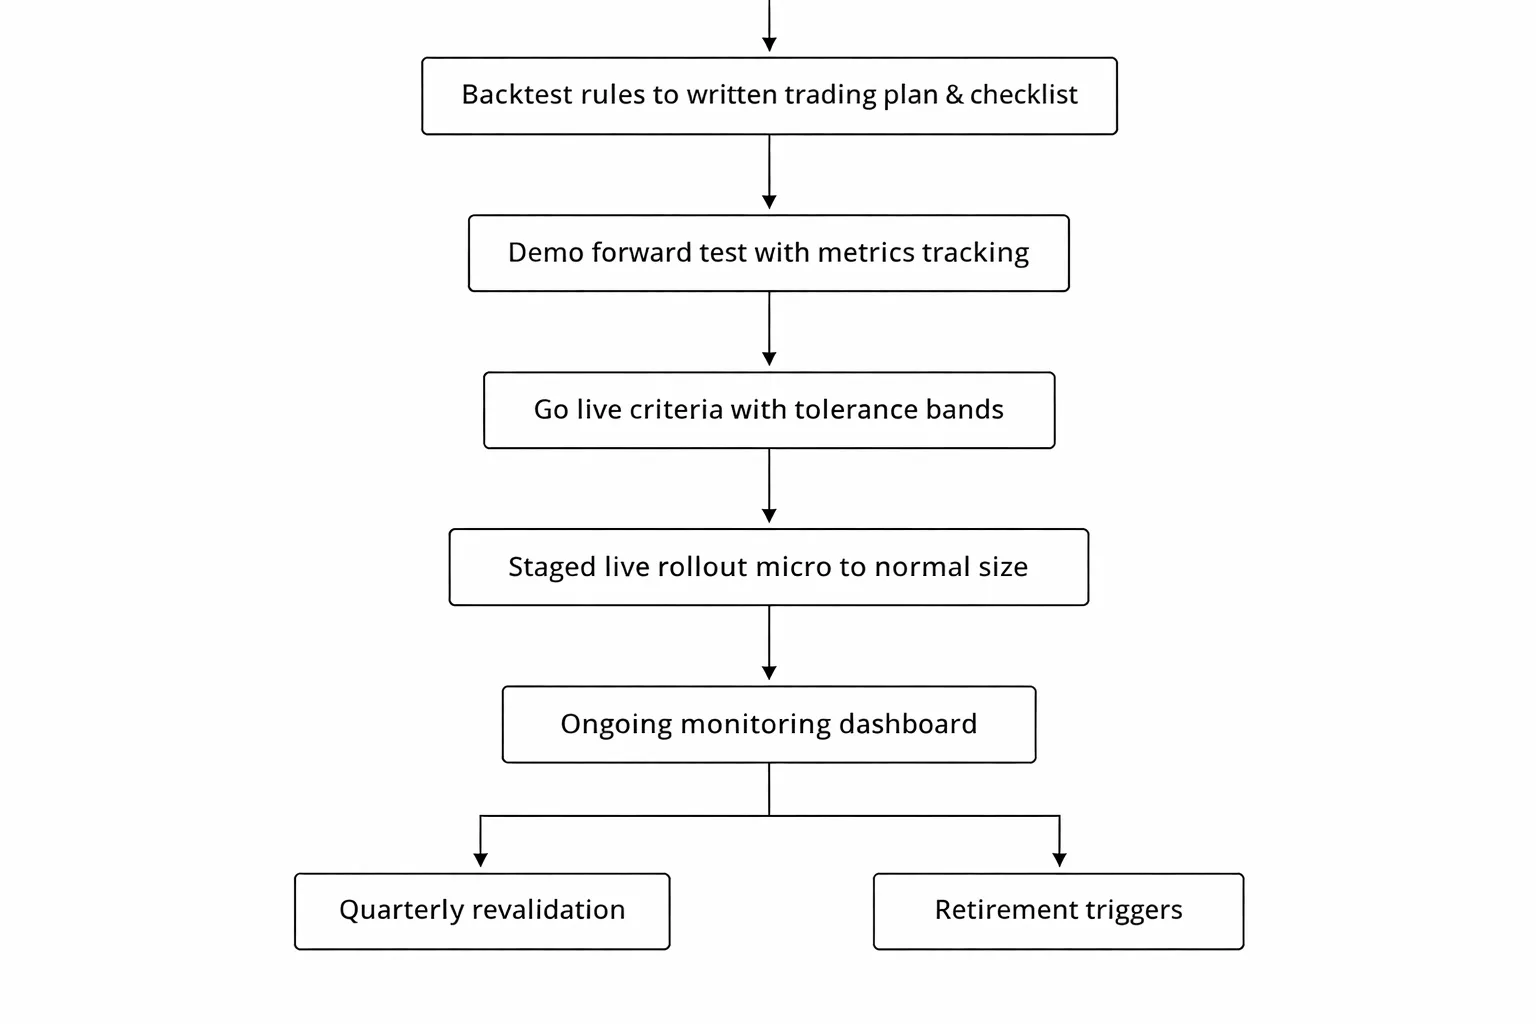
Create a trading plan and checklist from your backtested rules
Turn your backtest into a one page execution plan. If you cannot write the rules as a checklist, you cannot trade them the same way twice.
- Market and session. Pairs you trade, allowed hours, and days to avoid.
- Timeframe and data inputs. Chart timeframe, indicator settings, and exact price used for signals.
- Entry rules. Conditions you need before you place an order. Use exact thresholds, not loose wording.
- Order type. Market or limit, and where you place it in relation to the signal bar.
- Stop loss rule. Placement logic, minimum stop in pips, and when you move it. Keep it mechanical. Use a fixed method you can repeat. If you need a refresher, see how to place a stop loss.
- Take profit and exits. Target method, partial exits if any, and time based exit rules.
- Position sizing. Risk per trade, max exposure per pair, and max total risk across open trades.
- Risk limits. Daily loss limit, weekly loss limit, and max drawdown limit that forces you to stop trading.
- Trade management. What you do after entry, and what you never do. No discretionary overrides.
Build a pre trade checklist you tick every time. Add a post trade checklist for logging and screenshots.
Demo and forward testing, what to measure and how long to run it
Forward testing checks execution reality. Spreads widen, slippage appears, and you miss fills. Your backtest did not feel that.
- Run it in a live like environment. Same broker, same account type, same leverage, and realistic spreads.
- Measure fill quality. Average slippage, percent of limit orders filled, and stop loss slippage during news.
- Measure costs. Spread, commission, and swap. Record average cost per trade in pips and in account currency.
- Measure rule compliance. Percent of trades taken exactly per checklist. Track every violation.
- Measure core performance. Expectancy, profit factor, win rate, average win to average loss, and max drawdown.
- Measure trade frequency. Trades per week and per month versus backtest. Low frequency needs longer validation.
Use time and sample size, not feelings.
- Minimum time. 8 to 12 weeks for active intraday systems, longer if your strategy trades less.
- Minimum trades. Aim for at least 30 to 50 trades before you judge results. If you average 5 trades a month, you need more months.
Do not change rules mid test. If you must change a rule, restart the forward test clock.
Define go live criteria and acceptable deviation from the backtest
You will not match the backtest. You need a tolerance band before you start.
- Costs tolerance. Your average all in cost per trade should stay within 10 to 20 percent of the backtest assumption. If costs jump, your edge can vanish.
- Trade count tolerance. Your forward trade count should stay within plus or minus 20 percent of the backtest expectation for the same market conditions. Big gaps often mean you interpret rules differently.
- Drawdown tolerance. Your forward max drawdown should stay below your backtest worst case out of sample drawdown plus a buffer. Use a buffer of 25 to 50 percent to allow for noise.
- Expectancy tolerance. Your forward expectancy can drop, but it should not flip negative after you reach your minimum trade count.
- Rule compliance. You should hit 95 percent or higher checklist compliance before you scale risk. If you cannot follow rules on demo, you will not follow them live.
Go live in stages.
- Stage 1. Micro size for 20 to 30 trades. Your goal is clean execution and clean logs.
- Stage 2. Small size until you hit a full month with compliance and stable costs.
- Stage 3. Normal size only after you pass your drawdown and expectancy tolerances twice, once in forward test and once in live micro.
Ongoing monitoring, journaling, revalidation, and retirement rules
Validation does not end on day one. Your edge can decay.
- Journal every trade. Entry screenshot, exit screenshot, checklist ticks, spread at entry, slippage, and notes on execution errors.
- Track a small dashboard. Rolling 20 trade expectancy, rolling win rate, rolling average win to loss, and rolling max drawdown.
- Review weekly. Find rule breaks, platform mistakes, and costs drift. Fix process issues first.
- Revalidate quarterly. Re run the backtest on the most recent data, then test out of sample on a fresh window. Keep settings stable.
- Stress test after changes. If your broker changes spreads, you change session times, or volatility regime shifts, rerun with updated costs.
Set clear retirement rules. Stop trading when any trigger hits.
- Edge break trigger. Rolling 50 trade expectancy stays negative and you have no process violations to explain it.
- Drawdown trigger. Live drawdown exceeds your predefined max drawdown limit.
- Cost trigger. Average spread plus slippage rises enough to reduce your backtested expectancy by half or more.
- Behavior trigger. You break risk limits or skip checklist items more than twice in a month.
When you retire a strategy, archive it. Keep the logs. You can revisit it later with new data and a clean test.
Example backtest walkthrough (template readers can copy)
Example backtest walkthrough (template readers can copy)
Use this walkthrough to run one clean test. Keep it boring. Keep it repeatable.
1) Define a sample strategy structure (setup, trigger, risk rules)
Write your rules so another person can execute them with the same chart and get the same trades.
- Market: EURUSD only. One timeframe for signals, one higher timeframe for trend filter. Example, signals on H1, filter on H4.
- Session filter: Trade only during your chosen liquid window. Example, London and early New York.
- Setup (conditions):
- Trend filter: price above a 200-period moving average on the filter timeframe for long trades, below for short trades.
- Structure: last swing breaks in the direction of the trend, then price pulls back.
- Trigger (entry):
- Enter on the close of the first signal candle that confirms the pullback ended. Example, a close back in trend direction after the pullback.
- One entry per signal. No scaling in.
- Initial stop:
- Place stop beyond the pullback swing. Add a fixed buffer in pips to reduce stop-outs from noise.
- Take profit:
- Fixed multiple of risk. Example, 2R target.
- No discretionary exits.
- Risk rules:
- Risk per trade: fixed percent of equity or fixed dollar risk, pick one and do not change it during the test.
- Max open risk: one position at a time.
- Daily loss limit: stop after a set number of losses or a set R drawdown for the day.
- Costs model: Include spread and slippage. Use a conservative default if you lack broker data.
If you need a simple trend filter, use a moving average concept you already understand from moving averages in forex.
2) Run the backtest and log every trade (columns you must record)
Use a spreadsheet. One row per trade. No exceptions.
| Column | What you enter | How you calculate it |
|---|---|---|
| Trade ID | Unique number | 1, 2, 3, ... |
| Date, time | Signal candle close time | From chart |
| Pair | EURUSD | Fixed |
| Timeframe | H1 | Fixed |
| Direction | Long or Short | From rules |
| Setup pass | Yes or No | Checklist result |
| Entry price | Price at entry trigger | Use candle close or next open, pick one and keep it constant |
| Stop price | Initial stop level | From swing plus buffer |
| Target price | Take profit level | Entry plus or minus (R multiple times stop distance) |
| Stop distance (pips) | Pips between entry and stop | ABS(entry minus stop) converted to pips |
| Planned R | 1R per stop distance | Define 1R as your initial risk |
| Costs (pips) | Spread plus slippage | Fixed assumption per trade, or pulled from your data |
| Exit price | Stop, target, or rule-based exit | From chart |
| Gross result (pips) | Move from entry to exit | (Exit minus entry) in pips for long, (Entry minus exit) for short |
| Net result (pips) | After costs | Gross result minus costs |
| Result (R) | Standardized outcome | Net result pips divided by stop distance pips |
| MFE (R) | Best unrealized move | Max favorable excursion in pips, then divide by stop distance |
| MAE (R) | Worst unrealized move | Max adverse excursion in pips, then divide by stop distance |
| Tag | Reason group | Example, Trend, Range, News, Late entry, Wide spread |
| Screenshot link | File or URL | One before entry, one at exit |
| Notes | One sentence | State what happened, not what you felt |
Backtest process you can copy:
- Pick a date range. Do not cherry-pick. Example, last 12 to 24 months.
- Set your chart to the first day. Hide future candles if your tool supports it.
- Move forward candle by candle.
- When your setup appears, mark the trigger candle. Log it.
- Place entry, stop, and target per rules. Log prices.
- Move forward until stop or target hits. Log exit.
- Record MFE and MAE from the path price took, not from memory.
- Do not change rules mid-test. Write issues in Notes. Fix later.
3) Summarize the sample report (what to calculate)
After you log enough trades, build a small report. Keep it standardized.
- Trades: total number of trades.
- Win rate: winners divided by total trades.
- Average win (R): mean R of winning trades.
- Average loss (R): mean R of losing trades, negative number.
- Expectancy (R per trade): (win rate times average win) plus (loss rate times average loss).
- Profit factor: sum of positive R divided by absolute sum of negative R.
- Max drawdown (R): worst peak-to-trough drop in cumulative R.
- Streaks: max consecutive losses, max consecutive wins.
- Costs impact: average costs in pips and in R. Compare expectancy with and without costs.
- By tag breakdown: expectancy by Tag to find where the edge comes from.
4) Interpret the results (rejection checklist)
Reject fast when the numbers fail basic stress tests.
- Too few trades: your sample is too small to trust. Increase the date range or broaden eligible sessions.
- Negative expectancy after costs: reject. Your edge does not survive realistic spreads and slippage.
- Expectancy depends on a few outliers: if a small number of trades creates most of the gains, reject or redesign.
- Drawdown breaks your limits: reject if max drawdown exceeds your planned tolerance.
- Unstable by period: if one quarter works and the rest fails, treat it as regime risk. Reject or narrow conditions.
- Costs sensitivity: if small cost increases cut expectancy by half, reject for live trading.
- MAE is large: if MAE often exceeds 1R before the trade wins, your stop or trigger likely needs work.
5) Turn insights into iterations (one change at a time)
Do not optimize by guessing. Change one rule. Retest. Compare.
- Step 1: Pick one problem from your report. Example, most losses happen in ranges.
- Step 2: Propose one rule change that targets that problem. Example, add a range filter, or skip trades when ATR falls below a threshold you define.
- Step 3: Freeze everything else. Same market, same timeframe, same date range, same cost model.
- Step 4: Re-run the test. Log the same columns.
- Step 5: Compare only a few metrics first: expectancy, max drawdown, trade count, costs impact.
- Step 6: Keep the change only if it improves expectancy without increasing drawdown beyond your limit and without cutting trade count so much that the sample becomes weak.
- Step 7: Archive versions. Use clear names. Example, v1.0 baseline, v1.1 added filter, v1.2 changed stop buffer.
FAQ
What is backtesting in forex?
Backtesting means you run your strategy rules on past price data. You log every trade, then review results. You use it to measure expectancy, drawdown, and costs impact before you risk money.
How much data do you need?
Use enough trades to make the sample stable. Aim for at least 200 trades per pair and timeframe. If your strategy trades less, test more years or add more pairs with the same rules.
What timeframe should you backtest on?
Test on the same timeframe you plan to trade. If you execute on M15 but use H1 for filters, test both in the same run. Do not mix timeframes unless your rules require it.
Should you backtest one pair or many pairs?
Start with one pair to validate logic and logging. Then test more pairs to check robustness. Keep position sizing rules identical. Track each pair separately, then review the combined equity curve.
Do you need tick data for forex backtesting?
Use tick data if you scalp, use tight stops, or rely on intrabar triggers. For higher timeframes, good quality minute data can work. Match the data precision to your entry, stop, and spread sensitivity.
How do you model spread and slippage?
Apply a spread per trade based on session averages, not a fixed best case. Add slippage rules for stops, news, and low liquidity hours. Test costs first, then compare to a zero cost run.
What metrics matter most?
Start with expectancy, max drawdown, trade count, and costs impact. Then review win rate, average win and loss, and profit factor. Avoid optimizing for one metric at the expense of drawdown or sample size.
How do you avoid curve fitting?
Limit the number of parameters you tune. Use out of sample testing on a later period. Add walk forward checks if you can. Keep changes only when expectancy improves without breaking your drawdown limit.
What is the best way to split in-sample and out-of-sample data?
Use a time split, not a random split. Common ranges are 70/30 or 80/20. Keep the most recent data for out of sample. Then run a final holdout on the newest months.
Should you use Monte Carlo analysis?
Yes, if you want a drawdown reality check. Randomize trade order and vary costs within a range. Compare worst case drawdown to your risk limits. If it fails, reduce risk or tighten rules.
Why does my strategy look great in a tester but fails live?
Your test may ignore spreads, slippage, and execution delay. Your data may have gaps or bad timestamps. Your rules may use future candles by mistake. Rebuild the test with strict candle close logic and realistic costs.
How do you backtest strategies affected by correlated pairs?
Backtest with portfolio rules, not pair by pair. Cap total exposure across correlated pairs. Track combined drawdown. Use a correlation filter if needed. Learn the basics in forex correlation explained.
What tool should you use, spreadsheet or software?
Use a spreadsheet for manual bar replay and rule validation. Use software for scale, speed, and repeatability. If you change rules often, software saves time. If rules require discretion, manual logs stay useful.
Conclusion
Backtesting turns your strategy into numbers. You learn what works, when it fails, and how much it can lose. You also learn if your edge survives spreads, slippage, and different market regimes.
Keep your process simple. Lock your rules. Use clean data. Track the basics on every run, win rate, average win, average loss, profit factor, max drawdown, and trade count. Compare results across pairs and sessions. Drop any setup that depends on one lucky period.
Your final step is forward testing. Trade the same rules on a demo or a small account. Log every trade. Use fixed risk per trade and predefined exits. If you need to tighten this part, follow this guide on how to set stop loss and take profit.
Do not optimize until the base test looks stable. One change at a time. Re-test. If performance holds, you can scale. If it breaks, you saved real money.
-
Stop Loss vs Take Profit: Differences, Examples & Best Practices
1 month ago -
Forex Order Types Explained: Market vs Limit vs Stop Orders
1 month ago -
How to Start Forex Trading Step by Step (Beginner Roadmap)
1 month ago -
How to Set Stop Loss and Take Profit (Step-by-Step)
1 month ago -
Risk Management in Forex for Beginners (Rules That Keep You in the Game)
1 month ago
-
- Choosing data granularity, tick vs 1-minute vs higher timeframes
- Key data fields you need, bid/ask, spreads, swaps, and trading hours
- Common data issues, gaps, bad ticks, DST shifts, and symbol changes
- How to sanity-check data quality before testing
- Aligning broker/server time and session filters for apples-to-apples results
-
- Step 1: Write the hypothesis and define success criteria
- Step 2: Build a rules checklist and a trade log template
- Step 3: Import or prepare data and set trading costs
- Step 4: Run the first baseline test (no optimization yet)
- Step 5: Verify trade-by-trade correctness (spot-check signals and fills)
- Step 6: Iterate responsibly: refine rules, retest, and version-control changes
-
- Spread, commission, and swaps: include them the right way
- Slippage models for FX: fixed, volatility-based, and worst-case
- Market hours, rollover, and weekend gaps: handle edge cases
- Order types and fill logic: market vs limit/stop and partial fills
- Position sizing realism: minimum lot sizes, leverage, margin calls, and max exposure
-
- Example backtest walkthrough (template readers can copy)
- 1) Define a sample strategy structure (setup, trigger, risk rules)
- 2) Run the backtest and log every trade (columns you must record)
- 3) Summarize the sample report (what to calculate)
- 4) Interpret the results (rejection checklist)
- 5) Turn insights into iterations (one change at a time)
-
- What is backtesting in forex?
- How much data do you need?
- What timeframe should you backtest on?
- Should you backtest one pair or many pairs?
- Do you need tick data for forex backtesting?
- How do you model spread and slippage?
- What metrics matter most?
- How do you avoid curve fitting?
- What is the best way to split in-sample and out-of-sample data?
- Should you use Monte Carlo analysis?
- Why does my strategy look great in a tester but fails live?
- How do you backtest strategies affected by correlated pairs?
- What tool should you use, spreadsheet or software?
-
-
Forex Lot Size Calculator: How to Use It to Size Trades Correctly
1 month ago -
How to Calculate Position Size in Forex (Position Sizing Formula + Examples)
1 month ago -
Forex Leverage Explained: How It Works, Pros, Cons & Examples
1 month ago -
Margin vs Leverage in Forex: What’s the Difference?
1 month ago -
What Is Forex Trading? A Beginner’s Guide to How It Works
1 month ago
-
Forex Trading Platforms Comparison: MetaTrader vs cTrader vs TradingView
1 month ago -
Forex Market Hours & Trading Sessions Explained (Best Times to Trade)
1 month ago -
Forex Leverage Explained: How It Works, Pros, Cons & Examples
1 month ago -
Is Forex Trading Legal in the United States? Rules, Regulators & What to Know
1 month ago -
What Is a Lot Size in Forex? Lot Types + Quick Examples
1 month ago