Moving Average Strategy for Forex (Simple Setups + Examples)

Moving averages help you trade with the trend and avoid noise. They do this by smoothing price into a single line you can track.
This guide shows you how to use moving averages in forex with simple, repeatable setups. You will learn the difference between SMA and EMA, how to pick practical periods, and how to read slope and structure. You will also get clear entry rules, stop placement, and exit options for trend trades and pullbacks. Each setup includes a concrete example so you can copy the process on your charts.
You will also see where moving averages fail, choppy ranges, news spikes, and late signals, and how to filter those trades with basic support and resistance.
Key Takeaways
- In het kort:
- Use moving averages as a trend filter, not a standalone system.
- Pick periods that match your holding time. Common baselines are 20, 50, and 200.
- Trade in the direction of the slope and structure. Flat averages mean no edge.
- Trend setup: enter on a pullback into the MA zone, after a clear rejection candle.
- Breakout setup: enter after price closes beyond the MA and retests it, not on the first cross.
- Place stops beyond the swing that invalidates the setup, not “under the MA” by default.
- Use simple exits. Take partials at the next swing, trail behind structure, or exit on a clean opposite close.
- Expect late signals. Crossovers lag by design, so you need structure confirmation.
- Avoid chop. When price whips through the MA, stand down or reduce risk.
- Filter trades with key levels. Mark support and resistance first, then use the MA for timing. See support and resistance.
- News spikes can blow through any MA. Do not widen stops to “make it work”.
- Track basic stats in your journal. Win rate, average R, and max drawdown tell you if your MA rules hold up.
What a moving average is (and what it isn’t) in forex trading
The core idea: smoothing price to reveal trend structure
A moving average is a line built from past prices.
It smooths noise so you can see the market’s direction and rhythm.
In forex, you use it to:
- Define bias. Price above the MA, you look for longs. Price below, you look for shorts.
- Measure trend strength. Clean separation and consistent slope signals trend. Flat and tangled signals chop.
- Time entries. Pullbacks into the MA can act as a trigger zone when structure supports it.
- Manage trades. The MA can guide trailing stops or partial exits when momentum fades.
What it is not.
- It is not support or resistance. It can align with levels, but it does not create them.
- It is not a predictor. It reacts to what already happened.
- It is not a standalone system. You still need structure, risk rules, and execution.
Why MAs lag, and why that can still help
An MA uses past data, so it always lags price.
The longer the lookback, the more it lags.
This lag helps you avoid early entries in messy conditions.
It forces you to wait for confirmation.
- Trend filter. You trade in the direction price has already proven.
- Noise filter. You skip many low quality flips that happen inside ranges.
- Rule clarity. You can define objective rules that you can test and journal.
Do not use an MA to “catch the turn”. Use it to stay aligned with what the market is already doing.
Common MA types, explained
- SMA. Simple average of the last N closes. Smooth and slow. Good for baseline trend filters.
- EMA. Weights recent prices more. Reacts faster than SMA. Better when you want quicker signals.
- WMA. Also weights recent prices more, with linear weighting. Similar goal to EMA, different math.
- SMMA. Smoothed average that reduces short-term swings. Slower to change, often used for longer trend context.
Most traders do fine with SMA or EMA. The type matters less than consistent rules and tested settings.
How MA length changes behavior
Length controls sensitivity.
| Lookback | What you get | Common use | Main risk |
|---|---|---|---|
| Short (5 to 20) | Fast response, more signals | Entry timing on pullbacks, momentum shifts | Whipsaws in ranges |
| Medium (20 to 50) | Balanced smoothing | Core trend filter and pullback zone | Late entries after sharp moves |
| Long (100 to 200) | Slow, stable direction | Higher timeframe bias, regime filter | Gives back profit before exit signals |
Match length to your holding time. If you hold for hours, a 200 on a 5 minute chart will feel dead. If you swing trade, a 10 on a daily chart will feel noisy.
When MAs work well, and when they fail
MAs handle trends best.
- Best conditions. Strong directional moves, clean pullbacks, higher highs and higher lows or the reverse.
- Decent conditions. Mild trends with orderly retracements, especially when price respects prior structure.
- Poor conditions. Ranges, low volatility drift, and sessions with repeated stop runs.
- High risk moments. News releases and sudden liquidity gaps. Price can cut through any MA.
In chop, MAs cluster and flatten. Price crosses back and forth. Your edge drops.
When you test MA rules, separate results by market condition. This is where most “MA strategies” break.
If you need a controlled way to get reps and track outcomes, use demo replays and routines so you can log the same MA rules across trend and range days.
Choosing the right moving average for your timeframe and style
Match the moving average to your timeframe and holding time
Your MA period must fit your chart timeframe and your average hold. If it does not, you get late entries and noisy exits.
- Scalping (M1 to M5), holds: minutes. Use 9 to 21 EMA for direction and pullbacks. Use 50 EMA only as a bias filter, not for entries.
- Day trading (M15 to H1), holds: 30 minutes to a few hours. Use 20 to 50 EMA for trend and pullbacks. Add 200 SMA or EMA as a session bias level if you need one.
- Swing trading (H4 to D1), holds: days to weeks. Use 20 to 55 EMA for structure. Use 100 to 200 SMA as a long trend filter.
Adjust for pair volatility and session behavior
Different pairs cut through MAs differently. Volatile pairs need looser settings, calmer pairs can use tighter settings.
- Fast pairs (GBP crosses, some XAU moves). Expect deeper pullbacks and more spikes. Favor higher periods like 21, 34, 50, or 55 for your “working” MA. Reduce whipsaws by avoiding very short MAs like 9 in chop.
- Mean-reverting pairs (many JPY pairs in ranges). Expect sharp snapbacks. Use a filter MA like 100 or 200 to avoid fighting the dominant slope. If you trade pullbacks, wait for a clear close back above or below your working MA.
- Session effect. London open and NY overlap produce more false breaks. If you see frequent MA pierces during these windows, increase the period one step, or require a close and retest instead of a touch.
EMA vs SMA, pick based on signal speed
EMA reacts faster. SMA stays steadier. Pick one based on what you need.
- Use EMA when you trade pullbacks in strong trends, need earlier entries, or manage trades tightly.
- Use SMA when you want a smoother bias line, trade higher timeframes, or use the MA as a “line in the sand” level.
- Do not mix types without a reason. If you use EMA for entries and SMA for bias, document the rule and test it as one package.
One MA, two MAs, or a ribbon, choose the simplest tool that fits the job
- One MA. Best for clean trend days. Use it for pullback entries and trailing exits. Rule stays simple, slope up for long bias, slope down for short bias.
- Two MAs. Best when you want confirmation. Use a fast and slow pair like 9 and 21 for scalps, 20 and 50 for day trades, 20 and 100 for swings. Require alignment, then trade pullbacks to the fast MA while price stays on the correct side of the slow MA.
- Ribbon (multiple MAs). Best as a trend quality filter. When the ribbon fans out and holds order, trends persist. When it compresses, expect chop. Do not use a ribbon to justify late entries. Use it to skip bad conditions.
Decision matrix, pick MA settings without guesswork
| Input | Your choice | MA setup | Rule you test |
|---|---|---|---|
| Timeframe M1 to M5 | Scalp | 9 to 21 EMA | Trade only in MA direction, enter on pullback close back with the slope intact |
| Timeframe M15 to H1 | Day trade | 20 to 50 EMA | Trend filter by slope, enter on retest of MA, exit when price closes against MA twice |
| Timeframe H4 to D1 | Swing | 20 to 55 EMA plus 200 SMA | Only take setups aligned with 200 bias, manage using the working MA |
| Pair feels spiky, frequent MA pierces | High volatility | Step up one tier, 21 to 34, or 50 to 55 | Require a close and retest, ignore touches |
| Pair feels smooth, clean swings | Lower volatility | Step down one tier, 50 to 34, or 21 to 20 | Allow touch entries, but keep a strict stop rule |
| You get late entries | Need faster signal | Switch SMA to EMA, or reduce period one tier | Track win rate change and average R, not just accuracy |
| You get chopped up | Need steadier filter | Increase period one tier, or add a slow MA filter | Trade fewer signals, measure drawdown and losing streak length |
Lock one setup for 50 to 100 trades. Log it by pair and session. If you want a momentum cross-check, pair your MA rules with MACD settings and signals and track whether it reduces your false entries.
Simple moving average strategy for forex: 4 beginner-friendly setups
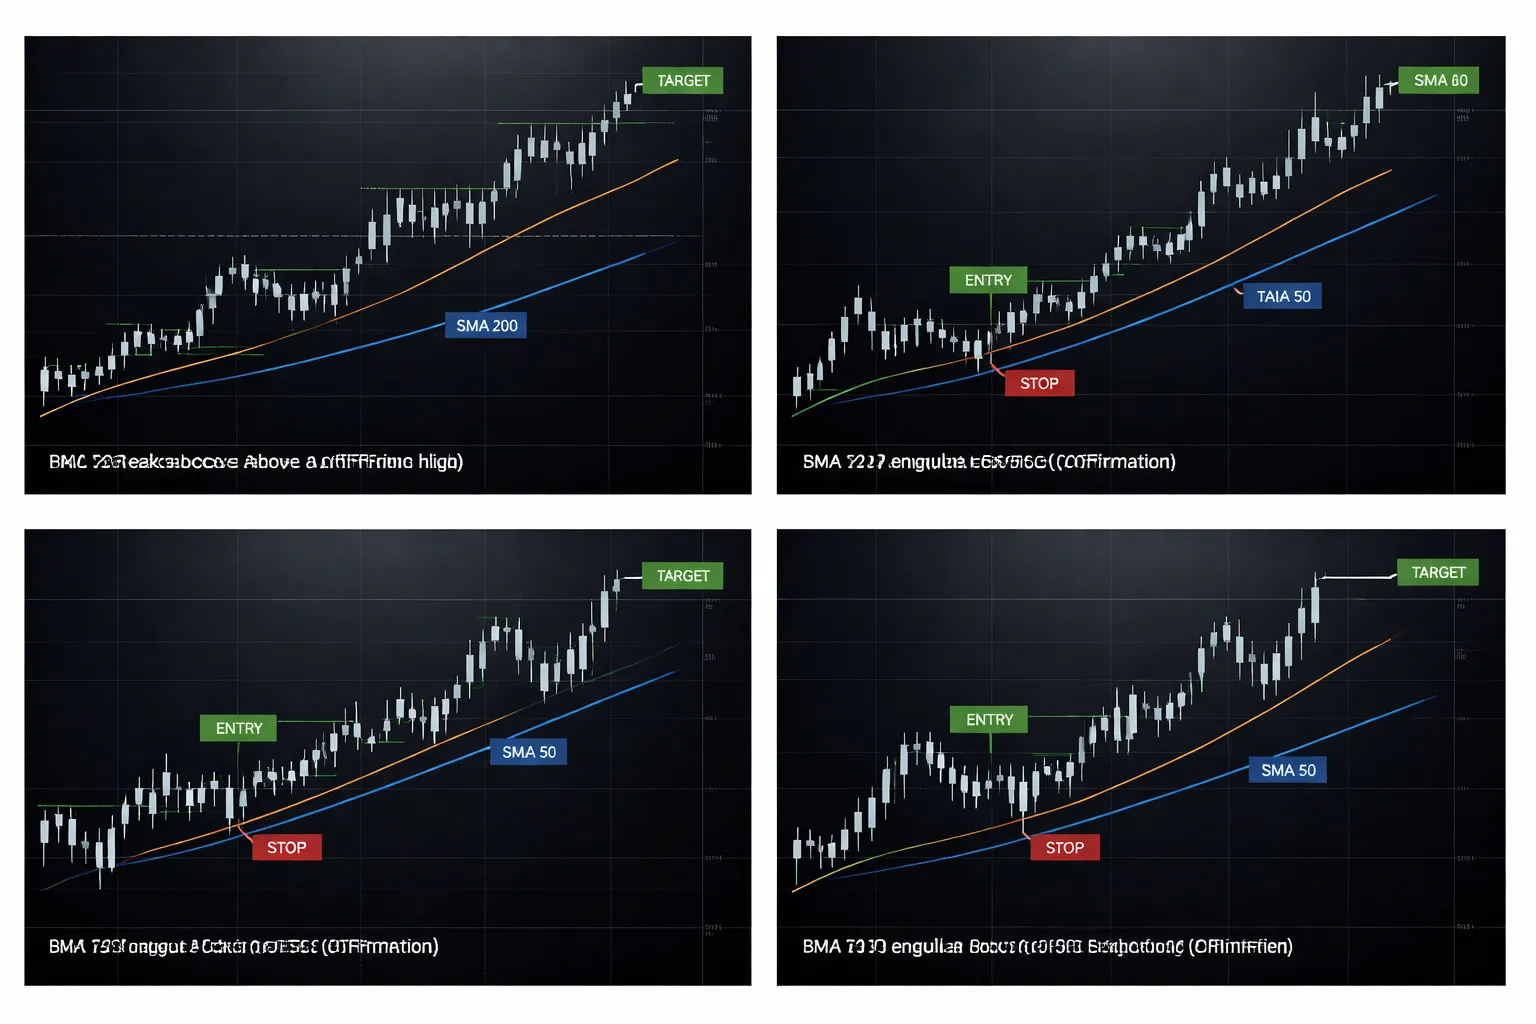
Setup 1: Single MA trend filter plus breakout entry rules
Use one moving average to define bias. Use price action to trigger entries.
- Market: liquid majors in London and New York.
- Indicator: SMA 200 on H1 or H4.
- Long bias: price above SMA 200 and the SMA points up.
- Short bias: price below SMA 200 and the SMA points down.
- Entry (long): mark the last swing high. Buy on a close above it.
- Entry (short): mark the last swing low. Sell on a close below it.
- Stop: beyond the opposite side of the breakout structure, or beyond the last swing.
- Exit: 1R to 2R fixed target, or trail behind recent swings. Keep it consistent for your test.
Rules that reduce chop. Skip signals when price sits on the SMA and prints alternating closes across it. That is range behavior.
Setup 2: Double MA crossover with trend confirmation criteria
Crossover gives you a trigger. Trend confirmation keeps you out of flat periods.
- Indicators: SMA 20 and SMA 50 on H1 or H4.
- Long trigger: SMA 20 crosses above SMA 50.
- Short trigger: SMA 20 crosses below SMA 50.
- Confirm trend: take the trade only if the cross happens with clear separation, and both MAs slope in the same direction.
- Structure filter: for longs, price must hold above the SMA 50 after the cross. For shorts, price must hold below the SMA 50.
- Entry timing: enter on the close of the cross candle, or on the first pullback to the SMA 20 that does not break the SMA 50.
- Stop: beyond the most recent swing, or a fixed multiple of ATR if you use it.
- Exit: partial at 1R, remainder trails behind the SMA 50, or exit on the opposite cross.
Most losses come from crosses inside ranges. Your confirmation rules should cut trade count, not increase it.
Setup 3: Pullback-to-MA continuation (mean reversion inside a trend)
You trade with the trend. You enter on the pullback.
- Indicators: SMA 50 as trend line, optional SMA 200 as higher filter.
- Trend rule: only trade in the direction of the SMA 50 slope. Stronger filter, price also sits on the correct side of SMA 200.
- Long setup: price stays above SMA 50, then pulls back into the SMA 50 zone, then closes back above it.
- Short setup: price stays below SMA 50, then pulls back into the SMA 50 zone, then closes back below it.
- Entry: enter on the reclaim close, or on a stop order above the signal candle high for longs, below the low for shorts.
- Stop: below the pullback low for longs, above the pullback high for shorts.
- Exit: target the prior swing high or low, or use 1.5R to 3R based on your pair’s behavior.
This setup fails when the pullback turns into reversal. Your stop must sit past the pullback extreme. Do not tighten it to feel safe.
Setup 4: MA slope plus candle confirmation (engulfing or pin bar) for timing
You use the MA for direction. You use one candle for timing.
- Indicator: SMA 50 on H1, H4, or D1.
- Slope rule: take longs only when SMA 50 slopes up. Take shorts only when it slopes down.
- Location rule: prefer signals that form near the SMA 50 after a pullback, not after extended runs.
- Long trigger: bullish engulfing close, or a bullish pin bar with a long lower wick rejecting below the SMA zone.
- Short trigger: bearish engulfing close, or a bearish pin bar with a long upper wick rejecting above the SMA zone.
- Entry: buy above the trigger candle high, sell below the trigger candle low.
- Stop: beyond the trigger candle wick.
- Exit: first trouble area, prior swing, or a fixed R target.
This adds patience. It also reduces trades. That helps your discipline when you track rules over weeks. If you struggle with consistency, tighten your process, not your chart. See trading discipline and consistency.
Best default settings to start, and when to adjust them
Start with simple defaults. Change one variable at a time.
- If you get chopped up in ranges: move your filter from SMA 50 to SMA 100, or require alignment with SMA 200.
- If signals come too late: keep the same filter, but use EMA 20 or EMA 21 only for entries, not for bias.
- If stops feel too wide: change timeframe before you change rules. H1 often gives tighter structure than H4, but more noise.
- If you overtrade: add a session rule, take trades only in London and New York, skip Asia on most pairs.
- If you miss moves: allow one entry method only, breakout or pullback, not both. Your log will show which fits your pair.
Keep your test clean. One setup. One timeframe. One pair group. Record win rate, average R, max drawdown, and longest losing streak. Then adjust periods one tier, like 50 to 100, or 20 to 21, and retest.
Step-by-step trade rules (entries, exits, and invalidation)
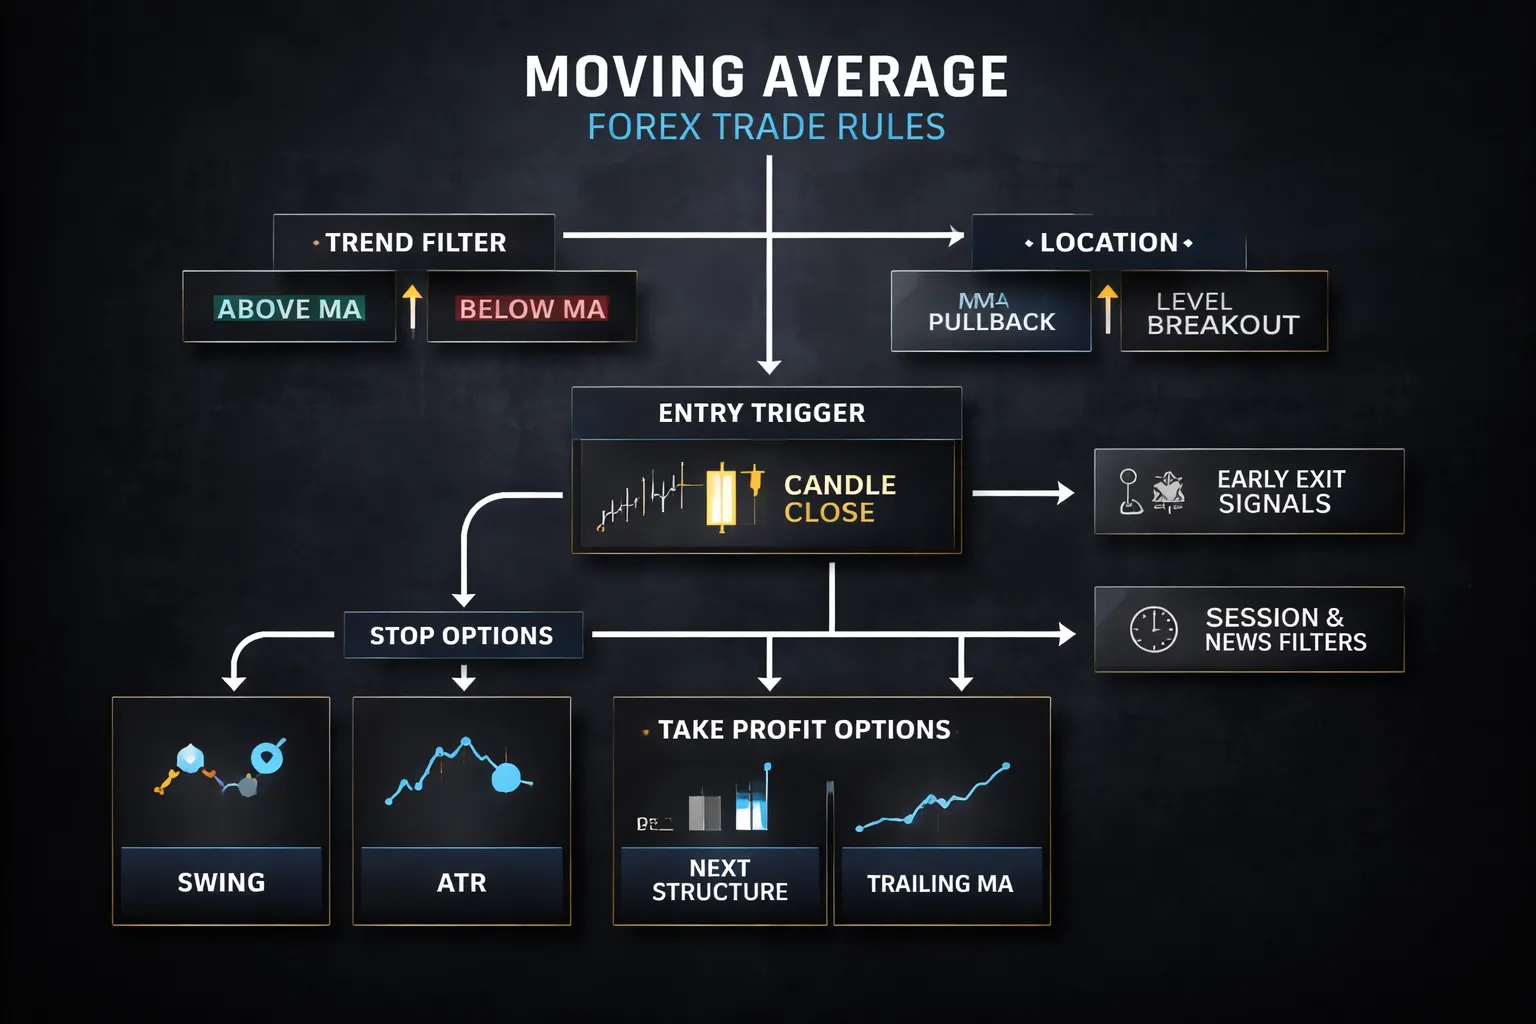
Entry checklist (trend, location, trigger, timing window)
- Trend filter. Define bias with one moving average.
- Longs: price closes above the MA, MA slope points up, last swing high breaks or holds.
- Shorts: price closes below the MA, MA slope points down, last swing low breaks or holds.
- Skip if the MA is flat and price chops through it.
- Location. Take trades only when price is on the correct side of the MA and returns to a clean level.
- Pullback location: price pulls back toward the MA, then rejects from it, or from a nearby structure level on the trend side.
- Breakout location: price consolidates near a level, then closes through it while staying on the trend side of the MA.
- Skip if the setup forms in the middle of a wide range.
- Trigger. Use one trigger and keep it constant in your test.
- Breakout trigger: enter on the close that breaks the level, or place a stop order beyond the breakout candle high or low.
- Pullback trigger: enter on a rejection close back in trend direction, or use a limit order at the MA touch if your pair respects it.
- If you use pending orders, follow basic market vs limit vs stop orders rules and log which one you used.
- Timing window. Trade London and New York. Skip most Asia sessions.
- Avoid entries in the last hour before major session close.
- Avoid entries right after a large spike candle. Let the next structure form.
Stop-loss methods (swing-based, ATR-based, structure-based)
- Swing-based stop. Place your stop beyond the last swing.
- Long: below the last higher low.
- Short: above the last lower high.
- Add a small buffer for spread and noise.
- ATR-based stop. Use a multiple of ATR to standardize risk.
- Common test ranges: 1.0 to 1.5 ATR from entry, based on your timeframe.
- Do not shrink ATR stops to force a better R. Let the setup dictate the size.
- Structure-based stop. Place your stop beyond the level that must hold.
- Breakout trade: stop goes back inside the broken range, beyond the breakout base.
- Pullback trade: stop goes beyond the rejection zone and the last micro swing.
- If price can hit your stop and still keep structure intact, your stop is in the wrong place.
Take-profit options (fixed R-multiple, next structure level, trailing MA)
- Fixed R-multiple. Pick one target and test it.
- Common baselines: 1R for conservative, 2R for trend, 3R for strong trends.
- Move stop to breakeven only if your data shows it helps. Many systems lose edge with early breakeven.
- Next structure level. Target the next clear swing point.
- Long: prior swing high, supply zone, or measured move completion.
- Short: prior swing low, demand zone, or measured move completion.
- If the next level sits too close and gives you less than 1R, skip the trade or use a tighter trigger with the same stop logic.
- Trailing MA exit. Hold while price respects the MA.
- Stay in the trade while candles keep closing on the trend side of the MA.
- Exit on the first clean close across the MA, or after two weak closes near it. Keep the rule consistent.
When to exit early (MA flattening, opposite close, failed retest)
- MA flattening. If the MA loses slope and price starts crossing it, reduce risk.
- Take partials at the nearest level, or tighten the stop to the most recent swing.
- If your system is trend-only, exit fully on the first sign of chop and log it.
- Opposite close. Exit when you get a strong close against your trade.
- Long: a decisive bearish close below the MA or below the last swing low.
- Short: a decisive bullish close above the MA or above the last swing high.
- Define “decisive” in your rules. Example: close beyond level by at least X pips, or a candle body that is at least 60% of total range.
- Failed retest. Your level must hold after the break.
- Breakout long: price breaks up, retests, then closes back inside the range. Exit.
- Breakout short: price breaks down, retests, then closes back inside the range. Exit.
- If you use pullbacks, exit when price tags the MA, fails to bounce, then closes through it.
Invalidation rules (what proves you wrong)
- Trend invalidation. Two closes on the wrong side of the MA, plus a break of the last swing in the wrong direction. Stand down.
- Level invalidation. The structure level that triggered your entry breaks and holds. Do not re-enter unless your plan includes one retest attempt.
- Time invalidation. If price does not move at least 0.5R in your favor within a fixed number of candles, exit or reduce size. Test a number like 6 to 10 candles.
How to handle spread, session timing, and news risk
- Spread. Treat spread as part of your risk.
- Use a stop buffer that covers typical spread plus a small cushion.
- Skip pairs with unstable spread during your trading window. Your logs will show which pairs behave.
- Do not place stops at obvious round numbers without buffer. You will get clipped.
- Session timing. Match your setup to your session.
- Breakouts fit London open and NY open better than late-session drift.
- Pullbacks often form after the first impulse move. Wait for structure, then execute.
- Stop trading when liquidity drops. Your fills get worse and your stops get tagged more.
- News risk. Protect your sample and your account.
- Do not open a new trade within 15 to 30 minutes of high-impact news on either currency.
- If you already hold a trade, either reduce risk before the release or accept full stop risk. Do not improvise mid-spike.
- After news, wait for a new range and a fresh MA slope. Trade the second move, not the first spike.
Examples: how MA strategies look on real forex price action
Example A: EUR/USD pullback-to-EMA continuation trade (walkthrough)
Market context: trend up. You trade with the slope, not against it.
- Chart: EUR/USD, 1H.
- MAs: 20 EMA (entry filter), 50 EMA (trend filter).
- Trend filter: Price holds above the 50 EMA. The 50 EMA points up.
- Setup: Price pulls back into the 20 EMA after an impulsive push. The pullback prints smaller candles and lower momentum.
- Trigger: You buy after a bullish close back above the 20 EMA, with the candle closing in the top half of its range.
- Stop: You place the stop below the pullback swing low, not below the 20 EMA.
- Target: You target the prior swing high first. If that breaks clean, you hold a runner to the next structure level.
- Invalidation: A full candle close below the 50 EMA, or a new lower low on the pullback, kills the trend thesis.
What you should see on the chart: a rising 50 EMA, repeated touches of the 20 EMA, and continuation swings. If the 20 EMA flattens, you skip.
Example B: GBP/JPY crossover trade with whipsaw avoidance filter
Crossovers fail most in chop. You need a filter that blocks weak signals.
- Chart: GBP/JPY, 15M or 30M.
- MAs: 10 EMA and 30 EMA (signal pair), 200 SMA (regime filter).
- Regime filter: Only take long crossovers above the 200 SMA. Only take short crossovers below the 200 SMA.
- Slope filter: The 30 EMA must point in the trade direction. If it looks flat, you skip even if the 10 crosses.
- Entry: You enter on the close of the crossover candle, or on the first pullback that holds the 30 EMA.
- Stop: You place the stop beyond the most recent swing point on the opposite side of the 30 EMA.
- Exit rule: You exit on a close back through the 30 EMA, or on a reverse crossover if it happens quickly.
What this filter does: it removes many small losses when price chops around the MAs. You trade fewer signals, but your average signal quality rises.
Example C: Range market failure case, how the strategy loses and why
MAs lag. In a tight range, lag becomes a problem you can measure.
- Chart: EUR/GBP, 30M.
- MAs: 20 EMA and 50 EMA.
- What happens: Price oscillates around both MAs. The 20 EMA crosses up, then down, then up. Each “signal” forms near the middle of the range.
- Why you lose: Your entries sit where the range has no edge. Your stop sits outside a small swing, but price keeps tagging both sides.
- How it looks in real time: The 50 EMA goes flat. Candles overlap. Wicks grow on both sides. Breakouts fail within a few bars.
- Damage control rule: If the 50 EMA stays flat and price closes on both sides of it in the last 10 to 20 bars, you stop taking MA signals.
This loss is not random. You traded a trend tool in a mean-reversion regime. Your fix is a regime filter, not a tighter stop.
Example D: Trend day management, scaling out vs trailing decisions
Your entry matters less than your management on a clean trend day.
- Chart: USD/JPY, 1H.
- MAs: 20 EMA for trail, 50 EMA for trend health.
- Scaling out plan: Take partial profits at the prior swing high or a clean round level. Move stop to reduce risk only after price closes beyond that level.
- Trailing plan: Trail behind the 20 EMA only while the 20 EMA keeps a clear slope and price respects it on pullbacks.
- When to stop trailing tight: If you see long upper wicks into resistance, or a strong opposite candle that closes below the 20 EMA, you tighten to the last swing low instead of the EMA.
- When to exit the runner: A close below the 50 EMA, or a lower high plus a lower low, ends the trend day logic.
Scaling out pays you for being right. Trailing keeps you in the trade when the market trends harder than your target.
For cleaner target selection and structure-based exits, use this guide on how to set take profit in forex.
How to journal MA trades (what screenshots and notes to capture)
Journal inputs, not feelings. You need the same fields every time.
- Screenshot 1, entry: Full chart with MAs, timeframe, session, and the last 50 to 100 candles visible. Mark entry, stop, and target.
- Screenshot 2, management: Chart at the moment you moved a stop, scaled out, or skipped an add. Mark the reason in one sentence.
- Screenshot 3, exit: Chart showing the exit candle and MA position. Note if exit followed the plan.
- Setup tag: Pullback to EMA, crossover, trend continuation, range filter fail.
- Regime notes: MA slope, price position vs 50 or 200, and whether price recently crossed back and forth.
- Execution notes: Entry type, stop placement rule used, and whether you entered on close or on pullback.
- Risk metrics: Planned R, realized R, and maximum adverse excursion in R.
- One improvement: One change for next time, written as an action rule.
If you do this for 30 trades, you will see which MA conditions produce your best outcomes and which conditions produce repeatable losses.
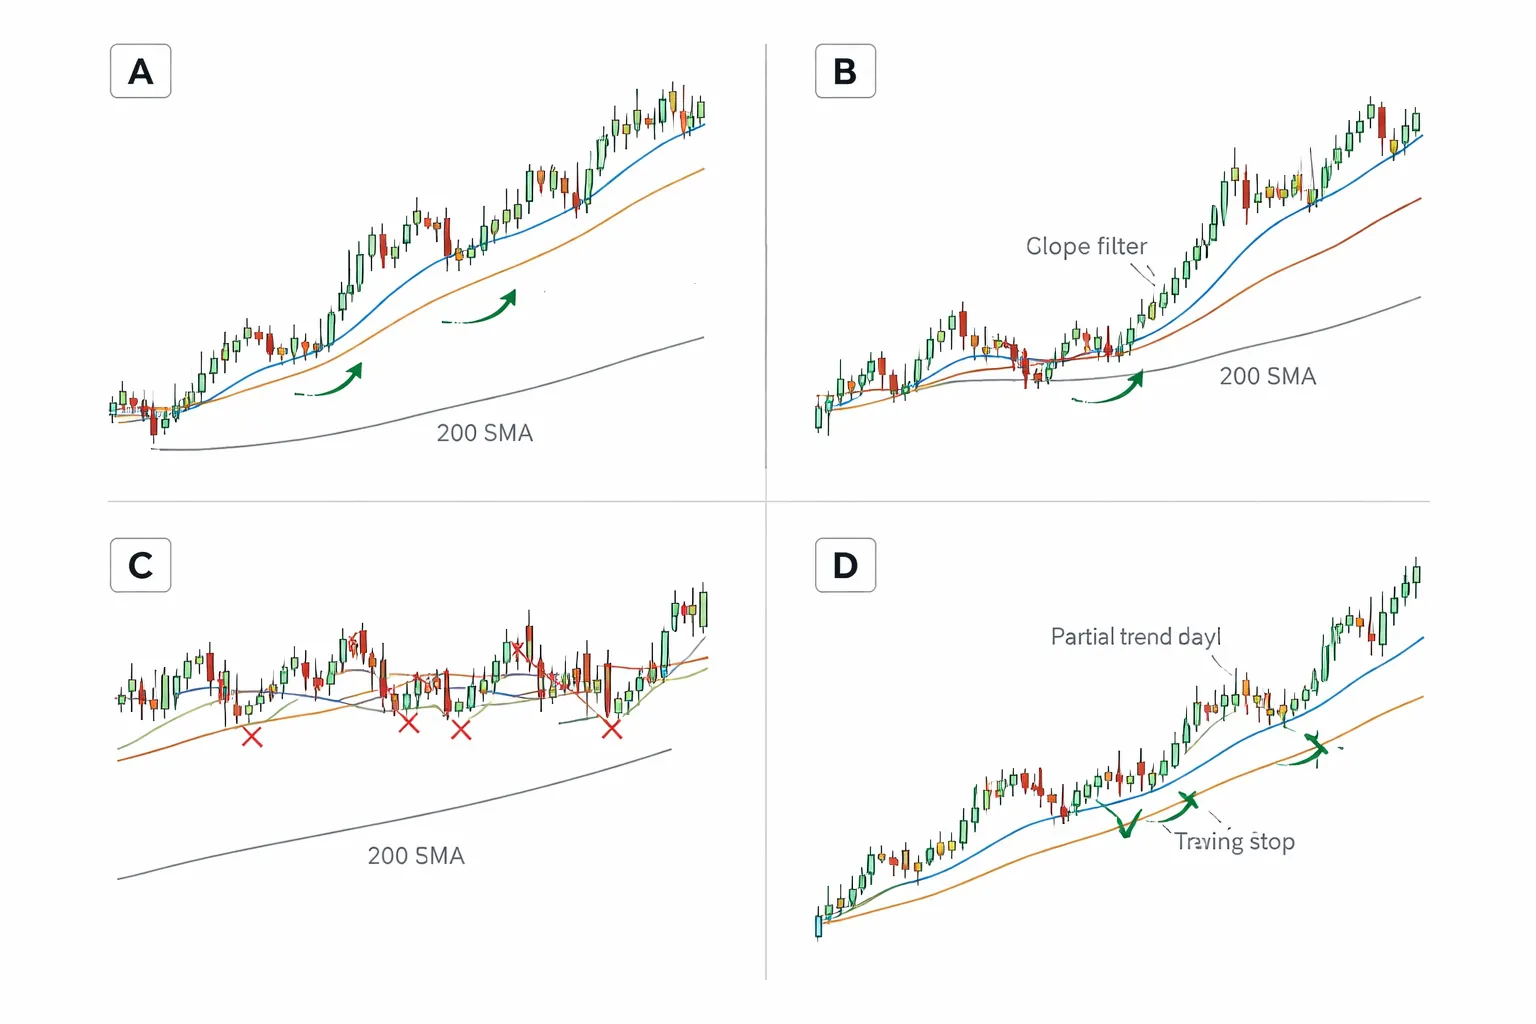
Filters and confirmations that reduce whipsaws
Moving averages lag. In choppy markets, that lag creates whipsaws. You fix most of it with simple filters and strict confirmations. Use one or two. Track results. Do not stack five filters and call it a strategy.
MA slope and separation, measure trend strength with the MAs you already use
You want two things. A clear slope. And space between averages.
- Slope rule: Trade only when your signal MA points in your direction for at least 3 candles. If the MA looks flat, you skip.
- Separation rule: Trade only when the fast MA stays on one side of the slow MA and the gap stays visible. If the lines braid or touch often, you skip.
- Compression warning: If fast and slow MAs compress for 10 to 20 candles, expect a range. Wait for expansion before you take the next signal.
- Reclaim rule: After a cross, require price to hold above the fast MA for longs, or below for shorts, for 1 to 2 closes. This removes many instant reversals.
Higher-timeframe alignment, top-down MA filter
Most whipsaws come from trading against the higher-timeframe drift. Align first, then execute.
- Pick a pair of timeframes: If you enter on H1, filter on H4. If you enter on M15, filter on H1.
- HTF trend filter: Only take longs when HTF price sits above its 50 MA and the 50 MA slopes up. Only take shorts when price sits below and the 50 slopes down.
- HTF MA location filter: If HTF price chops through the 50 MA, you are in transition. Reduce size or skip until it stops crossing.
- Execution rule: On your entry timeframe, take signals only in the HTF direction. Treat opposite signals as exits or no-trades.
Support, resistance, and market structure confirmation
MAs work best when structure agrees. You need a clean path. You also need a logical stop.
- Swing filter: For a long, price must print a higher high and a higher low before you buy the next pullback to the MA. For a short, lower low and lower high.
- Break and hold: Require a close beyond the last swing level, then a retest that holds. Enter on the retest or on the next close back with trend.
- Obstacle check: If the next obvious level sits too close, skip. Your target needs room. A tight level ahead increases chop and early reversals.
- Stop placement: Put your stop beyond the structure point that invalidates the setup, not “x pips.” For details, see stop loss vs take profit.
Volatility filter using ATR or session ranges
Low volatility produces chop. Extreme volatility produces fake breaks. Filter both.
- ATR floor: Trade only when ATR(14) on your entry timeframe sits above your baseline for that pair and timeframe. Build the baseline from the last 20 trading days.
- ATR ceiling: Skip new entries when ATR spikes to an extreme versus its baseline. Spikes often mean news, spread expansion, and stop hunts.
- Range expansion trigger: After a quiet Asian range, wait for London to break the range and close outside it. Then trade in that direction on the first pullback to the MA.
- Minimum space rule: Before entry, your planned stop and target must fit inside normal volatility. If your stop needs more than the pair’s typical swing to work, you are forcing it.
Momentum confirmation options, keep it simple
Pick one confirmation method. Keep it consistent so your trade log stays clean.
- RSI midline: For longs, RSI(14) must hold above 50 at entry. For shorts, it must hold below 50. If RSI flips sides often, you are in a range.
- MACD direction: For longs, MACD line above signal and histogram above zero. For shorts, MACD line below signal and histogram below zero. Use this as a “go or no-go,” not a new entry trigger.
- Candle rules only: Enter only after a strong close in trend direction. Example rules, close above prior candle high for longs, close below prior candle low for shorts. Add a no-trade rule, skip if the entry candle has a long wick against your direction.
- Pullback confirmation: If you buy a pullback to the fast MA, require one rejection candle. Then enter on the next candle break of that rejection high for longs, or low for shorts.
| Filter type | Rule you can test | What it removes |
|---|---|---|
| MA slope and separation | 3-candle slope plus no braiding | Flat-market crosses |
| Higher-timeframe alignment | Trade only in HTF 50 MA direction | Countertrend entries |
| Structure confirmation | HH-HL for longs, LL-LH for shorts | Random swings inside ranges |
| Volatility filter | ATR above baseline, below spike level | Dead chop and news chaos |
| Momentum confirmation | RSI above or below 50 at entry | Weak follow-through moves |
Risk management for MA-based forex systems
Position sizing with a fixed percent risk model
Pick one risk number per trade. Keep it fixed. Most MA systems work with 0.25% to 1.0% risk per trade. Use 0.5% if you want smoother equity.
Calculate position size from your stop loss, not from your confidence.
- Step 1: Set the stop where your MA setup fails, usually beyond the last swing high or low, or beyond the MA break level.
- Step 2: Convert that stop distance to pips.
- Step 3: Risk amount = account equity x risk percent.
- Step 4: Position size = risk amount divided by (stop pips x pip value).
Example. $10,000 account. Risk 0.5% = $50. Stop = 25 pips. On a pair where 1 standard lot is about $10 per pip, risk per lot = 25 x $10 = $250. Position size = $50 / $250 = 0.20 lots.
If your stop needs to be wide because ATR is high, your size drops. That is the point.
Setting realistic expectations, win rate vs payoff ratio trade-offs
MA systems sit on a spectrum. Trend-following versions win less often, but pay more when they win. Faster mean-reversion or pullback versions win more often, but pay less.
- HTF trend plus pullback entry: often 40% to 55% win rate, with 1.5R to 3R average winner in clean trends.
- Fast MA cross in chop: can look like 50% to 60% wins, but average winner often stays near 1R, slippage and spread cut it down.
Match your exits to your edge. If your average win stays near 1R, you need a higher win rate and strict cost control. If your average win sits above 2R, you can tolerate more small losses.
Track two numbers every month. Win rate, average R per trade. R means profit or loss divided by your risk.
Avoiding correlated exposure across pairs (USD clusters, JPY clusters)
MA signals often trigger across many pairs at once because the driver is the same currency move. If you take all of them, you stack the same bet.
- USD cluster: EURUSD, GBPUSD, AUDUSD, NZDUSD often move together versus USD.
- JPY cluster: USDJPY, EURJPY, GBPJPY, AUDJPY often move together versus JPY.
Use a simple cap. Risk per idea, not per chart.
- Max 1 trade per currency cluster at a time, or take two but cut size so total cluster risk stays at 1R.
- Count exposure by currency. If USD shows up in three open positions, treat it as one oversized position.
- Avoid doubling up with near duplicates, like EURUSD long plus GBPUSD long plus AUDUSD long.
Drawdown control, daily loss limits and trade frequency caps
Your MA strategy will hit losing streaks. You need hard limits that stop damage when conditions shift.
- Daily loss limit: stop trading after -2R in a day. If you risk 0.5% per trade, that is -1% per day.
- Weekly loss limit: stop new trades after -5R for the week. Review filters, spreads, and execution.
- Trade cap: 3 to 5 trades per session. More trades usually means you started forcing signals.
- Cooldown rule: after two losses in a row, skip the next signal and reassess structure and ATR.
Put these rules in your trading plan and in your platform alerts. If you use stops and limits, make sure you understand the differences between market, limit, and stop orders.
Common risk mistakes, moving stops, revenge trading, and over-leverage
- Moving stops wider: you turn a planned 1R loss into a random loss. If price hits your stop, your setup failed. Exit.
- Taking losses personally: MA systems lose by design. You manage loss size, not loss frequency.
- Revenge trading: you re-enter without HTF alignment, structure, ATR, and RSI confirmation. You break the system and spike your drawdown.
- Over-leverage: you size from margin available, not from stop distance. One volatility expansion can wipe weeks of gains.
- Risk creep after wins: you increase size because the last trade worked. Keep risk fixed. Let the edge play out over 50 to 200 trades.
Write one line above your chart. “Same risk. Same rules. Same process.” Follow it.
Pros, cons, and common mistakes with moving average strategies
Strengths
- Objective trend framework. You stop guessing direction. Price above your filter MA, you bias long. Price below, you bias short. You spend less time arguing with the chart.
- Repeatability. Same setup, same trigger, same exit rule. That makes your journal useful. It also makes errors easy to spot.
- Scalability. You can apply the same MA rules across pairs and timeframes. You can also stack timeframes, higher timeframe MA for bias, lower timeframe MA for entries, without changing the core logic.
Weaknesses
- Lag. The MA reacts after price moves. Your entry comes later, your stop often sits farther away, and your reward-to-risk can shrink if you chase.
- Chop sensitivity. Range markets create whipsaws. Crossovers fire, then fail. Your win rate drops fast when volatility compresses and rotates.
- Late exits. MA exits protect you from holding losers, but they can give back open profit. Your equity curve can feel smooth, but your best trades can end with large pullbacks before the exit prints.
Common mistake 1, optimizing MA periods to past data
You change 20 to 18. Then 18 to 21. You keep tweaking until the backtest looks clean. That is curve fitting.
- Use round, standard periods, 20, 50, 100, 200. Keep them stable.
- Test on out-of-sample data. Split by year or by regime.
- Track the basics, win rate, average R, max drawdown, trade count. If a tweak improves one metric but hurts stability, you ignore it.
Common mistake 2, using crossovers alone without context
A crossover is a signal. It is not a trade plan. In chop, it becomes a loss machine.
- Add a simple filter, slope of the slower MA. Flat slope means range risk.
- Use structure, enter near a pullback, not at the extension candle. A crossover after a big candle often signals you arrived late.
- Define the invalidation point first. Place your stop where the setup is wrong, then size your position from that distance. Use a clear process for setting stop loss and take profit.
Common mistake 3, ignoring market regime and news events
Moving averages work best in trends. They bleed in ranges. News can flip regime in minutes.
- Label the regime before you trade, trend or range. Use higher timeframe structure and MA slope. If it is range, trade less or switch tools.
- Reduce signals during low volatility compression. That is where whipsaws cluster.
- Respect scheduled news, CPI, jobs, rate decisions, speeches. Spread and slippage jump. Your MA rules do not change, but your execution does. Avoid new entries right before red news, or cut risk.
How to backtest and validate a moving average strategy (without overfitting)
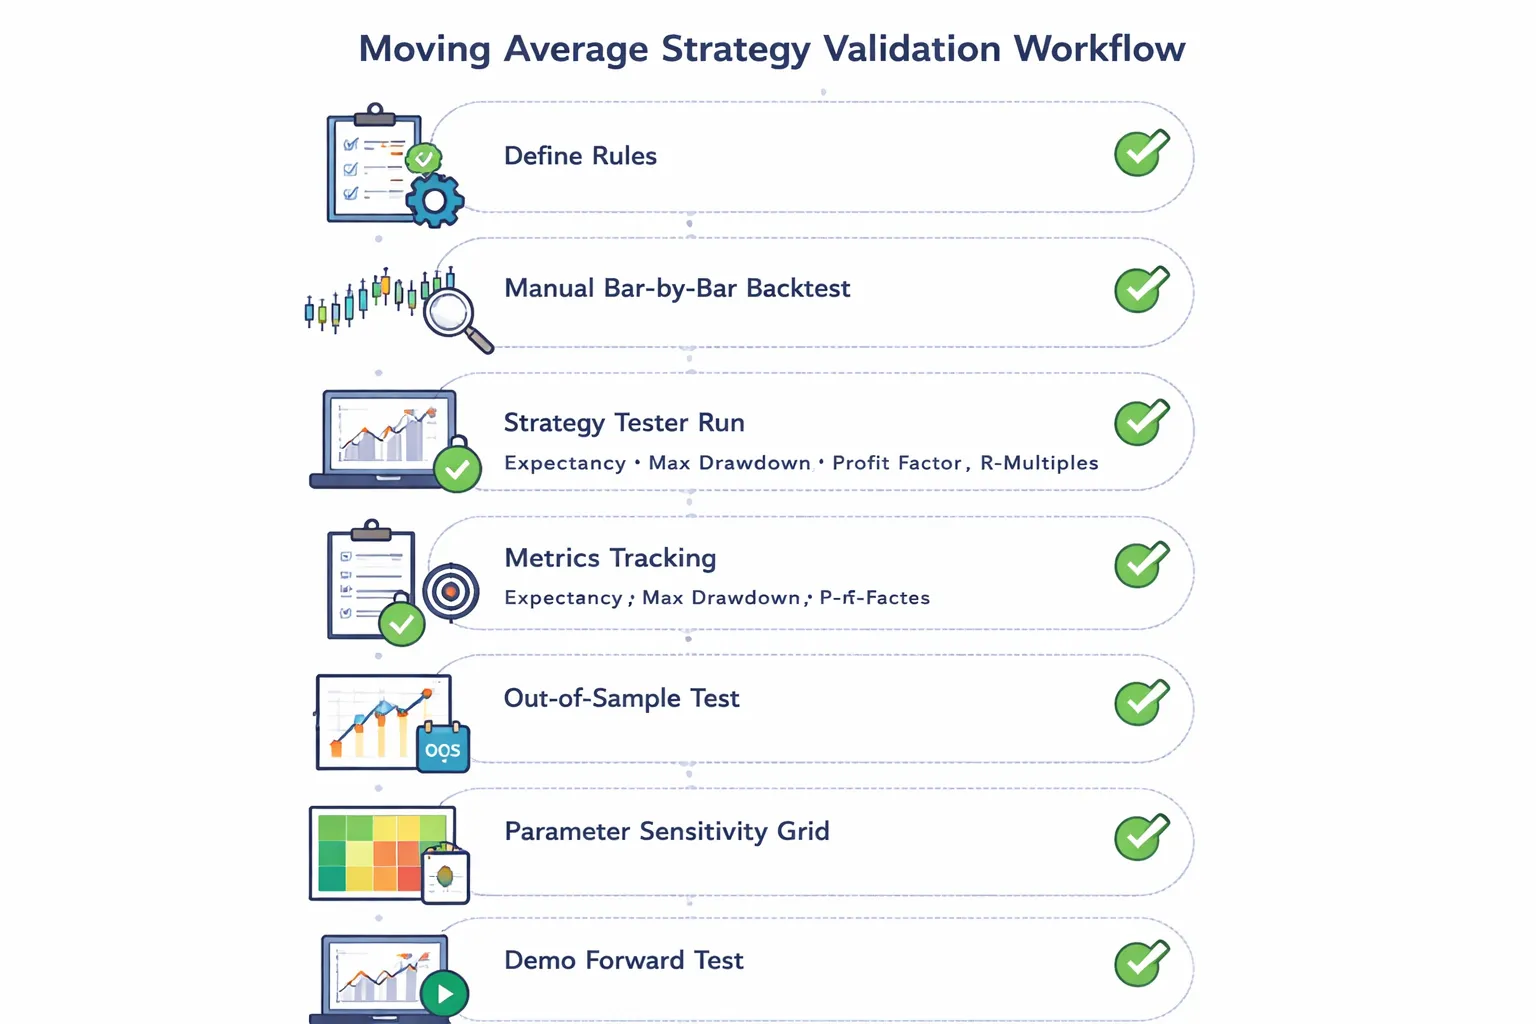
Define rules precisely before you test
Write rules you can follow without judgment. If you cannot code it, you cannot test it cleanly.
- Market: pair, timeframe, trading hours, spread assumption.
- Indicator settings: MA type, MA lengths, price source (close or typical), session time zone.
- Signal: exact trigger. Example, fast MA crosses above slow MA on candle close. You enter at next candle open.
- Valid setup filter: what must be true to take the signal. Example, slow MA slope up, price closes above slow MA, no trade inside X pips of major level.
- Invalid setup: what cancels it. Example, signal occurs during scheduled red news window, or spread exceeds your limit.
- Entry: market or stop order, and the exact price used in testing.
- Stop loss: fixed pips, swing-based, or ATR-based. Define when you place it and if you trail it.
- Take profit: fixed R multiple, opposite cross, or structure target. Define which one has priority.
- Risk: percent per trade or fixed cash risk. Keep it constant in the test.
- One position rule: allow pyramiding or not. Define re-entry rules after exit.
Manual backtesting (bar-by-bar) vs strategy tester
Manual testing finds logic gaps. Strategy testers find statistical truth faster. Use both.
- Manual bar-by-bar workflow:
- Pick one pair and one timeframe. Define the date range.
- Hide future candles. Scroll one candle at a time.
- Mark each signal. Check your filters. Decide trade or no trade.
- Record entry, stop, target, exit reason, and R result.
- Include realistic spread and a slippage rule, like plus 0.2 to 0.5 pip per trade on majors.
- Do at least 50 to 100 trades before you judge anything.
- Platform strategy tester workflow:
- Code the rules with no discretionary filters.
- Use tick or high-quality data if available. Do not trust default modeling.
- Lock costs. Spread, commissions, swap, and a slippage assumption.
- Run the same rules across multiple pairs and regimes.
- Export every trade. Inspect losing streaks and outliers.
Manual testing tells you if the rules make sense. The tester tells you if the edge survives scale.
Key metrics to track (what matters)
Track metrics per trade and per month. Use R-multiples so results stay comparable.
- R-multiple: profit or loss divided by initial risk. Example, -1R, +2R.
- Expectancy: average R per trade. This drives long-term growth.
- Win rate: percent of winning trades. Useful, but it can mislead.
- Average win and average loss: tells you if your payoff supports your win rate.
- Profit factor: gross profit divided by gross loss. Treat it as a supporting metric, not a goal.
- Max drawdown: peak-to-trough equity drop. Compare it to your risk tolerance.
- Max consecutive losses: sets expectations for losing streaks.
- Trade frequency: trades per week or month. Low frequency needs more time to validate.
| Metric | How to use it | Red flag |
|---|---|---|
| Expectancy (R) | Primary edge measure | Positive in-sample, near zero out-of-sample |
| Max drawdown | Position size reality check | One regime creates most of the drawdown |
| Profit factor | Confirms quality of returns | Looks great only because of one big winner |
| R distribution | Shows tail risk and payoff | Frequent small wins, rare large losses |
Validate without overfitting
Overfitting happens when you tune MA lengths until the past looks perfect. You need rules that hold up across time and pairs.
- Split your data: build on in-sample, validate on out-of-sample. Example, 2016 to 2022 in-sample, 2023 to 2025 out-of-sample.
- Use walk-forward blocks: optimize on a block, test on the next block. Repeat. Do not optimize on the full history.
- Run parameter sensitivity: test a range of MA lengths. Example, fast MA 10 to 30, slow MA 50 to 200. Look for a stable plateau, not one best number.
- Stress costs: increase spread and slippage. If a small cost bump kills the edge, the edge is thin.
- Test across instruments: run the same rules on several major pairs. Do not trust one pair success.
- Check regime exposure: tag trades by volatility or trend filter. If the strategy only works in one condition, you need a clear rule to avoid the rest.
- Avoid rule stacking: every new filter must improve out-of-sample results, not just in-sample.
Forward test on demo before you go live
Backtests show potential. Forward tests show execution reality. Treat it as a final filter.
- Trade the exact rules on demo for 20 to 50 trades, or 4 to 8 weeks, whichever takes longer.
- Use real session times and your broker spreads. Log spread at entry and exit.
- Place orders the way you plan to trade live. Market, limit, or stop.
- Track R per trade and compare to the backtest distribution, not one week of results.
- Only change one variable at a time. If you change MA lengths and stop rules together, you learn nothing.
- Build a routine you can keep, using demo replays and structured practice.
If out-of-sample and forward results stay close to the backtest, you have something you can size with control. If they diverge, simplify rules and retest.
FAQ
Which moving average works best for forex, SMA or EMA?
EMA reacts faster and fits trend and pullback entries. SMA filters more noise and fits slower systems. Pick one and keep it consistent in testing. If your stop is tight, EMA often matches better. If you trade higher timeframes, SMA often works.
What moving average lengths should you start with?
Start simple. One fast MA and one slow MA. Common pairs are 20 and 50, or 50 and 200. Use the same pair across pairs and timeframes during testing. Change lengths only after you have at least 100 trades of data.
Do moving average crossovers work in forex?
They can work in clean trends and fail in ranges. Crossovers lag, so you often enter late. Improve them with a filter, trade only when price holds above the slow MA for longs, below for shorts. Use a hard stop and fixed risk.
What timeframe is best for a moving average strategy?
Higher timeframes reduce noise and false signals. H1, H4, and D1 usually test better than M5 and M15. Match timeframe to your schedule. If you cannot watch charts, use H4 or D1. If you day trade, use H1.
How do you avoid getting chopped in sideways markets?
Add a regime filter. Trade only when the slow MA has clear slope and price stays on one side. Skip flat periods. You can also require a break of structure and a pullback entry. If you still overtrade, reduce trades with strict session rules.
Where should your stop-loss go with MA setups?
Put the stop where your setup fails, not at a random pip count. For pullbacks, place it beyond the swing high or low that formed the entry. For crossovers, use the last swing or an ATR based stop. Keep risk per trade fixed.
What is a realistic win rate for MA strategies?
Many MA systems win 35 to 55 percent, depending on exits. Trend systems often have lower win rate and larger winners. Do not judge by win rate alone. Track expectancy, average R, and max drawdown. Compare forward results to backtest ranges.
Can you trade moving averages alone?
You can, but pure MA signals often lack context. Add one more element, like market structure or key levels, then keep rules tight. If you add too many filters, you curve fit. Keep a checklist and stop trading when you break it.
How many trades do you need before you trust results?
Use at least 100 trades per setup as a baseline. More is better if your system trades rarely. Split data into in-sample and out-of-sample. Then forward test. If your forward metrics fall inside the backtest distribution, you can size up slowly.
Why does the strategy work in backtests but fail live?
You likely optimized too much, traded different sessions, or changed execution. Spreads and slippage matter most on low timeframes. Fix one variable at a time. Lock MA lengths, stop rules, and trading hours. Then retest and forward test with the same process.
How do you prevent overtrading MA signals?
Limit trades per day and trade only your best setup variant. Use a minimum distance rule, no entry if price sits on the MA. Use session windows and a daily loss limit. For a full process, read how to avoid overtrading.
Conclusion
Moving averages help you trade structure, not noise. They work best when you keep the rules simple and consistent. Pick one setup. Use one timeframe. Use fixed MA lengths. Define your entry trigger, stop, and exit before you place the trade.
- Trade the right market state. Trend rules for trends, range rules for ranges. Skip mixed conditions.
- Control risk first. Set a hard stop, a daily loss limit, and a max trades per day.
- Avoid weak signals. Require clear separation from the MA. No entries when price chops on the line.
- Track every trade. Log setup type, session, MA slope, stop size, and outcome. Cut variants that do not hold up.
Final tip, treat your MA as a filter, not a forecast. Use it to stay on the right side of price. Use support and resistance to place your stop and target with clear invalidation and clean space to price.
-
Stop Loss vs Take Profit: Differences, Examples & Best Practices
5 months ago -
Forex Trading Psychology Tips: How to Stay Disciplined and Consistent
5 months ago -
Forex Order Types Explained: Market vs Limit vs Stop Orders
5 months ago -
How to Set Stop Loss and Take Profit (Step-by-Step)
5 months ago -
How to Start Forex Trading Step by Step (Beginner Roadmap)
5 months ago
-
-
- Setup 1: Single MA trend filter plus breakout entry rules
- Setup 2: Double MA crossover with trend confirmation criteria
- Setup 3: Pullback-to-MA continuation (mean reversion inside a trend)
- Setup 4: MA slope plus candle confirmation (engulfing or pin bar) for timing
- Best default settings to start, and when to adjust them
-
- Entry checklist (trend, location, trigger, timing window)
- Stop-loss methods (swing-based, ATR-based, structure-based)
- Take-profit options (fixed R-multiple, next structure level, trailing MA)
- When to exit early (MA flattening, opposite close, failed retest)
- Invalidation rules (what proves you wrong)
- How to handle spread, session timing, and news risk
-
- Example A: EUR/USD pullback-to-EMA continuation trade (walkthrough)
- Example B: GBP/JPY crossover trade with whipsaw avoidance filter
- Example C: Range market failure case, how the strategy loses and why
- Example D: Trend day management, scaling out vs trailing decisions
- How to journal MA trades (what screenshots and notes to capture)
-
- Position sizing with a fixed percent risk model
- Setting realistic expectations, win rate vs payoff ratio trade-offs
- Avoiding correlated exposure across pairs (USD clusters, JPY clusters)
- Drawdown control, daily loss limits and trade frequency caps
- Common risk mistakes, moving stops, revenge trading, and over-leverage
-
- Which moving average works best for forex, SMA or EMA?
- What moving average lengths should you start with?
- Do moving average crossovers work in forex?
- What timeframe is best for a moving average strategy?
- How do you avoid getting chopped in sideways markets?
- Where should your stop-loss go with MA setups?
- What is a realistic win rate for MA strategies?
- Can you trade moving averages alone?
- How many trades do you need before you trust results?
- Why does the strategy work in backtests but fail live?
- How do you prevent overtrading MA signals?
-
-
-
- Setup 1: Single MA trend filter plus breakout entry rules
- Setup 2: Double MA crossover with trend confirmation criteria
- Setup 3: Pullback-to-MA continuation (mean reversion inside a trend)
- Setup 4: MA slope plus candle confirmation (engulfing or pin bar) for timing
- Best default settings to start, and when to adjust them
-
- Entry checklist (trend, location, trigger, timing window)
- Stop-loss methods (swing-based, ATR-based, structure-based)
- Take-profit options (fixed R-multiple, next structure level, trailing MA)
- When to exit early (MA flattening, opposite close, failed retest)
- Invalidation rules (what proves you wrong)
- How to handle spread, session timing, and news risk
-
- Example A: EUR/USD pullback-to-EMA continuation trade (walkthrough)
- Example B: GBP/JPY crossover trade with whipsaw avoidance filter
- Example C: Range market failure case, how the strategy loses and why
- Example D: Trend day management, scaling out vs trailing decisions
- How to journal MA trades (what screenshots and notes to capture)
-
- Position sizing with a fixed percent risk model
- Setting realistic expectations, win rate vs payoff ratio trade-offs
- Avoiding correlated exposure across pairs (USD clusters, JPY clusters)
- Drawdown control, daily loss limits and trade frequency caps
- Common risk mistakes, moving stops, revenge trading, and over-leverage
-
- Which moving average works best for forex, SMA or EMA?
- What moving average lengths should you start with?
- Do moving average crossovers work in forex?
- What timeframe is best for a moving average strategy?
- How do you avoid getting chopped in sideways markets?
- Where should your stop-loss go with MA setups?
- What is a realistic win rate for MA strategies?
- Can you trade moving averages alone?
- How many trades do you need before you trust results?
- Why does the strategy work in backtests but fail live?
- How do you prevent overtrading MA signals?
-
-
How to Place a Forex Trade Step by Step (Your First Trade Explained)
3 months ago -
Forex Trading vs Crypto Trading: Which Market Is Better for Beginners?
3 months ago -
Forex Lot Size Calculator: How to Use It to Size Trades Correctly
5 months ago -
How to Calculate Position Size in Forex (Position Sizing Formula + Examples)
5 months ago -
Forex Leverage Explained: How It Works, Pros, Cons & Examples
5 months ago
-
Forex Trading Platforms Comparison: MetaTrader vs cTrader vs TradingView
5 months ago -
Is Forex Trading Legal in the United States? Rules, Regulators & What to Know
5 months ago -
Stop Loss vs Take Profit: Differences, Examples & Best Practices
5 months ago -
Forex Market Hours & Trading Sessions Explained (Best Times to Trade)
5 months ago -
Forex Leverage Explained: How It Works, Pros, Cons & Examples
5 months ago