Risk-Reward Ratio in Forex: How to Use It (With Simple Examples)

You can win more trades and still lose money. The fix is simple, control how much you risk versus what you aim to make.
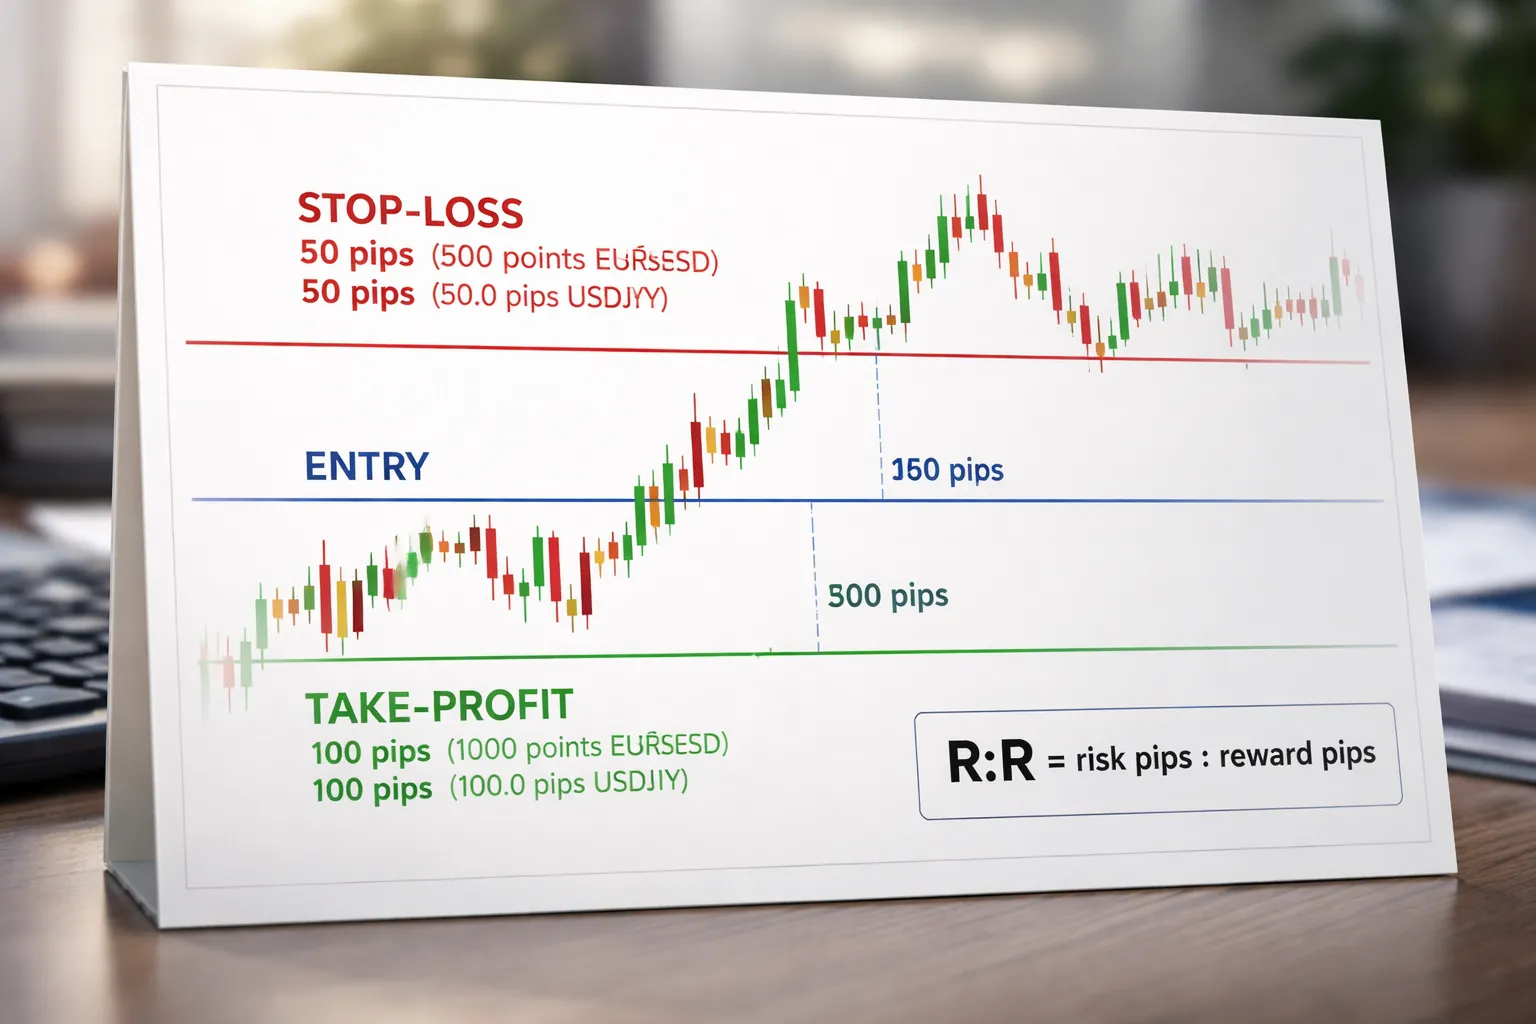
The risk-reward ratio compares your planned loss to your planned profit on a trade. You set it before you enter, using your entry price, stop-loss, and take-profit. Example, you risk 20 pips to target 40 pips, your ratio is 1:2.
In this guide, you will learn how to calculate risk-reward in pips and dollars, how to choose a workable ratio, and how it links to win rate and break-even math. You will also see simple forex examples you can copy, plus common mistakes that make ratios useless in live markets. For the setup pieces, see stop-loss and take-profit levels.
Key Takeaways
- In het kort:
- Risk-reward compares what you can lose to what you can make. Example, risk 20 pips to target 40 pips equals 1:2.
- Calculate it in pips first, then convert to dollars using your position size and pip value.
- Set your stop and target before you enter. If you move them after entry, your ratio stops being a plan.
- A higher ratio does not mean a better trade. You must match it to a realistic win rate.
- Use break-even math to pressure test your ratio. Break-even win rate equals risk divided by risk plus reward.
- Track your real results. Your average win and average loss matter more than your “planned” ratio.
- Do not place targets in random space. Use clear levels, see support and resistance.
- Avoid common ratio killers, tight stops in noisy zones, targets too far for the session, and widening stops to “save” trades.
Risk-reward ratio in forex: what it means (and what it doesn’t)
Risk-reward ratio in forex: what it means (and what it doesn’t)
Risk and reward in forex terms
Risk is the distance from your entry to your stop-loss. It is what you lose if price hits your stop.
Reward is the distance from your entry to your take-profit. It is what you make if price hits your target.
You can express both in pips, price, or account currency. The ratio stays the same if you measure both the same way.
- Pips: Risk = stop distance in pips. Reward = target distance in pips.
- Price: Risk = entry price minus stop price. Reward = target price minus entry price.
- Account currency: Risk = position size x stop distance x pip value. Reward = position size x target distance x pip value.
The ratio is simple math. It does not depend on the pair, the timeframe, or your opinion of the setup.
Risk-reward vs reward-to-risk
Traders use both terms. They describe the same relationship. They just flip the fraction.
- Risk-reward (R:R): risk divided by reward. Example, 1:2 means you risk 1 to make 2.
- Reward-to-risk (R/R or R:R): reward divided by risk. Example, 2:1 means you aim to make 2 for every 1 you risk.
Do not mix them in your journal. Pick one format and keep it.
Why a high ratio does not mean a better trade
A higher ratio often lowers your win rate. That is the tradeoff.
A 1:5 target can look great on paper. It can also sit in empty space, get missed by a few pips, then reverse.
You improve expectancy by balancing ratio and win rate, then managing execution.
| Planned R:R | Break-even win rate |
|---|---|
| 1:1 | 50.0% |
| 1:2 | 33.3% |
| 1:3 | 25.0% |
| 1:5 | 16.7% |
Your job is not to chase the biggest ratio. Your job is to hit a ratio you can actually realize with your strategy and market conditions.
- Strong trends can support higher rewards. Ranges often cannot.
- News spikes can hit both stop and target logic. Spread and slippage change real risk.
- A tight stop can inflate your ratio. It can also increase stop-outs in normal noise.
What the risk-reward ratio does not tell you
- It does not tell you the probability of profit.
- It does not tell you where price will turn.
- It does not tell you if your stop location makes sense.
- It does not protect you from bad fills, gaps, or spread widening.
- It does not reflect your true average win and average loss over a large sample.
How it fits into a complete risk management framework
Use risk-reward as one input, not the full plan.
- Define the trade: entry, stop, target. Use clear levels and structure.
- Size the position: set a fixed risk per trade in account currency, then calculate lot size from stop distance.
- Control total exposure: limit risk across open trades, especially on correlated pairs.
- Track outcomes: log planned R:R and realized R:R. Focus on average win, average loss, and drawdown.
- Adjust rules: if you miss targets often, your target may sit too far for the session. If you get stopped often, your stop may sit in noise.
If you need help setting targets with structure, read how to set take profit in forex.
Why risk-reward ratio matters for long-term profitability
Expectancy explained
Long-term profitability comes from positive expectancy. Expectancy estimates what you make per trade over many trades.
Expectancy formula: (win rate × average win) − (loss rate × average loss).
Risk-reward ratio sets the size of your average win compared to your average loss. Your win rate then decides how often you collect that win.
Example with fixed risk of 1R per trade.
| Setup | Win rate | Avg win | Avg loss | Expectancy (in R) |
|---|---|---|---|---|
| 1:1 | 50% | +1R | -1R | (0.50×1) − (0.50×1) = 0.00R |
| 1:2 | 40% | +2R | -1R | (0.40×2) − (0.60×1) = +0.20R |
| 1:3 | 30% | +3R | -1R | (0.30×3) − (0.70×1) = +0.20R |
When you track trades in R, you can compare performance across pairs and position sizes. You also see if your realized R:R matches your planned R:R.
How risk-reward can offset a lower win rate, and when it can’t
Higher R:R lowers the win rate you need to break even.
Break-even win rate: 1 ÷ (R:R + 1).
- 1:1 needs 50% wins.
- 1:2 needs 33.3% wins.
- 1:3 needs 25% wins.
But higher targets can fail more often. Your realized average win can drop if you take partial profits early or move targets mid-trade. Slippage and spreads also hurt smaller targets more, which makes low R:R harder to sustain.
Use your journal data to check two numbers.
- Your realized win rate at each target distance.
- Your realized average win in R, after partials and early exits.
If your win rate collapses as you push for bigger R:R, expectancy can turn negative. In that case you need better entries, better filters, or a target that fits the session volatility.
Capital preservation, reducing drawdowns and the risk of ruin
Risk-reward ratio matters because losses compound faster than gains. Deep drawdowns require large percentage returns to recover.
| Drawdown | Gain needed to recover |
|---|---|
| 10% | 11.1% |
| 20% | 25% |
| 30% | 42.9% |
| 50% | 100% |
Solid R:R supports capital preservation in two ways.
- You can keep risk per trade small and still grow the account if expectancy stays positive.
- You need fewer winning trades to offset a losing streak, which helps stabilize equity swings.
Risk of ruin rises when you combine big position sizes with low expectancy. It also rises when you stack exposure across pairs that move together. Use correlation awareness to avoid doubling your risk on the same idea, see forex correlation pairs.
Decision quality, removing emotional, on-the-fly profit targets
Planned R:R forces a clear decision before you enter. Entry, stop, and target become one package.
This improves execution.
- You stop taking profit early because you feel nervous.
- You stop widening stops to avoid a loss.
- You stop changing targets based on the last candle.
Set the R:R first, then decide if the setup qualifies. If price structure does not support the target, you skip the trade. This keeps your results tied to a repeatable process, not to mood.
How to calculate risk-reward ratio in forex (step-by-step)
Step 1: Choose an entry based on your setup, not on the ratio
Pick your entry because your rules say so. Use a trigger you can repeat, like a break of a level, a pullback entry, or a candle close. Do not move the entry to force a better ratio. A fake ratio comes from a fake entry.
Step 2: Place the stop-loss at a price level that invalidates the trade idea
Your stop goes where your setup is wrong. Put it beyond a swing high or swing low, beyond a range boundary, or beyond the structure you rely on.
- Long trade: stop below the invalidation low.
- Short trade: stop above the invalidation high.
- Rule: if price can hit your stop and your idea is still valid, your stop is not placed by logic.
Step 3: Set a take-profit using structure or measured moves
Set your target where price has a reason to react. Use the next support or resistance level. Or use a measured move based on the prior swing.
- Structure target: next swing high for longs, next swing low for shorts.
- Range target: opposite side of the range.
- Measured move: project the last impulse leg from the breakout or pullback area.
Keep the target realistic. If the target sits inside heavy traffic, you will get chopped out or you will take profit early.
Step 4: Convert price distance into pips (including JPY pairs and 5-digit pricing)
You need two distances. Risk in pips, and reward in pips.
- Risk (pips): absolute value of entry minus stop, converted to pips.
- Reward (pips): absolute value of target minus entry, converted to pips.
| Pair type | 1 pip equals | Example pricing | Notes |
|---|---|---|---|
| Most pairs (EURUSD, GBPUSD) | 0.0001 | 1.08452 | 5-digit quotes show a 5th decimal. That last digit is a pipette, 0.1 pip. |
| JPY pairs (USDJPY, EURJPY) | 0.01 | 146.237 | 3-digit quotes show a 3rd decimal. That last digit is a pipette, 0.1 pip. |
Example A, EURUSD (5-digit quote):
- Entry: 1.08450
- Stop: 1.08370
- Target: 1.08650
- Risk: 1.08450 to 1.08370 = 0.00080 = 8 pips
- Reward: 1.08650 to 1.08450 = 0.00200 = 20 pips
Example B, USDJPY (3-digit quote):
- Entry: 146.24
- Stop: 146.04
- Target: 146.74
- Risk: 146.24 to 146.04 = 0.20 = 20 pips
- Reward: 146.74 to 146.24 = 0.50 = 50 pips
Step 5: Compute the ratio and sanity-check it against market structure
Use this formula.
Risk-reward ratio = risk pips : reward pips
- Example A: 8 pips : 20 pips = 1:2.5
- Example B: 20 pips : 50 pips = 1:2.5
Then sanity-check the trade.
- Check the path: if major support or resistance sits before your target, your reward number is inflated.
- Check the stop logic: if your stop sits inside normal noise for that pair and timeframe, you will get stopped by randomness.
- Check the setup first: if structure does not support the target, skip the trade. Do not redesign the chart to keep the ratio.
If you need a simple framework to define entries, invalidation, and targets on one chart, use the same checklist each session, see our beginner roadmap.
Simple risk-reward ratio examples (forex scenarios)
Example A: 1:1 trade using a range bounce
Market condition: EUR/USD ranges between 1.1000 support and 1.1060 resistance.
You buy the bounce at support because price rejects lower and closes back inside the range.
- Entry: 1.1005
- Stop: 1.0985, 20 pips risk
- Target: 1.1025, 20 pips reward
- Risk-reward: 20:20 = 1:1
Common outcome: you need a decent win rate because winners do not pay for many losers. A 1:1 profile breaks even before costs near 50 percent win rate. Spread and slippage push the true breakeven higher.
| Item | Price | Pips |
|---|---|---|
| Entry | 1.1005 | |
| Stop | 1.0985 | 20 |
| Target | 1.1025 | 20 |
Example B: 1:2 trade using a breakout plus retest
Market condition: GBP/USD breaks above a clear range high, then retests the level. You only take the trade if the retest holds and structure stays intact. For detailed rules, see our breakout trading strategy.
- Entry: 1.2500 on the retest hold
- Stop: 1.2475 below the retest swing, 25 pips risk
- Target: 1.2550 at the next structure zone, 50 pips reward
- Risk-reward: 25:50 = 1:2
Key point: the target comes from structure, not a random pip number. If the next resistance sits closer than your planned target, you adjust the trade or you skip it.
| Item | Price | Pips |
|---|---|---|
| Entry | 1.2500 | |
| Stop | 1.2475 | 25 |
| Target | 1.2550 | 50 |
Example C: 1:3 trade on a trend continuation
Market condition: USD/JPY trends up. Price pulls back to a prior swing area, then prints a continuation push.
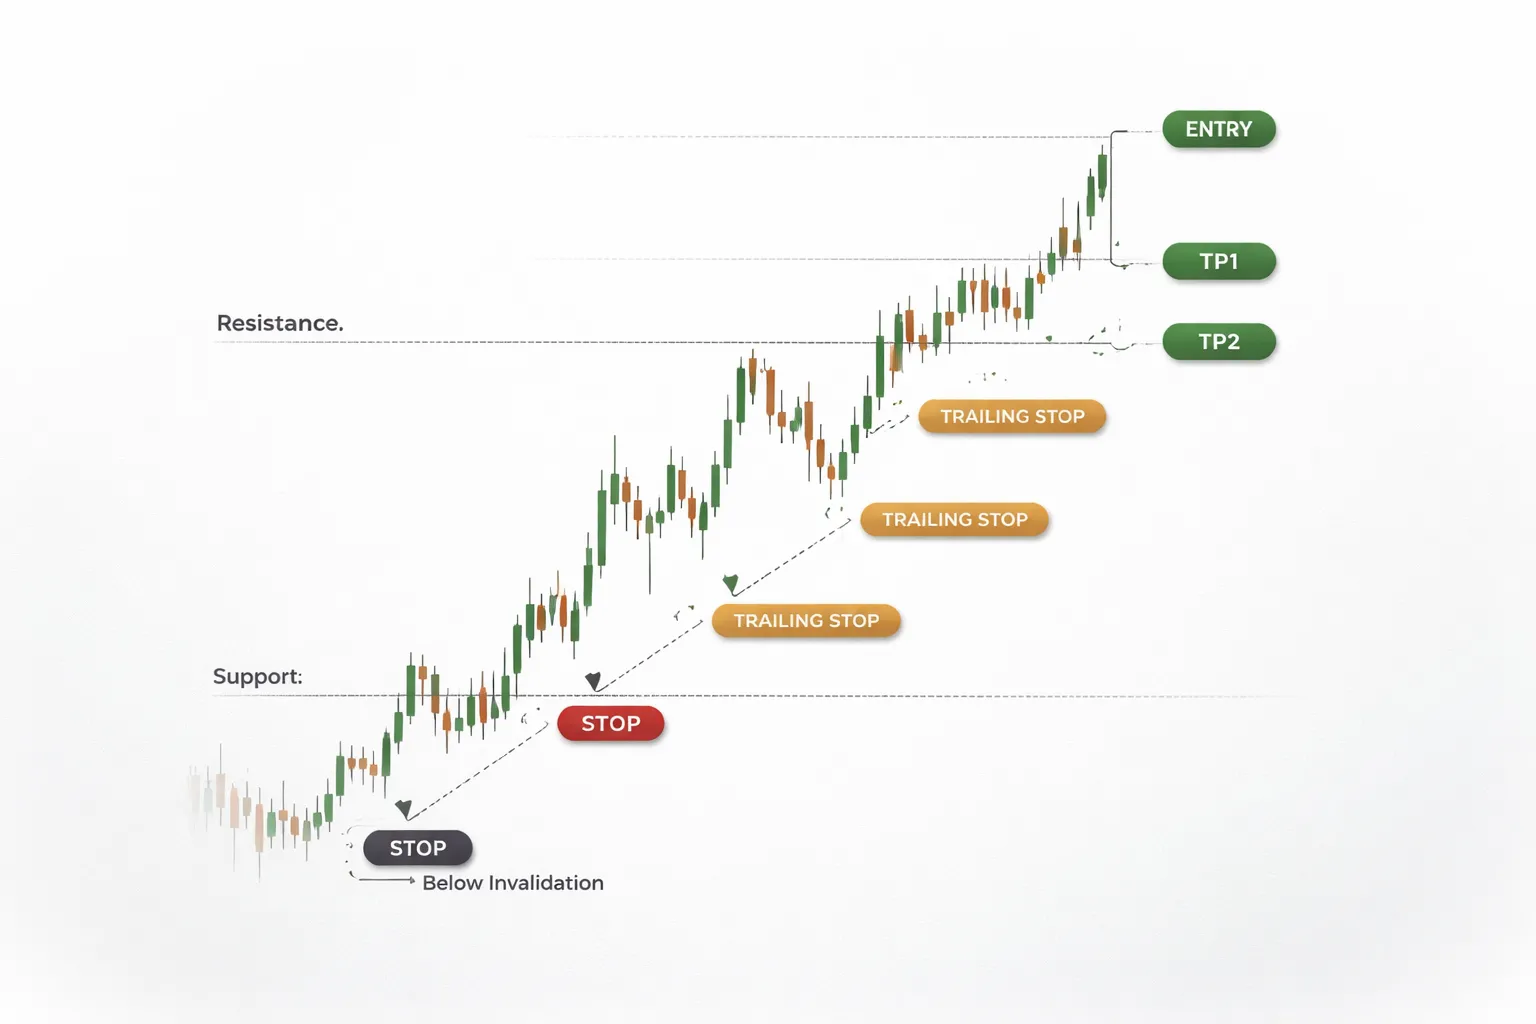
You can run a higher ratio without guessing the exact top by using multiple targets or a trailing stop.
- Entry: 148.20 after continuation confirms
- Stop: 147.90 below the pullback low, 30 pips risk
- Target plan: partial at 148.80, then trail the rest
| Leg | Exit price | Reward (pips) | RR vs 30 pip risk |
|---|---|---|---|
| TP1 | 148.80 | 60 | 1:2 |
| Runner | 149.10 | 90 | 1:3 |
Key point: you still anchor the stop to invalidation. You do not tighten it to force a 1:3 number. You earn the ratio by letting a trend pay you.
Example D: When to skip a trade because the ratio is poor
Market condition: AUD/USD sits below a clean resistance level. You see a long setup, but the next resistance caps upside fast.
- Entry: 0.6600
- Stop: 0.6580, 20 pips risk
- Nearest resistance: 0.6610, 10 pips potential reward
- Risk-reward: 20:10 = 2:1, you risk two to make one
You skip it. The chart does not give you room. If you want to take the idea, you need a different entry location, a different timeframe with wider structure, or a clean break of resistance first. Do not hold the trade and hope price ignores the level.
| Item | Price | Pips |
|---|---|---|
| Entry | 0.6600 | |
| Stop | 0.6580 | 20 |
| Nearest resistance | 0.6610 | 10 |
What is a good risk-reward ratio in forex?
Rule-of-thumb ranges by trading style
A good risk-reward ratio depends on how far price can realistically move before it hits the next barrier. That changes by style and timeframe.
- Scalping: 1:0.8 to 1:1.5. Targets sit close, spreads and slippage matter, stops often need to be tight.
- Day trading: 1:1 to 1:2. Many clean setups cannot reach 1:3 inside the day without running into structure.
- Swing trading: 1:1.5 to 1:4. Wider structure gives you room, but you pay with time and overnight risk.
Use these as ranges, not rules. Your chart decides the ceiling. If the next support or resistance sits 10 pips away and your stop needs 20 pips, you do not have a 1:2 trade. You have a 1:0.5 trade, or no trade.
Balance the ratio with a realistic hit rate
Higher reward sounds better, but it usually drops your win rate. The ratio and the hit rate work as a pair.
| Risk-Reward | Break-even win rate (no costs) | What it means |
|---|---|---|
| 1:1 | 50% | You need to win about half your trades. |
| 1:2 | 33.3% | You can be wrong more often, but you must let winners run. |
| 1:3 | 25% | You must catch larger moves, fewer setups reach the target. |
In real trading, costs push break-even higher. Spread, commissions, and slippage hurt tight stops and small targets the most. A clean 1:1 on paper can behave like 1:0.8 after costs.
If you chase 1:3 on every trade, you will force targets past logical exits. Price will hit the level, stall, and reverse. You will watch a winner turn into a loser.
Market context filters that change what is “good”
- Volatility regime: When ATR expands, you can target more. When ATR contracts, accept smaller R, or skip the trade.
- Session liquidity: London and the London-New York overlap support cleaner follow-through. Thin sessions raise slippage risk and reduce range, which cuts your achievable reward.
- News risk: High-impact releases can blow through stops and targets. If you hold through news, you need wider stops or smaller size, and your planned R becomes less reliable.
Filter before you calculate. If the session and volatility do not support the target, the ratio is not “good,” it is fantasy. For structure checks, use support and resistance first, then set your stop and target.
Personal constraints that affect your best ratio
- Time in trade: Bigger R usually needs more time. If you cannot hold, do not plan swing targets.
- Swap and rollover: Holding overnight can add cost. A 1:2 plan can shrink if swap runs against you for days.
- Psychological comfort: If you cannot hold through pullbacks, you will cut winners early. That lowers your realized R. Plan a ratio you can execute, not one that looks good on a spreadsheet.
Most traders do well aiming for 1:1 to 1:2 on repeatable setups, then taking bigger ratios only when the chart gives clear space. Consistency beats occasional 1:4 wins.
How to use risk-reward ratio to plan trades (a practical workflow)
Pre-trade checklist (a workflow you can repeat)
- Setup quality: Trade only your named setup. If you cannot describe the setup in one sentence, skip it. You need a reason that repeats, not a guess.
- Invalidation point: Mark the price level that proves you wrong. Put your stop beyond that level, not at a random pip count. If you cannot define invalidation, you have no stop logic.
- Target logic: Pick targets from structure, not from a ratio. Use the next swing high or low, a clear supply or demand zone, or a major support or resistance level. Your target must have a reason.
- Ratio threshold: Calculate R before you enter. If your plan needs at least 1:1.5, then a trade that offers 1:1 is a pass. Set your minimum and follow it.
- Risk per trade: Fix your risk in money first, then size the position to match your stop. Keep it consistent. If you need a baseline, use the rules in risk management in forex.
Map entries, stops, and targets with key levels
Start with the chart. Mark structure. Then build the trade.
- Support and resistance: Draw the nearest levels that caused strong moves. Your entry should sit near a level. Your stop should sit beyond the level that would break the idea.
- Swing points: Use the last clear swing high or low to define invalidation. If a long trade breaks the last swing low, the market invalidates your idea.
- Trendlines and channels: Use them as context, not as your only reason. Place targets at the next touch point only if it matches a horizontal level or a prior swing.
- Entry placement: If you enter late, your stop often stays the same but your reward shrinks. That kills the ratio. Either wait for a better entry or skip the trade.
| Step | Action | Output |
|---|---|---|
| 1 | Mark invalidation level on structure | Stop location |
| 2 | Choose entry that keeps stop logical | Entry price |
| 3 | Mark first and second target using swings and S/R | TP1 and TP2 levels |
| 4 | Compute R: (target minus entry) divided by (entry minus stop) | Planned R |
| 5 | Take the trade only if planned R meets your threshold | Yes or no |
Simple example: You plan a long at 1.1000. Structure invalidation sits at 1.0970, so risk is 30 pips. The next resistance sits at 1.1045, so reward is 45 pips. Your planned risk-reward is 30:45, or 1:1.5. If your minimum is 1:1.5, the trade qualifies.
Use multiple take-profits to improve what you actually bank
Your spreadsheet R and your realized R often differ. Scaling out can reduce that gap.
- TP1 at a realistic obstacle: Place TP1 before the first major barrier, often the nearest swing or S/R. This is where price often stalls.
- TP2 at the main target: Place TP2 at the next level where you expect a full move to end.
- Move stop only with logic: After TP1, move the stop to break-even only if price cleared structure, not just because you feel better.
Simple example with two exits: Risk is 30 pips. You take 50% off at +30 pips, which is 1R. You leave 50% for +60 pips, which is 2R. If both targets hit, your realized result equals (0.5 x 1R) plus (0.5 x 2R) equals 1.5R. If only TP1 hits and the rest stops at break-even, you still book 0.5R instead of 0R.
Trailing stops, when they help and when they hurt
A trailing stop can improve results when the market trends cleanly. It can destroy expectancy when price pulls back often.
- Trail only after the trade proves itself: Wait until price breaks and holds beyond a key level. Trailing too early converts normal pullbacks into stop-outs.
- Use structure-based trailing: Trail below higher lows in an uptrend, or above lower highs in a downtrend. Avoid tight, fixed pip trails in volatile pairs.
- Good use case: Strong trend, wide swings, clear higher highs and higher lows. You can trail behind the last swing and keep the trade alive.
- Bad use case: Range, choppy session, news-heavy periods, or mean-reverting pairs. A trail gets hit before the move reaches your target.
- Rule to test: If your trailing stop cuts your average win more than it reduces your average loss, it lowers expectancy. Track it over at least 30 trades per setup.
Position sizing: the missing link competitors often under-explain
Position sizing: the missing link competitors often under-explain
Your risk-reward ratio is a plan. Position sizing turns that plan into controlled dollars.
Two traders can take the same 1:2 setup. One risks 0.5% per trade. The other risks 5%. The ratio matches, the outcomes do not. The second trader can blow up in a short losing streak.
Choose your risk per trade, then size the position
Pick a fixed percent of your account you will risk on each trade. Start small. Many traders use 0.25% to 1% per trade for spot FX.
- Lower risk per trade gives you more attempts. It reduces drawdown swings. It keeps your strategy testable.
- Higher risk per trade magnifies both skill and mistakes. It increases the chance you stop trading after a normal losing run.
Risk per trade matters more than the ratio alone because it controls your loss distribution. Your ratio can look great on paper while your sizing wipes out months of gains.
Lot size calculation using stop-loss pips and pip value
You size from your stop loss, not from your target. Your stop defines the dollars at risk.
Quick formula:
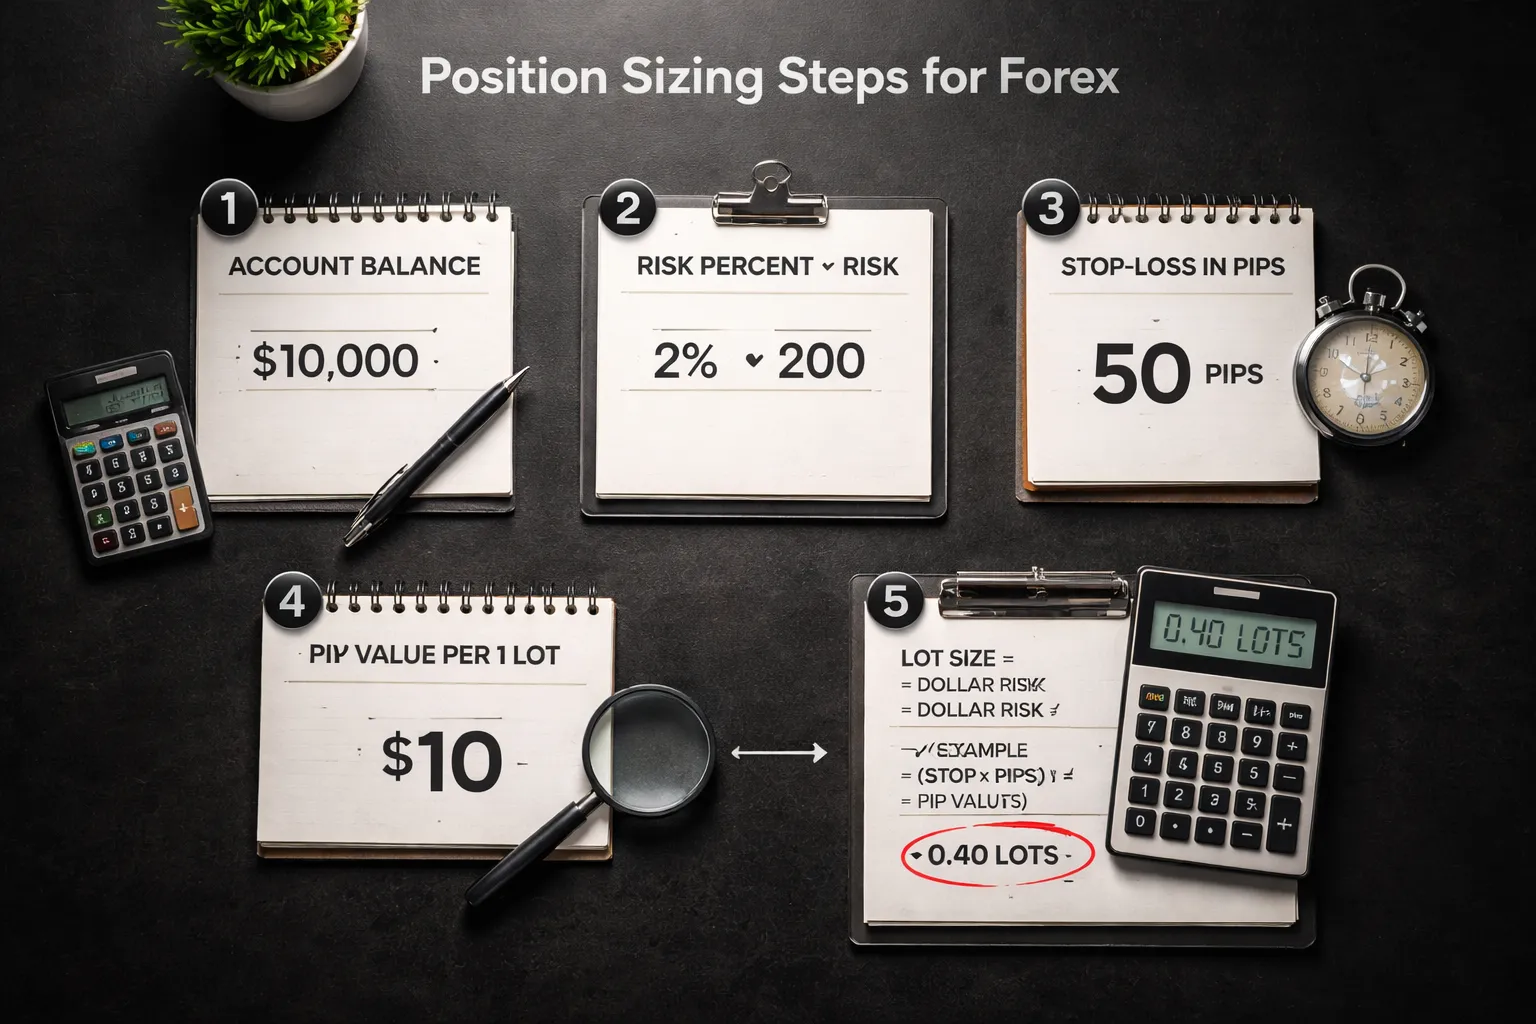
Position size (lots) = Risk amount / (Stop-loss pips x Pip value per 1 lot)
Example:
- Account: $10,000
- Risk per trade: 1% = $100
- Stop loss: 25 pips
- Pip value per 1.00 lot: $10 per pip (typical for many USD-quoted majors)
Lots = 100 / (25 x 10) = 0.40 lots
If your stop needs to be wider, your lot size must drop. If you tighten the stop, your lot size rises. Do not change the lot size first. Change the stop for market structure, then size to match.
If you set stops from structure, a simple way is to anchor your stop beyond a swing high or low. Trendline breaks and retests also give clean stop locations, see how to draw trendlines.
Fixed fractional vs fixed lot sizing
- Fixed fractional means you risk a fixed percent each trade. Your lot size changes with your stop size and your account balance. Pros: consistent risk, smoother equity curve behavior, less ruin risk. Cons: growth feels slower, calculations required.
- Fixed lot means you trade the same lot size each time. Pros: simple. Cons: your risk percent changes every trade, your risk rises after losses if you keep the same lot, wide stops can quietly turn into oversized risk.
If you want clean performance stats, use fixed fractional. It keeps your R multiple meaningful, trade to trade.
Leverage changes margin, not the risk-reward ratio
Leverage does not change your planned risk-reward ratio. Your entry, stop, and target set that ratio.
Leverage changes how much margin your broker locks to hold the position. High leverage can let you open a position that is too large for your risk rules. That is the danger.
- Margin requirement controls whether you can open the trade.
- Stop loss distance and position size control how much you can lose.
Keep your sizing tied to risk percent and stop pips. Treat leverage as a funding constraint, not a permission slip.
Tools and indicators to measure risk-reward (without relying on them blindly)
Using the platform’s risk/reward tool
Use your platform’s long and short position tools to measure distance and ratio before you place the order. MT4 and MT5 show this through objects and scripts, TradingView includes Long Position and Short Position tools.
- Set entry first. Click your planned entry price. Do not “eyeball” it.
- Place stop at the invalidation level. Put it where your idea breaks, not where loss feels smaller.
- Place target at your exit level. Use the next level, swing, or structure, not a random multiple.
- Read the numbers. Note stop distance in pips, target distance in pips, and the displayed R:R.
- Check position size separately. The drawing tool does not control lot size. Your risk percent and stop pips do.
Keep the tool as a ruler. Your plan sets the levels. If you need help placing stops at logical levels, see how to place a stop loss.
Spreads and commissions, your “true” risk and reward
The chart shows clean prices. Your account pays spread and commission. Adjust for both or your R:R looks better than it is.
- Spread increases your risk. On a buy, you enter on ask and stops trigger on bid. A wider spread pushes your effective stop closer.
- Spread reduces your reward. Your take profit fills at the other side of the spread.
- Commission reduces net reward. It also increases net loss when stopped.
| Item | Effect on a long trade | What to do |
|---|---|---|
| Spread | You start negative by the spread, stops and targets fill on bid | Add spread cost to loss, subtract spread cost from profit |
| Commission | Deducted on entry and exit, depends on broker | Convert commission to pips or account currency and include it in R |
Practical rule. If your stop is 20 pips and the average spread is 2 pips, treat it like 22 pips risk. If your target is 40 pips, treat it like 38 pips reward. Then compute R:R from those adjusted numbers.
Slippage and stop execution during high-impact news
During major news, price can gap or jump. Your stop becomes a market order. You can get filled worse than your stop price.
- Assume worse fills around news. Build a slippage buffer into your risk.
- Widening spreads change your math. A “normal” 1 pip spread can print 5 to 15 pips for seconds.
- Stops may not protect the exact amount. They limit damage, they do not guarantee price.
- Reduce size or stay flat. If you must trade news, cut position size so a slipped stop still fits your max loss.
Simple stress test. Add a slippage allowance, for example 1R extra loss is too much, so cap it. If your max loss is 1 percent and your plan risks 1 percent with no buffer, you have no room for slippage.
Trade journaling metrics, realized R-multiple and average R
Planned R:R matters less than realized R. Track both. R is your initial risk per trade, based on entry to stop.
- Define 1R. If you risk $100 from entry to stop, then 1R equals $100.
- Record realized R. If you make $150, that trade equals +1.5R. If you lose $80, it equals -0.8R.
- Track average R. Average your realized R across 20 to 50 trades. This shows if your strategy pays after costs.
- Log planned vs realized. If planned 2R often becomes 0.5R, your exits need work.
- Include costs. Use net P and L after spread and commission, then convert to R.
| Metric | Formula | Why it matters |
|---|---|---|
| Initial R (per trade) | Entry to stop loss value in $ | Creates a consistent unit across pairs and setups |
| Realized R | Net P&L / Initial R | Shows what you actually earned or lost versus the planned risk |
| Average R | Sum of realized R / number of trades | Shows strategy edge after execution and costs |
Use tools and indicators to measure. Do not outsource decisions to them. Your edge comes from level selection, execution, and consistent sizing.
Common mistakes when using risk-reward ratio in forex
Setting take-profit from a target ratio, not market structure
You cannot force the market to pay you 2R or 3R.
If you place take-profit just to hit a ratio, you often park it in the middle of traffic, inside prior support and resistance, or before the next liquidity zone. Price stalls. You exit early. Or you watch it reverse and tag your stop.
- Fix: Set your stop based on invalidation, then map targets from structure first. After that, check the ratio.
- Rule: If structure only offers 1.2R, accept it or skip the trade. Do not invent a target.
Placing stops too tight to “force” a better ratio
A tight stop can make any trade look like 4R. It also increases stop-out rate.
Most pairs need room for spread, normal pullbacks, and session volatility. If your stop sits inside noise, your win rate drops. Your realized R turns negative even if your “planned” ratio looked great.
- Fix: Place the stop where the setup fails, not where the ratio looks nice.
- Check: Compare average stop distance to recent swing size and spread. If spread is a meaningful percent of your stop, your stop is too tight.
Moving the stop-loss away and breaking the original R plan
You planned 1R risk. Then price moves against you. You widen the stop to avoid a loss.
You just changed the trade after entry. Your position size now risks more than planned. Your stats become useless because initial R no longer matches actual risk.
- Fix: Decide the invalidation level before entry. If price hits it, exit. Log it as a full 1R loss.
- Rule: You can tighten a stop based on new structure. Do not widen it.
- Process: Track realized R. If you see frequent losses worse than -1R, stop and correct execution.
Ignoring correlation and stacking risk across similar pairs
EURUSD, GBPUSD, and AUDUSD can move together when USD drives the session. So can EURJPY and GBPJPY when JPY moves.
If you take three “separate” 1R trades that all depend on USD weakness, you often hold one oversized bet. Your day can swing on one headline.
- Fix: Cap total exposure across correlated pairs. Treat them as one idea.
- Simple rule: If trades share the same driver, cut size or cut count. Keep combined risk within your daily limit.
- Log: Record pair groups and outcomes. You will see clustered losses on the same theme.
Overtrading because the ratio looks attractive
A clean 3R on paper does not mean you have edge.
Marginal setups often show big ratios because the stop sits unrealistically tight or the target assumes a perfect trend day. You then take more trades, pay more spread, and reduce focus. Your average R drops.
- Fix: Require a setup score, not a ratio alone. Example, structure level, trend context, and trigger quality must all meet your minimum.
- Limit: Set a max trades per session and a daily loss limit. This supports discipline and execution. See risk management rules that keep you in the game.
- Metric: Review realized R by setup type. If “high R” trades have low realized R, you are forcing them.
Pros, cons, and limitations of risk-reward ratio
Benefits
- Clearer planning. You define entry, stop, and target before you click buy or sell. This reduces random exits.
- Consistent risk. If you keep risk per trade fixed, your position size becomes a simple calculation. Your losing streaks stay survivable.
- Better performance analysis. You can review results in R multiples, not pips or dollars. This makes different pairs and timeframes comparable.
Cons and limitations
- A ratio does not include probability. A clean 1:3 can still be a bad trade if it rarely reaches target. A messy 1:1 can be profitable if it wins often.
- It can push you to force targets. You may stretch the take-profit to “make the math work.” Realized R drops because price never reaches the level.
- It ignores path and execution. Spread, slippage, and news spikes can hit your stop even when the idea is right. The ratio on paper stays the same, your outcome changes.
- It can hide poor trade quality. Traders take low quality setups because the ratio looks good. Your setup score must filter these trades out.
Edge cases: when a “good” ratio looks bad
- Mean reversion. Many range and fade systems win often but aim for small targets. They may live around 0.7R to 1.2R. They can still work if the win rate and costs support it. A range approach usually relies on clear support and resistance, see range trading strategy.
- Scalping with small targets. Fast trades can have tight stops and tight targets. Costs matter more. A broker with wider spreads can turn a 1:1 plan into a negative expectancy system.
How to combine ratio with probability
Use the ratio as a planning tool, then validate it with data.
- Grade the setup. Score structure, trend context, and trigger quality. Trade only when the score clears your minimum. Do not approve a trade based on ratio alone.
- Backtest by setup type. Track win rate, average win in R, average loss in R, and realized R. Segment by session, pair, and market condition.
- Set ratio bands, not a single rule. Example, trend setups must show 1.5R to 3R potential. Mean reversion setups must show 0.8R to 1.5R with a higher win rate.
- Audit “high R” ideas. If planned 3R trades deliver 0.8R on average, you are likely forcing targets or exiting early. Adjust targets, entries, or remove that setup.
- Measure expectancy. Use your data, not guesses.
| Metric | What you track | What it tells you |
|---|---|---|
| Planned R | (Target minus entry) divided by (Entry minus stop) | Trade plan quality on paper |
| Win rate | Wins divided by total trades | Probability by setup type |
| Realized R | Actual profit or loss divided by initial risk | Execution quality and target realism |
| Expectancy | (Win rate x avg win in R) minus (Loss rate x avg loss in R) | Whether the setup has an edge |
FAQ
What is the risk-reward ratio in forex?
It compares what you risk to what you can make. Risk equals entry minus stop. Reward equals target minus entry. A 1:2 ratio means you risk 1 unit to aim for 2 units.
How do you calculate risk-reward ratio?
Use this formula. (Target minus entry) divided by (Entry minus stop). Example. Entry 1.2000, stop 1.1980, target 1.2040. Reward 40 pips, risk 20 pips. Ratio 2.0.
What is a good risk-reward ratio?
It depends on your win rate and average win and loss in R. Many traders aim for 1:2 or better, then validate it with expectancy. A high ratio means nothing if your win rate collapses.
Can you be profitable with a 1:1 risk-reward ratio?
Yes. You need a win rate above 50 percent after costs. With spread and slippage, you often need higher than 50 percent. Track realized R to confirm results in live execution.
Why does my 1:3 setup still lose money?
Your win rate may be too low. Your target may be unrealistic, so price hits stop more often. Your fills may be worse than planned. Check realized R and expectancy by setup type, not by single trades.
Should you set targets based on risk-reward alone?
No. Set stops and targets where your setup breaks or resolves. Then measure the ratio. Use structure first, then math. Learn how to place a stop with this stop loss guide.
How does spread affect risk-reward?
Spread raises your break-even point. It cuts your net reward and can increase effective risk if your stop sits too tight. Include average spread and typical slippage in backtests and in your live trade logs.
What is R and realized R?
R equals your initial risk per trade. If you risk 20 pips, 1R equals 20 pips. Realized R equals actual outcome divided by initial risk. It shows execution quality and whether targets fit real volatility.
How do you use risk-reward with expectancy?
Expectancy equals (win rate x average win in R) minus (loss rate x average loss in R). Use at least 50 to 100 trades per setup. Positive expectancy means you have an edge you can scale.
Conclusion
Conclusion
Risk-reward is a filter. It tells you if a trade can pay you enough for the risk you take.
Pick your stop first. That stop defines 1R. Then set a target that matches your setup and current volatility. Do not force 3R on a pair that only gives 1R moves.
Track results in R, not pips or dollars. Record your planned R and your realized R. After 50 to 100 trades, calculate expectancy and keep only the setups that stay positive.
- Before the trade: define entry, stop, and target. Confirm the risk-reward ratio fits the chart.
- During the trade: avoid moving the stop wider. If you must adjust, reduce risk, not increase it.
- After the trade: log outcome in R and update your win rate and average R.
Final tip. Use a bracket order so your stop and target go in at the same time. Learn the basics in forex order types.
-
How to Start Forex Trading Step by Step (Beginner Roadmap)
1 month ago -
Forex Order Types Explained: Market vs Limit vs Stop Orders
1 month ago -
Stop Loss vs Take Profit: Differences, Examples & Best Practices
1 month ago -
How to Set Stop Loss and Take Profit (Step-by-Step)
1 month ago -
How to Place a Stop Loss in Forex (Beginner-Friendly Guide)
1 month ago
-
-
- Step 1: Choose an entry based on your setup, not on the ratio
- Step 2: Place the stop-loss at a price level that invalidates the trade idea
- Step 3: Set a take-profit using structure or measured moves
- Step 4: Convert price distance into pips (including JPY pairs and 5-digit pricing)
- Step 5: Compute the ratio and sanity-check it against market structure
-
- What is the risk-reward ratio in forex?
- How do you calculate risk-reward ratio?
- What is a good risk-reward ratio?
- Can you be profitable with a 1:1 risk-reward ratio?
- Why does my 1:3 setup still lose money?
- Should you set targets based on risk-reward alone?
- How does spread affect risk-reward?
- What is R and realized R?
- How do you use risk-reward with expectancy?
-
-
- Step 1: Choose an entry based on your setup, not on the ratio
- Step 2: Place the stop-loss at a price level that invalidates the trade idea
- Step 3: Set a take-profit using structure or measured moves
- Step 4: Convert price distance into pips (including JPY pairs and 5-digit pricing)
- Step 5: Compute the ratio and sanity-check it against market structure
-
- What is the risk-reward ratio in forex?
- How do you calculate risk-reward ratio?
- What is a good risk-reward ratio?
- Can you be profitable with a 1:1 risk-reward ratio?
- Why does my 1:3 setup still lose money?
- Should you set targets based on risk-reward alone?
- How does spread affect risk-reward?
- What is R and realized R?
- How do you use risk-reward with expectancy?
-
Forex Lot Size Calculator: How to Use It to Size Trades Correctly
1 month ago -
How to Calculate Position Size in Forex (Position Sizing Formula + Examples)
1 month ago -
Forex Leverage Explained: How It Works, Pros, Cons & Examples
1 month ago -
Margin vs Leverage in Forex: What’s the Difference?
1 month ago -
What Is Forex Trading? A Beginner’s Guide to How It Works
1 month ago
-
Forex Trading Platforms Comparison: MetaTrader vs cTrader vs TradingView
1 month ago -
Forex Market Hours & Trading Sessions Explained (Best Times to Trade)
1 month ago -
Forex Leverage Explained: How It Works, Pros, Cons & Examples
1 month ago -
Is Forex Trading Legal in the United States? Rules, Regulators & What to Know
1 month ago -
What Is a Lot Size in Forex? Lot Types + Quick Examples
1 month ago