What Is Risk-Reward Ratio in Trading? (And Why It Matters)

Risk-reward ratio tells you how much you stand to make on a trade compared to how much you can lose. You calculate it by dividing your potential profit by your planned loss, based on your entry, stop loss, and take profit. It gives you a clear filter for trade selection and position planning.
In this guide, you will learn how to calculate risk-reward ratio in seconds, how to set realistic targets, and how to use it with win rate to spot setups that can work over time. You will also learn common benchmarks like 1:2 and 1:3, when they fail, and the mistakes that make a “good” ratio useless.
If you need help defining risk on each trade first, use this step-by-step stop loss and take profit guide.
Key Takeaways
- In het kort: Risk-reward ratio compares what you can lose to what you can make on one trade.
- You calculate it fast. Risk equals entry to stop loss. Reward equals entry to target. Ratio equals reward divided by risk.
- A “good” ratio depends on your win rate. Low win rate needs higher reward per winner. High win rate can work with lower reward per winner.
- Use simple benchmarks with context. 1:2 and 1:3 can work, but they fail if your stop sits in noise or your target ignores market structure.
- Set stops first, targets second. If you flip it, you force trades and break your plan.
- Risk-reward ratio does not predict outcomes. It only tells you if the trade makes sense if your edge shows up.
- Keep risk per trade fixed. That keeps one loss from damaging your account, even with a strong ratio.
- Track real results. Log your average R per trade, win rate, and expectancy. Drop setups that look good on paper but lose in live data.
- For a clean process, follow this step-by-step guide to placing your first forex trade.
What Is Risk-Reward Ratio in Trading?
Plain-English definition
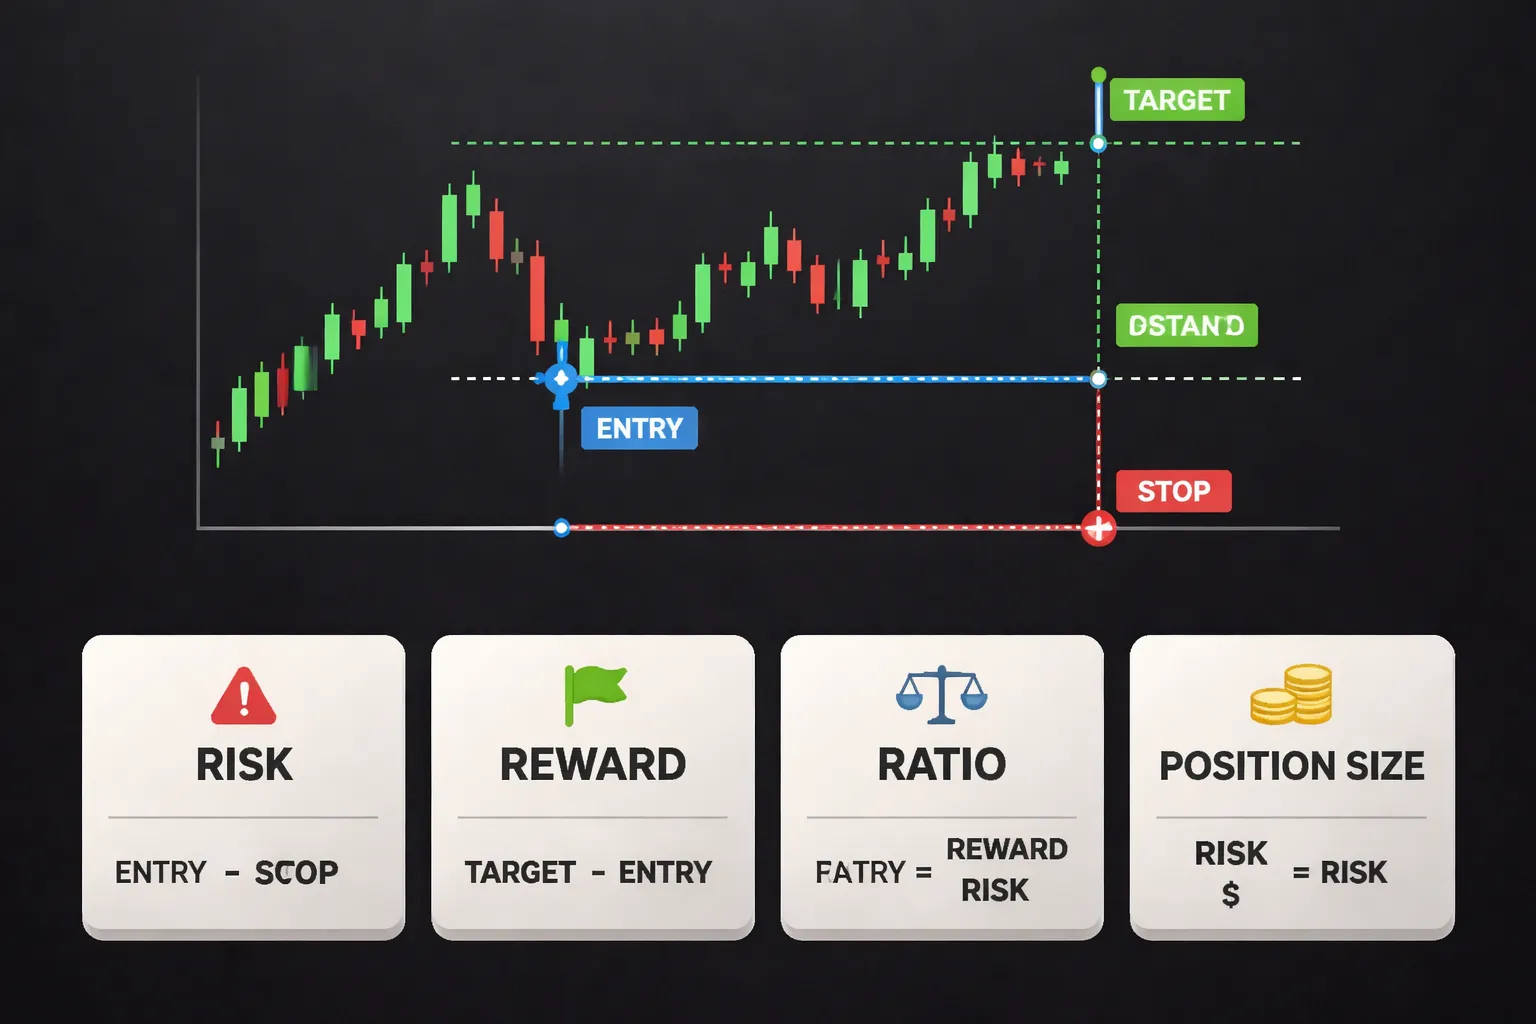
The risk-reward ratio compares what you can lose to what you aim to make on one trade.
Risk equals the distance from your entry to your stop-loss, multiplied by your position size.
Reward equals the distance from your entry to your take-profit, multiplied by your position size.
You set it before you enter. It is a trade filter, not a result.
Example. You risk $100 to try to make $200. Your ratio is 1:2. If you risk $200 to try to make $100. Your ratio is 2:1.
How it differs from risk appetite, volatility, and risk of ruin
- Risk-reward ratio is trade-level. It describes one setup and one plan, stop and target.
- Risk appetite is personal. It is how much pain you accept, often set as a percent of your account per trade or per day.
- Volatility is market movement. It changes how wide your stop and target need to be. It does not tell you if the trade has an edge.
- Risk of ruin is account-level. It depends on your win rate, payoff, and how much you risk per trade. A good ratio does not protect you if you oversize.
Common ways traders express it
- 1:1 means you aim to make the same amount you risk.
- 1:2 means you aim to make twice what you risk.
- 2:1 means you risk twice what you aim to make. This needs a higher win rate to work.
- R-multiples use your risk as the unit. If you risk $100, then 1R equals $100.
- 2R means you made two times your risk. -1R means a full stop-loss loss.
- 3R means you made three times your risk. Traders track average R to judge a strategy.
If you want examples with entries, stops, and targets, see risk-reward ratio in forex.
Why Risk-Reward Ratio Matters (Beyond the Basics)
How It Shapes Decision-Making Before Entry
Risk-reward forces you to plan the trade before you click buy or sell.
You define three numbers in advance. Entry, stop, target.
This removes hope from the process. You stop adjusting the plan after price moves against you.
It also stops small mistakes that become big losses. If your stop sits too close, your position size gets too large. If your target sits too close, you accept a low payoff for the same risk.
When you set risk and reward first, you can skip trades that do not meet your minimum. Many traders use 1:2 or better as a baseline, then adjust based on the setup.
The Link to Consistency: Repeatable Process and Trade Filtering
Consistency comes from rules you can repeat. Risk-reward is one of the simplest rules to enforce.
It turns trade selection into a filter. If a setup cannot reach your target before it hits your stop, you pass.
This matters because your results come from expectancy, not from a few lucky trades.
Use R-multiples to keep this clean. If your average win is +2R and your average loss is -1R, you can estimate what win rate you need to stay profitable.
- At 1:1, you need over 50% wins to grow.
- At 1:2, you can grow with over 33.3% wins.
- At 1:3, you can grow with over 25% wins.
This is why risk-reward supports strategy discipline. It gives you a clear bar for trade quality before you enter.
If you use a signal tool like the RSI indicator, risk-reward keeps you from taking every signal. You take the signals that also offer enough room to pay you.
How It Supports Capital Preservation During Drawdowns
Drawdowns happen. Your job is to survive them.
Risk-reward helps in two ways. It limits how much you lose when you are wrong, and it lets winners cover multiple losses when you are right.
- If you risk 1R per trade, a losing streak of 5 trades costs 5R.
- If your winners average +2R, three wins can cover six losses.
This reduces the pressure to win often. You can stay calm and follow your plan while your edge plays out.
Risk-reward also protects you from revenge trades. When you know the next trade has a defined downside, you stop trying to win back losses with larger and larger risk.
Why It’s Essential for Comparing Setups Across Markets and Timeframes
Markets move at different speeds. Timeframes show different noise. Dollar targets do not transfer well.
R-multiples do. A +2R trade means the same thing on EUR/USD, gold, or an index. It also means the same thing on the 5-minute chart or the daily chart.
This makes analysis cleaner. You can compare setups by:
- Average R per trade.
- Win rate at a given minimum R.
- Distribution of outcomes, how often you hit +2R, +3R, or take -1R.
When you measure performance in R, you stop mixing results with position size, volatility, or instrument price. You see which setup actually pays and which one just feels good.
Risk-Reward Ratio Formula and Key Terms
Risk-Reward Ratio Formula and Key Terms
Your risk-reward ratio compares what you can lose to what you can make on one trade.
Risk-Reward Ratio (RRR) formula:
RRR = Risk / Reward
- Entry, your planned fill price.
- Stop-loss, your exit price if you are wrong.
- Target, your planned exit price if you are right.
- Risk per unit, the distance from entry to stop.
- Reward per unit, the distance from entry to target.
Long trade: Risk per unit = Entry - Stop. Reward per unit = Target - Entry.
Short trade: Risk per unit = Stop - Entry. Reward per unit = Entry - Target.
Most traders also quote it as reward-to-risk.
Reward-to-risk = Reward / Risk. A 2.0 value means you aim to make 2 units for every 1 unit you risk.
Understanding R-Multiples
R means one unit of your planned risk.
1R equals the distance from your entry to your stop, measured in dollars, points, pips, or ticks.
- -1R, you hit your stop.
- +1R, you made the same amount you risked.
- +2R, you made twice what you risked.
R-multiples keep your stats clean. You can compare trades across different instruments and volatility regimes without rewriting your math.
If you use a technical stop, like a swing low or a structure break, R also forces honesty. Wider stop means bigger risk per unit, unless you cut size.
Risk per Share or Contract vs. Total Trade Risk
Risk per share or contract tells you the damage per unit if the stop hits.
Total trade risk tells you the damage for the whole position.
Total trade risk formula:
Total Risk = Risk per Unit x Position Size
- Risk per unit answers, how far is your stop.
- Total risk answers, how much money you lose if you are wrong.
Example: Entry 50.00, stop 49.50. Risk per share is 0.50. If you buy 200 shares, total risk is $100.
Keep the ratio and the risk separate. A trade can have a great 3:1 reward-to-risk and still be a bad idea if total risk is too large for your account.
Set your account-level risk first, then let it determine size. If you need help with tight stops and position sizing for fast charts, see our scalping Forex strategy.
How to Calculate Risk-Reward Ratio Step by Step
Step 1: Choose an invalidation level for your stop
Your stop defines your risk. Place it where your setup fails, not where you feel comfortable.
- Technical stop: Below a swing low for longs, above a swing high for shorts. Outside a range boundary. Past a trend line or key moving average if you trade that system.
- Thesis-based stop: The level that proves your reason for entry is wrong. Example, a breakout trade fails if price closes back inside the range.
- Rule: If price can hit your stop during normal noise, your stop is not an invalidation point. Tighten the entry, not the logic.
Step 2: Define a realistic target using structure
Your target needs a reason. Use what the chart already shows.
- Prior levels: Previous highs and lows, supply and demand zones, daily pivots.
- Trends: Measure the last impulse and project to the next resistance or support. Use channels and trend lines to map likely reaction areas.
- Ranges: Target the other side of the range, or a partial target before it if the level is strong.
- Volatility check: Compare target distance to recent ATR or average swing size. If your target needs an outsized move, adjust.
If you need help mapping clean levels, see our trend lines and channels guide.
Step 3: Compute risk and reward, then convert to a ratio
Start with three numbers: entry, stop, target.
- Risk (points, pips, %) = entry minus stop for longs. Stop minus entry for shorts.
- Reward (points, pips, %) = target minus entry for longs. Entry minus target for shorts.
- Risk-reward ratio = reward divided by risk.
| Input | Example |
|---|---|
| Entry | 50.00 |
| Stop | 49.50 |
| Target | 51.50 |
| Risk per share | 0.50 |
| Reward per share | 1.50 |
| Ratio | 1.50 / 0.50 = 3.0, or 3:1 |
Keep units consistent. If you measure risk in pips, measure reward in pips. If you measure in percent, measure in percent.
Step 4: Translate the plan into position size based on account risk
Set how much money you can lose on the trade. Then size the position to fit the stop.
- Account risk per trade ($): Example, $100.
- Risk per unit ($): For shares, entry minus stop. For forex, stop distance in pips times pip value. For crypto CFDs, use the contract value rules from your broker.
- Position size = account risk divided by risk per unit.
Example with shares: risk per share is $0.50. Account risk is $100. Position size is 100 / 0.50 = 200 shares.
Do not increase size to “make the ratio worth it.” Size comes from risk, not from hope.
Step 5: Validate with fees, spread, slippage, and liquidity
Friction changes your real risk and your real reward. Check it before you place the order.
- Spread: Wide spreads raise entry cost and can tag stops faster. Add spread cost into your risk estimate, especially on lower time frames.
- Commissions and fees: Subtract them from expected reward and add them to expected loss.
- Slippage: Assume worse fills on stops and fast moves. Increase your effective stop distance if the market moves sharply on your instrument.
- Liquidity: Thin books cause gaps and poor fills. Reduce size or skip the trade if your order will move price.
- Re-check ratio: If friction drops a 2:1 plan to 1.6:1, treat it as a different trade.
Worked Examples (Stocks, Forex, Crypto, Options)
Stock example: clean levels, simple math
You buy 100 shares of a stock at $50.00.
- Stop: $48.50. Risk is $1.50 per share.
- Target: $54.50. Reward is $4.50 per share.
Your risk-reward ratio is 4.50 to 1.50, or 3:1.
Dollar view helps you stay honest.
- Risk: $1.50 x 100 = $150.
- Reward: $4.50 x 100 = $450.
Forex example: pips, spread, and the hidden haircut
You go long EURUSD at 1.1000. You trade 1 standard lot. One pip is about $10.
- Stop: 1.0970. Risk is 30 pips.
- Target: 1.1060. Reward is 60 pips.
Raw plan is 60 to 30, or 2:1.
Now add spread. Assume a 1.5 pip spread.
- Effective risk: 30 + 1.5 = 31.5 pips.
- Effective reward: 60 - 1.5 = 58.5 pips.
Adjusted ratio is 58.5 to 31.5, or 1.86:1.
If you scalp tight stops, spread can break the trade.
For stop placement basics, use this beginner-friendly stop loss guide.
Crypto example: volatility, wick risk, and stop placement
You buy BTC at $40,000 on a breakout.
- Stop: $39,200. Risk is $800.
- Target: $42,400. Reward is $2,400.
On paper, ratio is 2,400 to 800, or 3:1.
Now handle wick risk. Crypto often spikes through obvious levels.
- If you place the stop at a clean round level, you invite stop hunts.
- If you widen the stop to survive wicks, your ratio drops unless you move the target.
Example: you move the stop to $38,800 to clear recent wicks.
- New risk: $1,200.
- Same target reward: $2,400.
New ratio is 2,400 to 1,200, or 2:1.
You did not change your idea. You changed the trade.
Options example: define risk with premium or a stop rule
You buy a call option for $2.50. One contract controls 100 shares.
- Max risk (premium): $2.50 x 100 = $250.
- Profit target: sell at $5.00. Reward is ($5.00 - $2.50) x 100 = $250.
That is 1:1.
If you use a stop rule, your risk changes.
- Stop rule: exit if option drops 40% to $1.50.
- Risk: ($2.50 - $1.50) x 100 = $100.
- Same target: $250 reward.
Now your ratio is 250 to 100, or 2.5:1.
But stops on options face wide spreads and fast decay. Size smaller if fills look poor.
Same ratio, different probabilities
A ratio does not tell you how often you will win. Two trades can share the same ratio and produce different outcomes.
| Trade | Risk | Reward | Ratio | Win rate | Expected value per trade |
|---|---|---|---|---|---|
| A | 1R | 2R | 2:1 | 40% | (0.40 x 2R) - (0.60 x 1R) = 0.20R |
| B | 1R | 2R | 2:1 | 30% | (0.30 x 2R) - (0.70 x 1R) = -0.10R |
Same ratio. Different edge. You need both, a workable ratio and a win rate that supports it.
What’s a Good Risk-Reward Ratio? (It Depends on Win Rate)
Break-even math, the win rate you need
A good risk-reward ratio is the one that gives you positive expected value with your real win rate.
Use this expected value formula in R multiples.
EV = (Win% x Reward in R) - (Loss% x Risk in R)
If you set risk to 1R, the break-even win rate becomes simple.
Break-even win rate = 1 / (1 + Reward-to-Risk)
| Risk:Reward | Reward-to-Risk | Break-even win rate |
|---|---|---|
| 1:1 | 1.0 | 50.0% |
| 1:2 | 2.0 | 33.3% |
| 1:3 | 3.0 | 25.0% |
This is why ratio alone fails. A 1:3 plan looks great, but it collapses if you only win 20% with that setup.
Two common strategy profiles
- Low win-rate, trend or breakout trading: You may win 25% to 45%. You need larger winners to cover strings of losses. Ratios like 1:2 to 1:4 often fit better, but only if your exits let winners run.
- High win-rate, mean reversion or range trading: You may win 55% to 75%. You can run smaller ratios like 1:1 or even less, but your losses must stay tight. One oversized loss can erase many small wins.
Benchmarks (1:1, 1:2, 1:3) and how they mislead
- 1:1: Simple. You need to win more than 50% after costs. Spreads and slippage push the true break-even higher.
- 1:2: Popular because 33% looks easy. Many traders still lose because they cut winners early and take full losses.
- 1:3: Looks “professional” on paper. In practice, many setups never reach 3R often enough. Your win rate drops, your EV drops.
Benchmarks help you screen trades. They do not prove you have an edge.
Find your effective ratio with backtesting and journaling
- Pick one setup. Define one stop method. Define one exit method.
- Backtest at least 50 to 200 trades. Track results in R, not pips or dollars.
- Record the distribution of wins. Note how often price reaches 1R, 2R, 3R before reversing.
- Compare exit rules. Fixed targets vs. partials vs. trailing stop. Keep the rule that improves EV, not the one that looks best on a few trades.
- Journal live trades. Log planned R:R, realized R, and whether you followed the plan.
Your “good” ratio is the ratio you can execute and repeat. Pair it with a win rate you have already measured. If you need help tightening exits and targets, use a clear take-profit process and keep it consistent. See how to set take profit in forex.
How to Improve Your Risk-Reward Ratio Without Taking More Risk
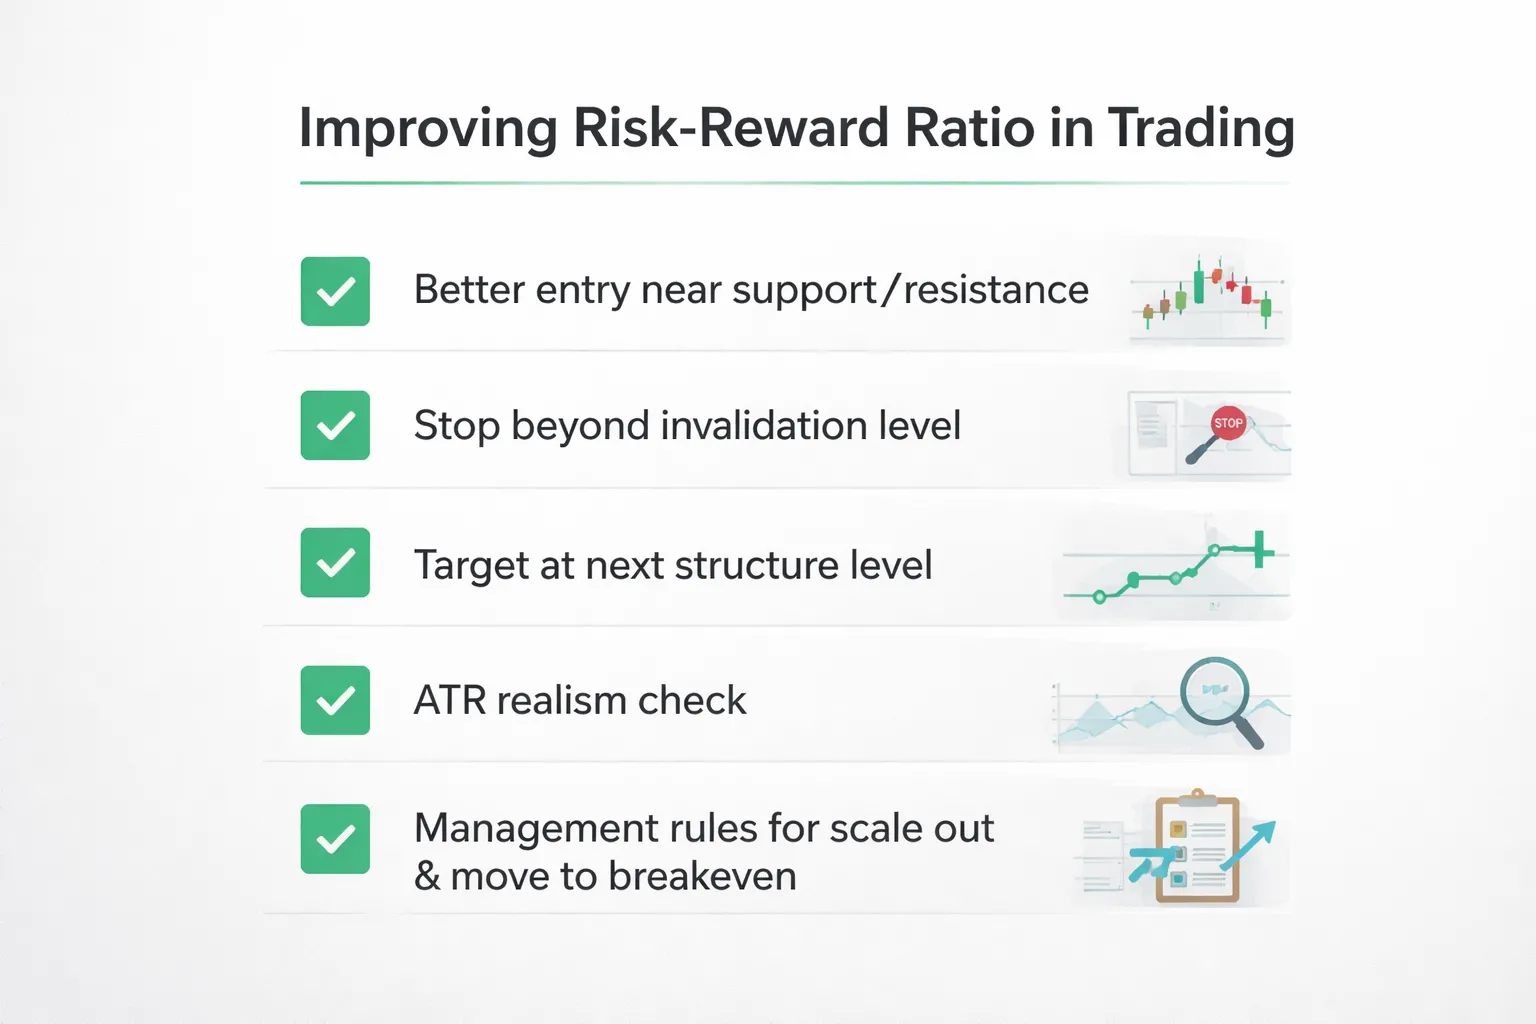
Tighten Invalidation With Better Trade Location
You improve risk-reward by shrinking the stop distance, not by stretching the target.
- Enter closer to the level that proves you right. If your setup depends on support holding, your invalidation sits below that support, not in the middle of noise.
- Use the smallest stop that still matches the idea. Your stop must sit beyond the structure that defines the trade. If price can hit your stop and your setup still remains valid, your stop is wrong.
- Filter entries that force a wide stop. If the entry sits far from the level, you pay for it in stop size. Skip the trade or wait for a pullback.
- Match the level to the timeframe. A level from a higher timeframe usually needs more room. Do not try to force a tight stop under a weekly swing.
Set Smarter Targets Using Market Structure
A good target has a reason. It sits where price often reacts.
- Target the next opposing level. In an up move, that is the next resistance, prior swing high, or supply zone. In a down move, the next support, prior swing low, or demand zone.
- Use measured moves when structure supports it. If a range breaks, project the range height. If a flag breaks, project the prior impulse leg. Only use projections that match clean swings.
- Use ATR to keep targets realistic. If your target requires 2 to 3 times the recent daily ATR inside one session, your reward is not realistic for that trade window.
- Check room to target before you enter. If the next level sits too close, you do not have a trade. You have a hope.
Scaling Out and Moving Stops, When It Helps vs. When It Hurts
Trade management can raise or crush expectancy. Measure it.
- Scaling out helps when you face a known reaction zone and you want to reduce variance. Example, take partial profit at the next level, hold the rest for the next swing.
- Scaling out hurts when you cut winners before they pay for your losers. If you take 50% off at 1R, your remaining position must still deliver enough average R to keep EV positive.
- Move to breakeven only with a rule. Breakeven stops often reduce average win more than they reduce losses. Move to breakeven after price breaks a structure level in your favor, not after an arbitrary number of pips.
- Do not “trail” inside chop. Tight trailing in a range turns winning trades into scratch trades. Your average R drops.
Avoid Target Inflation and Other Ratio Distortions
Many traders claim a strong ratio. Their logs show a different story.
- Do not change the target to make the ratio look better. Set the target from structure before entry, then record it.
- Do not ignore spread and slippage. Use realistic fills. A small stop on paper can become a larger realized loss in fast markets.
- Do not tighten the stop after entry. If you move the stop closer without new structure, you change the trade idea midstream.
- Do not count “almost hit target” as a win. Count what you booked.
Pre-Trade Checklist, Make the Ratio Real
Use a simple checklist. If you fail one item, pass on the trade.
- Entry: Your entry sits near a clear level. You know why you enter there.
- Invalidation: Your stop sits beyond the structure that proves you wrong. You can explain the level in one sentence. If you need help with placement, use this guide on how to place a stop loss.
- Target: Your target sits at a defined level or measured move. You know what price must do to reach it.
- Space: Price has clean room to the target. No major level blocks the path.
- Volatility: ATR supports the move within your holding period.
- Math: Planned R:R uses realistic costs. You accept the stop size and position size.
- Execution: You can place entry, stop, and target orders without improvising.
Risk-Reward Ratio vs. Other Risk Metrics You Should Track
Risk-Reward Ratio vs. Other Risk Metrics You Should Track
Risk-reward ratio tells you how much you plan to make versus what you plan to lose on one trade. It does not tell you how often you will win. It does not tell you if your system makes money over a month. Track other metrics that connect risk, results, and survival.
Expectancy: Win Rate Plus Average Win and Loss
Expectancy measures what you earn per trade on average. It combines your win rate, your average win, and your average loss. It matters more than a single trade R:R because it describes your edge.
Expectancy formula: (Win rate × Avg win) minus (Loss rate × Avg loss).
- If you target high R:R but your win rate collapses, expectancy can turn negative.
- If you accept lower R:R but keep a strong win rate and tight losses, expectancy can stay positive.
- Calculate it after costs, spreads, commissions, and slippage. Paper numbers lie.
Profit Factor: How Efficient Your System Is
Profit factor compares total gross profits to total gross losses. It helps you see if your gains outweigh your losses across many trades.
Profit factor formula: Gross profit divided by gross loss.
- Profit factor below 1.0 means your system loses money over the sample.
- Profit factor can look strong with a few large wins. Check trade count and stability across market regimes.
- Use it with expectancy. Profit factor alone can hide deep drawdowns.
Max Drawdown: What Your Account Must Endure
Max drawdown is the largest peak-to-trough equity decline over a period. It sets your real risk tolerance. It also sets your ability to keep executing.
- Two strategies can share the same expectancy but have very different drawdowns.
- Lower drawdown often beats higher R:R in real life because you can keep size and stay consistent.
- Track drawdown in percent and in time. Long drawdowns break discipline and increase error rates.
Risk of Ruin: Position Sizing and Edge Decide Survival
Risk of ruin estimates your chance of blowing up or falling below a level where you cannot recover. You reduce it with two levers, your edge and your risk per trade.
- High risk per trade raises ruin risk fast, even with a decent win rate.
- No edge means ruin becomes a matter of time. You cannot size your way out of a negative expectancy.
- Lower risk per trade gives you more attempts to let your edge play out.
Reward-to-Risk vs. Probability: Evaluate Both
R:R is your payout. Probability is your hit rate for that target and stop. You need both to judge a setup.
- Higher targets usually reduce win rate. Lower targets usually raise it.
- Check your historical results by setup type, market condition, and time of day. Do not use one global win rate.
- Align your target logic with structure. Use clear levels and measured moves, then place targets with intent. See take profit targets for practical methods.
| Metric | What it measures | What it misses | Best use |
|---|---|---|---|
| Risk-Reward Ratio | Planned payout versus planned loss | Win rate, streaks, drawdown | Screen trades and standardize execution |
| Expectancy | Average profit per trade after costs | Path of returns, worst-case drawdown | Validate edge and compare systems |
| Profit Factor | Gross profits relative to gross losses | Volatility of returns, tail risk | Check efficiency over a large sample |
| Max Drawdown | Largest equity decline | Future drawdown, recovery probability | Set risk limits and realistic sizing |
| Risk of Ruin | Chance of account failure given edge and sizing | Model error, changing market conditions | Stress-test your risk per trade |
Common Mistakes and Limitations of Risk-Reward Ratio
Ignoring Execution Realities
Your ratio comes from ideal prices. Your fills come from the market.
- Slippage widens your real stop distance and shrinks your real target. A planned 2:1 can drop to 1.5:1 after a few ticks of slippage on entry and exit.
- Partial fills distort results. You may get full size on the loser and half size on the winner.
- Widening spreads hit hardest around news, session opens, and low-liquidity hours. Stops trigger sooner, targets need more movement.
Track expected vs actual entry, stop, and exit prices. Use average slippage and average spread at your trading times, then recalc your “realized” risk-reward.
Assuming the Market “Owes” Your Target
A ratio does not make a target realistic. Structure does.
- Targets placed inside strong support or resistance often fail. Price stalls, reverses, or ranges.
- Fixed pip targets ignore volatility. A 50-pip target means different things on different days.
- Some setups have limited room. You cannot force 3R if the next level sits at 1.2R.
Set stops and targets around market structure first. Then measure the ratio. If the ratio fails your rules, skip the trade or reduce size.
Not Accounting for Win Rate, Variance, and Sample Size
Risk-reward alone does not tell you if a setup makes money.
- A high ratio can still lose if your win rate stays too low.
- Variance creates long losing streaks even with a real edge. Your account needs room to survive the streak.
- Small samples lie. Ten trades prove nothing. One hundred trades starts to help. Several hundred gives you usable ranges.
| Risk-Reward (R) | Break-even win rate |
|---|---|
| 1:1 | 50% |
| 2:1 | 33.3% |
| 3:1 | 25% |
Log your trades and calculate win rate, average R, and max losing streak. Use the worst streaks for sizing, not the best months.
Moving Stops or Targets and Breaking the Planned Ratio
Your ratio means nothing if you change it mid-trade.
- Moving a stop wider turns a small planned loss into a large unplanned loss.
- Taking profit early cuts winners and lowers average R.
- Moving targets further without a reason reduces win rate and can raise drawdown.
Define stop rules before entry. If you trail, use one method and one trigger. If you scale out, write the levels. If you struggle with stop placement, use this stop loss guide to standardize your process.
Using Leverage to Chase Rewards
Leverage does not improve your ratio. It magnifies your errors.
- Bigger size increases slippage and spread impact in fast markets.
- Higher leverage raises your chance of hitting margin limits during normal volatility.
- Large positions push you to cut winners and widen stops. Your discipline breaks first.
Improve the ratio by improving trade location, stop logic, and exit logic. Keep risk per trade stable. Let position size follow your stop distance, not your emotions.
Practical Guidelines for Different Trader Types
Day Trading Considerations
Day trading punishes loose execution. Spreads, commissions, and slippage eat your edge first. Your risk-reward ratio must survive costs.
- Trade liquid markets. Liquidity tightens spreads and reduces slippage. Avoid thin sessions and news spikes if your strategy does not target them.
- Use tight, logical stops. Tight does not mean random. Place stops beyond structure, not at a fixed pip number. Use support and resistance to anchor the stop to a level the market must break to prove you wrong.
- Plan for fast-changing conditions. Volatility expands and contracts. If ATR or spread widens, cut position size or skip the trade. Do not keep the same size and hope.
- Set realistic targets. Intraday ranges cap reward. If the average move left in the session is small, a 1:4 target becomes a low-probability bet.
- Account for partial fills and slippage. If you risk 10 ticks but average 2 ticks slippage, you just increased risk by 20%. Adjust size or stop distance.
Swing Trading Considerations
Swing trading gives trades room. It also adds gap risk and longer exposure.
- Use wider stops. Place stops beyond swing points and volatility. A stop inside normal daily noise turns into death by a thousand cuts.
- Respect overnight gaps. Gaps can jump your stop. Reduce size before earnings, major data, or weekend holds if gaps can exceed your planned risk.
- Use multi-day targets. You need a target that matches the timeframe. Many swing setups work with 1:2 to 1:3 when the trend aligns and the stop sits outside noise.
- Manage winners with a rule. Move to breakeven only after the market proves the move. Early breakeven rules cut expectancy by killing trades that need normal pullbacks.
Long-Term Investing Considerations
Long-term investing uses a different stop concept. Price noise matters less. Thesis damage matters more.
- Define thesis invalidation. Your risk is the point where the reason for the investment breaks. Examples include lost pricing power, balance sheet deterioration, or a broken long-term trend you rely on.
- Use time-based exits. If the thesis needs time, set a review window. If the expected catalysts do not arrive by that date, cut or reduce. Time is a cost.
- Expect larger drawdowns. Wider stops and longer holds mean bigger swings. Reduce position size so you can hold through normal volatility without panic selling.
- Rebalance risk, not feelings. Trim when a position grows too large. Add only when risk stays within plan.
Risk Management Rules of Thumb
Risk-reward ratio fails if you blow up. Use hard limits that stop damage early.
| Rule | Guideline | Why it helps |
|---|---|---|
| Account risk per trade | 0.25% to 1.0% of account equity | Keeps a losing streak survivable. |
| Daily loss limit | 2R to 3R, then stop trading | Prevents revenge trading in poor conditions. |
| Weekly loss limit | 5R to 10R, then reduce size or pause | Forces a reset when edge is not showing up. |
| Max open risk | 2R to 4R total across positions | Stops correlated trades from acting like one large bet. |
| Minimum planned ratio | Day: 1:1 to 1:2, Swing: 1:2 to 1:3, Long-term: thesis-based | Keeps targets realistic for the timeframe. |
Track results in R, not dollars. If your average win is smaller than your average loss, raise your trade quality or cut your stop size. Do not fix it with leverage.
FAQ
What is the risk-reward ratio in trading?
Your risk-reward ratio compares what you can lose to what you plan to make on one trade. Risk equals entry to stop distance. Reward equals entry to target distance. A 1:2 ratio means you risk 1R to aim for 2R.
How do you calculate risk-reward?
Set entry, stop, and target. Measure stop distance in price or pips, that is your risk. Measure target distance, that is your reward. Divide reward by risk to get R. Example, 20 pips risk and 40 pips target equals 2R.
What is a good risk-reward ratio?
Match it to timeframe and execution. Day trades often work at 1:1 to 1:2. Swing trades often need 1:2 to 1:3. Longer-term trades depend on your thesis and invalidation point. Use ratios you can hit with your actual win rate.
Why does risk-reward matter if win rate is low?
It sets your breakeven win rate. Breakeven equals 1 divided by (1 plus R). At 2R, you can break even near 33 percent before costs. At 1R, you need near 50 percent. Add spread and slippage on top.
What does 1R mean?
1R equals your planned loss if your stop hits. If you risk $100 on a trade, 1R equals $100. A win of $200 equals +2R. Track results in R so position size changes do not hide your edge.
Does a higher ratio always mean a better trade?
No. A high R target can cut your win rate and increase time in trade. It can also raise slippage risk. Judge the full setup, R, win rate, and costs. Keep targets aligned with structure, not wishful extensions.
How do you set stops and targets for a clean ratio?
Put your stop at the level that breaks your setup, not at a fixed dollar amount. Place your target at the next logical liquidity or structure level. If the chart cannot offer at least your minimum R, skip the trade.
Should you move your stop to improve the ratio?
No. Tightening a stop to force a better ratio often raises stop-outs and worsens expectancy. Set the stop where the idea fails. If risk feels too large, reduce size or wait for a better entry. Do not bend your invalidation.
How do correlations affect risk-reward?
Correlated positions can turn separate trades into one big bet. Your total risk stacks even if each trade shows a clean ratio. Cap total exposure across related pairs and sectors. Use a Forex correlation pairs list to spot overlap.
How do you test if your chosen ratio works?
Log trades in R and group them by setup and timeframe. Check average win in R, average loss in R, win rate, and max drawdown. Validate with backtests and replays before scaling live risk. Keep sample size large enough to matter.
Conclusion
Your risk-reward ratio sets the math of your trading. It defines how much you need to be right to grow. It also forces you to place the stop and target before you enter.
Pick one ratio you can execute. Start with a minimum that fits your setup. Keep your risk per trade fixed. Measure results in R, not dollars.
- Set the stop from structure, not from a dollar amount.
- Set the target from a level, then check if the ratio meets your minimum.
- Track expectancy, average win in R minus average loss in R times their rates.
- Cut overlap risk across correlated pairs, so one theme cannot hit multiple stops at once.
- Review by setup and timeframe, then keep the few that hold up in samples.
Final tip. Build a one-page rule. If a trade cannot hit your minimum R with a valid stop, you skip it. You protect your edge by filtering, then you scale only after your log proves it on enough trades.
If you need a full risk plan and execution checklist, use this forex trading beginner roadmap.
-
How to Start Forex Trading Step by Step (Beginner Roadmap)
1 month ago -
Forex Order Types Explained: Market vs Limit vs Stop Orders
1 month ago -
Stop Loss vs Take Profit: Differences, Examples & Best Practices
1 month ago -
How to Set Stop Loss and Take Profit (Step-by-Step)
1 month ago -
How to Place a Stop Loss in Forex (Beginner-Friendly Guide)
1 month ago
-
-
- What is the risk-reward ratio in trading?
- How do you calculate risk-reward?
- What is a good risk-reward ratio?
- Why does risk-reward matter if win rate is low?
- What does 1R mean?
- Does a higher ratio always mean a better trade?
- How do you set stops and targets for a clean ratio?
- Should you move your stop to improve the ratio?
- How do correlations affect risk-reward?
- How do you test if your chosen ratio works?
-
-
-
- What is the risk-reward ratio in trading?
- How do you calculate risk-reward?
- What is a good risk-reward ratio?
- Why does risk-reward matter if win rate is low?
- What does 1R mean?
- Does a higher ratio always mean a better trade?
- How do you set stops and targets for a clean ratio?
- Should you move your stop to improve the ratio?
- How do correlations affect risk-reward?
- How do you test if your chosen ratio works?
-
-
Forex Lot Size Calculator: How to Use It to Size Trades Correctly
1 month ago -
How to Calculate Position Size in Forex (Position Sizing Formula + Examples)
1 month ago -
Forex Leverage Explained: How It Works, Pros, Cons & Examples
1 month ago -
Margin vs Leverage in Forex: What’s the Difference?
1 month ago -
What Is Forex Trading? A Beginner’s Guide to How It Works
1 month ago
-
Forex Leverage Explained: How It Works, Pros, Cons & Examples
1 month ago -
Forex Market Hours & Trading Sessions Explained (Best Times to Trade)
1 month ago -
Is Forex Trading Legal in the United States? Rules, Regulators & What to Know
1 month ago -
Forex Trading Platforms Comparison: MetaTrader vs cTrader vs TradingView
1 month ago -
What Is a Lot Size in Forex? Lot Types + Quick Examples
1 month ago