Candlestick Patterns for Forex Trading: The Key Patterns Beginners Should Know
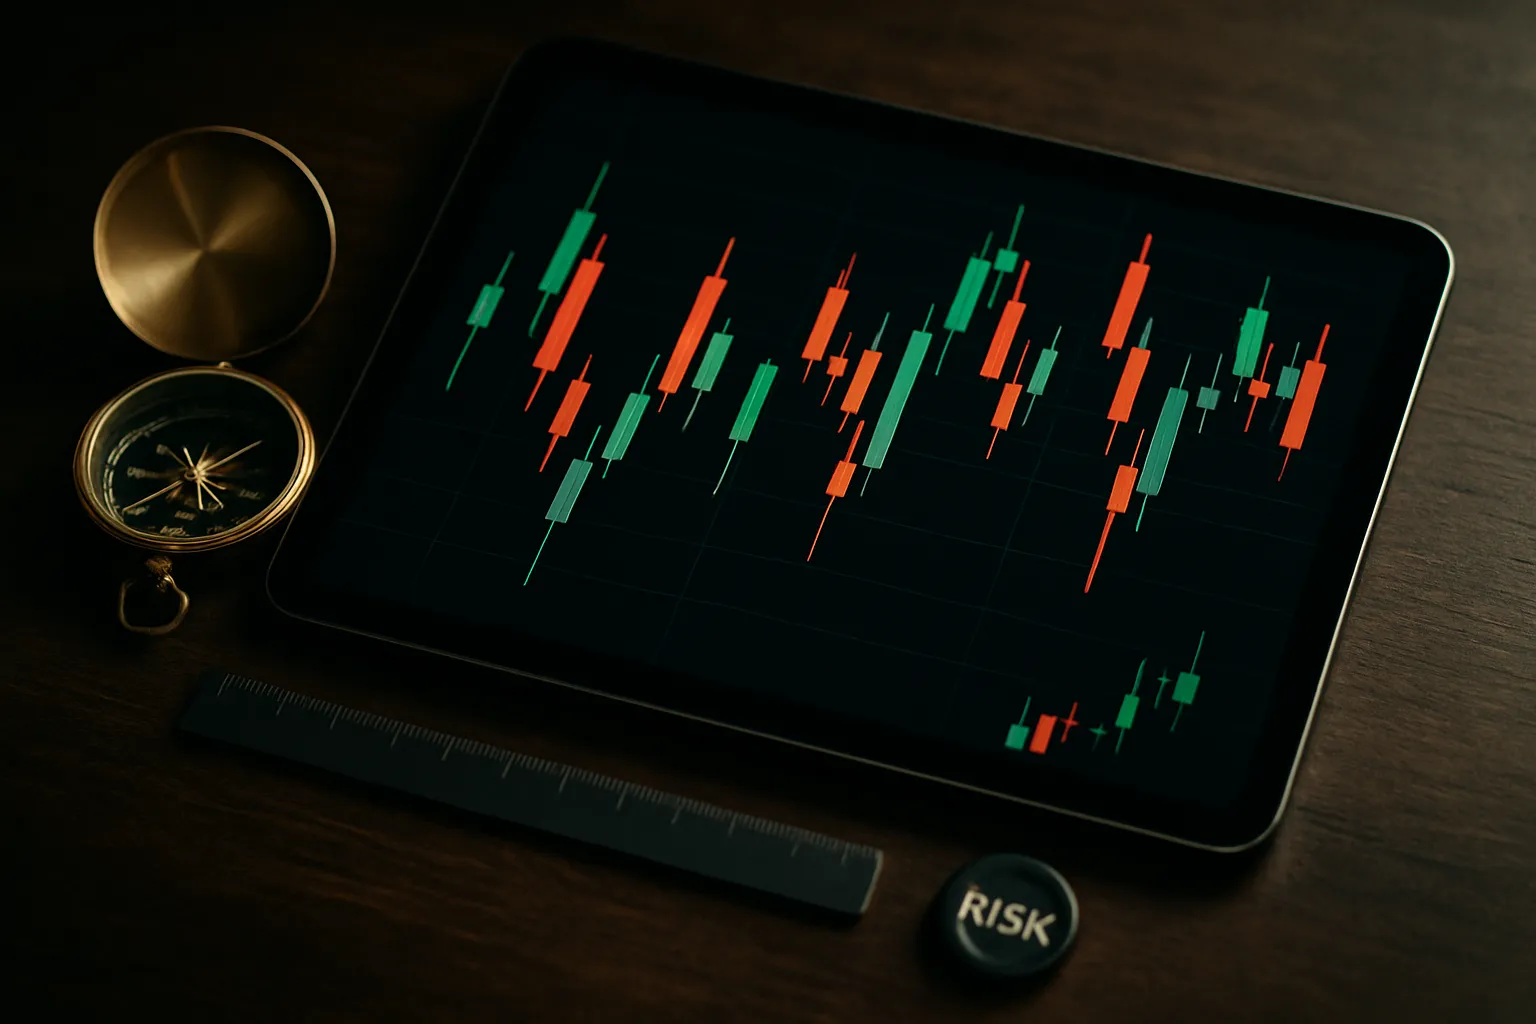
Candlestick patterns help you read price action fast. Each candle shows four facts, open, high, low, close. When candles group into repeatable shapes, they can signal momentum shifts, exhaustion, or continuation.
This guide focuses on the few forex candlestick patterns that beginners should know. You will learn how to spot each pattern, what it suggests, and what conditions make it stronger or weaker. You will also learn simple rules to reduce false signals, confirm with trend and key levels, and manage risk around entries and stops.
Use patterns as decision tools, not predictions. Pair them with one clean indicator for confirmation, such as RSI, and always check where the pattern forms on the chart.
Key Takeaways
Key Takeaways
- In het kort: Focus on a small set of high-signal patterns, hammer, shooting star, engulfing, and doji.
- In het kort: Read patterns in context, trend direction and nearby support or resistance matter more than the candle shape.
- In het kort: Treat patterns as triggers, not forecasts. Wait for confirmation.
- In het kort: Reduce false signals with one clean filter, for example RSI, and avoid taking every setup.
- In het kort: Define risk before you enter. Place stops beyond the pattern and size your trade to the stop distance.
- In het kort: Use clear execution rules and stick to them. Learn how market, limit, and stop orders affect entries and slippage in this guide on Forex order types.
What to remember: A candlestick pattern has value only when it forms at a level that matters, in the direction that makes sense, with a simple confirmation step. Build a repeatable checklist and skip the rest.
Candlesticks in Forex: what they show and why patterns work
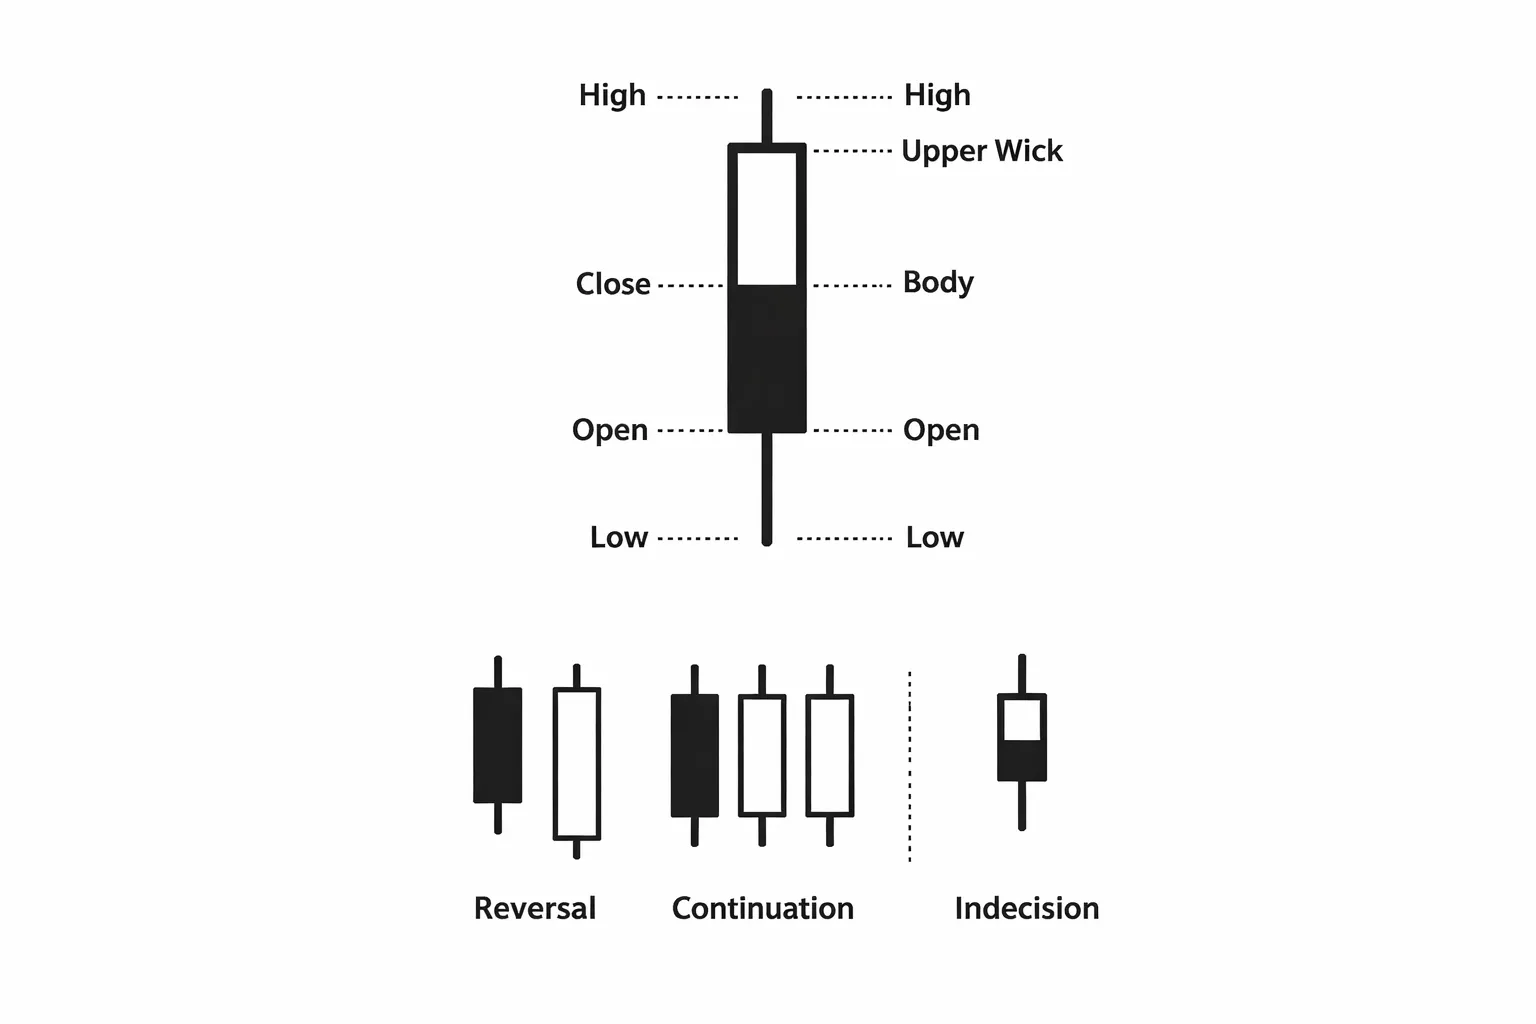
Anatomy of a candlestick
Each candle shows four prices for a time period: open, high, low, close.
- Body. The distance between open and close. It shows who won that period, buyers or sellers.
- Wicks. The lines above and below the body. They show rejection and where price failed to hold.
- Close matters. Many traders judge control by where price closes, not where it spikes.
- Range matters. A large candle range often signals higher participation. A small range often signals balance.
Read candles as a sequence. One candle is noise. Two to five candles often show the real shift.
What candles reveal in Forex specifically
Forex is decentralized. You do not see a single, true exchange volume. Candles still give useful proxies.
- Liquidity changes by session. London and New York hours tend to print cleaner moves. Asia often compresses, then breaks later.
- Spread and execution change. Thin liquidity can create long wicks that are just spread, stop runs, or news spikes. Treat them with caution.
- Order flow footprints. You cannot see the full book, but you can infer behavior.
- Long upper wick at resistance often means sellers absorbed buying and pushed price back down.
- Long lower wick at support often means buyers absorbed selling and pushed price back up.
- Clusters of small bodies often mean both sides wait, then a catalyst picks direction.
Context decides if the candle means anything. Use levels first, then read the candle. Use support and resistance as your filter.
Pattern categories: reversal, continuation, indecision
- Reversal patterns. They signal a failed push and a possible turn. They work best after a clear move into a level.
- Continuation patterns. They signal a pause, then trend resumption. They work best when the trend stays intact and pullbacks stay shallow.
- Indecision patterns. They signal balance. They do not predict direction by themselves. You need a break and close to confirm.
| Category | What you usually see | What you need to confirm |
|---|---|---|
| Reversal | Strong wick into a level, then a close back inside the prior range | Next candle closes in the new direction, or price breaks the pattern high or low |
| Continuation | Small bodies after a strong impulse, pullback stalls above prior support or below prior resistance | Break and close beyond the consolidation range |
| Indecision | Doji-like bodies, overlapping candles, mixed closes | Wait for range break and retest, or a strong close with follow-through |
Why probability, not certainty, should guide pattern trades
Candlestick patterns do not cause price to move. They summarize where buyers and sellers fought.
You trade the odds. You manage the downside when you are wrong.
- Define the setup. Level plus pattern plus direction. No checklist, no trade.
- Define invalidation. Put the stop where the pattern breaks, not where it feels comfortable.
- Demand a trigger. Use a break and close, or a retest, before entry.
- Track results. Log at least 30 trades per pattern and context. Keep what performs, cut what does not.
- Expect variance. Even a good setup will lose in streaks. Risk stays fixed per trade.
How to read candlestick patterns correctly (the context checklist)
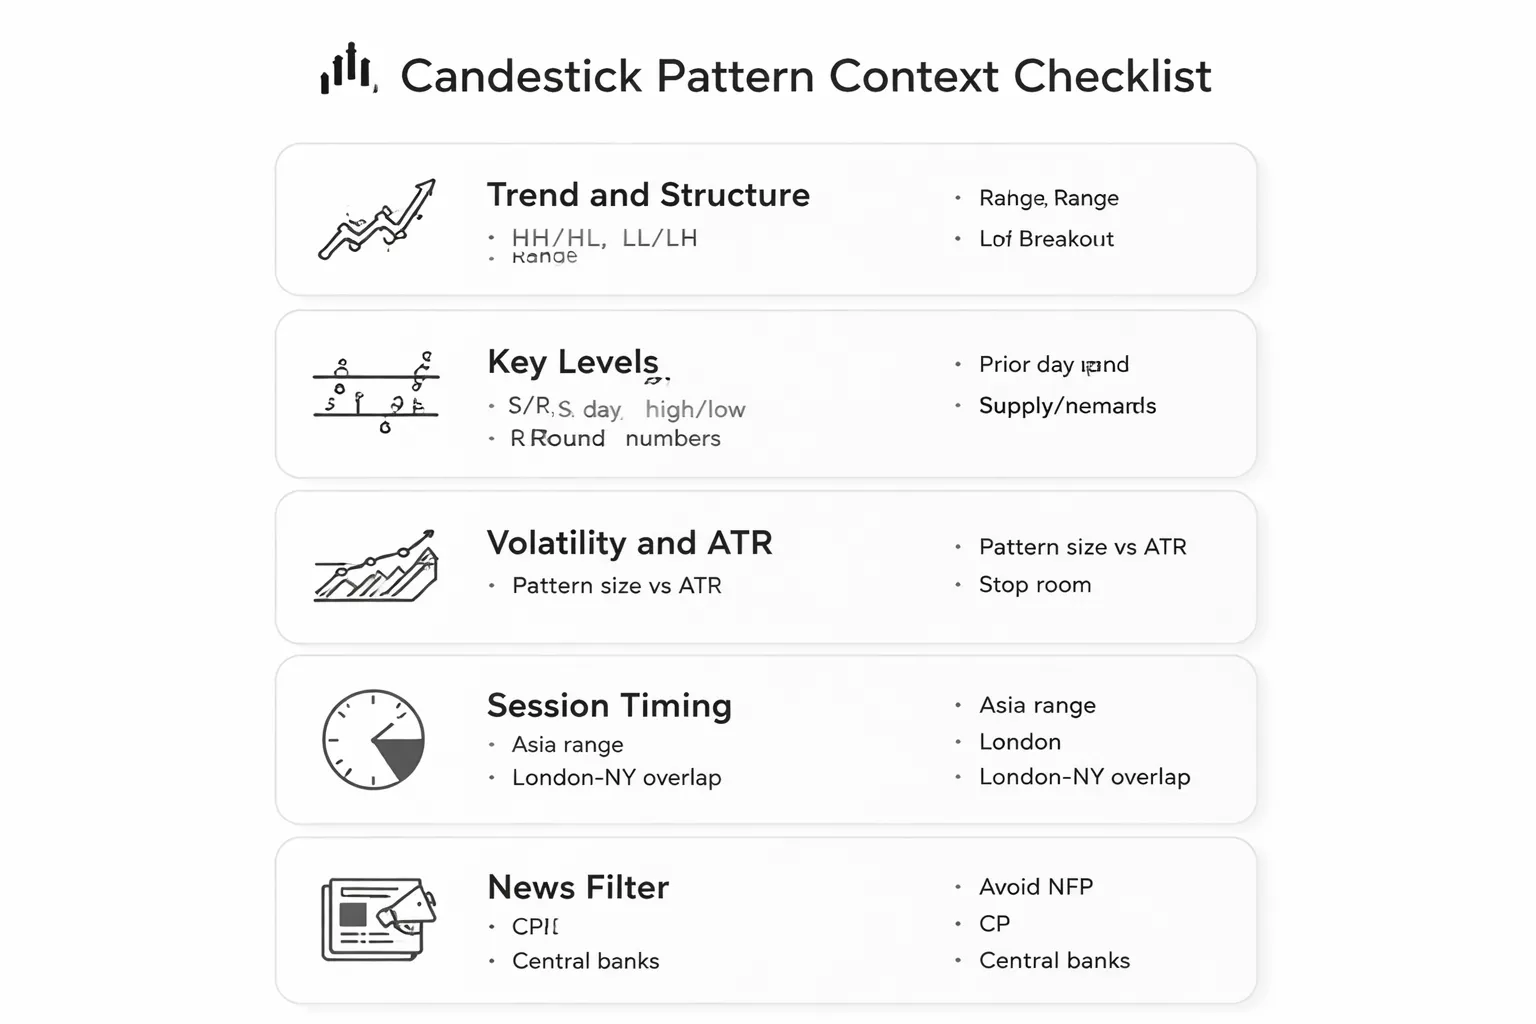
Trend and market structure
Start with structure. Patterns work best when they align with what price already does.
- Uptrend: higher highs and higher lows. Favor bullish patterns at pullbacks, not at the top of an extended leg.
- Downtrend: lower lows and lower highs. Favor bearish patterns at pullbacks, not after a crash into support.
- Range: flat highs and lows. Trade patterns at the edges, not in the middle.
- Breakout: price closes beyond range structure. Treat the first pattern after breakout as lower quality. Wait for a retest or a second close.
Mark the last two swing points. If you cannot label the market as trend, range, or breakout in 10 seconds, skip the pattern.
Key levels that make patterns matter
A candlestick pattern without a level is noise. Your level decides if the signal has a reason to work.
- Support and resistance: clear swing highs and swing lows on your trading timeframe and one higher timeframe.
- Prior day high and low: treat them as magnets and turning points. Patterns near these levels often fail if you trade into them.
- Round numbers: 1.1000, 1.1050, 150.00. Use them as filters, not targets by default.
- Supply and demand zones: the last strong impulse origin. Keep zones tight. Wide zones make stops too large and entries vague.
Rule for clarity. If you need to explain your level with three lines of text, it is not a level. It is a story.
Volatility and ATR
Many beginner losses come from trading patterns that are too small to matter. Size must match current volatility.
- Check the candle range versus recent average range.
- Avoid patterns that sit inside the prior candle and look clean but have no range. They often fail on spread and normal noise.
- Avoid taking a pattern when your stop must sit inside the pattern. Your invalidation needs room.
Keep risk fixed. Adjust position size, not your stop logic.
Session timing
Timing changes follow-through. You want participation. You avoid dead hours and forced moves.
- Asian range: expect mean reversion. Breakouts often fake out, then return inside the range.
- London open: strong direction, strong stop runs. Treat the first spike as information, not a signal.
- London and New York overlap: best window for clean continuation and real breaks.
- End of day: more position squaring. Patterns can trigger then stall. Reduce expectations or skip.
Write your allowed trading window in your plan. Then follow it.
News filters
High impact news can erase any pattern. Your edge comes from avoiding random outcomes, not predicting headlines.
- Avoid new entries shortly before and after major releases that move currencies.
- Skip or reduce risk around: NFP, CPI, central bank rate decisions, press conferences, unexpected speeches.
- If you hold a trade into news, accept it as a different trade type. Widening spreads and slippage can break your stop logic.
Put a simple rule in your plan, then enforce it. Use a calendar. No exceptions.
Next step. Turn this checklist into rules inside your forex trading plan. Then test one pattern at a time.
High-probability single-candle patterns beginners should know
Hammer vs hanging man, same shape, different meaning based on trend
A hammer and a hanging man share the same single-candle shape. Long lower wick. Small real body near the top of the range. Little or no upper wick.
- Hammer. Forms after a down move. It signals rejection of lower prices.
- Hanging man. Forms after an up move. It warns that buyers failed to hold the highs after a sell-off inside the candle.
How you use it.
- Check location first. The candle matters most at a clean support or demand zone, or after an extended push.
- Demand follow-through. Treat the pattern as a setup, not a signal. You want the next candle to trade above the hammer high for long bias, or below the hanging man low for short bias.
- Avoid middle-of-range prints. In chop, this candle becomes noise.
Inverted hammer vs shooting star, spotting rejection at a level
These also share the same shape. Long upper wick. Small real body near the bottom of the range.
- Inverted hammer. After a down move. Price probes higher, then sellers push it back. It can mark early reversal.
- Shooting star. After an up move. Price probes higher, then sellers reject the level. It can mark a top or a pullback start.
How you use it.
- Prioritize a clear level. Prior day high, swing high, round number, or a well-tested zone.
- Look for rejection. The upper wick should make up most of the candle range. The close should sit near the low.
- Confirm with the next candle. For shorts, you want a break below the shooting star low. For longs, you want a break above the inverted hammer high.
Doji family, reading indecision and absorption
A doji has a small real body. Open and close sit close together. It signals hesitation. Alone, it does not predict direction. Context does.
- Standard doji. Small body, moderate wicks. Market paused. Use it as a warning, not an entry.
- Long-legged doji. Long wicks both sides. Wide battle. It often appears near turning points, but it also appears during news chop. Use stricter filters.
- Dragonfly doji. Long lower wick, close near the high. It shows strong buy-back from lows. Best after a down move into support.
- Gravestone doji. Long upper wick, close near the low. It shows sell pressure after a push up. Best after an up move into resistance.
Practical read.
- If a doji forms after a strong trend leg, you may see exhaustion. Reduce size or tighten rules.
- If a doji forms at a level and the next candle breaks away, you get a cleaner trigger.
- If dojis cluster, the market ranges. Stand down or switch to range rules.
Marubozu candles, momentum clues and when they signal continuation
A marubozu has a large body and small or no wicks. It shows one-sided control.
- Bullish marubozu. Strong buying from open to close.
- Bearish marubozu. Strong selling from open to close.
How you use it.
- Use it as a trend strength check. Big body, clean close near the extreme, often supports continuation.
- Respect location. A bullish marubozu breaking above a range high can confirm a breakout. A bullish marubozu into resistance can mark the last push before reversal.
- Plan the trade type. Continuation trades need structure. A pullback entry or a retest of the breakout level usually gives better risk than chasing the close.
Pin bars in FX, wick-to-body ratios and the location rule
Most beginners overtrade pin bars. You avoid that by using two rules. Shape and location.
Shape rules.
- Wick should dominate the candle. Aim for wick at least 2 times the body. More is better.
- Opposite wick should stay small. You want clean rejection, not two-sided noise.
- Close should sit in the top third for a bullish pin, or bottom third for a bearish pin.
Location rule.
- Trade pin bars at a level. Prior swing high or low, range edge, trendline touch, or a clear zone.
- Avoid pin bars inside the middle of a range, inside tight consolidation, or after a news spike.
- Use a trigger. For bullish pins, require price to break the pin high. For bearish pins, require a break of the pin low.
Keep risk stable. Size your trade from your stop distance, then set targets with structure, not hope. Use the same rules every time, and track outcomes in a log. For risk rules that stop one bad candle from wiping your week, use this risk management checklist.
Essential two-candle patterns (reversal and momentum shifts)
Bullish engulfing and bearish engulfing, strength criteria and common traps
An engulfing pattern uses two candles. The second candle’s real body covers the first candle’s real body.
- Bullish engulfing: first candle closes down, second candle closes up and its body engulfs the prior body.
- Bearish engulfing: first candle closes up, second candle closes down and its body engulfs the prior body.
Use clear strength checks.
- It forms at a level you can name, support, resistance, prior swing, range edge.
- The engulfing body is large versus the last 10 to 20 candles.
- The engulfing candle closes near its extreme, near the high for bullish, near the low for bearish.
- It engulfs more than just the body when possible, it also takes the prior high and low.
Common traps cost beginners money.
- Engulfing inside chop. No level, no edge.
- Engulfing into the next barrier. If the next swing level sits 10 to 20 pips away, your reward is capped.
- Engulfing during a news impulse. The pattern shows volatility, not intent.
- Engulfing against a strong trend without room. You get one candle of relief, then trend continuation.
Trigger and stop rules keep it objective.
- Trigger long on a break above the engulfing high. Trigger short on a break below the engulfing low.
- Place the stop beyond the engulfing low for longs, beyond the engulfing high for shorts.
Piercing line and dark cloud cover, confirming a potential turn
These are two-candle reversal patterns with stricter location rules.
- Piercing line: after a decline, the first candle closes down, the second opens lower and closes above the midpoint of the first candle’s body.
- Dark cloud cover: after a rise, the first candle closes up, the second opens higher and closes below the midpoint of the first candle’s body.
Confirmation matters because FX often prints false opens.
- Require the second candle to close beyond the midpoint, not just wick through it.
- Prefer a close above a minor structure level for piercing line, or below it for dark cloud cover.
- Demand follow-through, the next candle breaks the pattern high for bullish, or breaks the pattern low for bearish.
Manage the trade with structure.
- Stop goes beyond the pattern low for piercing line, beyond the pattern high for dark cloud cover.
- First target sits at the nearest swing level, then trail or scale only if price breaks that level cleanly.
Harami and harami cross, consolidation vs reversal interpretations
A harami is a two-candle pattern where the second real body sits inside the first real body.
- Bullish harami: after a decline, a large down candle then a smaller up or small-bodied candle inside it.
- Bearish harami: after a rise, a large up candle then a smaller down or small-bodied candle inside it.
- Harami cross: the second candle is a doji inside the first body.
Most of the time, a harami signals pause, not reversal. Treat it as consolidation until price proves otherwise.
- If the market ranges, a harami often marks the middle of the range. Skip it.
- If it forms at a clean swing level after an extended move, it can mark a turn, but you still need a break.
Use a simple decision rule.
- Trade it as a breakout setup. Buy above the two-candle high for bullish cases. Sell below the two-candle low for bearish cases.
- Stop goes on the other side of the two-candle range.
- Skip if the range is too wide for your risk, or if the next level blocks reward.
Tweezer top and tweezer bottom, identifying double-rejection at a level
Tweezers show two failed attempts at the same price area.
- Tweezer top: two candles with similar highs after an advance, often with rejection wicks.
- Tweezer bottom: two candles with similar lows after a decline.
Define “similar” with a tolerance.
- On majors, treat highs or lows within 5 to 15 pips as the same zone on H1 to H4. Adjust for pair volatility.
- The more times price respected that zone in the past, the more weight the tweezer has.
Filter out weak signals.
- A tweezer in the middle of a range is noise. You want it at the range edge or a swing level.
- If the second candle closes strong through the zone, the rejection failed. Do not fade it.
Execution stays simple.
- For a tweezer top, trigger short on a break below the second candle’s low. Stop above the tweezer highs.
- For a tweezer bottom, trigger long on a break above the second candle’s high. Stop below the tweezer lows.
Kicker-type moves, when gaps are rare in FX and how to interpret impulse candles instead
A classic kicker uses a gap to show a sudden shift in control. Spot FX rarely gaps during active sessions, so focus on the impulse.
Use these FX-friendly kicker rules.
- Look for a strong reversal candle that opens near the prior close and then drives hard in the opposite direction.
- The candle closes near its extreme and breaks a nearby structure level in the same candle.
- Size matters. The impulse candle should be large versus recent candles and larger than the prior candle body.
Interpretation depends on location.
- At a major level, it can mark a reversal and a new swing.
- In a trend, it often marks a pullback end and trend continuation. Align it with the dominant direction.
Trade it like a breakout, not like a guess.
- Enter on a break of the impulse high for bullish kicks, or a break of the impulse low for bearish kicks.
- Place the stop beyond the impulse candle’s opposite extreme.
- Take profit into the next structure, then reassess. If you want added context, combine it with common chart patterns to map likely targets and trouble zones.
| Pattern | Best location | Minimum confirmation | Main beginner mistake |
|---|---|---|---|
| Engulfing | Swing level, range edge | Break of engulfing high or low | Taking it in chop or into nearby structure |
| Piercing line, Dark cloud cover | After a clear push into a level | Close beyond midpoint, then follow-through break | Ignoring weak closes and lack of follow-through |
| Harami, Harami cross | End of an extended move at a level | Breakout from the two-candle range | Assuming reversal without a break |
| Tweezer top, Tweezer bottom | Repeated rejection zone | Break of the second candle’s opposite side | Calling any matching highs or lows a level |
| FX kicker-type impulse | Major level or pullback end | Break of impulse high or low | Chasing the candle after it already moved |
Must-know three-candle patterns (the beginner-friendly set)
Morning star and evening star
These patterns aim to show a clean shift in control across three candles. Treat them as reversal setups, not automatic reversals.
- Structure, morning star: bearish candle, then a small middle candle, then a strong bullish candle that closes well into candle one’s body.
- Structure, evening star: bullish candle, then a small middle candle, then a strong bearish candle that closes well into candle one’s body.
- Spacing, real gaps rarely print in spot FX. Do not require a gap. Look for separation by range and position instead. The middle candle should trade in a tighter range and sit away from the first candle’s close.
- Middle candle quality, you want indecision. Small body. Often a doji or spinning top. Long wicks help. A large middle candle weakens the story.
- Confirmation rule you can execute, wait for price to break the third candle’s high for a morning star, or break the third candle’s low for an evening star. If it cannot break, skip it.
- Where it works best, at a prior swing level or after an extended push. In the middle of chop, it turns into noise.
Three white soldiers and three black crows
These show strong directional pressure. They can mean continuation, or they can mark exhaustion. Your job is to separate the two.
- Textbook look, three white soldiers: three consecutive bullish candles, each closing near its high, each opening inside or near the prior body. Three black crows is the bearish mirror.
- Continuation read, the sequence starts after a pullback, breaks a clear level, and holds above it on the second and third candles. Wicks stay modest. Closes stay strong.
- Exhaustion read, the sequence runs straight into a major prior swing, prints larger and larger ranges, or shows upper wicks growing on soldiers, or lower wicks growing on crows. That often signals late buyers or sellers chasing.
- Entry rule, avoid buying the third soldier or selling the third crow if it is extended versus the prior average range. Prefer the first pullback that holds above the midpoint of the third candle for soldiers, or below the midpoint for crows.
- Risk control, place the stop beyond the pattern structure, then set a target that respects a simple risk-reward ratio. If the next resistance or support sits too close, pass.
Three inside up and three inside down
This is a practical, beginner-friendly confirmation pattern. It uses a two-candle “inside” setup, then forces follow-through.
- Three inside up: candle one is bearish. Candle two is bullish but stays inside candle one’s range, often a harami. Candle three closes above candle one’s high, or at least breaks and holds above it.
- Three inside down: candle one is bullish. Candle two is bearish inside candle one. Candle three closes below candle one’s low, or breaks and holds below it.
- Confirmation rules that reduce false signals: take it only if candle three breaks the first candle’s extreme, not just the second candle. If candle three only tags the level and closes back inside, skip.
- Clean invalidation: for three inside up, the setup fails if price breaks below the pattern low after entry. For three inside down, it fails if price breaks above the pattern high.
- Best use case: after a clear push into a known level, where candle one shows the final drive and candle two shows stalling.
Three outside up and three outside down
This is an engulfing pattern plus follow-through. That follow-through matters more than the engulf.
- Three outside up: candle one is bearish. Candle two is bullish and engulfs candle one’s body. Candle three closes higher and keeps price above candle two’s midpoint.
- Three outside down: candle one is bullish. Candle two is bearish and engulfs candle one’s body. Candle three closes lower and keeps price below candle two’s midpoint.
- When it is strong: candle two engulfs with a decisive close, and candle three breaks the engulfing candle’s high or low, then holds. That shows real participation.
- When it is weak: candle two engulfs but candle three immediately stalls, or closes back inside candle two. That often becomes a fakeout.
- Execution rule: enter only after candle three confirms by closing beyond candle two’s extreme, or by breaking it and retesting without losing the midpoint.
Abandoned baby (and why it’s uncommon in spot FX)
The abandoned baby relies on clear gaps around a doji. Spot FX trades close to 24 hours a day. True gaps print less often, so the pattern appears less and performs less consistently.
- Classic bullish abandoned baby: down candle, then a doji that gaps down, then an up candle that gaps up away from the doji.
- Classic bearish abandoned baby: up candle, then a doji that gaps up, then a down candle that gaps down away from the doji.
- What to watch instead in FX: a doji or small-body candle with long wicks at a level, followed by a strong reversal candle and a break of that reversal candle’s high or low. That gives you the same idea, without needing gaps.
- Another practical substitute: a morning star or evening star where the middle candle is a clean doji and the third candle confirms with a break and close beyond the first candle’s key level.
Continuation patterns that work well in trending forex markets
Rising three methods and falling three methods, identifying healthy pullbacks
These patterns show a trend pause that stays controlled. You want a pullback, not a reversal.
- Rising three methods (uptrend continuation): One strong bullish candle. Then 2 to 4 small candles that drift down or move sideways. Then a strong bullish candle that closes above the first candle’s close, or breaks the first candle’s high.
- Falling three methods (downtrend continuation): One strong bearish candle. Then 2 to 4 small candles that drift up or move sideways. Then a strong bearish candle that closes below the first candle’s close, or breaks the first candle’s low.
Quality rules you can check fast.
- The pullback candles stay inside the range of the first strong candle, or at least do not close beyond it by much.
- The pullback looks smaller than the impulse. Smaller bodies, shorter ranges, less momentum.
- The final candle closes near its extreme. Near the high in rising three methods, near the low in falling three methods.
How you can trade it.
- Entry trigger, a break of the final candle’s high for bullish, or low for bearish.
- Stop idea, beyond the pullback swing, or beyond the first impulse candle’s opposite extreme if the structure stays tight.
- Target idea, prior swing high or low, or a measured move equal to the impulse leg.
Inside bar sequences, volatility contraction and breakout planning
An inside bar forms when the current candle’s high and low stay inside the prior candle’s range. In trends, inside bar sequences often mark volatility contraction before expansion.
- Single inside bar: one candle inside the prior candle.
- Coiled sequence: two or more inside bars in a row, each range stays contained.
What makes it work in trending forex markets.
- The sequence forms after an impulse leg in the trend direction.
- The sequence holds above a prior breakout level in an uptrend, or below it in a downtrend.
- The breakout candle closes outside the “mother bar” range, not just wicks through it.
Breakout planning.
- Mark the mother bar high and low.
- In an uptrend, plan the long trigger above the mother bar high. In a downtrend, plan the short trigger below the mother bar low.
- Place the stop on the other side of the mother bar, or tighter on the other side of the last inside bar if you accept more stop-outs.
- Skip trades where the inside bar forms into major news, spreads widen, and false breaks rise.
Bullish and bearish belt hold, separating real trend strength from noise
A belt hold is a strong trend candle that opens near one extreme and pushes in one direction with little pullback.
- Bullish belt hold: Opens near the low, drives up, closes near the high.
- Bearish belt hold: Opens near the high, drives down, closes near the low.
Use it as a continuation signal when it appears after a tight pause, a small pullback, or a clean retest of a broken level.
- Better signal, the belt hold breaks above a consolidation in an uptrend, or below it in a downtrend.
- Weaker signal, the belt hold prints as a single large candle after an extended run with no base.
Execution rules that keep you honest.
- Require a close near the extreme. Long upper wick on a bullish belt hold, or long lower wick on a bearish belt hold, cuts quality.
- Use the belt hold low as a bullish invalidation point, or the high as a bearish invalidation point, if the range fits your risk.
Separating lines concept, distinguishing pause from reversal
Separating lines show a brief counter-move that fails fast. Price then resumes the trend.
- In an uptrend, you often see a bearish candle followed by a bullish candle that opens near the prior open and closes higher.
- In a downtrend, you often see a bullish candle followed by a bearish candle that opens near the prior open and closes lower.
What you should look for in forex.
- The counter-trend candle stays small and does not break the prior swing structure.
- The next candle reclaims the level that matters, often the midpoint of the counter-trend candle, then closes in the trend direction.
- Volume data often does not help in spot FX, so use range and close location instead. Strong closes matter more than perfect opens.
Trade logic.
- Entry trigger, break of the trend candle that rejects the counter-move.
- Stop idea, beyond the counter-trend candle’s extreme.
When continuation patterns fail, late-trend signals and exhaustion risk
Continuation patterns fail most when you trade them late in the trend. The candle picture looks clean, but the market runs out of space.
Red flags you can measure.
- The pattern forms into a major higher time frame level, prior weekly high or low, big round number, or a clear supply or demand zone.
- The impulse leg before the pattern looks stretched. Large candles, repeated wide ranges, little overlap.
- Breakouts keep failing. You see multiple wick breaks beyond highs or lows with closes back inside.
- The pullback grows, not contracts. Pullback candles start matching the impulse candles in size.
- The breakout candle closes weak. It breaks level but closes mid-range, or prints a long rejection wick.
Risk control rules that reduce damage.
- Do not chase a breakout that already moved far past the trigger. Wait for a retest or skip it.
- Size your stop to structure, not to hope. If the structure forces a large stop, reduce position size or pass.
- Track your discipline, because late-trend setups trigger FOMO. Use a written checklist and stick to it. If this is a recurring issue, read forex trading psychology tips.
Trading candlestick patterns: entries, stops, targets, and confirmation
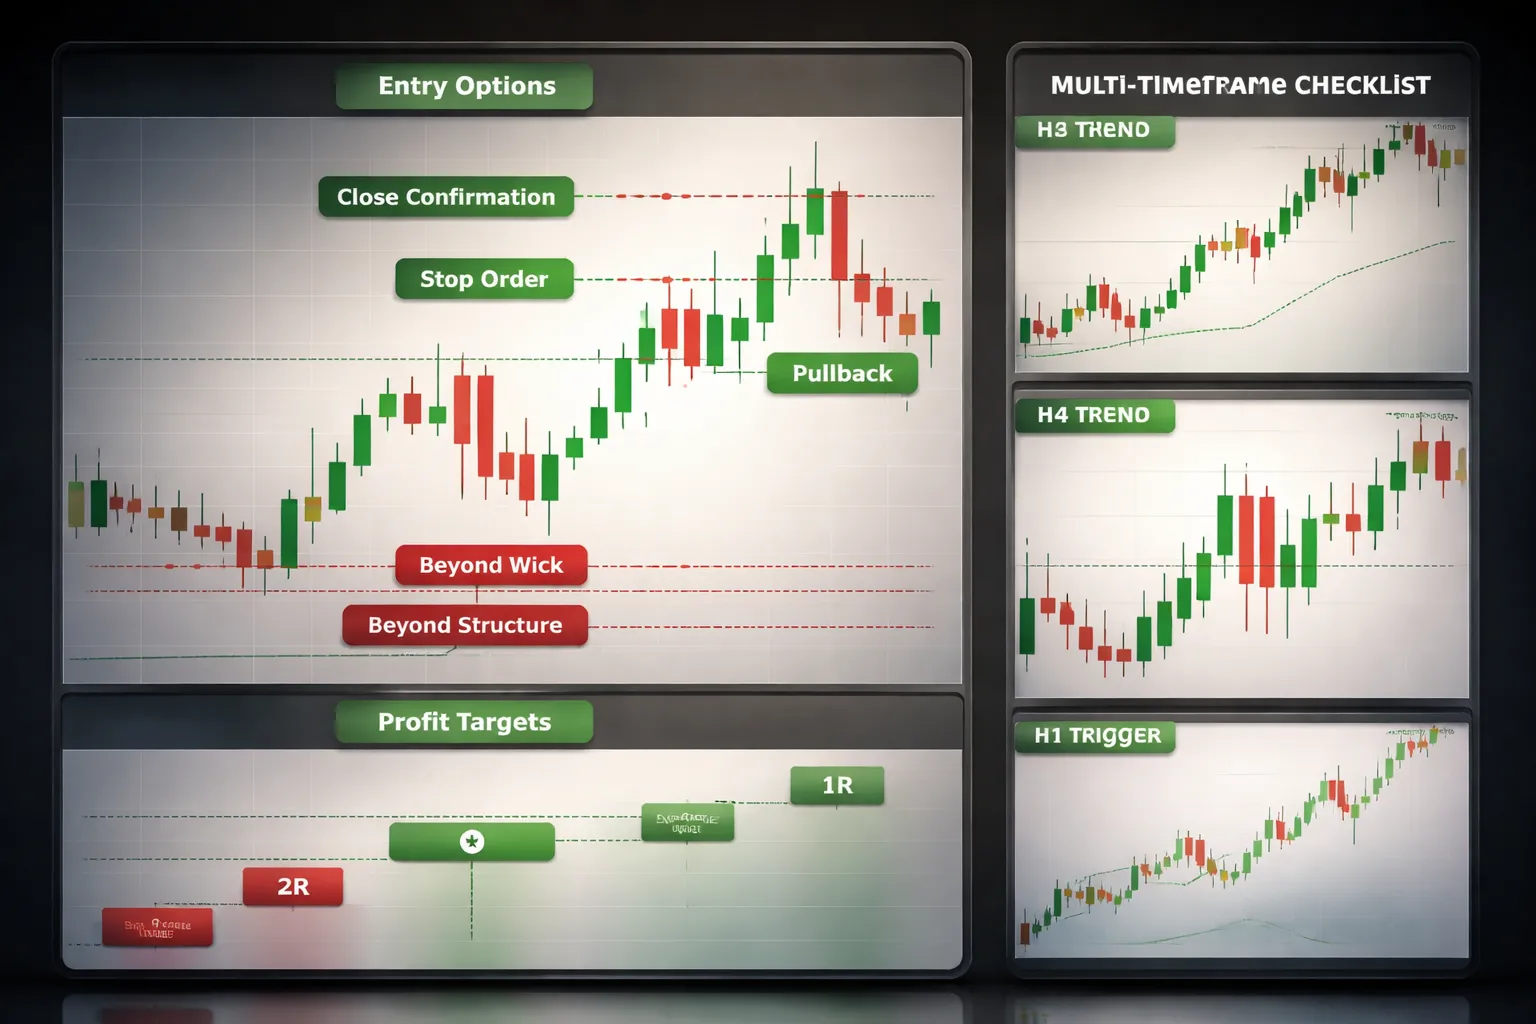
Entry styles: close confirmation, stop orders, and pullback entries
Your entry decides your win rate, your stop size, and your slippage risk. Pick one entry style and apply it the same way each time.
- Close confirmation entry. Enter at the close of the signal candle, or the next open. You reduce false triggers from intrabar spikes. You often accept a worse price and a larger stop.
- Stop order entry. Place a buy stop above the signal high, or a sell stop below the signal low. You demand follow-through. You avoid guessing. You get more whipsaws in choppy markets.
- Pullback entry. Wait for price to retest the signal zone, such as 50 percent of the signal candle, prior support or resistance, or the breakout level. You improve price and shrink your stop. You risk missing the trade.
Use close confirmation in messy conditions. Use stop orders when the market trends and breaks clean levels. Use pullbacks when the pattern forms at clear structure and the pair often retests.
Stop-loss placement: beyond the wick, beyond structure, and ATR-based alternatives
Your stop must sit where the pattern is invalid. Place it based on price structure, not pain tolerance.
- Beyond the wick. Put the stop a few pips beyond the signal candle wick that defines the rejection. This fits pin bars, hammers, and shooting stars. Add a buffer to cover spread and normal noise.
- Beyond structure. Put the stop beyond the swing high or swing low, or beyond the nearest support or resistance that should hold. This works best for engulfing patterns, inside bars, and breakout retests.
- ATR-based stop. Use a multiple of ATR to avoid getting clipped in high-volatility conditions. Common values sit around 1.0 to 1.5 ATR from your entry, then adjust position size to keep risk fixed.
Rule you can use: if your stop needs to sit beyond a major swing and the distance doubles your usual stop, cut position size or pass. Protect your account first. For stop sizing and position sizing rules, use risk management in forex for beginners.
Profit targets: R-multiples, swing points, and partial take-profits
Set targets before you enter. Do not improvise mid-trade.
- R-multiples. Define 1R as your entry-to-stop distance. Common targets are 1R for quick mean-reversion trades, and 2R to 3R for trend setups. This keeps your process consistent across pairs and timeframes.
- Swing points. Target the next logical barrier, such as the prior swing high or low, a range boundary, or a higher-timeframe support or resistance zone. This matches how price often moves.
- Partial take-profits. Scale out to reduce stress and smooth results. A simple method is to take 50 percent at 1R, then move the stop to break-even or to the last swing. Let the rest run to the next swing level.
Do not force a 3R target into a tight range. If the next swing point sits at 0.8R, you either skip the trade or treat it as a quick scalp with smaller expectations.
Confirmation tools: volume proxies, momentum, and multi-timeframe alignment
Candlesticks show price behavior. Confirmation filters weak signals. Keep your filters limited, or you will hesitate and miss valid setups.
- Volume proxies. Spot participation using tick volume, session timing, and range expansion. Favor signals that form with larger-than-recent candle ranges, or that break levels during active sessions. Avoid signals that form in thin hours if your pair tends to chop.
- Momentum indicators. Use one tool to confirm direction, not to predict tops and bottoms. Examples include RSI holding above 50 in an uptrend, below 50 in a downtrend, or MACD histogram expanding in the trade direction. If momentum diverges hard against your setup, reduce size or skip.
- Multi-timeframe alignment. Trade patterns in the direction of the higher-timeframe trend and structure. If you enter on H1, check H4 or D1. You want your pattern to form at a level that matters on the higher chart, not in the middle of nowhere.
A simple rules-based plan for beginners: one strategy template
Use one pattern, one market condition, one entry method. Track results for at least 30 trades before you change rules.
- Market filter. Trade liquid pairs. Trade during your chosen session. Skip major news spikes.
- Trend filter. On H4, price must print higher highs and higher lows for longs, or lower highs and lower lows for shorts. Mark the nearest H4 support or resistance.
- Setup. On H1, wait for a bullish engulfing at H4 support for a long, or a bearish engulfing at H4 resistance for a short. The signal candle must close back inside the level after a probe.
- Entry. Place a stop order 1 to 2 pips above the engulfing high for longs, or below the engulfing low for shorts. If the entry triggers more than one candle later, cancel it.
- Stop. Put the stop a few pips beyond the signal wick, or beyond the nearest swing point if it sits further. Do not tighten it after entry.
- Target. Take 50 percent off at 1R. Move stop to break-even only after 1R hits. Target the next H4 swing point with the remainder, or exit at 2R if no clean level sits ahead.
- Invalidation. If price closes back through the level against you on H1, exit. Do not wait for hope.
- Journal. Record screenshot, entry type, stop method, R result, and whether you followed rules.
Pattern quality scoring: how to filter low-grade setups
Location scoring, where the pattern forms matters most
A clean candlestick pattern in the wrong place is noise. Score location first. If location fails, skip the trade.
- Support and resistance. Give the highest score when the pattern forms at a level that price has respected at least 2 times, with clear swing highs or lows on H4 or D1.
- Trendlines. Score only if the line connects at least 2 clean touches and the current touch aligns with a prior swing point. Ignore forced lines.
- Range extremes. Score high when the pattern prints at the top or bottom 20 percent of a well-defined range. Avoid the range middle.
- Space. Prefer trades with room to the next obstacle. If the next H4 level sits inside 1R, downgrade the setup.
Candle anatomy thresholds, define what counts
Do not label every pin bar or engulfing candle as valid. Use hard thresholds.
- Body size. Reject tiny bodies in the middle of traffic. For reversal candles, the body should be at least 25 percent of the full candle range.
- Wick dominance for pin bars. The dominant wick should be at least 2 times the body. The opposite wick should be small, ideally less than the body.
- Engulfing rules. The real body should engulf the prior real body. Bonus if it also engulfs the prior candle range, but do not require it.
- Relative size. The signal candle range should be at least 1.2 times the average range of the last 10 candles on the same timeframe. If it matches recent small candles, downgrade it.
- Close location. For bullish signals, the close should sit in the top 30 percent of the candle range. For bearish, the bottom 30 percent.
Confluence checklist, stack simple filters
Use a short checklist. You want alignment, not complexity.
- Trend. Trade with the H4 trend unless you trade a clear range extreme. If trend and idea conflict, cut the score.
- Level. The pattern must react at a marked level, not near it. If your stop sits inside the level zone, the level is not clean.
- Pattern. Prefer one strong signal over multiple weak ones. If you need to argue for the pattern, it fails.
- Volatility. Avoid signals during dead volatility. Also avoid oversized spikes that print far beyond recent range unless you trade news and plan for slippage.
- Session. Give more weight to London and New York signals. Downgrade patterns that form late New York or deep Asia unless the pair moves well in that session.
Common invalidation signs, exit before damage grows
- Weak follow-through. Price fails to move away from the level within the next 1 to 3 candles on your entry timeframe. Your edge depends on fast response.
- Immediate rejection. The next candle rejects your direction and closes back inside the signal candle range. Treat it as a warning, downgrade future attempts at the same level.
- Whipsaws around the level. Multiple closes across the level on H1. That level is not controlling price. Stand down.
- Stop magnet structure. Obvious equal highs or lows sit just beyond the level and price keeps probing them. Wait for the sweep and reclaim, or skip it.
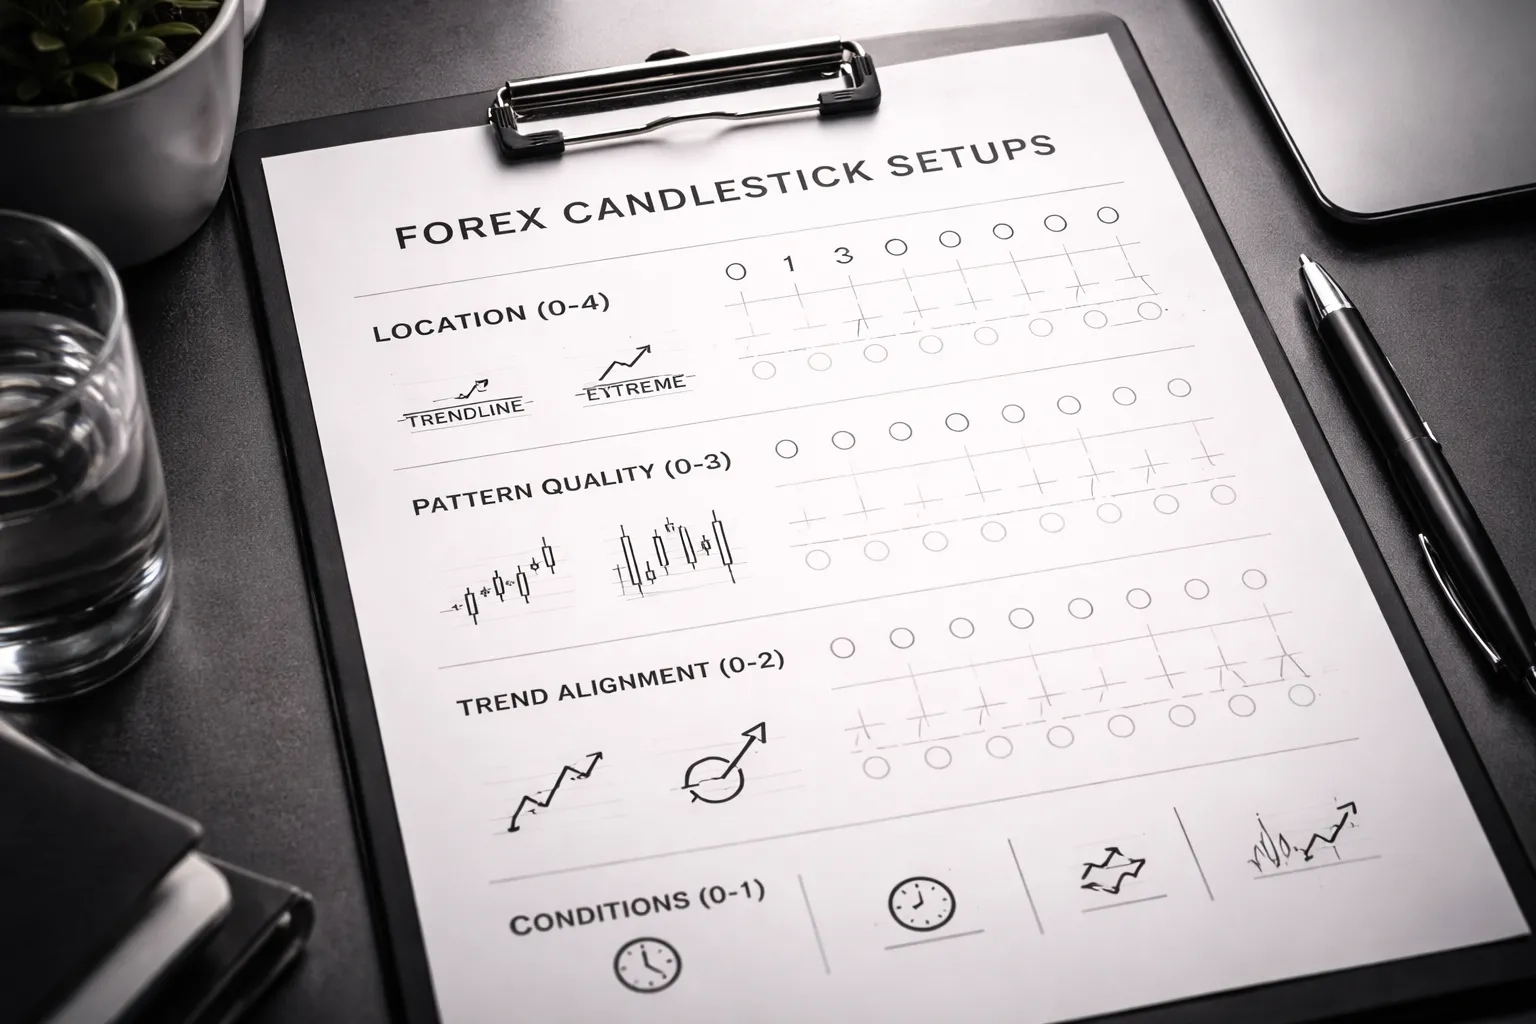
A beginner-friendly 0 to 10 scoring rubric
Score each setup the same way. Trade only what meets your minimum score.
| Category | Points | How to score |
|---|---|---|
| Location | 0 to 4 | 4 at major H4 or D1 level or range extreme. 2 at minor level. 0 in the middle of nowhere. |
| Pattern quality | 0 to 3 | 3 meets anatomy thresholds and stands out vs last 10 candles. 1 looks average. 0 is small or messy. |
| Trend alignment | 0 to 2 | 2 with H4 trend. 1 neutral. 0 against trend without a clear range extreme. |
| Conditions | 0 to 1 | 1 during liquid session with normal volatility. 0 during dead hours or unstable spikes. |
- 7 to 8. Valid. Use smaller size until your journal proves it works.
- 9 to 10. Best setups. These should dominate your trading log.
If you want a repeatable framework to pair with this scoring, use a simple rules-based day trading forex strategy for beginners and apply the same rubric to every entry.
The best timeframes and currency pairs for candlestick patterns
Lower vs higher timeframes
Timeframe choice changes everything. Noise, spread cost, and signal quality all shift.
- Lower timeframes (M1 to M15). You see more patterns, but most are noise. Spreads take a bigger share of your target. Small wicks and micro swings can fake a clean setup.
- Mid timeframes (H1 to H4). You get fewer signals, but they form around clearer intraday structure. Spread impact drops because your average move is larger.
- Higher timeframes (Daily). You get the cleanest candles. Patterns carry more weight, but you wait longer. Stops often need to be wider, so position size must be smaller.
For beginners, reliability matters more than frequency. Your edge comes from repeatability, not from constant action.
Suggested starting points for learning
- H1. Good for learning session behavior and timing. Most major pairs print enough setups to study without forcing trades.
- H4. Good for cleaner signals and less screen time. Many false patterns disappear on this chart.
- Daily. Best for pattern clarity. You can review once per day and focus on execution quality.
Start with one timeframe and stay there for at least 50 to 100 logged trades. Jumping timeframes makes your results hard to trust and pulls you toward impulsive entries. If that is a problem for you, read this guide on how to avoid overtrading forex.
Major pairs vs minors and exotics
Candlestick patterns work best where pricing is tight and fills are clean.
- Majors. EURUSD, USDJPY, GBPUSD, AUDUSD, USDCAD, USDCHF. These usually give the lowest spreads and the most consistent liquidity. Your patterns have a better chance to play out without slippage ruining the entry.
- Minors. Crosses like EURJPY or GBPJPY can move well, but spreads are wider and spikes show up more often. You must demand stronger confirmation and use wider stops.
- Exotics. Pairs like USDTRY or USDZAR often show large gaps, wide spreads, and sharp news jumps. A perfect pin bar can fail from one liquidity sweep. Skip these until your stats are proven on majors.
If you want a simple default, pick one major pair and learn how it behaves across London and New York. Add a second pair only after your journal shows stable results.
Adapting patterns to volatility regimes
Patterns do not mean the same thing in calm and fast markets. You must adjust your filters.
- Calm markets. Candles are smaller and ranges compress. Favor reversal patterns at clear support and resistance. Reduce profit targets. Be strict with location, because the follow-through can be limited.
- Fast markets. Ranges expand and wicks get longer. Demand more room to the next level, because price can hit both sides. Use smaller size, wider stops, and fewer trades. Avoid taking patterns right before high impact news.
- Session effects. The same pair can look clean in London and messy in late Asia. Log the session for every trade, then compare results.
Backtesting guidance that gives usable data
You need enough trades to separate luck from skill.
- Sample size. Aim for at least 100 examples of one pattern on one pair and one timeframe. If you cannot reach 100, you do not have confidence, you have a story.
- Rules first. Define entry, stop, target, and invalidation. Keep them fixed during the test. Change one variable at a time only after you finish a full sample.
- Avoid cherry-picking. Do not scroll and select only clean charts. Go candle by candle. Mark every valid setup, then record the outcome.
- Journal fields. Pair, timeframe, session, pattern type, trend context, distance to next level, stop size in pips, result in R, and notes about execution.
Your goal is simple. Prove which pair and timeframe combo gives you the highest average R with the lowest drawdown. Then trade that and ignore the rest.
Risk management and psychology (what competitors often underteach)
Position sizing basics, fixed % risk beats pattern selection
Your candlestick pattern does not control your results. Your position size does.
Use a fixed percent risk per trade. Most beginners stay in the 0.25% to 1% range. Pick one number and keep it constant while you collect data.
Calculate size from the stop, not from how confident you feel.
- Account risk: balance x risk % = dollars you can lose.
- Stop size: entry to stop in pips, based on the candle structure and your invalidation point.
- Position size: account risk divided by stop value.
This keeps every trade comparable in your journal. It also keeps a losing streak from ending your account.
Risk-to-reward realities, take trades that can pay for losses
Your win rate will fluctuate. Your average R decides if you survive that fluctuation.
Set a minimum R rule before you enter. Many beginners use 1.5R to 2R. Do not force it. If structure does not allow it, skip the trade.
Use the next level as your reality check. If price will likely hit a major support or resistance before your target, the trade does not have room.
Learn the math and apply it the same way every time. Use risk-reward ratio rules that match your stop placement and market structure.
| Win rate | Avg win | Avg loss | Break-even |
|---|---|---|---|
| 40% | 2R | 1R | Profitable |
| 50% | 1R | 1R | Break-even |
| 60% | 1R | 1R | Profitable |
| 45% | 1.2R | 1R | Often negative after costs |
Costs push the break-even line up. Spreads, commission, and slippage matter more on lower timeframes.
Avoiding overtrading, stop hunting for patterns
Beginners lose money by taking too many trades. Pattern lists make this worse.
Limit your decision points. Set rules that reduce screen time and force selectivity.
- Pattern cap: trade only 1 to 3 patterns you tested, ignore the rest.
- Trade cap: max 1 to 3 trades per day, or 5 to 10 per week.
- Loss cap: stop for the day at -2R, stop for the week at -5R.
- Time cap: review and trade only one session, London or New York.
These limits protect you from taking marginal setups after you miss a move.
Managing drawdowns, follow the plan and log the real mistake
Drawdowns come from normal variance and from bad execution. Your journal must separate them.
Track two numbers.
- System drawdown: losing streaks that followed rules.
- Execution drawdown: losses caused by breaking rules.
When drawdown hits your limit, reduce risk. Do not change patterns mid-sample.
- At -5R from peak, cut risk in half.
- At -10R from peak, stop live trading and replay trade until execution is clean again.
Journal the mistake in plain terms. Late entry. Early exit. Moved stop. Traded into news. Traded outside your session. If you cannot name it, you cannot fix it.
Beginner pitfalls, costs and emotions destroy good setups
- Ignoring spreads: a tight stop on a high spread pair turns a valid candle into a random stop-out. Record spread at entry in your notes.
- Ignoring swaps: holding positions overnight can bleed R on some pairs. Check swap before you commit to multi-day holds.
- Moving stops: widening a stop breaks your sizing math. It turns a 1R loss into a larger loss without adding edge.
- Revenge trading: after a loss you will want a fast win. Your rules must block this. Use a cooldown, 30 minutes or one full candle close.
- Target fiddling: cutting winners early to feel safe kills expectancy. Exit rules must stay fixed during testing.
Protect your process. Candlestick patterns give you entries. Risk management and psychology keep you in the game long enough for the edge to show up.
Realistic examples and practice workflow (learn faster)
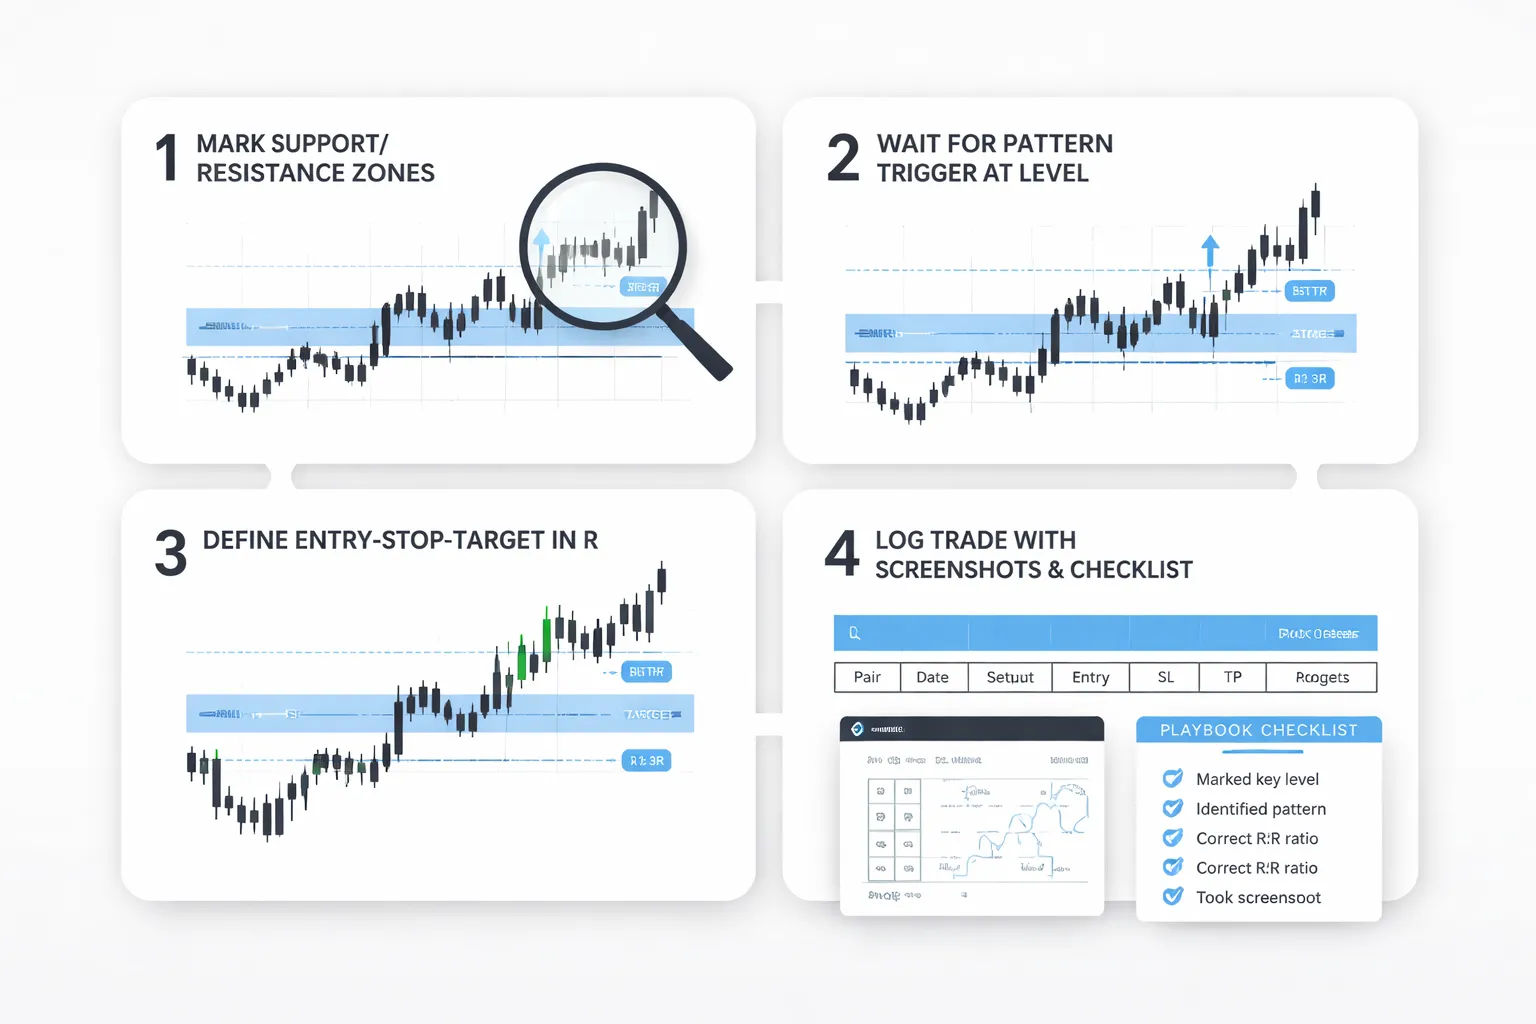
Step-by-step chart walkthrough, from level marking to execution plan
Use one market and one timeframe for practice. Start with EURUSD on H1 or H4. Keep it simple.
- Step 1, pick your session: London or New York. Avoid the dead hours. You want clean candles and follow-through.
- Step 2, mark levels: Zoom out 200 to 500 candles. Mark the last 3 to 5 clear swing highs and swing lows. Mark round numbers if price reacts there.
- Step 3, define the “area”: Draw a zone, not a thin line. Use the candle bodies and wicks that caused the turns. Keep zones tight.
- Step 4, wait for location: Ignore patterns in the middle of nowhere. Only pay attention when price returns to your zone.
- Step 5, require a trigger candle: Use one pattern rule set. Example, bullish engulfing at support. The engulfing body must close above the prior candle body. The close matters more than the wick.
- Step 6, write the trade plan before entry: Entry, stop, take profit, and management rules. No edits after you click.
- Step 7, place the stop where the idea breaks: For a bullish setup, the stop goes below the swing low or below the pattern low, plus a small buffer. Learn the mechanics in this stop-loss placement guide.
- Step 8, set targets with structure: First target at the next opposing swing. Second target at the next major level. Do not “hope” for more.
- Step 9, define invalidation and exit: If price closes back inside the zone against you, you exit. If it hits your stop, you accept it.
Example workflow, bullish engulfing at support on H1. Price drops into a prior swing low zone. You wait. A bullish engulfing candle closes and fully covers the prior bearish body. You enter at the close or on a small pullback. Stop sits below the engulfing low. Target sits at the last lower high. You risk 1R. You do not change the target mid-trade.
Practice routine, replay mode, screenshot library, and annotation method
You learn fastest when you train like a lab test. Same inputs. Same rules. Clean notes.
- Replay mode: Hide the future. Scroll back 2 to 3 months. Replay candle by candle. Only take trades that meet your written rules.
- Daily reps: 20 to 30 pattern “events” per day. An event means price reaches a marked zone and prints a trigger candle. Some events become trades, most do not.
- Screenshot library: Save two screenshots per event. One at entry decision. One at exit. Name files with date, pair, timeframe, pattern, and result in R.
- Annotations: Mark the zone, the trigger candle, entry, stop, targets, and session. Add one sentence for why you took it and one sentence for why you skipped other signals.
- One metric that matters: Track R, not pips. This keeps results comparable across pairs and timeframes.
| Log field | What you record |
|---|---|
| Setup | Pattern name, timeframe, session, zone type (support or resistance) |
| Location | Nearest swing level, distance to level, trend direction on your timeframe |
| Execution | Entry type (close or limit), stop placement rule used, target rule used |
| Result | R gained or lost, max adverse excursion, max favorable excursion |
| Quality | A grade from A to C based on rule compliance, not outcome |
Creating a personal pattern playbook with do and don’t examples
Your playbook limits choice. It keeps you from pattern hunting. Start with 2 to 3 patterns. Build from proof.
- Pick your patterns: Example set for beginners, pin bar rejection, engulfing, and inside bar breakout. Do not add more until you log 100 events.
- Define “must have” rules: Location at a pre-marked zone. Clear close signal. Minimum candle size relative to the last 10 candles.
- Define “must not” rules: No trades into the next level if reward is under 1.5R. No trades during major news spikes. No trades when spread widens.
- Add do examples: Two screenshots that show perfect location, clean trigger, and space to target.
- Add don’t examples: Two screenshots that show the same pattern in bad location, or with no room to target, or against strong momentum.
Playbook format, one page per pattern. Include a checklist you can read in 10 seconds. If one item fails, you skip.
Demo vs live trading, when to switch and how to scale risk gradually
Demo teaches execution. Live teaches discipline. Switch only when your process is stable.
- Stay on demo until: You log at least 50 trades with the same rules, and you follow your stops and targets with near-perfect compliance.
- Go live small: Start at 0.25% risk per trade. Keep the same rules. Your job is to trade the plan, not to make income.
- Scale by behavior, not by profit: Increase risk only after 30 live trades with full rule compliance. Move from 0.25% to 0.5%, then 0.75%, then 1%.
- Set a hard loss limit: Stop trading for the day at minus 2R or after 2 consecutive losses. This blocks tilt.
- Keep the same market and timeframe: Do not “fix” a drawdown by switching pairs or adding indicators.
If you feel the urge to move stops or take profits early, your size is too big. Cut risk. Protect the sample size. The edge shows up only after many trades.
FAQ
What is a candlestick in forex?
A candlestick shows one period of price action. It prints the open, high, low, and close. The body shows open to close. The wicks show the extremes. You read it on any timeframe, from 1 minute to 1 week.
Which candlestick patterns should beginners learn first?
Start with a short list. Pin bar (hammer and shooting star), engulfing, inside bar, and doji. Learn them on one pair and one timeframe. Master location first, then add only one filter.
Do candlestick patterns work alone?
No. You need context. Trade patterns at clear support and resistance, after a strong move, or at range extremes. Skip patterns in the middle of noise. Use a rule-based entry, stop, and target.
What timeframe is best for candlestick patterns in forex?
Use H1, H4, or D1 when you start. You get cleaner structure and fewer false signals. Lower timeframes add spread and noise. Pick one timeframe and stay with it for a large sample.
How do you confirm a candlestick pattern?
Use price, not extra indicators. Confirm with a close beyond the pattern, a break of a nearby swing, or a retest that holds. If the next candle rejects the level, you have stronger confirmation.
Where should you place a stop loss for candlestick trades?
Place the stop beyond the pattern invalidation point. For a hammer, below the low. For a shooting star, above the high. Add a small buffer for spread. Do not move the stop after entry.
What is the best take profit method for these patterns?
Use structure. Target the next swing high or low, or the next major level. Keep R:R at least 1:1. If the move is strong, scale out and trail behind new swings.
What mistakes cause most losses with candlestick patterns?
You trade every pattern. You ignore trend and levels. You use stops that are too tight. You increase size after losses. You change pairs and timeframes mid-sample. Fix these before you add more patterns.
Are candlestick patterns reliable in ranging markets?
They work best at range edges. Use reversal patterns near clear support and resistance. Avoid signals in the middle of the range. Treat breakouts with caution unless you get a close and retest.
How many trades do you need to test a candlestick setup?
Aim for at least 50 to 100 trades per setup, per pair, per timeframe. Track win rate, average R, and max drawdown. Do not judge a setup after 10 trades. Protect the sample size.
What is a safe risk per trade for beginners?
Risk 0.25% to 1% per trade. Use a hard daily loss limit. Stop after 2 consecutive losses. If you feel stress, cut risk. For more rules, read risk management in forex for beginners.
Conclusion
Conclusion
Candlestick patterns help you spot intent. They do not predict the next candle with certainty. Your edge comes from context, rules, and execution.
- Limit your pattern list. Trade 2 to 4 setups. Define the exact candle structure and the exact trigger.
- Use location filters. Trade patterns at clear swing highs and lows, after an impulse move, or at key support and resistance. Skip patterns in the middle of noise.
- Define exits before entry. Place the stop at a logical invalidation level. Set a fixed target or manage by R multiples. Do not move stops to avoid being wrong.
- Log everything. Track pair, session, timeframe, entry trigger, stop size, R result, and notes. Review every 20 to 50 trades.
- Protect risk. Keep risk at 0.25% to 1% per trade. Use a daily loss limit. Stop after 2 consecutive losses.
Final tip. Pick one pattern, one timeframe, and one pair. Backtest 100 trades. Trade it small for another 50. If the stats hold, scale slowly. If you need a refresher on candle structure, read the forex candlestick charts beginner guide.
-
Stop Loss vs Take Profit: Differences, Examples & Best Practices
4 months ago -
Forex Order Types Explained: Market vs Limit vs Stop Orders
4 months ago -
How to Set Stop Loss and Take Profit (Step-by-Step)
4 months ago -
How to Start Forex Trading Step by Step (Beginner Roadmap)
4 months ago -
Risk Management in Forex for Beginners (Rules That Keep You in the Game)
4 months ago
-
- Bullish engulfing and bearish engulfing, strength criteria and common traps
- Piercing line and dark cloud cover, confirming a potential turn
- Harami and harami cross, consolidation vs reversal interpretations
- Tweezer top and tweezer bottom, identifying double-rejection at a level
- Kicker-type moves, when gaps are rare in FX and how to interpret impulse candles instead
-
- Rising three methods and falling three methods, identifying healthy pullbacks
- Inside bar sequences, volatility contraction and breakout planning
- Bullish and bearish belt hold, separating real trend strength from noise
- Separating lines concept, distinguishing pause from reversal
- When continuation patterns fail, late-trend signals and exhaustion risk
-
- Entry styles: close confirmation, stop orders, and pullback entries
- Stop-loss placement: beyond the wick, beyond structure, and ATR-based alternatives
- Profit targets: R-multiples, swing points, and partial take-profits
- Confirmation tools: volume proxies, momentum, and multi-timeframe alignment
- A simple rules-based plan for beginners: one strategy template
-
- What is a candlestick in forex?
- Which candlestick patterns should beginners learn first?
- Do candlestick patterns work alone?
- What timeframe is best for candlestick patterns in forex?
- How do you confirm a candlestick pattern?
- Where should you place a stop loss for candlestick trades?
- What is the best take profit method for these patterns?
- What mistakes cause most losses with candlestick patterns?
- Are candlestick patterns reliable in ranging markets?
- How many trades do you need to test a candlestick setup?
- What is a safe risk per trade for beginners?
-
How to Place a Forex Trade Step by Step (Your First Trade Explained)
2 months ago -
Forex Trading vs Crypto Trading: Which Market Is Better for Beginners?
2 months ago -
Forex Lot Size Calculator: How to Use It to Size Trades Correctly
4 months ago -
How to Calculate Position Size in Forex (Position Sizing Formula + Examples)
4 months ago -
Forex Leverage Explained: How It Works, Pros, Cons & Examples
4 months ago
-
Is Forex Trading Legal in the United States? Rules, Regulators & What to Know
4 months ago -
Forex Market Hours & Trading Sessions Explained (Best Times to Trade)
4 months ago -
Forex Trading Platforms Comparison: MetaTrader vs cTrader vs TradingView
4 months ago -
Forex Leverage Explained: How It Works, Pros, Cons & Examples
4 months ago -
What Is a Lot Size in Forex? Lot Types + Quick Examples
4 months ago