Fibonacci Retracement in Forex: How to Draw It and Use It to Trade

Fibonacci retracement is a chart tool that marks likely pullback levels after a strong move. Forex traders use it to plan entries, stops, and profit targets around common ratios like 38.2%, 50%, and 61.8%.
In this guide, you will learn how to draw Fibonacci retracement on any platform, in both uptrends and downtrends. You will learn which swing points to use, which levels matter most, and how to confirm a level with price action. You will also learn simple trade setups, where to place stop-loss orders, and how to map targets using a clear risk-reward ratio.
Key Takeaways
- In het kort: Draw Fibonacci from swing low to swing high in an uptrend, and from swing high to swing low in a downtrend.
- In het kort: Focus on the levels traders respect most, 38.2%, 50%, and 61.8%.
- In het kort: Use Fibonacci as a zone, not a single price.
- In het kort: Wait for confirmation, strong rejection, a clear candle close back in trend direction, or a break of a minor structure level.
- In het kort: Place your stop beyond the swing point or beyond the retracement zone that invalidates your setup, not inside the level.
- In het kort: Set targets using structure and extensions, and keep a defined risk to reward before you enter.
Pick clean swing points. The more obvious the swing, the more useful your levels.
Do not stack levels. If multiple retracements overlap, treat it as one decision zone and demand stronger confirmation.
Use Fibonacci with trend and structure. Trade pullbacks in the trend direction, avoid countertrend trades unless you have a clear reversal signal.
Keep risk fixed. Size your position from your stop distance and your account rules, see risk management basics.
What Is Fibonacci Retracement in Forex (and Why Traders Use It)
The core idea, measure a pullback inside a trend
Fibonacci retracement is a tool you use to map likely pullback zones after a strong move.
You draw it on a clear swing, from swing low to swing high in an uptrend, or swing high to swing low in a downtrend.
The tool then plots percentage pullbacks of that swing. Traders use those levels to plan entries, stops, and targets around structure.
In trend trading, the job is simple, find where price can pull back and still keep the trend intact.
Key levels explained
Most platforms show the same cluster of levels. Treat them as zones, not single prices.
- 23.6%, shallow pullback. Shows strong momentum. Often works in fast trends, often fails in choppy markets.
- 38.2%, common pullback depth in healthy trends. Often aligns with prior minor structure.
- 50%, not a Fibonacci ratio, but widely used. Many swings retest the midpoint before continuing.
- 61.8%, the key level most traders watch. A clean hold often signals trend continuation. A clean break often signals weakening structure.
- 78.6%, deep pullback. Continuation can still happen, but you need stronger confirmation because you sit closer to invalidation.
Your best levels are the ones that align with market structure, prior highs and lows, session levels, and clean trendlines. Use your fib as a measurement tool, not as a signal by itself. Trendlines help you filter the setup, see this trendlines step by step guide.
Retracement vs extension, when each tool applies
Use retracements when price pulls back after an impulse move.
Use extensions when price breaks past the prior swing high or low and you need objective target levels.
- Retracement, helps you plan where to buy a dip in an uptrend or sell a rally in a downtrend.
- Extension, helps you project where the next leg may pause, commonly 127.2%, 161.8%, and 200% of the prior swing.
Simple workflow, pick the swing, mark the pullback zone with retracement levels, then project targets with extensions after the breakout and continuation.
What Fibonacci can and cannot predict in FX markets
Fibonacci does not predict direction. It does not tell you the trend is real. It does not guarantee a bounce.
It can help you standardize your decisions.
- It can do, give you repeatable pullback depths, improve consistency in entries and stops, and help you compare setups across pairs and timeframes.
- It cannot do, protect you from news spikes, stop hunts, liquidity gaps, or regime shifts. It also cannot replace structure, trend, and confirmation.
In forex, order flow clusters around obvious reference points. Fib levels often become those reference points because many traders watch them. That is the edge, you trade a known decision zone with defined invalidation, not a magic number.
Before You Draw: Identify the Right Market Conditions
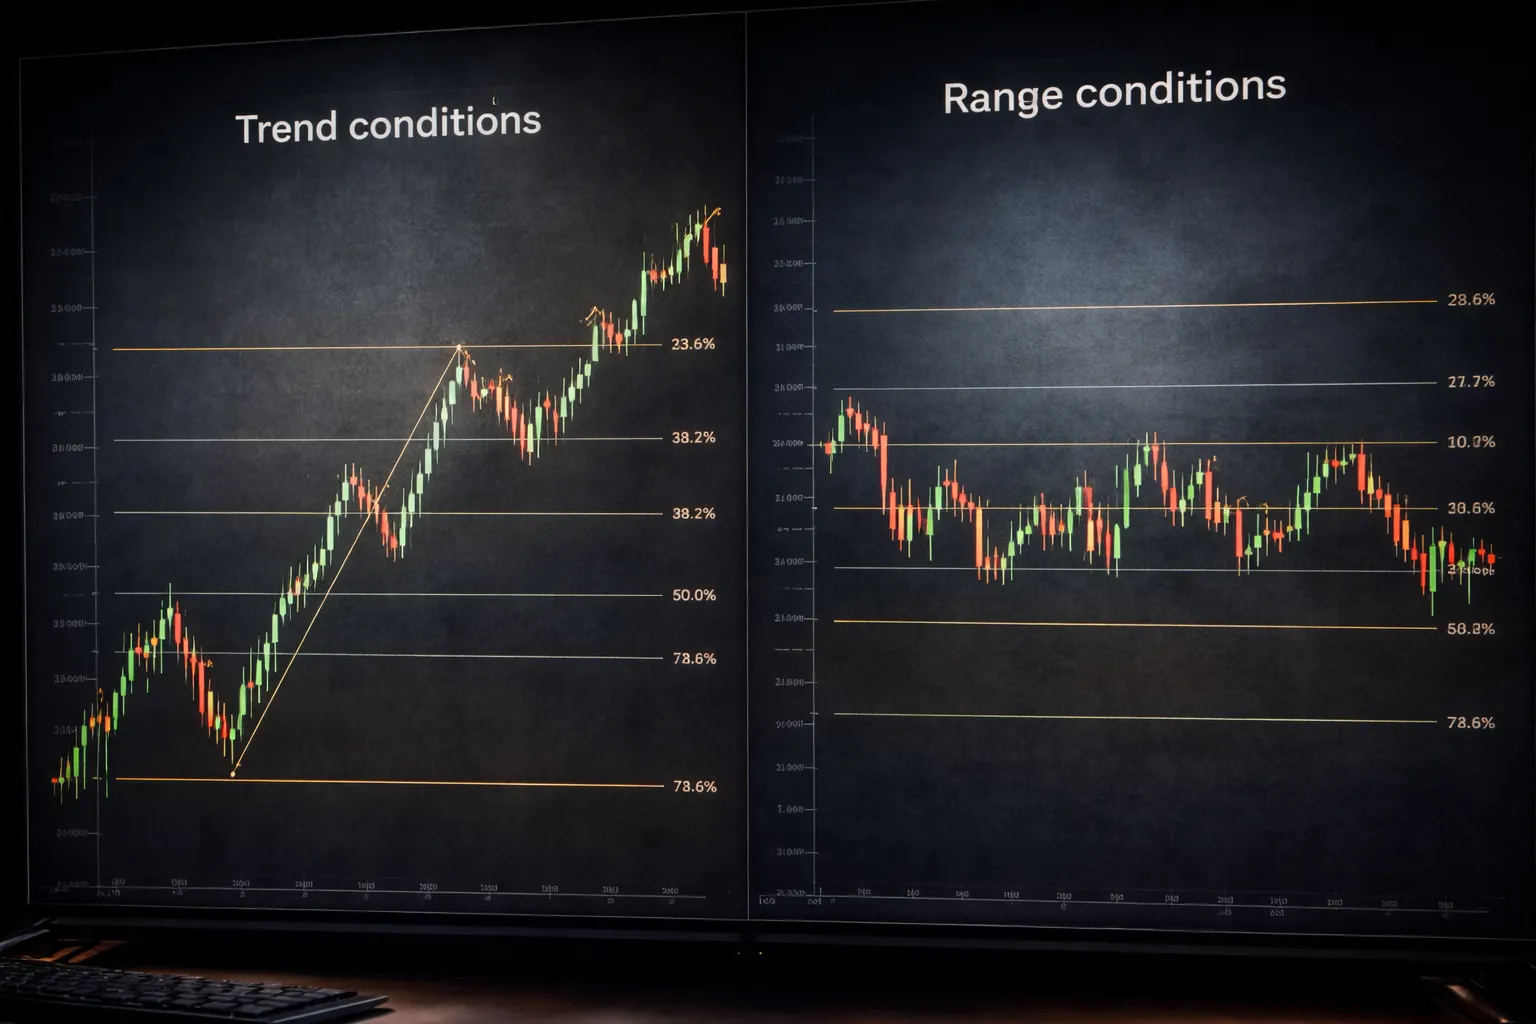
Trending vs ranging markets, fib works better in trends
Fibonacci retracement works best when price trends, pulls back, then continues. In a trend, most pullbacks stay inside a recent impulse leg. That gives you clean reference points and clear invalidation.
In a range, swings overlap. Price cuts through levels, then returns. Fib levels stop acting like decision zones and start acting like random lines.
- Trend conditions: Higher highs and higher lows in an uptrend, lower lows and lower highs in a downtrend. Pullbacks are smaller than the impulse leg.
- Range conditions: Repeated failure at the same ceiling and floor. Many wicks. No progress after break attempts.
- Best use case: Trending market, first or second pullback after a breakout or a strong impulse.
- Weak use case: Late trend with multiple deep pullbacks, or a tight range with frequent false breaks.
Use structure first. Fib should sit on top of it, not replace it. If you need a clean way to map structure zones, use your core support and resistance levels first, then add fib.
Define a valid swing high and swing low, structure rules
You need a clear impulse leg. Draw fib only when the swing points meet strict rules. If you cannot name the swing, do not draw.
- Valid swing low in an uptrend: A low that leads to a break above the prior swing high. The market proves the low matters by taking out a prior high.
- Valid swing high in a downtrend: A high that leads to a break below the prior swing low. The market proves the high matters by taking out a prior low.
- Impulse leg requirement: A strong move with distance and clean candles, followed by a pause or pullback. Avoid legs made of chop.
- Confirmation requirement: The swing should be obvious on your chosen timeframe. If it only appears after you zoom in, it is weak.
In an uptrend, you draw from the swing low to the swing high of the impulse. In a downtrend, you draw from the swing high to the swing low of the impulse. Keep it tied to the last clear expansion move, not an old move that price has already retraced and rebalanced.
Choose the timeframe, use a top-down process
Start high, then go lower. This keeps your fib aligned with the market you trade inside, not against it.
- Step 1, higher timeframe bias: Mark trend and major swing points on the daily or 4H. Note the last impulse leg that moved structure.
- Step 2, mid timeframe execution map: Drop to 1H or 30M. Refine the same impulse leg and pullback. Keep the swing anchors consistent with the higher timeframe structure.
- Step 3, lower timeframe entry: Use 15M to 5M only to time entries and define tight invalidation. Do not change the fib anchors just to fit a micro move.
If you scalp, you still need higher timeframe context. It stops you from fading a higher timeframe trend with a lower timeframe fib that has no real flow behind it.
Common mistake, forcing fib on choppy price action
Most bad fib trades start with this. You see a move, you want a level, you draw until something lines up. That is curve fitting.
- Chop signs: Many overlapping candles, alternating highs and lows, frequent wick breaks, no clean impulse leg.
- Fib misuse: Redrawing anchors after every candle, using multiple fibs until one level “works”, mixing swing points from different legs.
- What to do instead: Wait for expansion, then a pullback. If price cannot expand and break structure, skip fib and trade the range with range rules.
If your chart looks messy, your fib will look precise but it will trade poorly. Clean structure first. Clean leg second. Fib last.
Fibonacci Retracement Forex: How to Draw It Step by Step
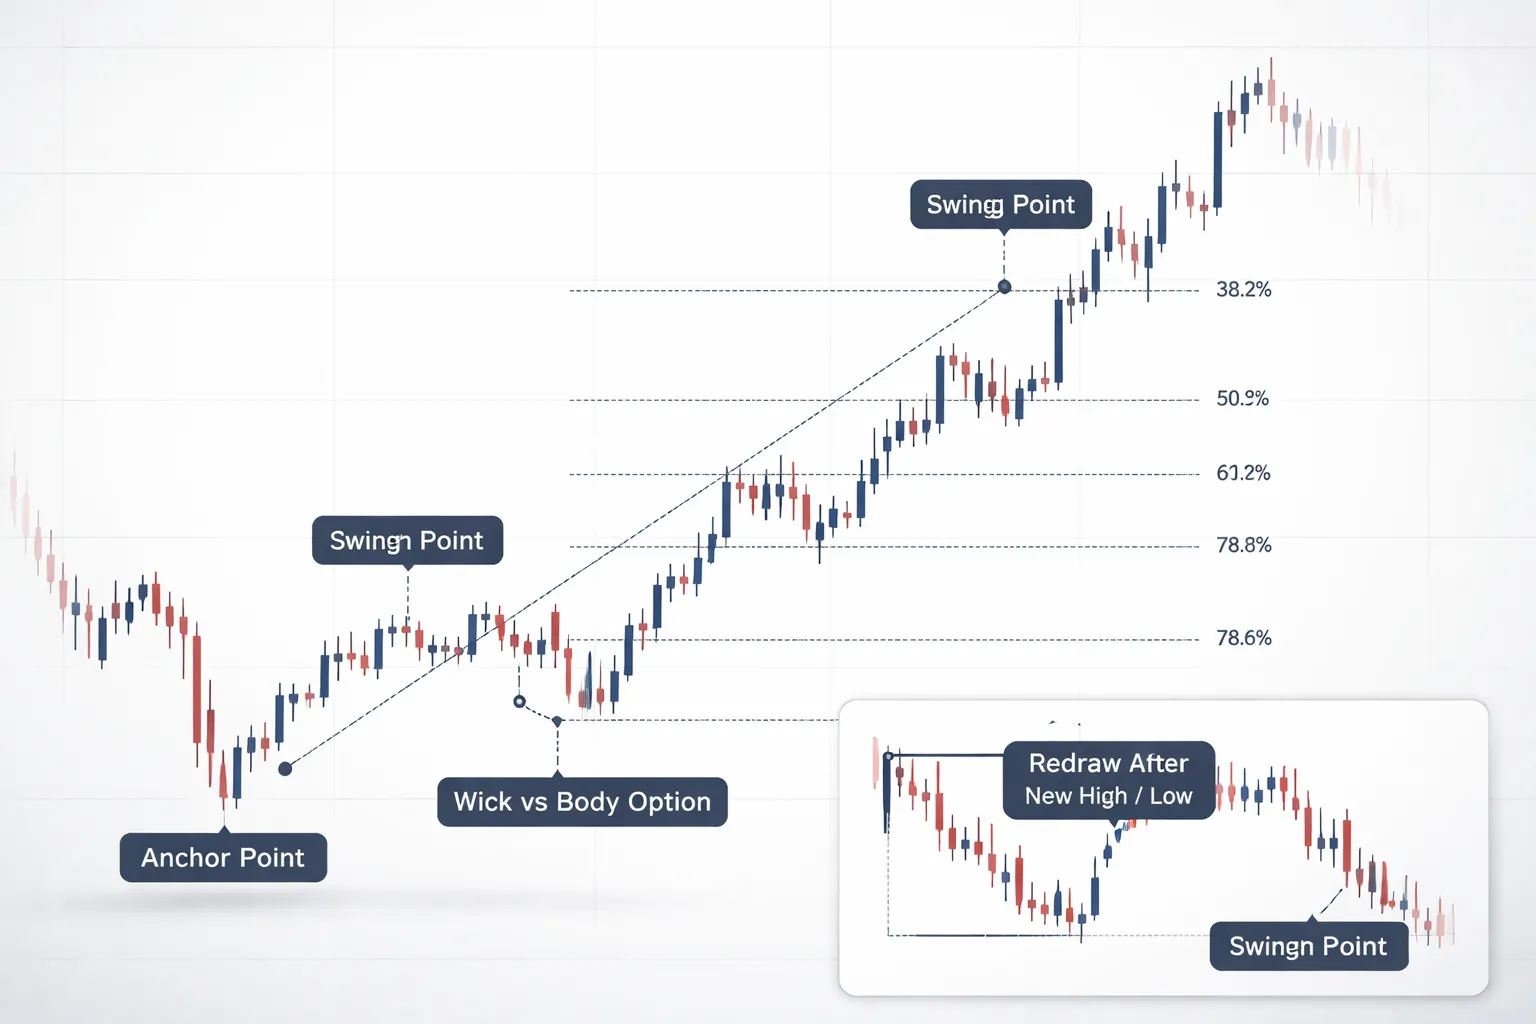
Drawing on an uptrend: anchor points and direction
Draw the fib on the impulse leg, not on the pullback.
- Confirm expansion first. Price breaks the prior swing high and closes above it.
- Mark the swing low that started the move. Use the last clear pivot low before price accelerated.
- Mark the swing high where the impulse leg ended. Use the most recent pivot high before price pulled back.
- Plot the Fibonacci from low to high. Your 0.0 sits at the low, your 100 sits at the high.
- Read retracement levels below the high. Price should pull back into levels like 38.2, 50, and 61.8.
Keep one fib per leg. If you cannot point to the impulse leg in one sentence, skip it.
Drawing on a downtrend: anchor points and direction
Draw the fib on the impulse drop, not on the bounce.
- Confirm expansion first. Price breaks the prior swing low and closes below it.
- Mark the swing high that started the drop. Use the last clear pivot high before price accelerated down.
- Mark the swing low where the impulse leg ended. Use the most recent pivot low before price bounced.
- Plot the Fibonacci from high to low. Your 0.0 sits at the high, your 100 sits at the low.
- Read retracement levels above the low. Price should retrace up into levels like 38.2, 50, and 61.8.
Do not flip anchors to force a level to line up with price. If the leg is unclear, the fib will be noise.
How to handle wicks vs bodies when selecting swing points
Pick one rule and keep it consistent across your chart.
- Default rule: anchor to wick extremes. Forex is liquid, stops run, wick highs and lows often matter.
- Use bodies when: the move has repeated long wicks from news spikes or session opens, and closes show the real acceptance level.
- Do not mix: wick low with body high, or body low with wick high. Your levels will shift and your backtesting will lie.
- Quick check: if price reacts at a level but closes through it with no respect, your anchor choice is likely wrong for that leg.
When in doubt, anchor to wicks, then require a close back in your favor before you treat the level as support or resistance.
Adjusting when a new high or low forms: when to redraw
Redraw only when the impulse leg changes.
- Redraw if price makes a new swing high during the same impulse up leg: move the 100 anchor to the new high.
- Redraw if price makes a new swing low during the same impulse down leg: move the 100 anchor to the new low.
- Do not redraw during the pullback: the whole point is to measure that pullback against a fixed impulse leg.
- Stop using the fib if structure breaks: in an uptrend, price closes below the swing low that defined the impulse. In a downtrend, price closes above the swing high that defined the impulse.
- One leg, one fib: once a new impulse starts and breaks structure again, create a new fib for the new leg.
Frequent redraws usually signal you are trading chop. Fix structure first, then measure.
Platform walkthrough checklist (MT4, MT5, TradingView tool settings)
- Select the Fibonacci Retracement tool.
- Snap anchors to your chosen rule, wick or body. Keep it consistent.
- Set the direction correctly. Uptrend fib goes low to high. Downtrend fib goes high to low.
- Use a clean level set. Keep only what you trade.
- Label levels with both percent and price.
- Make lines thin and readable. Avoid stacking multiple fibs.
| Platform | Steps | Settings to check |
|---|---|---|
| MT4 |
|
|
| MT5 |
|
|
| TradingView |
|
|
Keep your process boring. Clean swing points, one leg, one fib, fixed levels. Then execute with discipline and consistent risk rules.
How to Read Fibonacci Levels Like a Price Action Trader
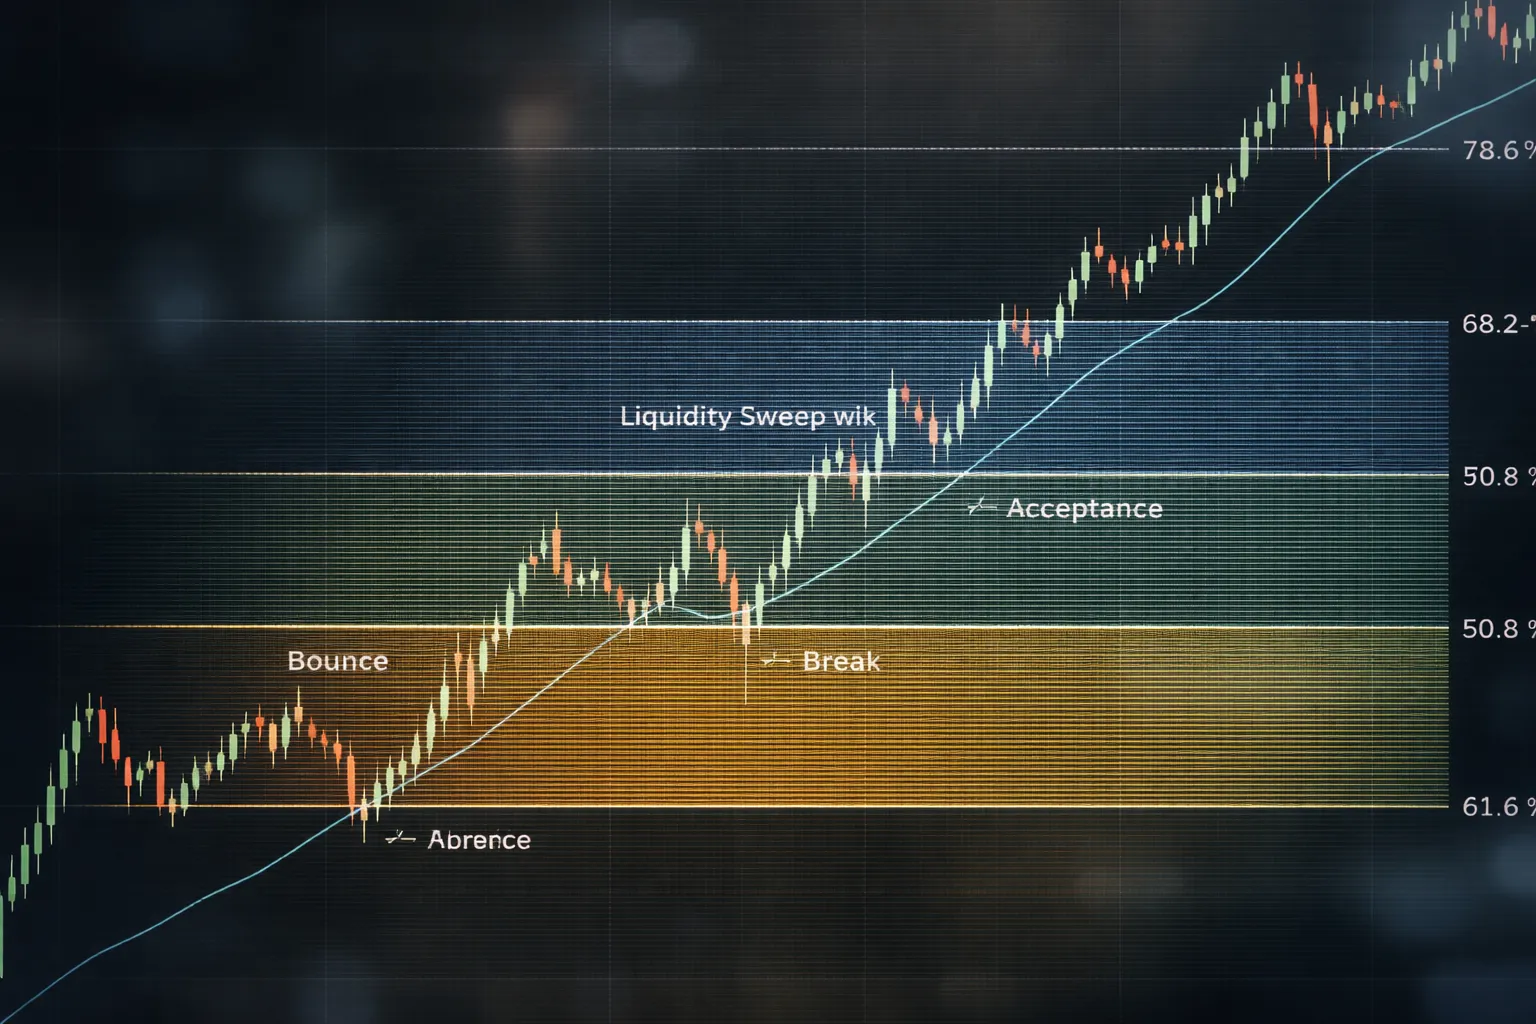
Interpreting reactions: bounce, break, and acceptance
You read Fibonacci levels the same way you read any key price area. You watch how price behaves when it gets there.
- Bounce: Price taps the level and rejects. You see a sharp wick, a quick response candle, or a clean rotation. You want follow-through away from the level, not a one-candle spike.
- Break: Price pushes through the level with strong bodies and little wick. One close through can happen in noise. Two closes through plus continuation matters more.
- Acceptance: Price breaks the level, then trades on the other side. You see multiple closes holding beyond it, and pullbacks fail to reclaim the level. Acceptance turns the level into support or resistance.
Fibonacci is a zone, not a single price
A fib line is a reference. Your execution should use a band.
Build a retracement band by grouping nearby levels and structure.
- 38.2% to 50%: Shallow pullback zone. Works best in strong trends with momentum.
- 50% to 61.8%: Core pullback zone. Often aligns with prior highs or lows and common retest areas.
- 61.8% to 78.6%: Deep pullback zone. Higher reward, lower win rate if you trade it blind.
Define your band with price action. Use the nearest swing high or low, a prior close cluster, or a clean wick shelf. You do not need a tight entry. You need a clean invalidation point.
Use market structure to validate a level
Structure decides if a fib level matters.
- Uptrend validation: You want a clear HH and HL. Price should pull back into a fib band and hold above the last higher low. If price breaks that HL, treat the fib as broken.
- Downtrend validation: You want a clear LL and LH. Price should retrace into a fib band and fail below the last lower high. If price breaks that LH, treat the fib as broken.
Use the fib to mark where the pullback may end. Use structure to decide if the trend still stands. If structure and fib disagree, structure wins.
If you want an extra filter, confirm momentum with MACD signals. Keep it simple. Do not add indicators until you can read the candles.
Spot liquidity grabs and false breaks around 61.8% and 78.6%
Deep levels attract stop runs. Many traders place stops and limit orders around 61.8% and 78.6%. Price often sweeps that liquidity before it moves.
- Liquidity grab signs: Fast push into 61.8% or 78.6%, long wick through the level, then close back inside the band. You often see an immediate opposite candle that engulfs the prior candle or closes strong.
- False break pattern: Price breaks below the fib band, triggers stops, then reclaims the band and holds. The reclaim matters more than the break.
- Acceptance warning: If price breaks 78.6% and then holds below it with multiple closes, do not call it a grab. That is acceptance. Plan for 100% retrace and possible trend failure.
Wait for the reclaim and a clear structure cue. Enter on the retest of the band or on a strong close away from it. Put your stop beyond the sweep point, not on the fib line.
Trading Strategies Using Fibonacci Retracement in Forex
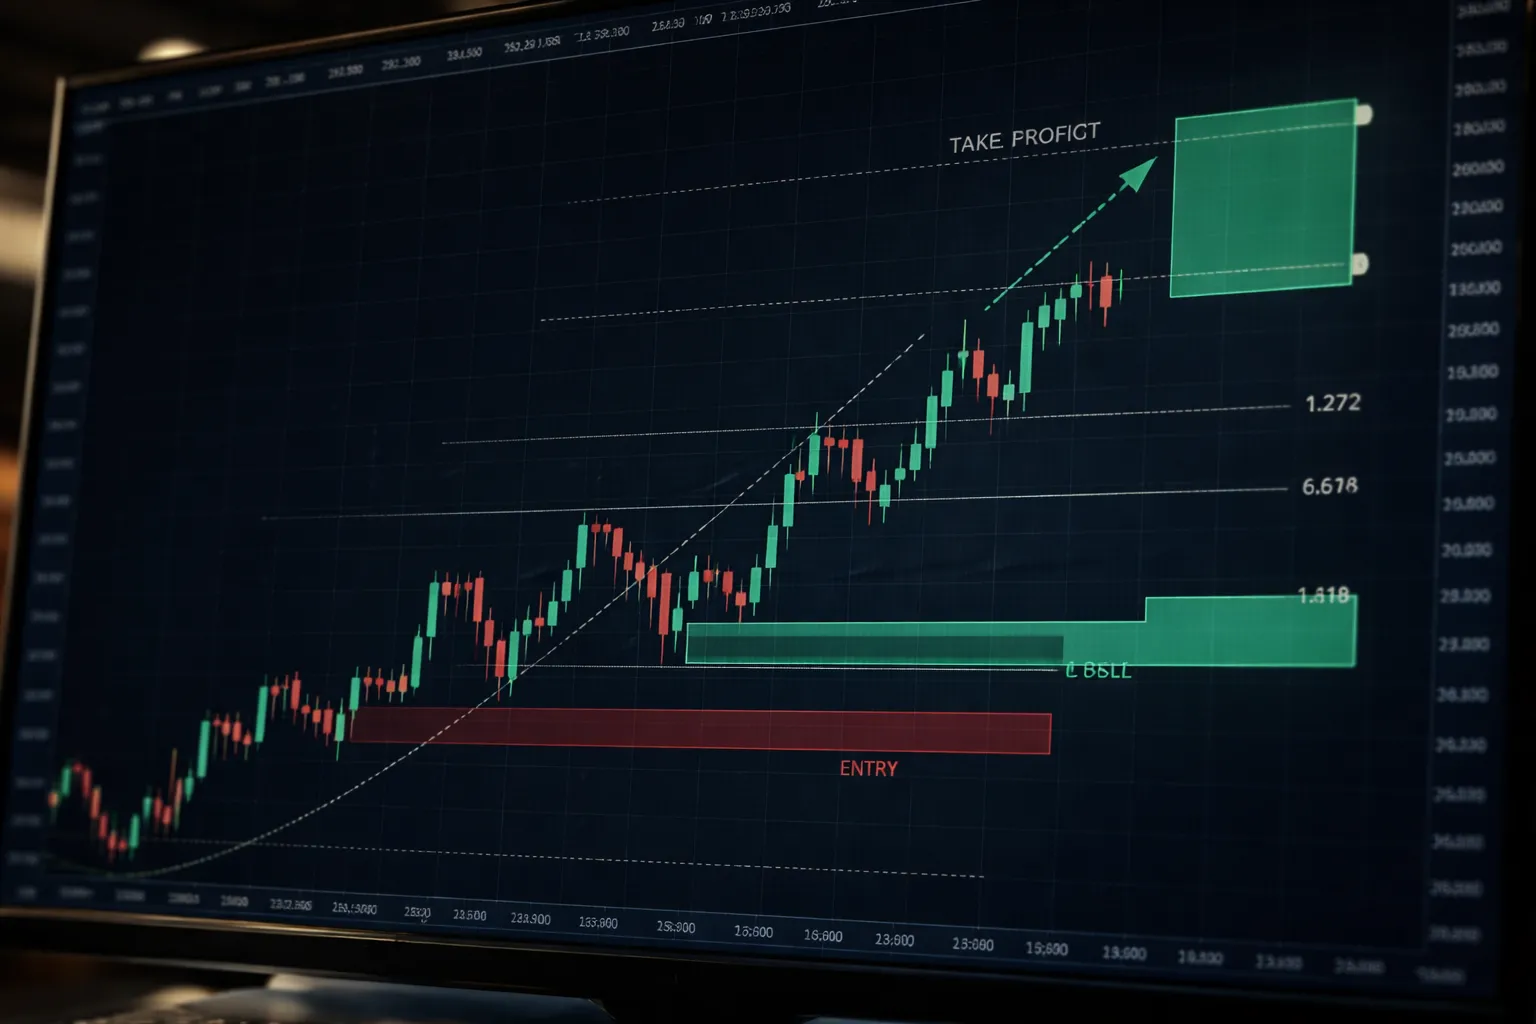
Trend Continuation Entries, Limit Orders vs Confirmation Entries
You have two clean ways to trade a retracement in a trend. You can set a limit order at a level, or you can wait for proof and enter after price reacts.
- Limit entry: Place a buy limit in an uptrend at 38.2% to 61.8% of the last impulse, or a sell limit in a downtrend at the same band. Use it when the impulse is strong, the pullback is shallow, and structure stays intact.
- Confirmation entry: Let price touch the level, reject it, then enter on the retest or on a strong close away from the band. Use it when volatility is high, the swing is large, or price has been sweeping highs and lows.
Limit entries pay you with price. Confirmation entries pay you with information. Pick one based on market conditions, not preference.
For stops, place them beyond the sweep point or beyond the swing low or high that invalidates your setup. If you need a refresher on stop placement, read how to place a stop loss.
The Pullback-to-50% Play, When It Works and When It Fails
The 50% level works because many trends pull back to a midpoint before continuation. It is not magic. It is a common balance point.
- When it works: You have a clear impulse leg, clean swing points, and a pullback that respects prior structure. Price tags 50%, prints a rejection, then holds above a minor higher low in an uptrend, or below a lower high in a downtrend.
- When it fails: Price slices through 50% with strong closes, or it chops around the level with no displacement. Another failure signal is acceptance below 61.8% after a break, because that often leads to a 78.6% to 100% retrace.
Trade 50% like a zone, not a line. Use 50% with nearby structure. If 50% sits in empty space, expect more noise.
Deep Retracements (61.8% to 78.6%), Higher Reward, Higher Failure Rate
Deep retracements give you better price and larger potential R multiples. They also fail more often because the trend has already given up more ground.
- How to trade them: Wait for a sweep into 61.8% to 78.6%, then a reclaim. Enter on the retest of the reclaimed level, or after a strong close away from the band with follow-through.
- What to avoid: Do not buy just because price hit 78.6%. If price breaks 78.6% and then closes below it multiple times, that is acceptance. Plan for 100% retrace and possible trend failure.
- Stop logic: Put your stop beyond the sweep low in an uptrend, or beyond the sweep high in a downtrend. Do not set it on the fib level itself.
Deep fib trades need a clear invalidation point. If you cannot define it, skip the trade.
Break-and-Retest Approach When a Fibonacci Level Flips Role
A fib level can flip from support to resistance, or resistance to support. This happens when price breaks the level with strength and then uses it as a decision point on the way back.
- Break: You want a decisive close beyond the level, not a wick. One close can work on higher timeframes, but multiple closes give cleaner confirmation.
- Retest: Price returns to the level, stalls, and rejects. Enter on the rejection or on the retest after the first bounce.
- Invalidation: The setup fails when price re-enters and holds on the wrong side with multiple closes. Treat that as acceptance and step aside.
This approach reduces early entries. It also keeps you aligned with the side that controls the close.
Combining Retracement With Fibonacci Extensions for Profit Targets
Use retracements to plan entries and risk. Use extensions to plan exits.
- Set the framework: Draw the retracement on the impulse leg you want to trade. After you enter on the pullback, project extensions from that same swing.
- Common targets: 1.272 and 1.618 extensions work well as first and second profit zones in trending markets. Use 1.0 as a conservative target when momentum is weak.
- Execution: Take partial profit at the first extension, then trail the rest behind structure. If price stalls and prints reversal cues before your next extension, protect the trade.
Extensions keep your take profit rules consistent. They stop you from guessing targets based on fear or hope.
Confluence: How to Increase Accuracy of Fibonacci Trades
Fibonacci levels work best when they match other signals. You want price to react at a level for more than one reason. This filters weak setups and tightens your invalidation point.
Support and Resistance, Supply and Demand
Start with the chart. Mark the nearest swing highs and lows, prior daily highs and lows, and clean horizontal levels. Then check where your Fib levels land.
- High confluence: 38.2, 50, or 61.8 lines up with a clear support or resistance level.
- Higher confluence: the Fib level sits inside a fresh supply or demand zone, one that caused a strong impulse move.
- Lower confluence: the Fib level floats in empty space with no prior reactions.
Execution rule. If the level and the zone do not overlap, treat the Fib as a reference, not a trade trigger.
Trendlines and Channels
Use trendlines and channels to confirm slope and location. This helps you avoid taking a retracement entry against a weakening structure.
- In an uptrend, favor Fib buy zones that land on a rising trendline or the lower channel line.
- In a downtrend, favor Fib sell zones that land on a falling trendline or the upper channel line.
- Skip trades when price breaks the trendline before it reaches your Fib zone. Structure already changed.
Keep your lines simple. Use two clean touches minimum. Do not force a fit.
Moving Averages as Dynamic Confluence (20, 50, 200)
Moving averages give you a dynamic support and resistance check. They also help you separate trend pullbacks from trend reversals.
- 20 EMA: strong trend, shallow pullbacks. Confluence here supports 23.6 and 38.2 trades.
- 50 EMA: common mean reversion area. Confluence here supports 38.2, 50, and 61.8 trades.
- 200 MA: regime filter. If your Fib entry fights the 200, reduce size or skip.
Execution rule. If price sits below the 200 MA, treat long Fib setups as countertrend unless market structure says otherwise.
RSI and MACD Divergence at Fibonacci Zones
Divergence can confirm exhaustion at a Fib level. It does not replace structure. Use it to time entries and avoid chasing continuation that has already faded.
- Bullish divergence: price makes a lower low into a Fib buy zone, RSI or MACD makes a higher low.
- Bearish divergence: price makes a higher high into a Fib sell zone, RSI or MACD makes a lower high.
- Best use: divergence at 61.8 or 78.6 with a clear rejection candle and a nearby invalidation point.
Hard rule. Ignore divergence when momentum expands in the trend direction. Strong trends can keep pushing through divergence.
Session Timing and Volatility (London and New York Overlap)
Timing changes how Fib zones behave. Liquidity and volatility decide if price respects a level or spikes through it.
- London open: fast price discovery. Expect false breaks around popular Fib levels.
- London and New York overlap: highest liquidity for major pairs. You get cleaner fills and more follow-through after a rejection.
- Late New York: thinner liquidity. Fib reactions can look clean but fail from lack of participation.
Execution rule. During the overlap, wait for a close back inside the zone or a clear rejection before entry. Outside active sessions, widen your filter or trade smaller.
| Confluence factor | What you want to see at a Fib level | What to avoid |
|---|---|---|
| Support or resistance | Prior swing reaction at the same price | No historical reaction |
| Supply or demand | Fib sits inside a fresh zone that caused an impulse | Old zone with many retests |
| Trendline or channel | Fib aligns with the trend boundary | Trendline break before the zone |
| 20, 50, 200 MA | Fib and MA at the same area, trend agrees | Entry against the 200 without structure support |
| RSI or MACD divergence | Divergence plus rejection and clear invalidation | Divergence alone in strong momentum |
| Session timing | Rejection and follow-through during overlap | Thin liquidity chop and spikes |
When you stack confluence, you still need clean risk control. Keep your stop beyond the level that proves your idea wrong, and set targets that match your structure and plan. Use a consistent process for setting stop loss and take profit so you do not change rules mid trade.
Risk Management for Fibonacci Retracement Setups
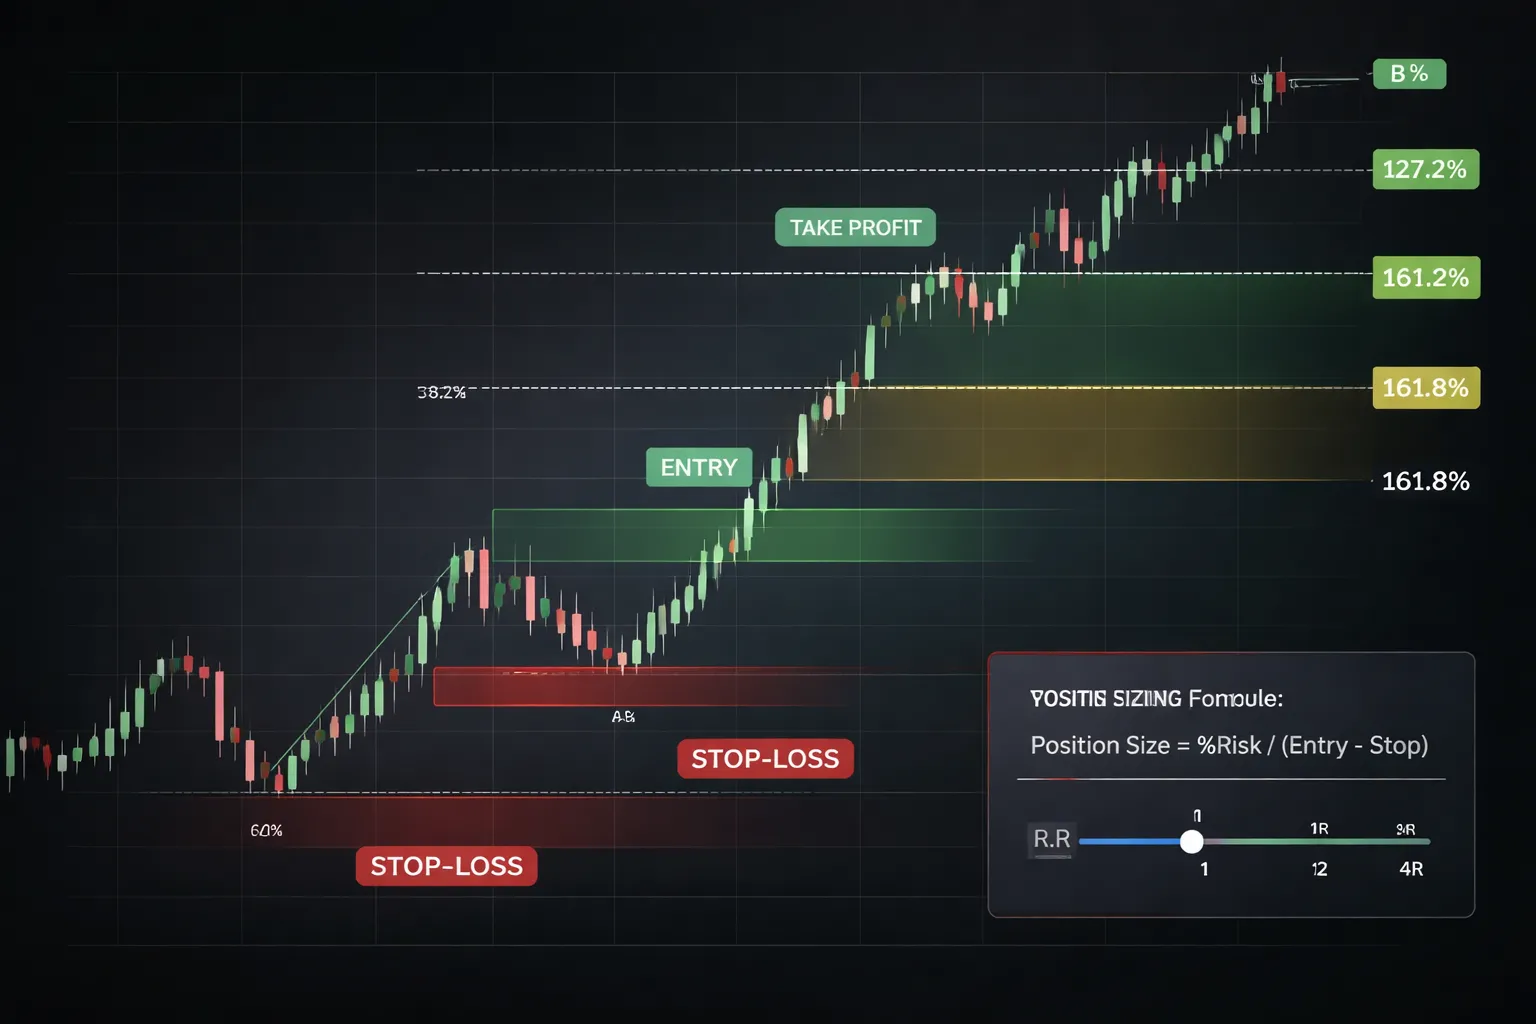
Stop-loss placement, invalidate the idea
Your stop sits where the setup fails. Do not place it where you feel comfortable. Place it where price proves your read wrong.
- Beyond the swing point: For retracement entries, the cleanest invalidation is usually beyond the swing low in an uptrend, or beyond the swing high in a downtrend. If that swing breaks, your impulse leg and fib anchor lose meaning.
- Beyond the next Fib level: Use this when the swing stop is too wide for your risk rules. Example, you buy at 50% and place the stop beyond 61.8% plus a buffer. You accept more stop-outs, but you keep position sizing realistic.
- Add a buffer: Put the stop past the level, not on it. Size the buffer to the pair and session. A common method is a fraction of ATR, or a fixed pip buffer you can defend in backtests.
- Avoid micro-stops inside noise: If your stop must sit inside the prior swing structure, skip the trade. You are betting on perfect timing.
Take-profit planning, structure first
Set targets before you enter. Tie them to market structure and your fib framework. Do not improvise after price moves.
- Partials: Take partial profit at the first logical barrier, often the prior swing high or low, or a nearby supply or demand zone. This pays you for being right and reduces pressure.
- Extensions: Use fib extensions for the runner. Common targets are 127.2% and 161.8% of the impulse leg. Use them as zones, then confirm with structure.
- Structure-based exits: If price reaches a prior swing and stalls, you exit or reduce. If it breaks and holds, you keep the runner toward the next structure level.
- Match exits to order type: If you plan limit entries and fixed targets, keep execution consistent. Review basic order mechanics if needed with market vs limit vs stop orders.
Position sizing, fixed fractional risk
Risk a fixed percent per trade. Keep it stable across pairs and setups. Most retail traders use 0.25% to 1% per trade.
- Step 1, set account risk: Risk amount = Account balance times Risk%. Example, $10,000 times 1% equals $100.
- Step 2, measure stop distance: Stop pips = Entry price minus stop price, converted to pips.
- Step 3, compute pip value: For most USD-quoted majors on a standard lot, pip value is about $10 per pip. For pairs where USD is not the quote currency, pip value changes with price and conversion.
- Step 4, calculate position size: Lots = Risk amount divided by (Stop pips times Pip value per lot).
Minimum R:R filters, cut low-quality trades
Fib levels create tight entries, but they also tempt you into poor reward profiles. Use a minimum reward to risk filter before you place the order.
- Set a floor: Many plans use 1.5R or 2R minimum for the first target, based on tested results. Pick one and apply it to every fib setup.
- Use realistic targets: If the next structure level gives you 0.8R, you skip. Do not stretch targets past clear barriers just to force 2R.
- Account for spread and slippage: On tight stops, costs can erase the edge. If spread is 2 pips and your stop is 12 pips, you already gave up a large share of your risk budget.
Trade management, move stops with rules
Manage the trade with a rule set. Do not move the stop because the candle looks scary.
- Let the setup breathe: If your stop sits beyond the swing, accept that price may test the level. Do not tighten the stop inside the zone that triggered the entry.
- Move to break-even with a trigger: Use an objective trigger, like a close beyond the rejection candle high, or price reaching 1R. Do not move to break-even early in choppy sessions.
- Trail behind structure: For runners, trail behind higher lows in an uptrend or lower highs in a downtrend. This keeps you in trends and exits you when structure flips.
- Lock profits in steps: After partials, you can reduce risk by moving the stop to a prior level that should hold if momentum continues.
Real-World Examples (Bullish and Bearish) You Can Replicate
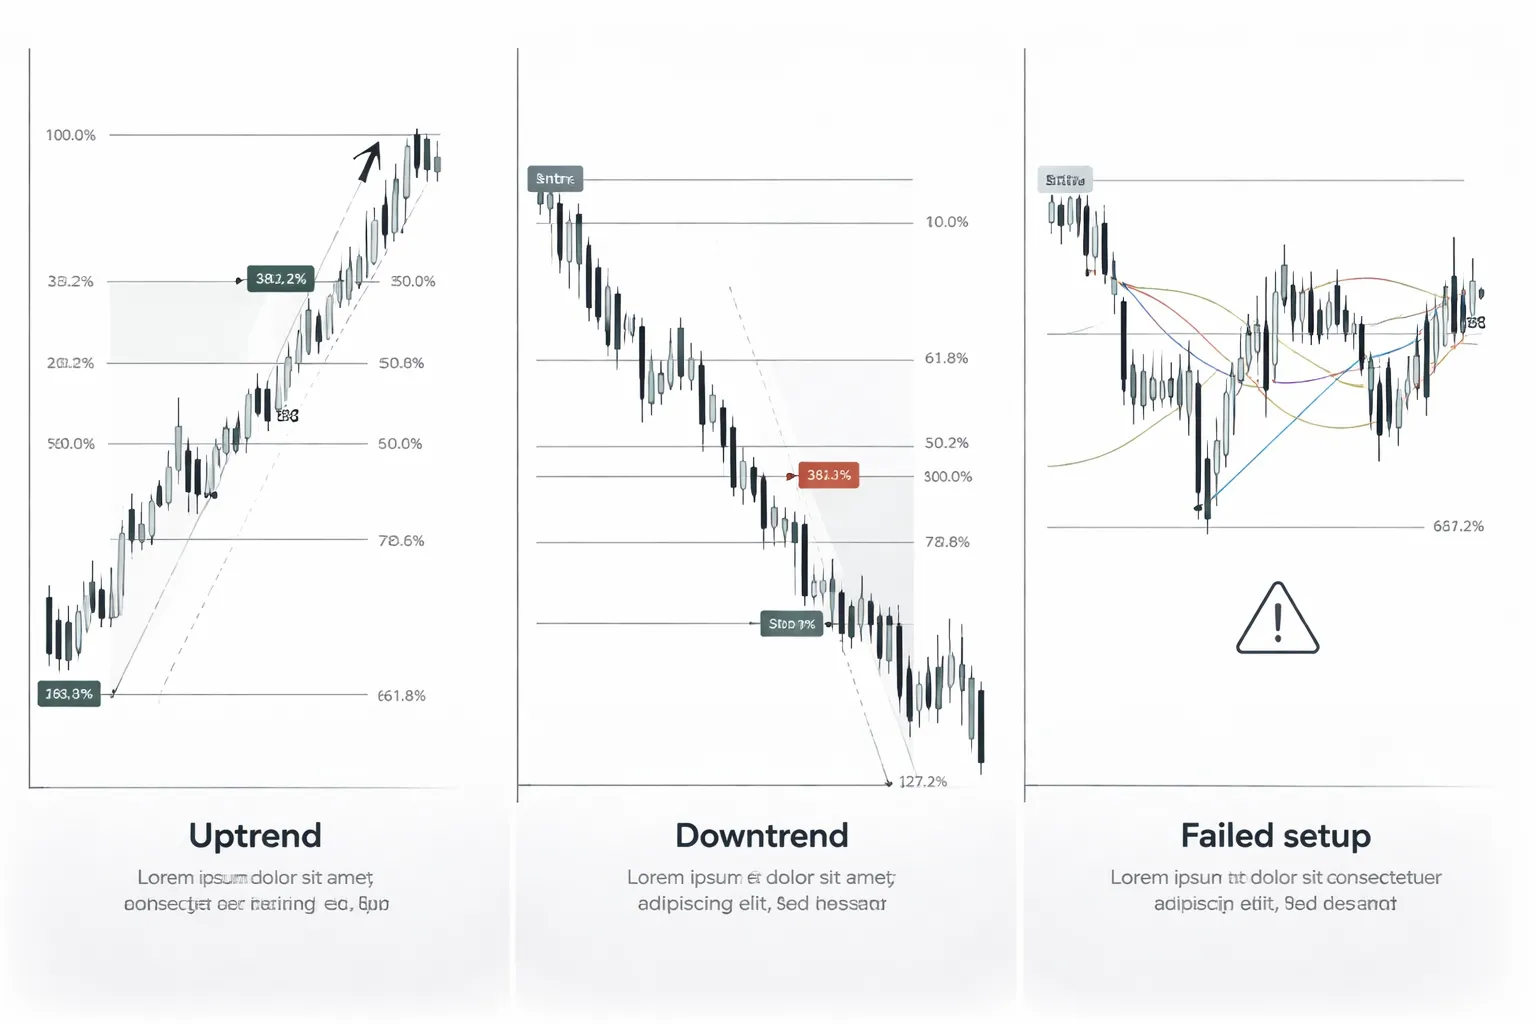
Example 1: Uptrend Pullback to 38.2% With Structure Confirmation
Market condition: Clear uptrend. Higher highs and higher lows on your trading timeframe.
How to draw it: Anchor the Fibonacci tool from the swing low to the swing high that created the latest impulse leg.
What you wait for: Price pulls back into the 38.2% zone and reacts at a prior structure level. Do not buy just because price touches the line.
- Confluence: 38.2% aligns with a prior resistance that can act as support. You can map that level using your normal structure work, see support and resistance.
- Trigger: A strong bullish close off the level, or a break and close above the pullback’s minor lower high.
- Stop: Below the pullback low, or below the structure shelf that should hold. Keep it outside obvious stop clusters.
- Targets: First target at the prior swing high. Second target at the 127.2% or 161.8% extension if momentum stays clean.
- Management: Take partial at the prior high. Trail the rest behind higher lows as long as structure holds.
What makes it replicable: You trade with trend, you buy a shallow pullback, you demand a structure-based trigger.
Example 2: Downtrend Retracement to 61.8% Plus a Bearish Trigger
Market condition: Clear downtrend. Lower lows and lower highs. Strong bearish impulse leg.
How to draw it: Anchor Fibonacci from the swing high to the swing low of the impulse leg.
What you wait for: Price retraces into the 61.8% zone and stalls at prior support that can flip into resistance.
- Confluence: 61.8% aligns with a prior breakdown level, or a supply zone formed before the impulse drop.
- Trigger: Bearish rejection candle at the zone, or a break and close below the pullback’s minor higher low.
- Stop: Above the retracement swing high, or above the rejection candle high if it sits beyond the level.
- Targets: First target at the prior swing low. Second target at 127.2% extension if the trend leg resumes.
- Management: Reduce risk only after the market proves direction, such as a clean move back below 50% or a new lower low.
What makes it replicable: You sell into a deep pullback in a downtrend, you use structure as the decision point, you require a bearish break or rejection.
Example 3: Failed Fibonacci Setup and Warning Signs
Fibonacci fails when you force it onto messy price or ignore context. Treat these as stop signs.
- No clear impulse leg: The swing looks like a grind with overlap. You cannot define a clean low-to-high or high-to-low. Skip it.
- Multiple conflicting swings: You can draw three different Fibs and get three different 61.8% levels. That means the market has no clean structure.
- Level has no structure: Price hits 38.2% or 61.8% in the middle of nowhere. No prior swing points nearby. Expect random fills and whipsaws.
- Retracement goes too far: Price breaks the impulse start. Your trend leg is invalid. Remove the Fib and re-map the new swing.
- Trigger never forms: Price tags the zone and keeps drifting. You do not have evidence of buyers or sellers stepping in. No trade.
- News-driven spike: A fast spike through the level with instant reversal can work, but it often breaks stops both ways. If the candle range is far above normal, reduce size or stand down.
How to react: If your stop gets hit and structure flips, do not re-enter based on the same Fib. Wait for a fresh impulse leg, then redraw.
A Reusable Pre-Trade Checklist for Drawing and Execution
- Trend: Uptrend or downtrend is obvious on your execution timeframe.
- Impulse leg: One clean push with limited overlap.
- Anchors: You used the correct swing high and swing low that define that impulse leg.
- Zone: You marked the 38.2%, 50%, and 61.8% area, then focused on the level that lines up with structure.
- Structure confluence: The retracement level aligns with a prior swing point, breakdown level, or clear support or resistance.
- Trigger: You have a specific entry rule, rejection candle close, break of minor structure, or both.
- Stop placement: Stop sits beyond the invalidation point, not inside the zone.
- Target plan: First target at the prior swing, second target at an extension or next structure level.
- R multiple: Minimum reward supports your rules, such as 1.5R to first target.
- Session and volatility: You avoid dead sessions and erratic candles that distort swings.
- Execution: You place the order only after the trigger prints, no front-running.
Common Mistakes When Using Fibonacci Retracement in Forex
Anchoring to the Wrong Swing
Your Fibonacci grid is only as good as your anchor points. Many traders grab the last visible move, not the swing that drove the trend.
- Micro swing problem: You draw from a small pullback inside chop. Levels cluster and fail fast. You get stopped by noise.
- Macro swing problem: You stretch the grid across an old move that the market has already digested. Entries come late and your stop gets wide.
- Fix: Anchor to the most recent clear impulse leg. Use the leg that broke structure or caused displacement. Ignore messy overlap candles.
- Quick check: If you can redraw three different “valid” grids in 30 seconds, your swing choice is weak.
Ignoring Higher Timeframe Support and Resistance
Fibonacci levels do not override structure. Price respects areas that already proved supply or demand.
- You buy a 61.8% retracement straight into a daily resistance. Your fill looks clean, your follow-through dies.
- You sell a 38.2% retracement into a weekly support. Your trade stalls, then squeezes.
- Fix: Mark higher timeframe zones first, then draw fib on the active swing inside that context.
- Rule: Treat a fib level as a trigger area only when it aligns with structure. Use support and resistance as the filter, not an afterthought.
Treating 50% as a Fibonacci Number (and Why It Still Matters)
50% is not a Fibonacci ratio. Traders still watch it because markets often mean-revert to the midpoint of an impulse.
- Common mistake: You give 50% extra authority, then force trades when the setup has no structure or no trigger candle.
- Why it matters: Midpoint retests show up in many trend pullbacks, especially when liquidity sits near the middle of the prior move.
- Fix: Treat 50% like any other level. You still need confluence, a trigger, and a clear invalidation point.
Overloading Charts With Too Many Fibonacci Grids
More lines do not add precision. They add excuses.
- You stack fibs from multiple swings. Every price point becomes “a level.” You stop making clear decisions.
- You change anchors after the fact to fit the outcome. You destroy your stats.
- Fix: Use one grid for the trade idea. If you need a second, use it only for a higher timeframe swing and keep it faint.
- Rule: If you cannot state the one level you will act on, you have too many levels.
Not Accounting for Spread and News Spikes Around Key Levels
Fib levels often sit where liquidity is thin during transitions. Spread and volatility can turn a clean plan into a random stop-out.
- Spread issue: Your stop sits “just beyond” 61.8%, but the spread widens and tags it. Your chart never shows the stop hit because you watched mid price.
- News spike issue: A release prints a fast wick through the zone, fills you at a bad price, then reverses. Your risk doubles without permission.
- Fix: Add a spread buffer to entries and stops, based on the pair’s typical spread in your trading session.
- Fix: Avoid opening new trades right before major scheduled news. If you must trade, reduce size or require a post-news close and retest.
- Execution rule: Place limit orders only when spreads stay stable. Prefer confirmation triggers when volatility rises.
Pros, Cons, and When to Avoid Fibonacci Retracement
Strengths, Structure, Repeatability, Clear Invalidation
- It gives you structure. You map the swing high and swing low, then you work the same levels every time.
- It improves repeatability. The 38.2, 50, and 61.8 levels let you plan entry zones instead of guessing.
- It gives clear invalidation. If price breaks the swing point you used to draw the tool, your setup is wrong. You exit or you stop hunting that trade.
- It helps you define risk. Fib levels give you nearby areas for stops and targets, which keeps your reward to risk measurable.
- It works well with confluence. When a Fib level aligns with prior structure, round numbers, or a trendline, you get cleaner decisions.
Limitations, Subjectivity and Regime Dependence
- Your anchor points are a choice. Two traders can draw different swings and get different levels. You need a rule for what counts as a swing.
- It fails in chop. In noisy price action, price cuts through levels and triggers false entries and stops.
- It depends on trend quality. Strong trends often respect shallow pullbacks like 38.2. Weak trends often reach deeper levels like 61.8 or break the swing.
- It does not predict direction. Fib marks zones. You still need confirmation, such as a close back above the level in an uptrend.
- Level precision is a trap. Treat levels as areas. Use buffers for spreads and normal wick size on your timeframe.
Best-Fit Pairs and Conditions, Majors vs Exotics, High vs Low Volatility
- Start with majors. EURUSD, GBPUSD, USDJPY, and AUDUSD usually give tighter spreads and cleaner fills. That matters when you trade near a level.
- Be cautious with exotics. Wide spreads and thin liquidity can pierce a Fib level without real intent, then reverse. Your stop and entry need larger buffers, which worsens reward to risk.
- Match the tool to volatility. In low to normal volatility, Fib pullbacks often respect zones and retests. In high volatility, levels break more often and require stricter confirmation.
- Use session logic. London and New York hours often give better follow-through. Dead sessions give more drift and more random level cuts.
- Check related pairs. If your pair fights a strong move in a correlated major, your Fib setup can fail even if the level looks clean. Use forex correlations to avoid trading against broad USD strength or weakness.
When to Stand Aside, Ranging Markets, Major News, Illiquid Sessions
- Stand aside in tight ranges. If the market prints equal highs and equal lows and keeps returning to the middle, Fib pullbacks turn into repeated stop-outs.
- Stand aside before major scheduled news. CPI, NFP, rate decisions, and central bank speeches can gap through levels. Wait for the release, then trade the post-news close and retest.
- Stand aside in illiquid sessions. Late Friday, rollover, and holidays bring thin order books. Price spikes through levels, then snaps back.
- Stand aside when spreads expand. If spread jumps around your planned entry, your stop distance and fill quality break. You lose control of risk.
- Stand aside when the swing is unclear. If you cannot point to a clean impulse leg, you cannot draw a Fib with discipline.
Building a Repeatable Fibonacci Trading Plan (Template)
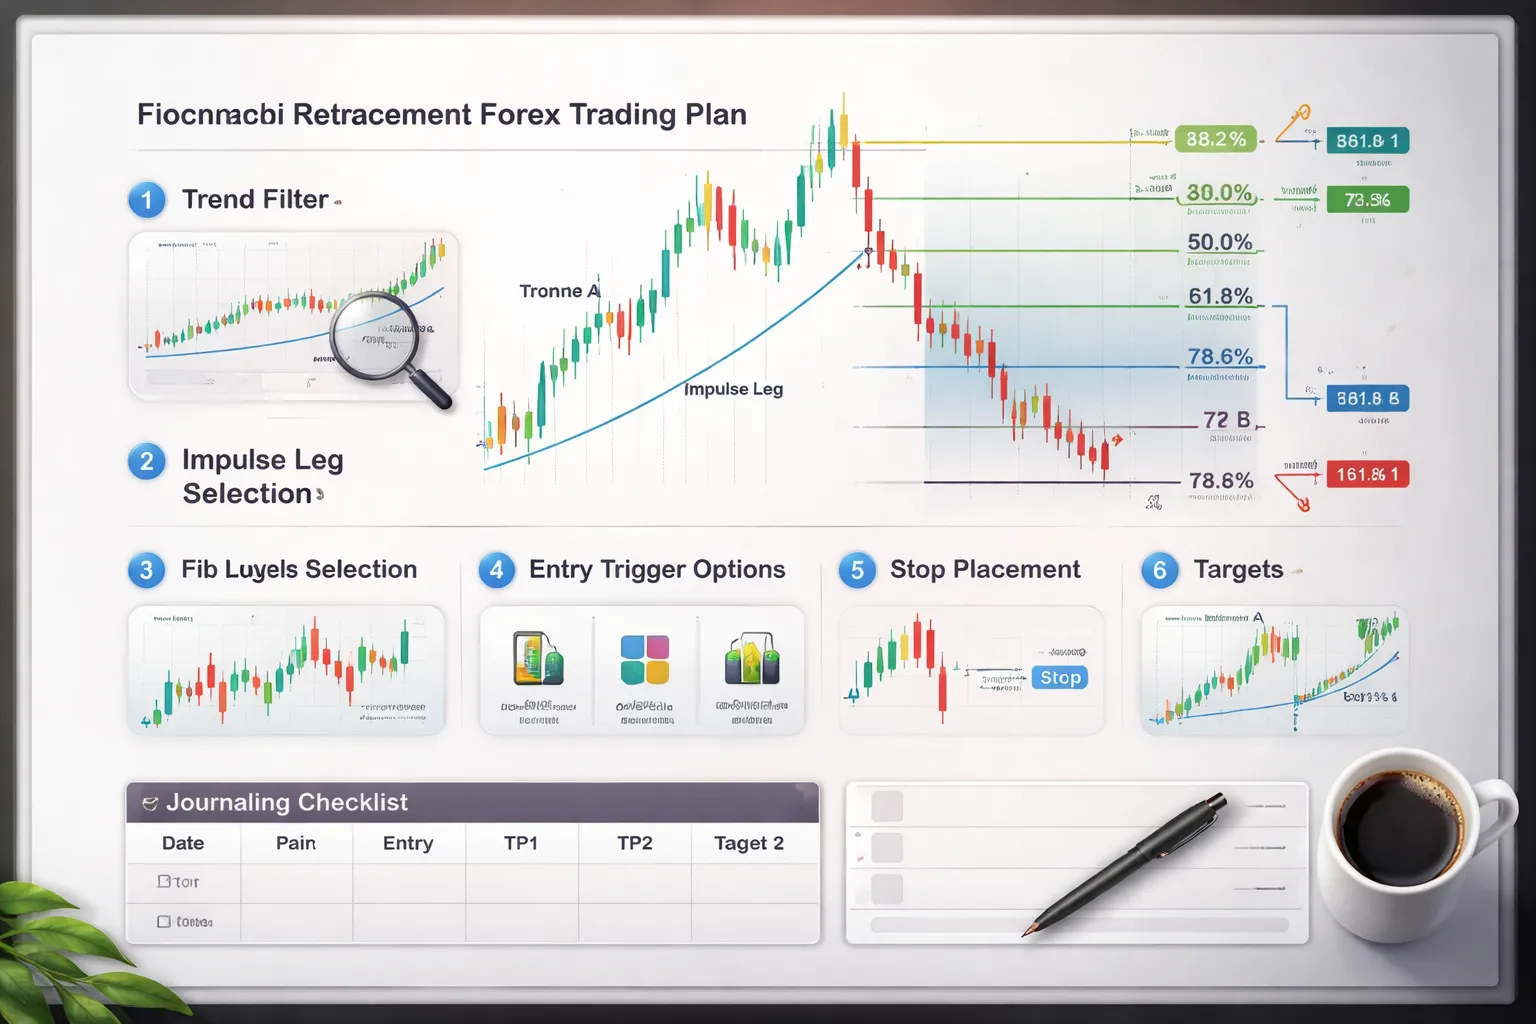
Rule Set: Trend Definition, Swing Selection, Redraw Criteria
Market filter. Trade liquid sessions. Skip late Friday, rollover, and holidays. Skip when spread expands beyond your normal range.
Trend definition (pick one and keep it).
- Price structure rule. Uptrend, higher high and higher low on your trading timeframe. Downtrend, lower low and lower high.
- MA filter rule. Price above a rising 50 EMA for longs. Price below a falling 50 EMA for shorts. Use this if you want a strict filter. If you need MA rules, use your existing MA playbook or see moving averages for trend and entries.
Swing selection rule. Draw Fib only on a clean impulse leg.
- For longs, anchor from swing low to swing high of the impulse.
- For shorts, anchor from swing high to swing low of the impulse.
- Use the last impulse that broke structure. It should take out the prior swing high for longs, or swing low for shorts.
- Ignore small legs inside chop. If your anchors change every few candles, the swing is not tradable.
Redraw criteria. Redraw only when the market gives new information.
- Redraw if price makes a new impulse extreme in the trend direction before your entry triggers.
- Do not redraw during the pullback. You lock the anchors. You trade the retracement.
- Invalidate the setup if price breaks the impulse origin. For longs, a close below the swing low. For shorts, a close above the swing high.
Entry Triggers: Candle Patterns, Breaks, Indicator Confirmation
Level zone. Pick two Fib zones and specialize. Most traders use 38.2 to 50.0 for shallow pullbacks, and 61.8 to 78.6 for deep pullbacks.
Trigger options. Use one trigger family. Do not mix rules mid-trade.
- Candle rejection trigger. Enter on the next candle after a clear rejection at your zone. Define rejection as a wick through the level and a close back inside the zone.
- Break of minor structure trigger. Mark the pullback high or low. Enter when price breaks that minor level in the trend direction. This reduces false bounces.
- Indicator confirmation trigger. Enter only when your confirmation flips with the bounce. Example, RSI crosses back above 50 for longs, below 50 for shorts, after tagging the zone. Keep it binary.
Execution rules.
- Use limit orders only if you accept missed trades. Use stop or market entries only if spread stays stable.
- Set your stop before you enter. If the required stop exceeds your max risk, skip the trade.
- Risk a fixed fraction per trade, such as 0.5 to 1.0 percent.
Exit Rules: Targets, Time-Based Exits, Invalidation Logic
Stop placement. Your stop must sit beyond the level that proves you wrong.
- Conservative stop, beyond the swing origin. It cuts noise but reduces R multiple.
- Aggressive stop, beyond the 78.6 zone or beyond the rejection candle low or high. It improves R but increases stop-outs.
Targets (use a fixed plan).
- Target 1. Prior swing high for longs, prior swing low for shorts.
- Target 2. Fib extension 127.2 or 161.8 of the impulse, only if structure supports continuation.
- Scale rule. Take partial at Target 1, move stop to break-even only after price closes beyond a clear minor structure level. If you move to break-even too early, you cut expectancy.
Time-based exit. Exit if price does not move.
- Intraday template, close the trade if it has not reached at least 1R within X candles, such as 10 to 20 on your entry timeframe.
- Session template, close before major session transition if volatility drops and spread rises.
Invalidation logic. Exit fast when the premise breaks.
- Exit if price closes beyond the impulse origin, even if stop has not hit yet.
- Exit if spread widens enough that your planned stop distance no longer matches real execution risk.
Backtesting and Journaling Fields to Track Performance by Level
Track results by Fib zone. You want to know which level pays you.
- Timeframe. Trend timeframe and entry timeframe.
- Trend rule used. Structure or MA filter.
- Impulse anchors. Price of swing low and high, or high and low.
- Fib zone tagged. 38.2, 50.0, 61.8, 78.6. Record if it hit multiple zones.
- Entry trigger. Rejection candle, structure break, indicator flip.
- Spread at entry. Record in pips. Mark abnormal.
- Stop size. Pips and structure reference.
- R risked. Fixed percent and position size.
- Targets used. Prior swing, 127.2, 161.8.
- Outcome. R gained or lost, max favorable excursion, max adverse excursion.
- Hold time. Candles and minutes or hours.
- Reason for exit. Target hit, stop hit, time stop, invalidation.
- Notes. News nearby, liquidity issues, redraw events.
Level breakdown. Report win rate, average win in R, average loss in R, and profit factor for each zone. If 61.8 trades win less but pay more, you need to see that in the data.
How to Validate Results: Sample Size, Expectancy, Drawdown
Sample size. Validate per rule set, per pair, per timeframe. Aim for at least 50 trades per setup variant. 100 is better. Do not pool different triggers and call it one strategy.
Expectancy. Compute in R so it stays position-size neutral.
- Expectancy (R). (Win rate x average win R) minus (Loss rate x average loss R).
- Accept the setup only if expectancy stays positive after spreads and realistic fills.
Drawdown. You trade the worst stretch, not the best week.
- Track max peak-to-trough drawdown in R and percent.
- Track losing streak length. Set risk so a normal losing streak does not force you to change rules.
- Stress test by removing the best 5 to 10 percent of trades. If results collapse, the edge is weak.
Decision rule. Keep the plan unchanged for the next 20 trades. Review only after you hit your sample target. Change one variable at a time.
Frequently Asked Questions
What is a Fibonacci retracement in Forex?
It is a tool that plots percentage pullback levels between a swing high and swing low. Traders watch 38.2%, 50%, and 61.8% to plan entries, stops, and targets. It does not predict direction. It marks likely reaction zones.
How do you draw Fibonacci retracement correctly?
Pick one clear swing. In an uptrend, draw from swing low to swing high. In a downtrend, draw from swing high to swing low. Use the same timeframe you trade. Do not force the anchor points to fit a trade.
Which Fibonacci retracement levels matter most?
Focus on 38.2%, 50%, and 61.8%. Use 23.6% in strong trends with shallow pullbacks. Treat 78.6% as a deep retrace level, often close to trend failure. More levels add noise.
Does Fibonacci retracement work in Forex?
It works best as a structure tool, not a signal. Your edge comes from confluence, trend context, and risk control. Track results by sample size, drawdown, and losing streaks. If performance collapses after removing top trades, your setup is fragile.
What timeframe should you use for Fibonacci retracement?
Use the timeframe you execute on. Use one higher timeframe to mark the main swing and trend. Align levels across timeframes when they are close. Avoid mixing many swings. It creates conflicting levels and weak decisions.
How do you trade Fibonacci retracements for entries?
Wait for price to retrace into a level and then show rejection. Use a clear trigger, like a break of a minor structure point. Place the stop beyond the swing that invalidates the idea. Aim for the prior swing high or low first.
Where should you place a stop loss with Fibonacci?
Place the stop where the trade idea fails, not at a fixed Fib number. In an uptrend, that is often below the swing low or below 78.6% if you trade deep pullbacks. Size risk so a normal losing streak stays survivable.
How do you set take profit using Fibonacci retracement?
Use logical targets first, prior swing points, session highs and lows, and key structure. Fib retracement can help you stage partial exits at nearby levels. For extensions, project 127.2% or 161.8% only after a clean break of the prior swing.
What is the difference between retracement and extension?
Retracement measures pullbacks inside the prior swing. Extension projects potential targets beyond the swing high or low after continuation. Draw retracement on the impulse leg. Draw extension after price resumes the trend and breaks structure.
What are common Fibonacci retracement mistakes?
- Drawing from the wrong swing points.
- Using too many levels and timeframes.
- Taking trades with no trigger.
- Moving anchors after entry.
- Ignoring spread, slippage, and news.
- Risking too much on one setup.
How do you combine Fibonacci with other tools?
Combine Fib with trend direction, key support and resistance, and price action triggers. Add one filter at a time and track results for at least 20 trades before changing rules. If you need a framework, use a pullback trading strategy.
Conclusion
Fibonacci retracement is a measuring tool. It helps you mark likely pullback zones inside a trend. It does not give you an entry by itself.
Keep your process tight.
- Draw from swing low to swing high in an uptrend, and swing high to swing low in a downtrend.
- Mark 38.2, 50, and 61.8. Treat them as areas, not exact prices.
- Wait for a trigger at the level, then place your stop beyond the swing point.
- Set targets at the prior high or low, and the next major support or resistance.
- Log at least 20 trades, then adjust one rule at a time.
Your best edge comes from execution, not more lines. Control position size, define loss before entry, and keep drawdown small. Use a simple risk management plan on every Fib setup.
-
Stop Loss vs Take Profit: Differences, Examples & Best Practices
6 months ago -
Forex Trading Psychology Tips: How to Stay Disciplined and Consistent
6 months ago -
Forex Order Types Explained: Market vs Limit vs Stop Orders
6 months ago -
How to Set Stop Loss and Take Profit (Step-by-Step)
6 months ago -
How to Start Forex Trading Step by Step (Beginner Roadmap)
6 months ago
-
- Trend Continuation Entries, Limit Orders vs Confirmation Entries
- The Pullback-to-50% Play, When It Works and When It Fails
- Deep Retracements (61.8% to 78.6%), Higher Reward, Higher Failure Rate
- Break-and-Retest Approach When a Fibonacci Level Flips Role
- Combining Retracement With Fibonacci Extensions for Profit Targets
-
- Rule Set: Trend Definition, Swing Selection, Redraw Criteria
- Entry Triggers: Candle Patterns, Breaks, Indicator Confirmation
- Exit Rules: Targets, Time-Based Exits, Invalidation Logic
- Backtesting and Journaling Fields to Track Performance by Level
- How to Validate Results: Sample Size, Expectancy, Drawdown
-
- What is a Fibonacci retracement in Forex?
- How do you draw Fibonacci retracement correctly?
- Which Fibonacci retracement levels matter most?
- Does Fibonacci retracement work in Forex?
- What timeframe should you use for Fibonacci retracement?
- How do you trade Fibonacci retracements for entries?
- Where should you place a stop loss with Fibonacci?
- How do you set take profit using Fibonacci retracement?
- What is the difference between retracement and extension?
- What are common Fibonacci retracement mistakes?
- How do you combine Fibonacci with other tools?
-
-
- Trend Continuation Entries, Limit Orders vs Confirmation Entries
- The Pullback-to-50% Play, When It Works and When It Fails
- Deep Retracements (61.8% to 78.6%), Higher Reward, Higher Failure Rate
- Break-and-Retest Approach When a Fibonacci Level Flips Role
- Combining Retracement With Fibonacci Extensions for Profit Targets
-
- Rule Set: Trend Definition, Swing Selection, Redraw Criteria
- Entry Triggers: Candle Patterns, Breaks, Indicator Confirmation
- Exit Rules: Targets, Time-Based Exits, Invalidation Logic
- Backtesting and Journaling Fields to Track Performance by Level
- How to Validate Results: Sample Size, Expectancy, Drawdown
-
- What is a Fibonacci retracement in Forex?
- How do you draw Fibonacci retracement correctly?
- Which Fibonacci retracement levels matter most?
- Does Fibonacci retracement work in Forex?
- What timeframe should you use for Fibonacci retracement?
- How do you trade Fibonacci retracements for entries?
- Where should you place a stop loss with Fibonacci?
- How do you set take profit using Fibonacci retracement?
- What is the difference between retracement and extension?
- What are common Fibonacci retracement mistakes?
- How do you combine Fibonacci with other tools?
-
-
How to Place a Forex Trade Step by Step (Your First Trade Explained)
4 months ago -
Forex Trading vs Crypto Trading: Which Market Is Better for Beginners?
4 months ago -
Forex Lot Size Calculator: How to Use It to Size Trades Correctly
6 months ago -
How to Calculate Position Size in Forex (Position Sizing Formula + Examples)
6 months ago -
Forex Leverage Explained: How It Works, Pros, Cons & Examples
6 months ago
-
Forex Trading Platforms Comparison: MetaTrader vs cTrader vs TradingView
6 months ago -
Stop Loss vs Take Profit: Differences, Examples & Best Practices
6 months ago -
Is Forex Trading Legal in the United States? Rules, Regulators & What to Know
6 months ago -
Forex Market Hours & Trading Sessions Explained (Best Times to Trade)
6 months ago -
Forex Leverage Explained: How It Works, Pros, Cons & Examples
6 months ago