MACD Indicator Forex Strategy (Settings, Signals & Examples)

MACD helps you spot trend direction and momentum shifts on your Forex chart. It does this with three parts, the MACD line, the signal line, and the histogram. You use it to time entries, manage exits, and filter weak setups.
In this guide, you will learn:
- Best MACD settings for Forex, including the standard 12, 26, 9 and when to adjust them
- Core signals, signal line cross, zero line cross, and histogram momentum change
- Divergence rules that warn of slowing trends and possible reversals
- Worked examples you can copy into your own process, with clear entry, stop, and exit logic
If you want cleaner signals, pair MACD with multi-timeframe analysis so you trade in the direction of the higher timeframes.
Key Takeaways
- In het kort:
- Use the default MACD settings 12, 26, 9, then adjust only when your timeframe and volatility justify it.
- Trade three core signals, signal line cross, zero line cross, and histogram momentum shift.
- Use divergence as a warning, not as a blind entry trigger.
- Write every trade with a fixed plan, entry, stop, exit, and invalidation level.
- Reduce noise with multi-timeframe direction, then time entries on your execution chart.
- MACD works best in trending markets. In ranges, it whipsaws.
- Signal line crosses help with timing. Zero line crosses help with trend bias.
- Histogram changes often show momentum loss before the lines cross. Use it for early alerts, then confirm with price.
- Divergence matters most at key swing highs and lows. It has more weight near support and resistance.
- Keep risk tight. Place stops beyond the last swing, not at the MACD cross.
- Track results by setup type. Log wins, losses, and average R. Cut what does not pay.
MACD in Forex: What It Is and Why It Works
MACD in Forex: What It Is
MACD is a momentum and trend indicator built from moving averages. It tracks how fast price moves and in which direction.
MACD Components Explained
- MACD line, the difference between a fast EMA and a slow EMA. It shows trend pressure. When it rises, upside momentum builds. When it falls, downside momentum builds.
- Signal line, an EMA of the MACD line. It smooths the MACD line and helps you time shifts in momentum.
- Histogram, the distance between the MACD line and the signal line. It measures momentum change. Expanding bars show momentum increasing. Shrinking bars show momentum fading.
The Underlying Logic: Trend and Momentum
Forex trends persist because flows, rate expectations, and risk sentiment do not flip every hour. MACD works because it converts price movement into two checks you can use.
- Trend filter, the zero line. Above zero, the fast EMA sits above the slow EMA. You have bullish trend bias. Below zero, you have bearish trend bias.
- Momentum trigger, the MACD line versus the signal line. Crosses show a shift in momentum inside the current trend.
- Early warning, the histogram. It often turns before the lines cross because it reacts to the gap closing.
Use MACD for structure, then confirm with price. A clean swing break, a pullback hold, or a close beyond a level gives you the trade location. MACD gives you timing.
Why MACD Behaves Differently Across Timeframes and Pairs
MACD is built from EMAs, so it reacts to volatility and market regime. Change the timeframe, and you change the noise level and the average swing size.
- Lower timeframes produce more crosses and more false signals. Spreads and random spikes matter more. You need stricter filters, like trend-only trades or level confirmation.
- Higher timeframes produce fewer signals, but they carry more weight. You get cleaner swings and fewer whipsaws. Your stops tend to be wider.
- Different pairs trend and range in different ways. EURUSD often mean reverts inside ranges for long stretches. GBP pairs can spike and reverse. JPY crosses can trend hard in risk-on or risk-off phases. MACD will reflect that with faster histogram flips in choppy pairs and longer runs above or below zero in trending phases.
Do not assume one setting fits all. Backtest by pair and timeframe. Track average R and drawdown by setup. Keep what pays.
MACD vs RSI vs Stochastic: When MACD Is the Better Choice
RSI and Stochastic are oscillators. They shine in ranges. MACD shines when you want trend direction plus momentum timing.
| Indicator | Best use | Main weakness | When MACD wins |
|---|---|---|---|
| MACD | Trend bias and momentum shifts | Lags in sharp reversals | You trade pullbacks, continuation, and trend resumes |
| RSI | Range turns and momentum extremes | Overbought stays overbought in trends | You want fewer false “overbought” sell signals in strong trends |
| Stochastic | Short-term mean reversion in tight ranges | Very noisy in trends | You need cleaner trend confirmation and fewer rapid flips |
If your edge comes from breakouts and trend follow-through, MACD fits better than oscillators. Pair it with clear levels and a rules-based entry, like a breakout trading strategy.
MACD Indicator Settings for Forex (Default vs Custom)
Default parameters (12, 26, 9), what they mean in practice
MACD uses two exponential moving averages (EMAs) and a signal line.
- 12 EMA, your fast trend measure. It reacts first.
- 26 EMA, your slow trend measure. It filters noise.
- MACD line, the difference between the 12 and 26 EMAs. It shows momentum shifts.
- 9 EMA signal line, an EMA of the MACD line. It smooths the swings.
- Histogram, MACD minus signal line. It shows acceleration or deceleration.
On forex charts, default 12, 26, 9 usually gives clean signals on H1 to D1. You get fewer flips than most oscillators. You still get lag, because MACD is built from moving averages.
Default vs custom, faster vs slower trade-offs
Changing settings changes one thing, signal speed. Speed has a cost.
- Faster settings like 8, 21, 5 or 5, 13, 3. You get earlier crosses and earlier histogram turns. You also get more whipsaws in ranges and during news spikes.
- Slower settings like 19, 39, 9 or 12, 26, 18. You get fewer signals and fewer false flips. You enter later and you exit later. You may give back more before the indicator turns.
If your strategy needs tight timing, faster settings help. If your strategy needs clean trend confirmation, slower settings help.
Timeframe-based settings suggestions
- Scalping (M1 to M15). Start with 5, 13, 3 or 8, 21, 5. Use it as confirmation, not as the only trigger. Expect more failed crosses during low liquidity.
- Day trading (M15 to H1). Start with 12, 26, 9. If you see too many flips, slow the signal line to 12 or 18. If you miss moves, reduce fast and slow EMAs slightly, like 10, 24, 9.
- Swing trading (H4 to D1). Default 12, 26, 9 works well. If you want fewer signals, test 19, 39, 9 or keep 12, 26 and raise the signal to 18.
Keep one set per timeframe. Do not change settings trade to trade.
Pair and session considerations
Volatility and session rhythm change how noisy MACD looks.
- Majors like EURUSD and USDJPY often respect default settings. Liquidity stays high in London and New York, so crosses have better follow-through.
- Crosses like GBPJPY and EURAUD swing harder. Faster settings can overtrade. Test a slower signal line first, like 12, 26, 12 or 12, 26, 18.
- London and New York. You get more trend days and continuation. Default settings often hold up. Faster settings can work if your entries use clear levels.
- Asia session. Many pairs range more. Faster settings will whipsaw. Use default or slower, and demand stronger price structure before you act.
How to optimize MACD settings without overfitting
Most traders optimize by curve fitting. You need a process that survives new data.
- Lock your rules first. Define entries, exits, and filters. Write them down in a plan. Use a clear checklist, like this forex trading plan framework.
- Pick a small settings grid. Example, fast EMA 8 to 12, slow EMA 21 to 30, signal 5 to 12. Avoid testing dozens of combinations.
- Use walk-forward testing. Optimize on one block of history, then test on the next block. Repeat across multiple blocks.
- Check out-of-sample. Hold back the most recent segment. Do not touch it until the end.
- Judge stability, not peak profit. Prefer settings that perform similarly across pairs and periods. Reject settings that win only in one year or one pair.
- Track simple metrics. Win rate, average win to average loss, max drawdown, and trades per month. If faster settings double your trades but cut your average win, you did not improve the edge.
If default 12, 26, 9 performs close to your best custom set, stick with default. Robust beats optimized.
Reading MACD Signals Correctly
Signal-line crossovers
A signal-line crossover happens when the MACD line crosses the signal line. Treat it as a momentum event, not a full trade plan.
- Stronger bullish crossover, MACD crosses up while both lines sit below zero, price has held a higher low, and the crossover happens with a rising histogram.
- Stronger bearish crossover, MACD crosses down while both lines sit above zero, price has held a lower high, and the histogram turns down from a peak.
- Weak crossover, lines tangle and cross back and forth. The histogram stays small. You usually sit in chop or low volatility.
- Late crossover, crossover prints after a long directional candle run. The histogram already peaked and started shrinking. You often chase the move.
Use the crossover to time entries inside a bigger bias. If you trade every crossover, you will overtrade.
Zero-line crossovers
The zero line tells you which side has control. Above zero, bullish pressure dominates. Below zero, bearish pressure dominates.
- Trend confirmation, MACD holds above zero in an uptrend or below zero in a downtrend. Pullbacks often end when MACD stays on the trend side and the histogram starts expanding again.
- Trend transition, MACD crosses the zero line after a base or distribution zone. You want follow-through, not a one-bar poke.
- Whipsaw risk, frequent zero-line flips usually mean range conditions. Reduce size, widen filters, or skip.
Zero-line signals work best when price also breaks structure. If structure does not shift, treat the cross as noise.
Histogram analysis
The histogram measures the distance between MACD and the signal line. It helps you read acceleration and deceleration earlier than crossovers.
- Acceleration, histogram bars grow in the direction of the move. Momentum builds. Trend entries and add-ons become easier to justify.
- Deceleration, bars shrink while price still pushes. Momentum fades. You should tighten rules, reduce targets, or demand a cleaner setup.
- Early warning, histogram flips direction before the lines cross. This often signals a pullback starting, not a full reversal.
Do not treat a single small bar change as a signal. You want a clear sequence, expansion then contraction, not one random tick.
Divergence types and what they imply
Divergence compares price swings to MACD swings. It warns you about weakening momentum, but it does not time entries well on its own.
- Regular bullish divergence, price makes a lower low, MACD makes a higher low. This suggests downside momentum weakens and a reversal or deeper pullback becomes more likely.
- Regular bearish divergence, price makes a higher high, MACD makes a lower high. This suggests upside momentum weakens and a reversal or deeper pullback becomes more likely.
- Hidden bullish divergence, price makes a higher low, MACD makes a lower low. This suggests trend continuation in an uptrend after a pullback.
- Hidden bearish divergence, price makes a lower high, MACD makes a higher high. This suggests trend continuation in a downtrend after a pullback.
Require a trigger. Use a structure break, a key level reaction, or a clean MACD crossover that aligns with the divergence. If you do not trade price structure yet, learn the basics of price action trading.
Signal quality checklist
- Trend context, trade crossovers with the higher timeframe bias. In ranges, focus on extremes or skip.
- Volatility regime, avoid tangled lines and tiny histogram bars. You want expansion, then a controlled pullback, then renewed expansion.
- Proximity to key levels, prioritize signals near prior swing highs and lows, daily open, and clean support and resistance. Avoid signals into nearby barriers.
- Structure alignment, bullish signals work better after higher lows form, bearish signals work better after lower highs form.
- Space to target, ensure price has room to move before the next major level. If the next level sits close, your risk to reward collapses.
- Consistency, log every trade with the same rules. If a filter removes most losers but also most winners, you did not improve the edge.
MACD Indicator Forex Strategy: Step-by-Step Trading Rules
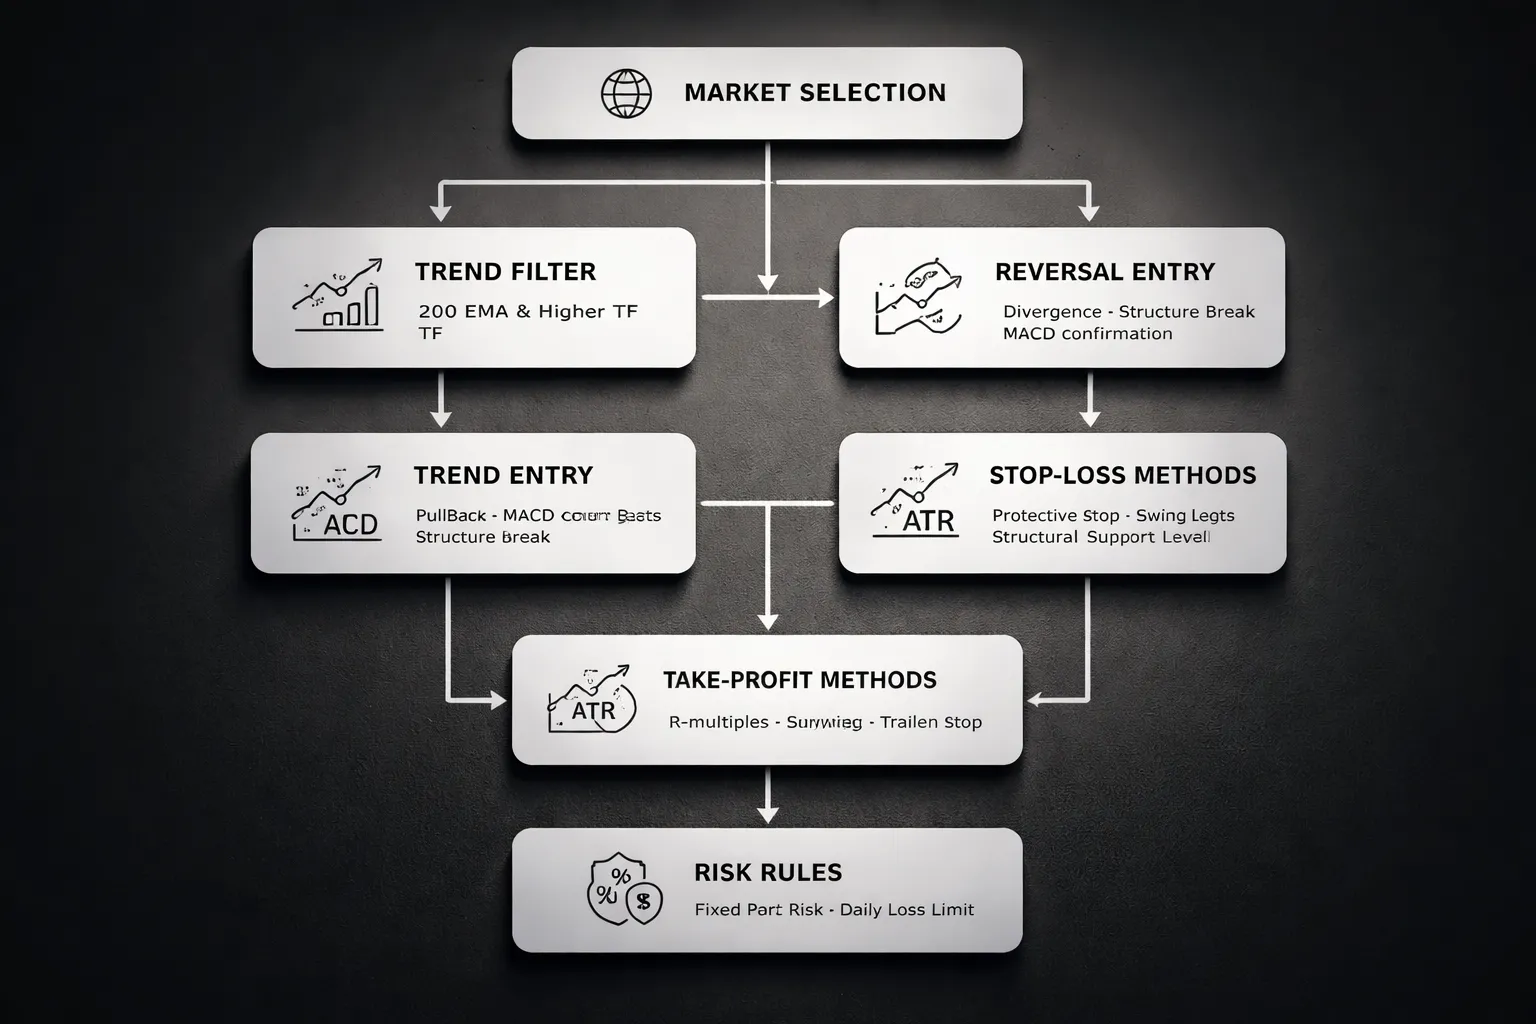
Market Selection and Preparation
- Pairs: Start with major and liquid crosses. EURUSD, GBPUSD, USDJPY, AUDUSD, USDCAD. Add one or two more only after you can execute cleanly.
- Spread rule: Skip trades when spread is high versus recent average. A simple rule, spread must stay under 10 percent of your stop size in pips. Example, a 20 pip stop needs a spread under 2 pips.
- Session timing: Trade when liquidity sits high. London and New York overlap gives cleaner follow through. Avoid the last hour of Friday and the first minutes after major news.
- Chart setup: Use a clean chart. Price, key levels, one trend filter, MACD.
- MACD baseline settings: 12, 26, 9 on your entry timeframe. Keep it fixed while you collect sample size.
Trend Filter Framework
- Option A, 200 EMA filter: Only buy when price sits above the 200 EMA and the EMA slopes up. Only sell when price sits below the 200 EMA and the EMA slopes down.
- Option B, higher timeframe bias: Define bias on H4 or D1. Trade entries on M15 to H1 only in that direction. Use market structure, higher highs and higher lows for longs, lower highs and lower lows for shorts.
- Range filter: Stand aside if the 200 EMA runs flat and price cuts through it. MACD will whipsaw in chop.
Entry Rules for Trend-Following Trades
Goal: Join continuation after a pullback, not after an extended push.
- 1) Confirm trend: Pass your trend filter. Price structure must match the direction.
- 2) Wait for pullback: Price pulls into a prior swing zone or a moving average area. You want compression, smaller candles, reduced momentum.
- 3) MACD trigger: Take the signal line crossover in the trend direction. For longs, MACD line crosses above signal line. For shorts, MACD line crosses below signal line.
- 4) Price action confirmation: Enter only after a break of the pullback structure. Long, break above the pullback lower high. Short, break below the pullback higher low. This reduces early entries.
- 5) Location rule: You need room to the next major level. If the next level sits too close to pay at least 2R, skip the trade.
Entry Rules for Reversal Setups
Use reversals less. Keep size smaller or require stricter confirmation. Divergence alone fails often.
- 1) Identify a mature swing: Price reaches a major level. You see an extended move with weakening follow through.
- 2) Divergence requirement: Bullish reversal, price prints a lower low, MACD prints a higher low. Bearish reversal, price prints a higher high, MACD prints a lower high.
- 3) Structure break confirmation: Wait for a clean break of the last swing in the opposite direction. Bullish, break above the last lower high. Bearish, break below the last higher low.
- 4) MACD agreement: After the structure break, MACD crosses in the new direction or the histogram flips and holds for at least two candles.
- 5) Retest entry: Prefer entry on a pullback to the broken level. It improves stop placement and R multiple.
Stop-Loss Placement Methods
- Structure-based stop: Put the stop beyond the swing that proves you wrong. Trend long, below the pullback swing low. Trend short, above the pullback swing high.
- Invalidation stop for reversals: Place the stop beyond the divergence extreme. If price breaks that level, the reversal thesis fails.
- ATR-based stop: Use ATR(14) on the entry timeframe. A simple rule, stop distance equals 1.5 times ATR from entry, then adjust to sit beyond structure. Do not place a stop inside normal noise.
- Hard rule: If your stop needs to be too wide to clear structure, you skip the setup. Do not force position size down to justify a bad location.
Take-Profit Methods
- R-multiples first: Set TP1 at 1R to 1.5R to reduce variance. Move stop to break even only after price closes beyond a structure level, not right at 1R by default.
- Swing targets: Use the next major swing high for longs, swing low for shorts. This aligns with where other traders exit and where liquidity sits.
- Trailing stop using structure: Trail under higher lows in an uptrend, trail over lower highs in a downtrend. Update only after a new swing forms. Do not trail every candle.
- Exit signal option: If MACD crosses against your position after a strong run and price also breaks the last swing, exit. Use price break as the main trigger.
Position Sizing and Risk Rules
- Fixed percent risk: Risk 0.25 to 1.0 percent per trade. Keep it constant across all trades.
- Daily loss limit: Stop trading after 2R of losses in a day. This blocks revenge trades and poor late entries.
- Weekly loss limit: Stop after 5R down on the week. Review your logs before you resume.
- Trade limits: Max 3 trades per session. If you miss the move, you miss it.
- Correlation control: Treat highly correlated pairs as one risk. Two EURUSD and GBPUSD longs can behave like one oversized position.
- Execution routine: Screenshot entry, stop, target, and MACD state. Log the reason for entry in one sentence. Use a repeatable practice routine from this guide on practicing forex trading.
| Setup Type | Must Have | Trigger | Invalidation | Primary Target |
|---|---|---|---|---|
| Trend-following | Trend filter aligned, pullback structure | MACD cross with break of pullback structure | Stop beyond pullback swing | 2R or next swing level |
| Reversal | Divergence at key level, mature swing | Structure break, then MACD agrees | Stop beyond divergence extreme | Next opposing swing, then trail |
High-Probability Setups (With Clear Criteria)
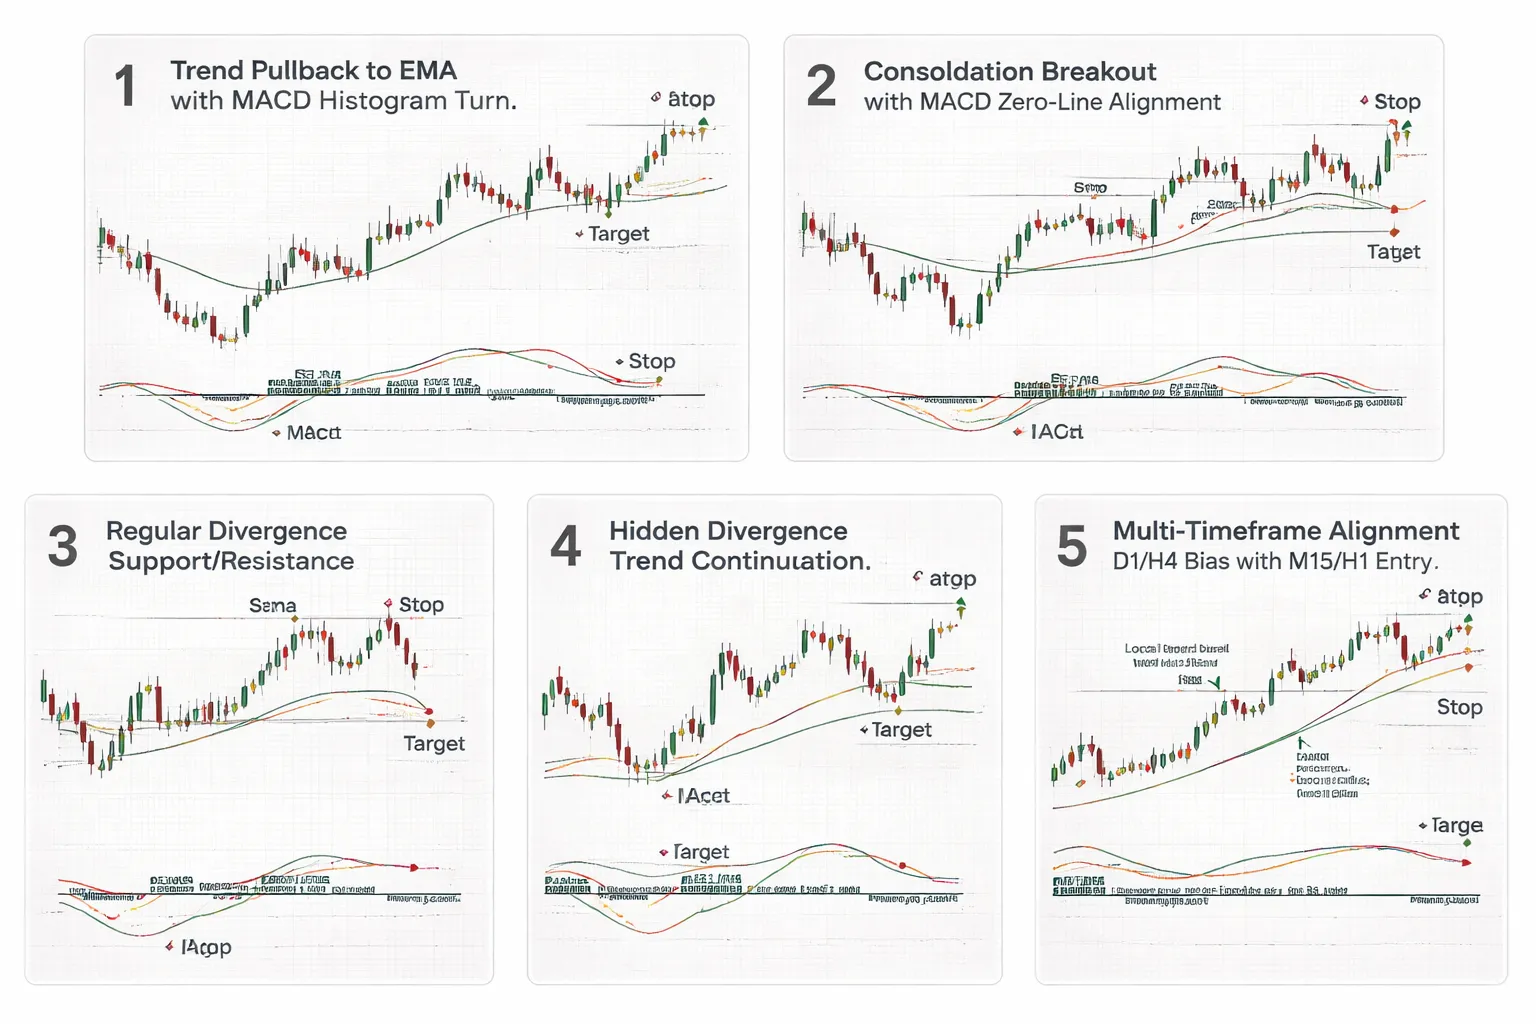
Trend Continuation, Pullback to EMA + MACD Histogram Turn
Use this when the market trends and pulls back in a controlled way. You trade the next impulse, not the middle.
- Market filter: Price sits above a rising EMA for longs, below a falling EMA for shorts. Use EMA 20 or EMA 50. Pick one and keep it fixed.
- Pullback shape: 3 to 8 candles into the EMA zone. No large counter-trend breakout candle.
- MACD condition: Histogram contracts toward zero during the pullback, then prints the first higher bar for longs, first lower bar for shorts.
- Entry trigger: Break of the pullback structure. For longs, buy the break of the pullback lower-high. For shorts, sell the break of the pullback higher-low.
- Stop: Beyond the pullback swing low for longs, swing high for shorts. Add a small buffer for spread.
- Targets: First target at 2R or the prior swing. Then trail behind higher lows or lower highs.
- Skip it if: Histogram flips back and forth for 3 bars, or price closes on the wrong side of the EMA.
Breakout Confirmation, Consolidation Break + Zero-Line Alignment
Use this to avoid early breakout entries. You wait for structure and MACD to agree.
- Structure: Tight range or triangle. At least 10 candles. Clear highs and lows that other traders can see.
- Pre-breakout MACD: Lines flatten and histogram stays small. You want compression.
- Breakout rule: Enter only after a candle closes outside the range. No wick-only breaks.
- Zero-line alignment: For longs, MACD line above zero or crossing above zero within 1 to 3 candles of the breakout. For shorts, MACD line below zero or crossing below zero within 1 to 3 candles.
- Entry trigger: Break-and-close, then enter on the next candle or on a retest of the broken level if it holds.
- Stop: Inside the range, past the opposite side of the breakout level.
- Targets: Measured move of the range height, or next higher timeframe swing level. Take partials at 1.5R to 2R.
- Skip it if: Breakout candle is oversized and MACD stays on the wrong side of zero.
Divergence at Key Levels, Support and Resistance Confluence Filtering
Divergence works best at levels. Without a level, you get noise.
- Location filter: Price tests a prior swing high or swing low, weekly or daily level, or a round number. One level is fine. Two is better.
- Reversal divergence:
- Bearish: Price makes a higher high, MACD makes a lower high.
- Bullish: Price makes a lower low, MACD makes a higher low.
- Maturity filter: Look for a clear push into the level, then slowing. Wicks, smaller candles, or failed follow-through.
- Trigger: Structure break first, then MACD agrees. For longs, break the last lower-high. For shorts, break the last higher-low.
- Stop: Beyond the divergence extreme. If price breaks that point, the idea fails.
- Targets: Next opposing swing, then trail if momentum stays.
- Skip it if: You see divergence in the middle of a trend with no level, or MACD sits far above or below zero with strong momentum.
Hidden Divergence for Trend Continuation, Spot It and Avoid False Reads
Hidden divergence helps you join the trend after a pullback. It fails when you confuse it with a reversal signal.
- Trend requirement: Higher highs and higher lows for longs, lower highs and lower lows for shorts. Use structure, not opinion.
- Hidden bullish divergence: Price makes a higher low, MACD makes a lower low. This signals trend continuation.
- Hidden bearish divergence: Price makes a lower high, MACD makes a higher high.
- Where to look: During a pullback into EMA 20 or EMA 50, or into a prior broken level.
- Trigger: Take the break of the pullback structure in the trend direction, then confirm with a histogram turn back toward the trend.
- Avoid false reads:
- Ignore hidden divergence if price closes beyond the last major swing against the trend.
- Ignore it if MACD crosses the zero line against your trend bias and stays there.
- Ignore it if the pullback is a sharp V-move with no base.
- Stop and target: Stop beyond the pullback swing. Target 2R or the next trend swing.
Multi-Timeframe Alignment, H4 and D1 for Bias, M15 and H1 for Execution
This keeps you out of low-quality signals. You trade in the direction that has room to move.
- D1 bias: Mark the trend and nearest major levels. If D1 MACD sits above zero, favor longs. If below zero, favor shorts.
- H4 timing: Wait for a pullback or consolidation near a level that matches the D1 bias. H4 MACD histogram should contract during pullback and then turn.
- Execution on H1 or M15: Take the trigger from structure break plus MACD cross or histogram turn. Keep entries close to invalidation.
- Conflict rule: If D1 and H4 disagree on zero-line bias, reduce size or skip the trade.
- Risk control: Set position size from your stop distance. Keep risk fixed per trade. Use a clear R multiple plan. See risk-reward ratio.
MACD Strategy Examples (Walkthroughs)
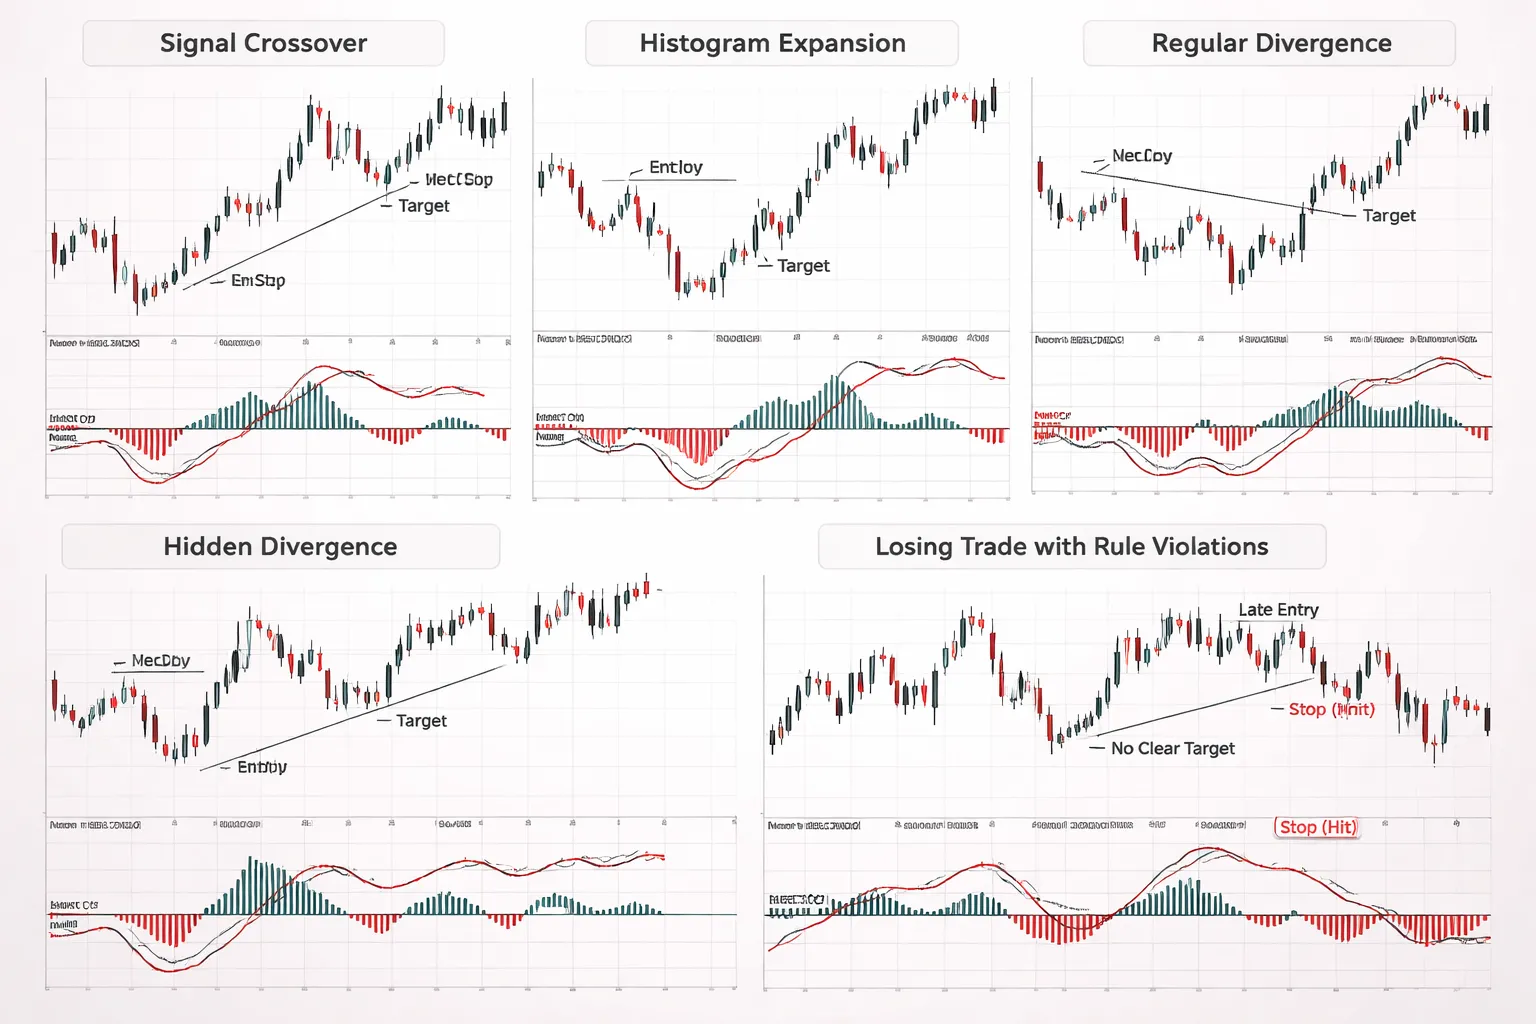
Example 1: Trend-following long with signal crossover and histogram expansion
Market: EURUSD
Timeframes: D1 bias, H4 entry
Setup: D1 price holds above the 200 EMA. MACD stays above zero on D1. You only look for longs.
Trigger: On H4, MACD line crosses above the signal line while both stay above zero. Histogram flips from red to green and expands for at least 2 bars.
- Entry: Buy on a break above the most recent H4 swing high after the crossover prints.
- Stop: Below the last higher low on H4. Place it beyond the swing, not on it.
- Invalidation: H4 closes back below the broken swing high, or MACD drops under zero before your break triggers.
- Target: First target at 2R. If structure shows a clear next swing high before 2R, take that level instead.
- Management: If histogram starts shrinking fast while price stalls under a prior high, take partials at 1.5R and keep the rest to 2R.
What matters: You use the crossover to time, but you rely on trend bias and structure to define where you act.
Example 2: Trend-following short with zero-line confirmation and retest entry
Market: GBPJPY
Timeframes: D1 bias, H4 entry
Setup: D1 prints lower highs and lower lows. MACD sits below zero on D1. You only look for shorts.
Trigger: On H4, MACD crosses below the zero line after a pullback. Histogram turns negative and grows for 2 bars.
- Entry: Wait for a bearish structure break on H4. Then sell the retest of the broken support zone. Use the retest as your timing filter.
- Stop: Above the retest swing high. Keep it past the wick that rejected the zone.
- Invalidation: H4 closes back above the broken support zone, or MACD snaps back above zero on the retest.
- Target: 2R, or the next H4 demand zone that caused the last impulsive bounce.
- Management: If you get a clean bearish engulfing or pin at the retest, you can tighten size by using that candle high as the stop, but only if it still sits beyond structure.
What matters: The zero-line cross filters weak pullbacks. The retest entry improves your stop distance and R multiple.
Example 3: Regular divergence reversal with structure break and risk-defined target
Market: AUDUSD
Timeframe: H4
Setup: Price makes a lower low into a known support zone. MACD makes a higher low. That is regular bullish divergence.
Trigger: You do not buy the divergence. You wait for proof.
- Step 1, mark the swings: Mark the two price lows that form divergence. Mark the swing high between them. That swing high is your structure trigger.
- Step 2, confirm: Wait for H4 to close above that swing high. This is your structure break.
- Entry: Buy on a retest of the broken swing high, or buy the next break of a minor consolidation high if retest does not come.
- Stop: Below the divergence low. If the divergence low breaks, your thesis fails.
- Target: Use R multiples first. Take 2R. If a clean prior supply zone sits near 1.8R, take it and move on.
What matters: Divergence finds a candidate turn. Structure confirms the turn. Your stop sits at the point that makes you wrong.
Example 4: Hidden divergence continuation with higher-timeframe support
Market: USDCHF
Timeframes: D1 context, H4 entry
Setup: D1 trend stays up. Price pulls back into a D1 support zone. You want continuation, not a top.
Signal: On H4, price makes a higher low, but MACD makes a lower low. That is hidden bullish divergence.
- Filter: D1 MACD stays above zero, or it stays close to zero without a strong downside push. If D1 flips below zero, you skip.
- Entry: Buy on a break above the H4 pullback trendline, or on a break above the last H4 lower high inside the pullback.
- Stop: Below the H4 higher low that created the hidden divergence. Place it below the D1 support edge if that sits close.
- Target: Prior D1 swing high, or 2R, whichever comes first.
- Add-on rule: If price breaks out and then forms a new H4 higher low while MACD holds above zero, you can pyramid once with the same fixed risk rules.
What matters: Hidden divergence works best when you trade with the higher-timeframe trend and you anchor your idea at a clear support zone.
Example 5: A losing trade case study and what the rules would change (post-trade review)
Market: NZDUSD
Timeframes: D1 bias, H1 entry
The trade you took: You saw a bullish MACD crossover on H1 and bought. Price tagged your stop within the next sessions.
What went wrong:
- No trend filter: D1 MACD sat below zero and price stayed under the 200 EMA. You bought into bearish bias.
- No structure trigger: You entered on the crossover without a break of a swing high. You had no proof of a shift.
- Histogram warning ignored: Histogram flipped green for one bar, then shrank. Momentum never expanded.
- Stop placed at an obvious level: Stop sat on a prior micro low. Liquidity sweep hit it, then price ranged.
What your rules would change:
- Conflict rule: If D1 and H4 disagree on zero-line bias, you skip or cut size. This trade becomes a skip.
- Structure rule: You only enter after a swing break, then a retest or clean breakout. No break, no trade.
- Momentum rule: You require histogram expansion for 2 bars after the crossover. One bar does not qualify.
- Stop rule: Stop goes past the swing that invalidates the setup, not inside noise. You accept a wider stop or you pass.
Post-trade action: Log the screenshot and tag it as a “MACD-first entry.” You want fewer of these. If you need a trigger candle for your entry timing, use a simple rejection pattern from your level. See common candlestick patterns and keep it rule-based.
Combining MACD With Other Tools (Without Signal Overload)
Price Action and Market Structure First
Use MACD after structure, not before it.
- Define the swing: Mark the last clear swing high and swing low on your trading timeframe.
- Trade breaks with follow-through: A break needs a close beyond the swing, not a wick.
- Wait for the retest: Retest the broken level or zone, then look for MACD to agree with direction.
- Filter with MACD: Take longs when price holds higher lows and MACD stays above zero or prints rising histogram bars. Take shorts when price holds lower highs and MACD stays below zero or prints falling histogram bars.
This keeps MACD in a support role. Structure gives you direction and invalidation.
Support, Resistance, and Liquidity Zones
MACD signals matter most at levels that force decisions.
- Mark obvious levels: Prior daily high and low, session high and low, and clean horizontal pivots.
- Use zones, not lines: Use the wick area where price turned fast.
- Prioritize liquidity: Equal highs and equal lows often attract stops. Expect spikes. Demand a close back inside the zone before you trust the move.
- MACD job: Confirm the push away from the level. You want momentum expansion, not a weak crossover in the middle of nowhere.
If your MACD trigger prints far from any level, pass. Learn the base rules in price action trading if you need a clean structure process.
Volatility Filters to Avoid Chop (ATR, Bollinger Bands)
Chop makes MACD cross too often. Add one volatility filter. Keep it binary.
- ATR filter: Trade only when ATR(14) is above its 20-period average, or when ATR is rising for 3 to 5 bars. Skip flat ATR.
- Range filter: If the last 20 bars sit inside a tight range, skip. MACD will whipsaw.
- Bollinger Bands filter: Trade only when bands expand and price closes outside the midline in your direction. Skip when bands squeeze and price hugs the midline.
Do not use ATR and Bollinger together unless you have a written rule that never changes. One filter is enough.
Volume Proxies in Forex (Tick Volume)
You do not have centralized volume in spot forex. Tick volume can still help.
- When it helps: Breakouts and level rejections. You want a tick volume spike on the impulse leg, then lower tick volume on the pullback.
- What to avoid: Using tick volume to predict reversals in quiet sessions. It will mislead you.
- Simple confirmation rule: For a breakout retest long, the breakout candle tick volume should be above the last 20-bar average. The retest should print below that spike.
Tick volume is a confirmation tool. It does not override structure or your stop rule.
Simple Indicator Stack Examples (No Signal Overload)
Limit yourself to three roles. Direction, trigger, and trade quality.
- Stack 1: MACD + EMA(200) + ATR(14)
- EMA(200): Bias. Longs above, shorts below.
- MACD: Trigger. Take cross or histogram expansion only in the EMA direction.
- ATR: Quality. Trade only when ATR is rising or above its baseline.
- Stack 2: MACD + EMA(50) + Key levels
- Key levels: Location. You only act at a zone.
- EMA(50): Trend filter and dynamic retest guide.
- MACD: Momentum check. You want momentum to expand as price leaves the level.
- Stack 3: MACD + Bollinger Bands(20,2) + Market structure
- Structure: Direction and invalidation.
- Bollinger: Regime. Trade expansion, skip squeeze.
- MACD: Trigger. Confirm the expansion leg, not the range.
Keep your chart quiet. If two tools answer the same question, delete one.
Common Mistakes and How to Fix Them
Taking every crossover, why it fails in ranges and how to filter
MACD crossovers print nonstop in a range. You take them all, you bleed spread and get chopped.
- Fix 1, trade location first. Only take crossovers that occur at a clear level, supply, demand, swing high, swing low. Skip the middle of the box.
- Fix 2, add a regime filter. Use Bollinger Bands(20,2). Trade in expansion. Skip squeezes and flat bands.
- Fix 3, use the zero line as a bias filter. Longs work better when MACD stays above zero. Shorts work better when MACD stays below zero. If it keeps flipping around zero, you are in chop.
- Fix 4, demand momentum expansion. Favor crossovers where the histogram grows for 2 to 3 bars after the cross. Skip crosses with a shrinking histogram.
Ignoring the higher timeframe, the quickest way to get chopped up
If you trade MACD signals against the higher timeframe swing, you buy pullbacks that keep falling and you sell bounces that keep rising.
- Fix 1, set a top down bias. Mark the higher timeframe market structure. Identify higher highs and higher lows, or lower highs and lower lows. Trade in that direction.
- Fix 2, use HTF levels as your map. Only take lower timeframe MACD triggers near HTF support or resistance. Avoid signals into the next HTF level.
- Fix 3, align momentum. If HTF MACD histogram trends up, prioritize long setups. If it trends down, prioritize short setups. If HTF momentum is flat, reduce size or skip.
- Fix 4, avoid the dead zone. When price sits between two HTF levels, you are trading noise. Wait for a touch or a break.
Misreading divergence, confirmation rules to reduce false reversals
Divergence shows weakening momentum, not a guaranteed reversal. Many divergences resolve with a continuation move.
- Rule 1, require structure. For bullish divergence, you want a lower low in price but a higher low in MACD histogram, then a break of the last swing high on your execution timeframe. For bearish divergence, you want a higher high in price but a lower high in the histogram, then a break of the last swing low.
- Rule 2, use it at levels. Divergence in open space fails more. Give it a reason, a prior support or resistance, a major swing point, or a band edge.
- Rule 3, avoid fighting strong trends. If price keeps making clean impulse legs and shallow pullbacks, treat divergence as a profit taking cue, not an entry to fade the trend.
- Rule 4, wait for the momentum turn. You want histogram bars to flip direction and start building on the reversal side. If the histogram keeps printing against your idea, you are early.
Late entries due to lag, tactics for earlier but safer execution
MACD reacts after price. If you enter on the crossover alone, you often buy the top of the pullback and sell the bottom.
- Tactic 1, use price for entry, MACD for confirmation. Let price break a minor structure level first, then use MACD to confirm momentum expansion.
- Tactic 2, use the histogram early. Histogram contraction often shows before the lines cross. If your plan needs earlier timing, watch for the histogram to flip and build for 2 bars, then enter on a pullback.
- Tactic 3, trade the first pullback after expansion. If bands expand and structure breaks, do not chase. Wait for a pullback to the broken level, then enter when histogram starts growing again.
- Tactic 4, define invalidation before entry. Place your stop beyond the structure point that should not break. If you cannot place a clear stop, skip the trade.
Risk errors, moving stops, oversizing, and revenge trading guardrails
Most MACD losses come from risk decisions, not the indicator.
- Guardrail 1, stop rules. Set the stop at a structure invalidation point. Do not widen it. If you move it, only move it to reduce risk.
- Guardrail 2, size from the stop. Choose your risk per trade first, then calculate position size from stop distance. Oversizing makes normal drawdowns feel like emergencies.
- Guardrail 3, pre plan exits. Set a target at the next structure level. If you trail, trail behind swings, not behind MACD lines.
- Guardrail 4, daily loss cap. Stop after a fixed daily loss or a fixed number of losing trades. No exceptions.
- Guardrail 5, revenge trading rule. After two losses in a row, take a break. Review the last two charts. Only return if your setup matches your rules.
- Guardrail 6, enforce minimum reward. Skip trades that cannot reach at least 1.5R to 2R before the next barrier. Use this risk to reward ratio guide for the math and examples.
Pros, Cons, and When MACD Underperforms
Strengths
- Clarity. You get three simple reads, line cross, zero-line bias, histogram expansion or contraction. You can write rules around each one.
- Versatility. You can use the same logic on multiple timeframes, and across most major FX pairs. You can adapt it to trend trading or pullback entries.
- Momentum insight. MACD shows when trend strength builds or fades. The histogram often warns you before price rolls over or accelerates.
Weaknesses
- Lag. MACD reacts after price moves. Late entries and late exits happen most in fast markets and after large candles.
- Whipsaws. In ranges, you will get frequent crosses that go nowhere. Small swings flip the signal line back and forth.
- Divergence subjectivity. Traders draw different swing points. Two people can label the same chart differently, then take opposite trades.
Best Market Conditions
- Clean trends. Price makes higher highs and higher lows, or lower highs and lower lows. MACD stays on one side of zero most of the time.
- Orderly pullbacks. Price pulls back in smaller candles, then resumes. MACD cools off during the pullback, then re-expands on continuation.
- Clear structure. You have obvious swing points and barriers. This makes 1.5R to 2R targets realistic before the next obstacle.
Worst Market Conditions
- Tight ranges. Mean reversion dominates. MACD cross signals cluster and fail.
- Erratic volatility. Wide alternating candles distort the averages. The indicator flips states without follow-through.
- News spikes. A single release can create a one-candle trend, then a full retrace. MACD confirms after the move, then traps you on the reversal.
Practical Mitigation
- Regime filters. Trade MACD signals only when price holds above a rising moving average for longs, or below a falling moving average for shorts. Add a simple structure filter, trade only when price breaks and holds beyond a key level from your support and resistance map.
- Scheduled-news rules. No new trades 10 to 15 minutes before high-impact releases on your pairs. Wait for the first spike to settle, then reassess. If you trade the event, use predefined orders and hard stops, and keep it rule-based with the right order type.
- Trade caps. Limit MACD attempts per session. Cap retries after failed crosses. Pair this with your daily loss limit and your two-loss break rule.
- Divergence rules. Only act on divergence when price sits at a major level, and the divergence breaks structure. Ignore weak divergence in the middle of a range.
Backtesting and Building Confidence in Your MACD Forex Strategy

Backtesting and Building Confidence in Your MACD Forex Strategy
What to Track
Track outcomes per trade and per session. Keep it simple. If you cannot measure it, you cannot improve it.
- Win rate: wins divided by total trades.
- Average win and average loss: in R, not pips. R equals your initial stop distance.
- Expectancy: (Win rate x Avg win in R) minus (Loss rate x Avg loss in R). Positive expectancy is the goal.
- Profit factor: gross profit divided by gross loss. Under 1.0 means you lose money.
- Max drawdown: biggest peak to trough drop in your equity curve. This sets your risk limits.
- Trade frequency: trades per week and per session. Low frequency can still work, but you need patience and larger samples.
- Rule adherence: yes or no. Mark any rule break. Separate rule breaks from system performance.
| Metric | What it tells you | Common mistake |
|---|---|---|
| Expectancy | Whether the strategy makes money per trade over time | Using pips instead of R and mixing different stop sizes |
| Profit factor | How efficiently profits outweigh losses | Ignoring spread and slippage |
| Max drawdown | Worst pain you must survive | Measuring from balance, not equity swings |
| Win rate | How often you get paid | Chasing high win rate with tiny targets and big stops |
Sample Size Rules and Avoiding Cherry-Picked Periods
Small samples lie. Markets rotate. Your MACD rules must survive trends, ranges, high volatility, and quiet weeks.
- Start with at least 100 trades for a first read on expectancy.
- Aim for 200 to 300 trades before you trust the numbers.
- Test across multiple market regimes, not one strong trend that flatters MACD crosses.
- Include different sessions if you plan to trade them. London behaves different from New York.
- Keep the pair list tight. One to three pairs beats ten pairs with shallow data.
Do not tune settings until the base rules show consistent failure. Most “optimization” just fits noise.
Backtesting Workflow
Use a fixed workflow. Do not improvise mid-test.
- Rules: write entry, stop, target, and exit rules in one page. Define the MACD settings, timeframe, and filters.
- Data: pick the pair, timeframe, and date range. Use the same spread assumption throughout.
- Journal: log every setup, taken or skipped. Capture screenshot, reason, stop size, target, and result in R.
- Refine: change one variable at a time. Examples, add a trend filter, adjust stop method, or change the exit rule. Keep everything else fixed.
- Validate: re-test the revised rules on a fresh period you did not use to build the rule. Treat this as the real exam.
When you refine, focus on behavior that repeats. Examples, repeated losses during low range conditions, repeated whipsaws near the zero line, repeated wins after structure breaks. Use price structure and clean chart work, not extra indicators. If you need pattern context, use a single reference like candlestick patterns to define confirmation, then keep it consistent.
Forward Testing on Demo, What Proof Looks Like
Backtests show potential. Forward tests show execution reality. You need both.
- Trade the exact rules on demo for at least 30 trading days or 50 trades, whichever comes later.
- Use the same sessions you will trade live. Use the same order types and the same stop placement.
- Track slippage and spreads. A MACD edge can vanish if your entries and exits slip.
- Measure discipline. Your proof includes rule adherence above 95 percent.
Proof means three things. You get positive expectancy. Your drawdown stays inside your planned limit. You execute without revenge trades, extra entries, or moving stops.
Trading Plan Template, Turning Signals Into a Process
Turn MACD signals into a checklist. A checklist prevents impulse trades.
- Market: pair, timeframe, session, news filter.
- MACD setup: settings, crossover type, zero line rule, divergence rule.
- Context filter: trend definition, key level requirement, range rule, structure break requirement.
- Entry: order type, trigger candle, confirmation rule.
- Stop: placement method, invalidation level, max stop in pips, risk per trade in percent and in account currency.
- Target and exit: fixed R target, structure-based target, partials rule, trailing stop rule, time-based exit rule.
- Trade caps: max trades per session, max retries after failed crosses, daily loss limit, two-loss break rule.
- Review: end-of-day stats, screenshots, notes on rule breaks, one improvement item for the next session.
FAQ
What are the best MACD settings for forex?
Start with 12, 26, 9. Use it on liquid pairs and major sessions. Slow it down for higher timeframes, speed it up for lower timeframes. Change one input at a time and track results over at least 50 trades per market.
Which timeframe works best with MACD?
Use H1 to D1 for cleaner signals and fewer whipsaws. Use M5 to M15 only with strict filters and hard trade caps. Match your stop size to timeframe volatility, not to the indicator.
Is MACD leading or lagging?
MACD lags price. It uses moving averages, so it confirms momentum after it starts. Treat it as a trigger and trend filter, not a predictor. Your risk control matters more than timing perfection.
What is the most reliable MACD signal?
Signal line crossover in the direction of the higher timeframe trend, after price breaks structure. Avoid taking crosses in the middle of a range. Use the zero line as a bias check, not as a standalone entry.
How do you trade MACD divergence?
Use divergence as a warning, not an entry. Wait for a clear break of structure and a crossover back in your direction. Divergence fails often in strong trends. Keep risk fixed and reduce size if volatility expands.
How do you avoid MACD false signals?
Skip trades during low volume ranges and before major news. Trade with the session trend. Demand confluence from support and resistance or a simple pattern. Use one clean trigger, one stop rule, one exit rule.
What stop loss works with a MACD strategy?
Place the stop beyond the swing that invalidates the setup. Do not use a fixed pip stop across pairs. If your stop sits inside noise, you will get chopped. Size your position from stop distance and risk percent.
What take profit works best with MACD?
Use fixed R targets, structure targets, or partials plus a trailing stop. Keep it consistent. If you cannot hold winners, your expectancy drops. Learn more in this risk-reward ratio guide.
Can you use MACD alone?
You can, but you should not. MACD gives momentum, not context. Add a simple market structure rule and a volatility based stop rule. Keep the chart clean. One extra filter beats three weak filters.
Does MACD work in ranging markets?
It performs worse in tight ranges. Crossovers cluster and losses stack. Either stand aside or switch to mean reversion rules with clear range highs and lows. If you trade the range, cap attempts and stop after two losses.
Is MACD good for scalping?
It can work, but spreads and whipsaws hurt. Use the fastest liquid pairs, trade only peak session hours, and set a hard daily loss limit. If you need many trades to win, costs will eat the edge.
How do you backtest a MACD forex strategy?
Write rules first, then test without changing them mid-run. Log pair, session, timeframe, entry type, stop in pips, R result, and screenshot. Separate crossover, zero line, and divergence setups. Evaluate expectancy and max drawdown.
Conclusion
MACD works best when you treat it as a filter, not a prediction tool. Use it to confirm direction and timing. Build your plan around risk, not around signals.
- Pick one setup. Crossover, zero line, or divergence. Do not mix rules mid-trade.
- Standardize settings. Start with 12, 26, 9. Change one input at a time, then retest.
- Trade liquid hours. Focus on peak sessions and skip dead ranges.
- Define exits first. Place your stop where your idea fails, then set targets that give clean R multiples. Use this guide on how to set stop loss and take profit.
- Track expectancy. Your win rate means nothing without average win, average loss, and max drawdown.
Final tip. Run a 50 trade test on one pair and one timeframe. Keep every rule fixed. If expectancy stays positive after spreads and slippage, scale size slowly. If it does not, change the rules, then restart the test from zero.
-
Stop Loss vs Take Profit: Differences, Examples & Best Practices
5 months ago -
Forex Trading Psychology Tips: How to Stay Disciplined and Consistent
5 months ago -
Forex Order Types Explained: Market vs Limit vs Stop Orders
5 months ago -
How to Set Stop Loss and Take Profit (Step-by-Step)
5 months ago -
How to Start Forex Trading Step by Step (Beginner Roadmap)
5 months ago
-
-
- Trend Continuation, Pullback to EMA + MACD Histogram Turn
- Breakout Confirmation, Consolidation Break + Zero-Line Alignment
- Divergence at Key Levels, Support and Resistance Confluence Filtering
- Hidden Divergence for Trend Continuation, Spot It and Avoid False Reads
- Multi-Timeframe Alignment, H4 and D1 for Bias, M15 and H1 for Execution
-
- Example 1: Trend-following long with signal crossover and histogram expansion
- Example 2: Trend-following short with zero-line confirmation and retest entry
- Example 3: Regular divergence reversal with structure break and risk-defined target
- Example 4: Hidden divergence continuation with higher-timeframe support
- Example 5: A losing trade case study and what the rules would change (post-trade review)
-
- Taking every crossover, why it fails in ranges and how to filter
- Ignoring the higher timeframe, the quickest way to get chopped up
- Misreading divergence, confirmation rules to reduce false reversals
- Late entries due to lag, tactics for earlier but safer execution
- Risk errors, moving stops, oversizing, and revenge trading guardrails
-
- What are the best MACD settings for forex?
- Which timeframe works best with MACD?
- Is MACD leading or lagging?
- What is the most reliable MACD signal?
- How do you trade MACD divergence?
- How do you avoid MACD false signals?
- What stop loss works with a MACD strategy?
- What take profit works best with MACD?
- Can you use MACD alone?
- Does MACD work in ranging markets?
- Is MACD good for scalping?
- How do you backtest a MACD forex strategy?
-
-
-
- Trend Continuation, Pullback to EMA + MACD Histogram Turn
- Breakout Confirmation, Consolidation Break + Zero-Line Alignment
- Divergence at Key Levels, Support and Resistance Confluence Filtering
- Hidden Divergence for Trend Continuation, Spot It and Avoid False Reads
- Multi-Timeframe Alignment, H4 and D1 for Bias, M15 and H1 for Execution
-
- Example 1: Trend-following long with signal crossover and histogram expansion
- Example 2: Trend-following short with zero-line confirmation and retest entry
- Example 3: Regular divergence reversal with structure break and risk-defined target
- Example 4: Hidden divergence continuation with higher-timeframe support
- Example 5: A losing trade case study and what the rules would change (post-trade review)
-
- Taking every crossover, why it fails in ranges and how to filter
- Ignoring the higher timeframe, the quickest way to get chopped up
- Misreading divergence, confirmation rules to reduce false reversals
- Late entries due to lag, tactics for earlier but safer execution
- Risk errors, moving stops, oversizing, and revenge trading guardrails
-
- What are the best MACD settings for forex?
- Which timeframe works best with MACD?
- Is MACD leading or lagging?
- What is the most reliable MACD signal?
- How do you trade MACD divergence?
- How do you avoid MACD false signals?
- What stop loss works with a MACD strategy?
- What take profit works best with MACD?
- Can you use MACD alone?
- Does MACD work in ranging markets?
- Is MACD good for scalping?
- How do you backtest a MACD forex strategy?
-
-
How to Place a Forex Trade Step by Step (Your First Trade Explained)
3 months ago -
Forex Trading vs Crypto Trading: Which Market Is Better for Beginners?
3 months ago -
Forex Lot Size Calculator: How to Use It to Size Trades Correctly
5 months ago -
How to Calculate Position Size in Forex (Position Sizing Formula + Examples)
5 months ago -
Forex Leverage Explained: How It Works, Pros, Cons & Examples
5 months ago
-
Forex Trading Platforms Comparison: MetaTrader vs cTrader vs TradingView
5 months ago -
Is Forex Trading Legal in the United States? Rules, Regulators & What to Know
5 months ago -
Stop Loss vs Take Profit: Differences, Examples & Best Practices
5 months ago -
Forex Market Hours & Trading Sessions Explained (Best Times to Trade)
5 months ago -
Best Forex Trading Journal Tools (Top Picks Compared)
5 months ago