Pullback Trading Strategy (Forex): How to Enter Trends Without Chasing

Chasing breakouts ruins entries. Pullbacks give you a second chance inside a trend.
A pullback trading strategy in Forex means you wait for price to retrace, then you enter when the trend resumes. You aim for better price, tighter risk, and cleaner invalidation.
You will learn how to confirm the trend, mark the pullback zone, and time entries with simple tools. You will learn where to place stops, how to set realistic targets, and how to filter weak pullbacks that often turn into reversals. You will also learn common mistakes that make pullbacks fail, including trading against higher time frame structure and ignoring session volatility.
If you need a clean way to map trend direction first, use this trendline drawing guide.
Key Takeaways
- In het kort: Trade pullbacks in the direction of the higher time frame trend.
- In het kort: Mark structure first, higher highs and higher lows for an uptrend, lower highs and lower lows for a downtrend.
- In het kort: Enter after price shows rejection at a clear level, do not buy or sell mid pullback.
- In het kort: Place your stop where the pullback thesis breaks, beyond the swing that should hold.
- In het kort: Set targets at logical liquidity, prior highs or lows, next structure level, or measured move, then keep risk fixed.
- In het kort: Filter weak setups, shallow trends, messy structure, pullbacks that cut through multiple levels, or low participation sessions.
- In het kort: Respect session volatility, widen stops or reduce size when ranges expand, skip entries when spreads and spikes dominate.
- In het kort: Avoid common errors, trading against the higher time frame, moving stops, and forcing entries when price has not confirmed.
- In het kort: Use a clean trend map, see this trendline drawing guide.
Rule to keep: Your edge comes from structure plus timing, trend first, pullback second, entry last.
What a pullback is in Forex (and why it happens)
What a pullback is in Forex
A pullback is a temporary move against the current trend. It happens after an impulse leg, while the market pauses, rebalances, and finds new liquidity. Your job is to treat it as a timing window inside a trend, not a new trend.
Pullbacks show up as one of three structures. You need to label them correctly, or you will enter too early or hold through a reversal.
Correction vs retracement vs consolidation
- Retracement, a measured move back into prior structure, often toward a broken level, trendline, or moving average. Price still makes higher lows in an uptrend, or lower highs in a downtrend.
- Correction, a deeper retracement that breaks the last swing level inside the trend, but does not break the higher time frame structure. It often shifts momentum and widens the entry risk.
- Consolidation, a sideways pause where price compresses and prints overlap. It builds liquidity on both sides before continuation or reversal.
In practice, traders call all three a pullback. You should be stricter. Use “pullback” only when the higher time frame trend remains intact and you still see a clear path for trend resumption.
Why pullbacks happen in Forex
- Profit-taking. Trend traders scale out near prior highs or lows, round numbers, or session highs. That selling or buying creates the first counter move.
- Liquidity runs. Price dips below a recent swing low in an uptrend, or pops above a swing high in a downtrend. It triggers stops and fills larger orders. Then price snaps back into trend.
- Mean reversion. After a fast impulse, price stretches from fair value. Short-term flows push it back toward common reference areas, like a prior breakout zone or the midpoint of the impulse.
- News digestion. A release creates a spike, then the market reprices. You often get a pullback into the move, then continuation once spreads normalize and liquidity returns.
Pullback anatomy you can trade
- Impulse leg. Clean expansion, strong candles, little overlap. This leg defines direction and sets the structure you will use for entries and stops.
- Corrective leg. Slower pace, more overlap, smaller bodies, more wicks. Price revisits prior structure and hunts resting liquidity.
- Resumption leg. Break of the corrective swing, reclaim of the key level, or a momentum push away from the pullback zone. This is where you look for confirmation, then execute.
Do not reverse the order. Trend first, pullback second, entry last. If you skip structure, you chase. If you skip timing, you enter inside the pullback and absorb noise.
Where Forex pullbacks differ
- Sessions. Pullbacks cluster around session handoffs. Asia ranges, London breaks, New York extends or reverses. A pullback can be a session reset, not a trend change.
- Liquidity pockets. Price often targets obvious swing points, prior day high or low, and round numbers to fill orders. Those areas can create sharp pullback wicks before continuation. Use clean support and resistance levels, see support and resistance.
- News shocks. Forex reacts hard to CPI, NFP, rates, and central bank comments. Spreads widen, candles spike, and the first pullback can be untradeable. You want the second, cleaner pullback after volatility contracts.
Pullback vs reversal: how to avoid buying the top or selling the bottom
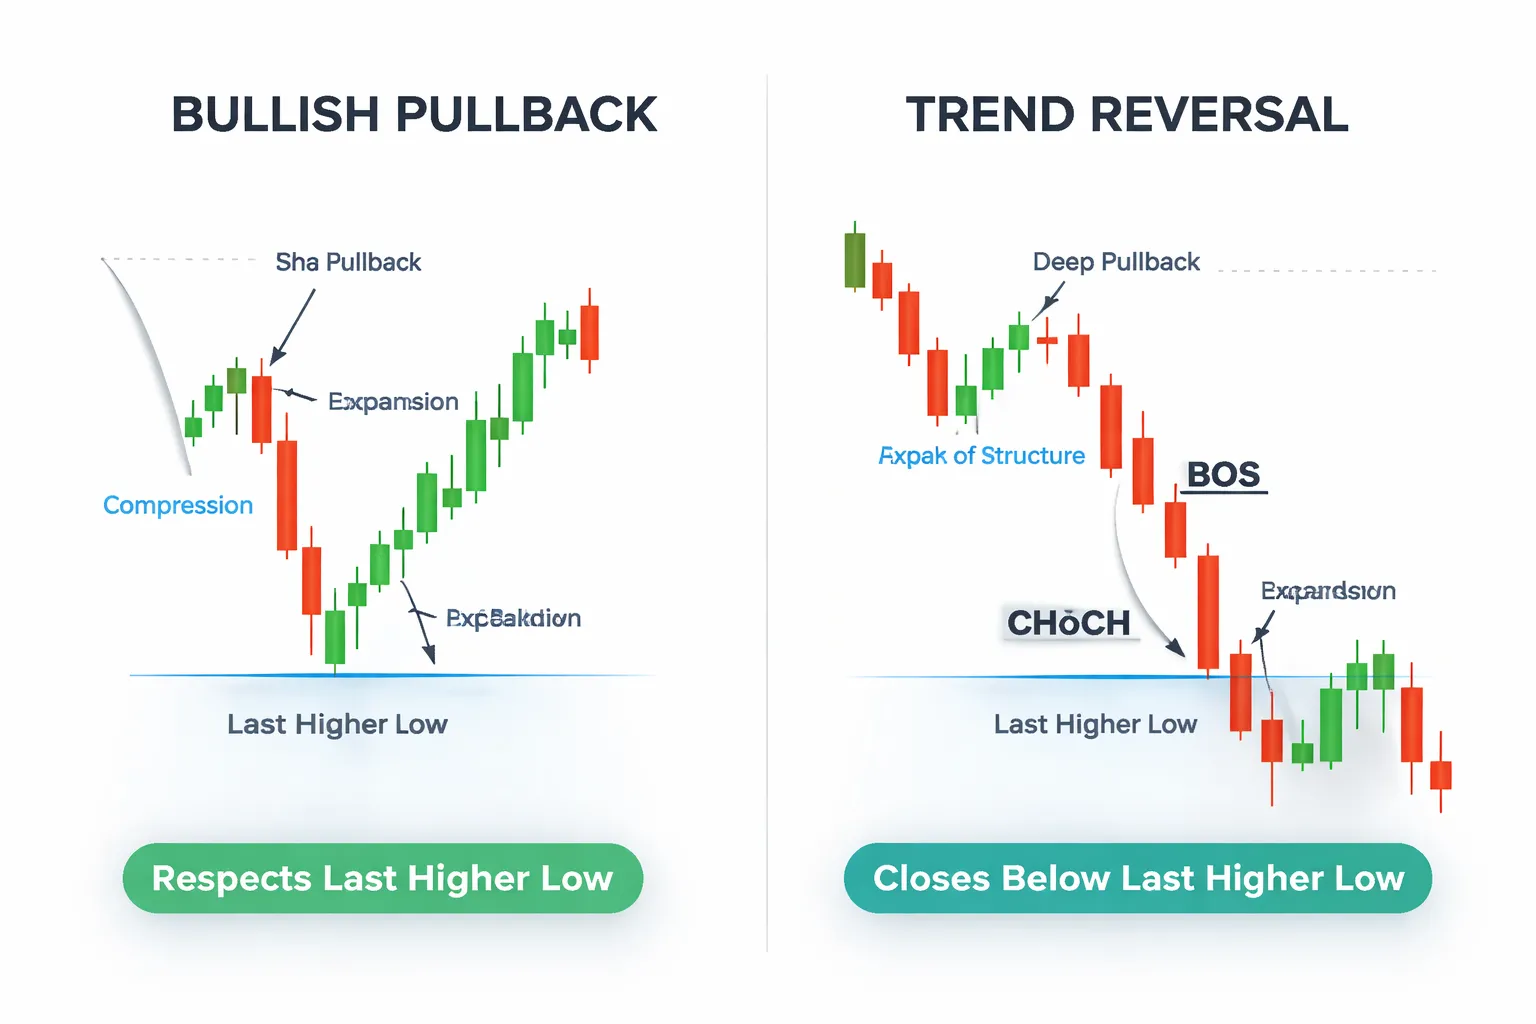
Market structure signals, continuation vs structure break
A pullback respects the trend structure. A reversal breaks it.
- Uptrend pullback: price pulls into a prior swing high that now acts as support, then holds above the last higher low.
- Downtrend pullback: price rallies into a prior swing low that now acts as resistance, then holds below the last lower high.
- BOS, break of structure: in an uptrend, a close below the last higher low. In a downtrend, a close above the last lower high. Treat this as a warning.
- CHoCH, change of character: the first clean sign that swings stop making higher highs and higher lows, or lower lows and lower highs. You often see it before a full trend reversal.
Use closes, not wicks, for structure decisions. Wicks show liquidity runs. Closes show acceptance.
Depth and duration clues, how far and how long matters
Most trend pullbacks stay contained. Reversals push deeper and keep price stuck.
- Shallow pullback: holds above the prior breakout area and snaps back within a few candles. This often signals trend strength.
- Deep pullback: cuts through multiple prior swing levels and tags the origin of the impulse move. This raises reversal risk.
- Time warning: if the pullback takes longer than the prior impulse leg, you have loss of control. Reduce size or skip the trade.
- Multiple tests: two or three taps into the same support or resistance weaken it. Your next entry needs tighter rules or no trade.
Track both distance and time. A small pullback that drags on can still turn into distribution.
Momentum and volatility behavior, clean pullbacks vs failed trends
A pullback usually shows compression. A reversal often shows expansion against your trend.
- Healthy pullback: smaller candles, overlap, shrinking ranges, and fewer strong closes against the trend.
- Reversal pressure: wide range candles into the pullback, strong closes through support or resistance, and follow-through on the next candle.
- Failed follow-through: price breaks a key level, then instantly snaps back and cannot continue. This often means stop runs, not a real reversal.
- Breakout failure after pullback entry: you enter, price pushes, then stalls and grinds back. Exit faster. Grind is where trends die.
Pair this with a simple trend filter like a moving average and trade pullbacks that reclaim it with strong closes. See this moving average trend filter.
Volume and order-flow proxies you can use in spot Forex
Spot Forex has no centralized volume. You can still use proxies.
- Tick volume: more ticks often means more activity. In a pullback, you want lower tick volume than the prior impulse. In a reversal attempt, tick volume often rises as price pushes against the trend.
- Session behavior: London and New York bring real flow. A pullback that holds during liquid hours carries more weight than one that only holds in Asia.
- Spread and slippage: widening spread near your level signals stress. You need extra confirmation or you skip the entry.
- Futures and options cues: if you track DXY futures, EUR or JPY futures, or large option strikes, watch for rejection at those levels. Use it as context, not as a trigger.
Decision checklist before you enter any pullback
- Trend: clear higher highs and higher lows, or lower lows and lower highs, on your trading timeframe.
- Structure: no close beyond the last swing that defines the trend. No BOS against you.
- Level: pullback hits a clean prior swing level, breakout zone, or the midpoint of the impulse. Avoid random mid-range entries.
- Behavior: pullback shows compression. No strong expansion candles through your level.
- Trigger: you get a reclaim and close back in trend direction, or a clear rejection with a strong body.
- Risk: your stop sits beyond the structure point that invalidates the setup, not inside the noise. Your target reaches the prior high or low at minimum.
- Timing: avoid the first pullback after a news spike. Prefer the second pullback after ranges tighten.
If you cannot check these boxes fast, you are guessing. Guessing is how you buy tops and sell bottoms.
Trend qualification: choosing the right market conditions for pullback entries
Multi-timeframe alignment
Qualify the trend on a higher timeframe. Execute the pullback on a lower timeframe.
- Higher timeframe (HTF): Use H4 or D1. Mark the last two swing highs and swing lows. Uptrend means higher highs and higher lows. Downtrend means lower lows and lower highs.
- Key HTF levels: Mark the most recent broken swing level and the last clean impulse leg. These give you the “trend structure” the pullback must respect.
- Lower timeframe (LTF): Use M15 or H1. You want the pullback to retrace into a prior LTF structure zone that lines up with HTF direction.
- Alignment rule: Only take LTF longs if HTF is up and price holds above the last HTF higher low. Only take LTF shorts if HTF is down and price holds below the last HTF lower high.
- One clean invalidation point: Your stop must sit beyond the HTF swing that would break the trend definition. If you cannot point to that level in seconds, skip.
If HTF looks trendless but LTF trends, you trade noise. If HTF trends but LTF chops, you wait for LTF to clean up.
Trend strength filter (ADX, standardized)
Use ADX to avoid “trends” that cannot push.
- Indicator: ADX(14) on the timeframe you trade entries on, usually M15 or H1.
- Minimum strength: ADX above 20. Below 20 means the market often ranges and pullbacks keep bleeding.
- Preferred condition: ADX 25 to 40 and rising. Rising ADX signals expanding directional pressure.
- Skip condition: ADX falling from above 30 while price stalls near prior highs or lows. That often turns pullbacks into reversals.
- Structure still comes first: ADX qualifies conditions. It does not replace swing points and invalidation levels.
Pair selection
Pick pairs that trend cleanly and do not punish you with costs.
- Start with majors: EURUSD, GBPUSD, USDJPY, AUDUSD, USDCAD. They usually offer tighter spreads and more stable execution.
- Be careful with crosses: GBPJPY, EURJPY, GBPAUD can trend hard but pull back deeper and whip more. Your stop needs more room.
- Spread sensitivity rule: If the spread is more than 10 percent of your planned stop size, the trade quality drops. Example, 1.5 pip spread with a 10 pip stop is a problem.
- Typical pullback behavior: Majors often respect shallow pullbacks in strong trends. Crosses often overshoot levels before resuming, especially around session opens.
Session selection
Trade pullbacks when the market can follow through.
- Best window: London and the London and New York overlap. Liquidity stays high. Trends extend. Pullbacks tend to resolve faster.
- Harder window: Asia. Many pairs range. Pullbacks often fail to continue because there is no push.
- Exception: JPY pairs can move in Asia. AUD and NZD pairs can also trend during early Asia, but you still need HTF alignment and ADX strength.
- Practical rule: If the last 3 to 6 hours sit inside a tight box and ADX stays under 20, treat it as range conditions. Do not force pullback entries.
News filter and stabilization rules
High-impact news breaks structure. It also fakes pullbacks.
- Avoid trading into red news: Do not open a new pullback trade within 30 minutes before high-impact releases for either currency in the pair.
- Post-news rule: Wait for the first spike to finish. Then wait for a second pullback after the post-news range tightens.
- Stabilization checklist: Price prints a clear swing, spreads normalize, and candles stop overlapping with long wicks on both sides.
- Level rule: If news pushes price through your HTF invalidation level and closes beyond it on H1, the trend definition changed. Do not “pullback trade” it.
These filters cut trades. That is the point. Use them to stay in trends that can pay, and out of markets built to chop you up.
Core pullback trading strategy forex: the step-by-step framework
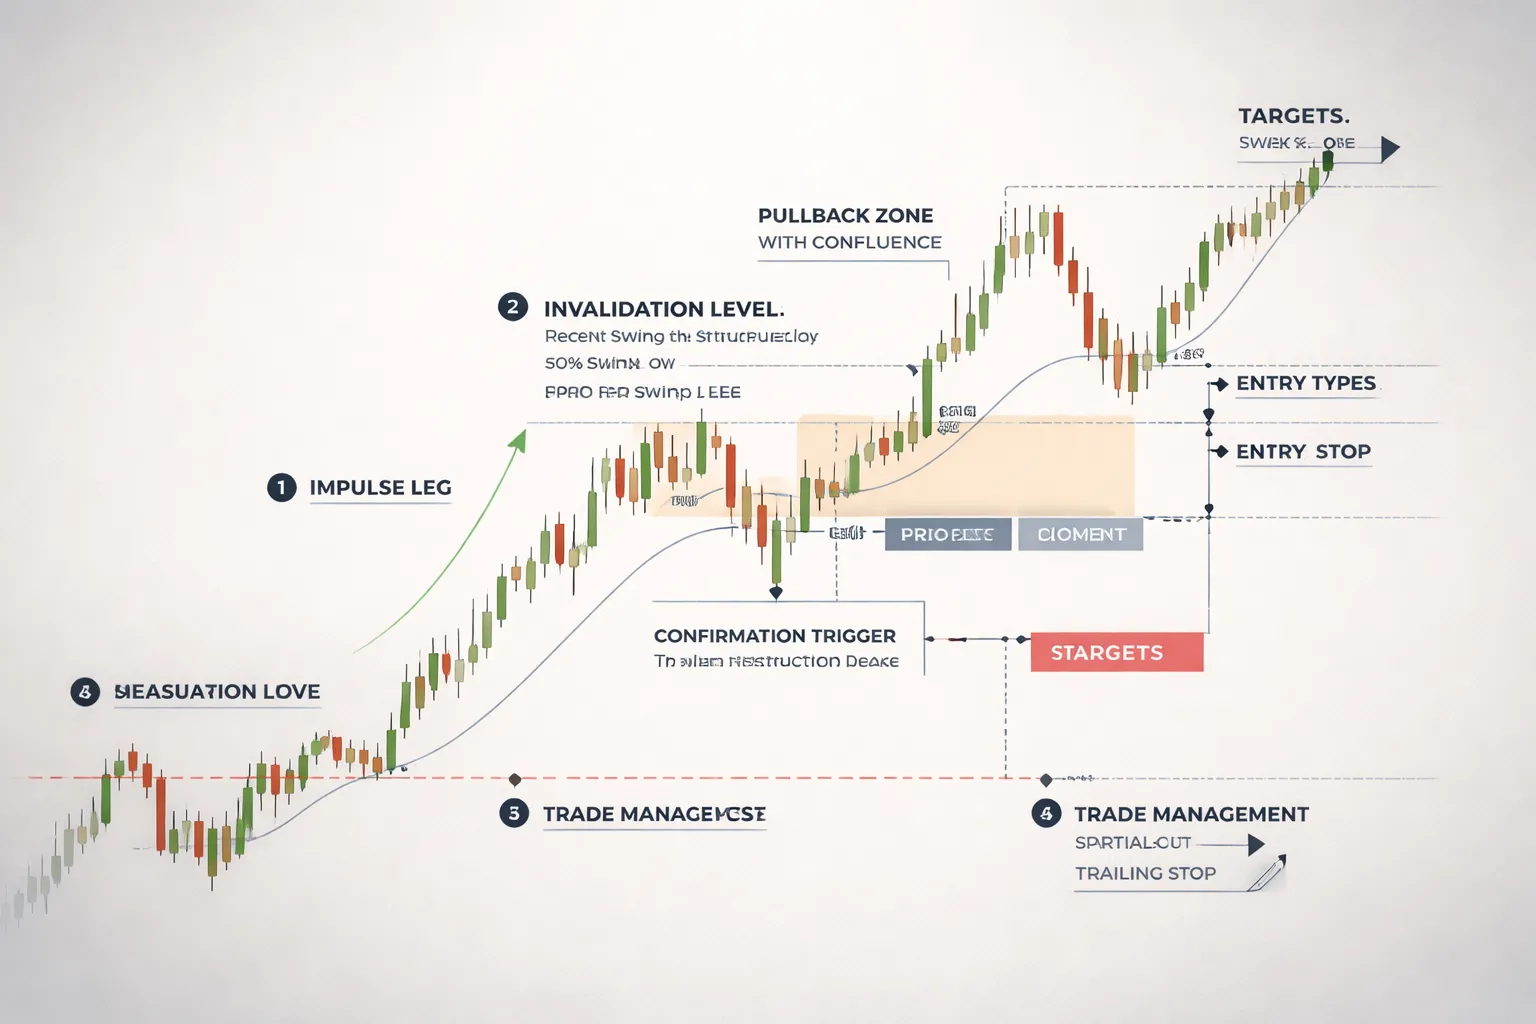
Step 1: Mark the impulse leg and the line in the sand invalidation
Start with the impulse leg. It is the move that proves the trend has control.
- Uptrend pullback setup: Mark the last clear swing low that started the impulse. Your invalidation sits below that low.
- Downtrend pullback setup: Mark the last clear swing high that started the impulse. Your invalidation sits above that high.
- Impulse filter: The impulse should break a prior swing level and close beyond it on your execution timeframe.
- Line in the sand rule: If price closes beyond the invalidation on H1, you stop treating the move as a pullback.
This gives you one job. Buy or sell pullbacks while that level holds.
Step 2: Identify pullback zones
You want price to pull back into an area where buyers or sellers already showed strength. Use zones, not single lines.
- Previous structure: Prior breakout level, prior swing high or low, or the last consolidation before the impulse.
- Moving average: A trending MA can act as a dynamic zone. Use one MA family and keep it consistent. See moving averages in forex for practical MA choices and rules.
- VWAP proxy: In spot FX you do not have centralized volume. Use anchored VWAP on a proxy, like futures or a CFD feed, or use session mean tools as a substitute. Treat it as context, not a trigger.
- Fibonacci confluence: Pull fib from impulse start to impulse end. Focus on 38.2 to 61.8, then look for overlap with structure or MA.
Rank zones. More confluence means you can accept a tighter trigger. Less confluence means you demand clearer confirmation.
Step 3: Wait for evidence of resumption
A pullback is not a signal. You need proof that the trend is back in control.
- Break of minor structure: During the pullback, mark the last minor swing against the trend. Enter only after price breaks that swing in the trend direction.
- Candle trigger: Use an H1 or M15 close that rejects the zone and closes back in trend direction. Avoid small bodies with long wicks on both sides.
- Momentum shift: You want contraction during pullback and expansion on the resumption leg. Watch candle size, range, and closing strength.
If price drifts sideways inside the zone with overlap, step back. Your edge fades in chop.
Step 4: Place orders, market vs limit vs stop entry
Match the order type to what the chart gives you.
- Market entry: Use it when you get a clean resumption close and spreads look normal. You pay the spread but you reduce missed trades.
- Limit entry: Use it when the zone is wide and you expect a second tap. Place limits inside the zone, not at the exact edge. Only use limits when your invalidation is clear and nearby.
- Stop entry: Use it when you want price to prove itself first. Place a buy stop above the minor lower high in an uptrend, or a sell stop below the minor higher low in a downtrend.
Do not mix intent. If you need confirmation, do not use a limit order.
Step 5: Set stop-loss logically
Your stop must reflect why the trade is wrong.
- Structure-based stop: Put the stop beyond the pullback swing point that should not break if the trend resumes. Give it room for spread and normal noise.
- ATR-based stop: Use ATR when structure is messy. Place the stop at a multiple of ATR beyond the invalidation point of your trigger swing.
- Avoid obvious stops: Do not park stops right on a round number, exact swing low, or exact fib. Place it beyond the level where you expect stop runs to reach.
If your stop needs to be huge to clear structure, skip the trade. You are late.
Step 6: Define targets, swing continuation, measured move, and R planning
Set targets before you enter. Targets anchor your decisions.
- Swing continuation target: First target sits near the prior impulse high in an uptrend, or prior impulse low in a downtrend. Scale out before the level if price often front runs.
- Measured move: Project the impulse length from the pullback low or high. Use it as a stretch target, not a promise.
- R-multiple planning: Plan at least one target at 1R to 2R where you can reduce risk, and one target where the trend pays, often 2R to 5R in clean conditions.
If the next major HTF level sits too close to your entry, your reward shrinks. Pass.
Step 7: Manage the trade, partials, trailing stops, and when to do nothing
Trade management should follow rules, not feelings.
- Partials: Take a partial at the first logical obstacle, like the prior swing high or low, or a major intraday level. This reduces variance.
- Move to breakeven: Do it only after price proves continuation, like a strong close beyond the minor structure break. Early breakeven kills good trades.
- Trailing stop: Trail behind higher lows in an uptrend, or lower highs in a downtrend. Use swing points, not a fixed pip trail.
- Do nothing: If price trends smoothly and does not break the swing structure, hold. Over-management is a cost.
Keep each decision tied to structure and volatility. If you cannot explain the change in one sentence, do not change anything.
High-probability pullback entry models (choose one to master)
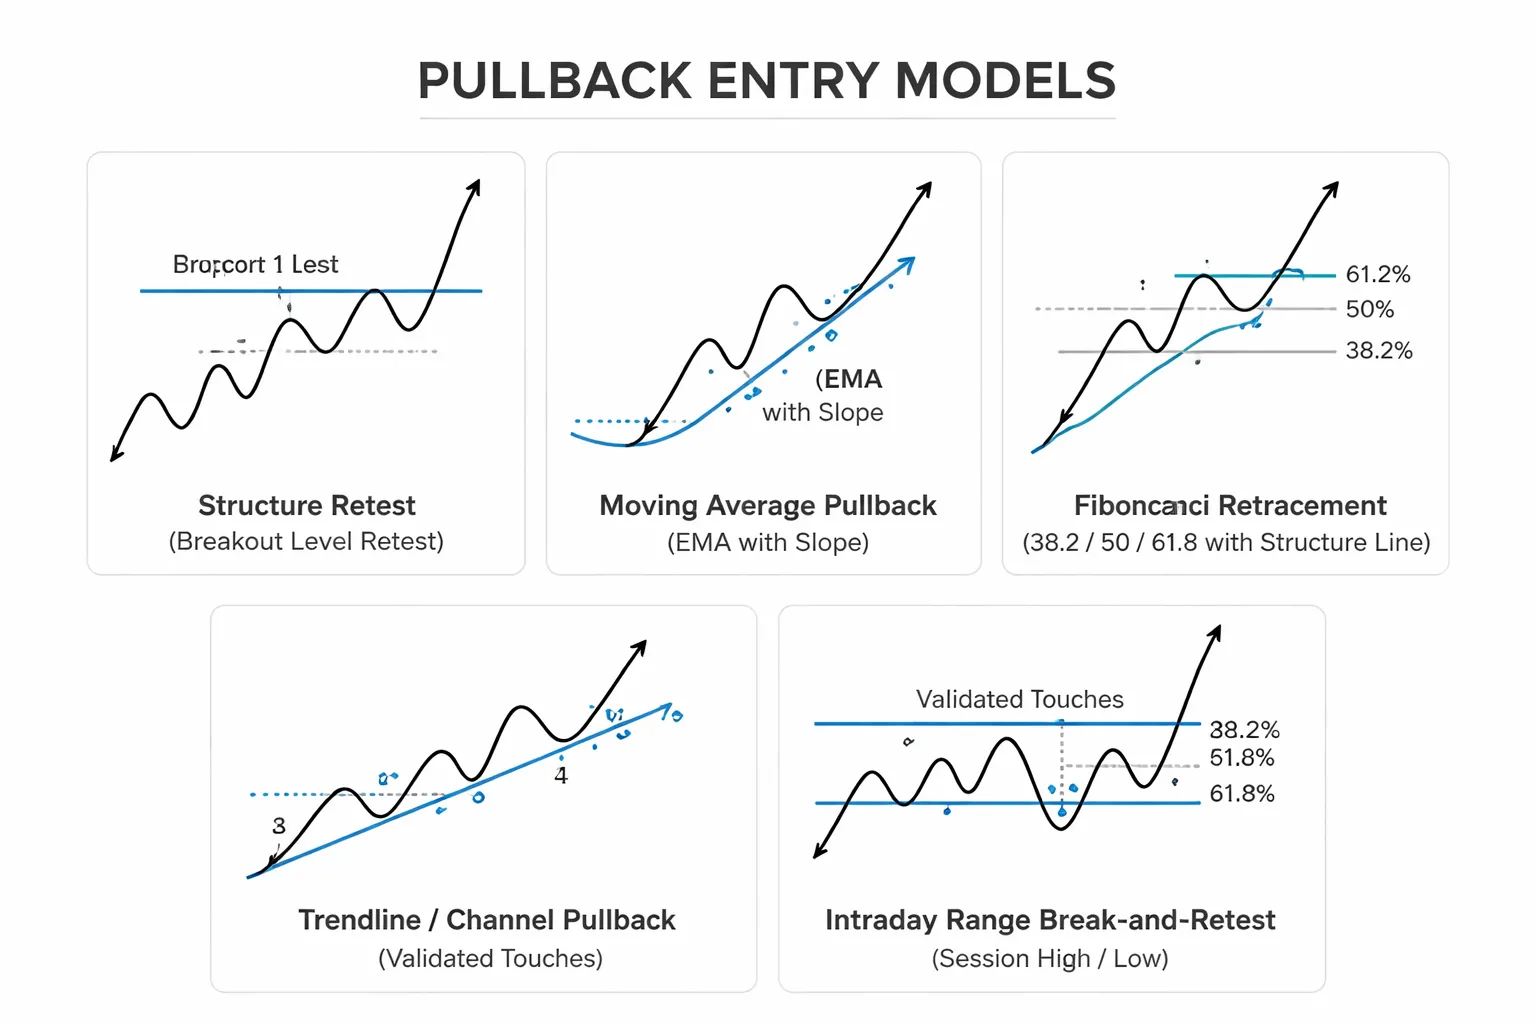
Structure retest entry, prior breakout level
This is the model to master first. It is simple, repeatable, and tied to clear structure.
- Step 1, confirm trend: You need higher highs and higher lows for longs, lower lows and lower highs for shorts. If structure is mixed, skip.
- Step 2, mark the breakout level: Use the most recent swing high that broke, for longs. Use the most recent swing low that broke, for shorts. Draw a horizontal line through the level, not through noise.
- Step 3, wait for the pullback: Price returns to the level. You want a slower retrace than the impulse leg. Fast, straight pullbacks often keep going.
- Step 4, demand a hold: Price should reject and stay on the correct side of the level. For longs, you want closes back above the level. For shorts, closes back below.
- Entry trigger: Enter on a break of the pullback swing in the trend direction, or on the first strong rejection close back through the level. Pick one trigger and keep it consistent.
- Stop placement: Put your stop beyond the pullback low for longs, beyond the pullback high for shorts. Give it room that matches current ATR or recent candle size.
- Invalidation: A clean close through the level, plus no snap back, means the retest failed. Exit or do not enter.
| Retest quality filter | What you want | What to avoid |
|---|---|---|
| Retest depth | Touches the level, shallow to moderate pullback | Deep retrace that breaks the prior swing structure |
| Retest speed | Controlled, overlapping candles | One-way drive into the level |
| Reaction | Quick rejection and close back on trend side | Chop through the level with multiple closes on both sides |
Moving average pullback entry, dynamic support and resistance
Use this only when the average acts like structure, not as a magic line.
- Pick one average: 20 EMA or 50 EMA. Do not stack three and call it confirmation.
- Slope rule: Trade only when the average slopes clearly in your direction. Flat averages mean range.
- Location rule: Price must respect the average on prior swings. If it cuts through often, it is not support or resistance.
- Entry trigger: After a pullback into the average, enter on a break of the pullback swing in trend direction.
- Stop placement: Beyond the pullback swing, not a fixed distance under the average.
- Failure sign: Multiple closes across the average, plus a broken swing, means the trend is weakening.
Fibonacci retracement entry, 38.2, 50, 61.8 with structure
Fib works best as a map for where structure might line up. It fails when you trade it alone.
- How to draw: Measure the impulse leg that broke structure. Swing low to swing high in an uptrend, swing high to swing low in a downtrend.
- Primary zones: 38.2 for strong trends, 50 for normal pullbacks, 61.8 for deeper pullbacks that still hold structure.
- Confluence rule: Only take fib levels that overlap a prior breakout level, prior swing, or session high or low.
- Entry trigger: Same as structure retest, rejection and then break of the pullback swing.
- Stop placement: Beyond the swing that defines your pullback. If you must hide it beyond 78.6 often, your setup quality is low.
Trendline or channel pullback entry, clean touches vs drift traps
Trendlines help when they describe the swings. They hurt when you keep moving them to fit price.
- Anchor rule: Use two clean swing points to draw, use the third touch as validation. Ignore wicks that do not match the swing logic.
- Channel rule: If you can draw a parallel line that contains most pullbacks, use the channel. It gives you targets and invalidation.
- Clean touch: Price tags the line and rejects with a clear response candle, then breaks the pullback swing.
- Drift trap: You redraw the line after every new candle. If you need to adjust often, the market is not respecting it.
- Stop placement: Beyond the pullback swing, not just beyond the line. Lines are estimates, swings are facts.
Break and retest of an intraday range, session highs and lows
This model works well on liquid pairs during active sessions. It uses obvious anchors that other traders watch.
- Define the range: Mark the Asian range, or the first 60 to 120 minutes of London or New York. Keep it simple and repeatable.
- Break condition: You need a close outside the range, not just a wick. The break should expand volatility.
- Retest: Price returns to the broken high for longs, broken low for shorts. You want it to hold on closes.
- Entry trigger: Enter on rejection at the range edge, or on a break of the retest swing in the trend direction.
- Stop placement: Beyond the retest swing, or beyond the opposite side of the range if the range is tight and volatility is expanding.
- Filter: Avoid taking the same break on highly correlated pairs at the same time. One move can hit all stops together. Use a simple check from this forex correlation pairs list.
One rule across all models: Your entry must sit on a level that matters, and your stop must sit beyond the swing that proves you wrong. If you cannot point to both on the chart, you do not have a pullback trade.
Trigger tools that confirm pullback completion (without indicator clutter)
Candlestick confirmation, keep it strict
You want evidence that the pullback failed to continue. You do not want a random candle pattern in the middle of noise. Use one candlestick trigger at your level, with clear structure around it.
- Pin bar (rejection). Use it only at your pullback level. The wick must stab through the level and close back on the trend side. The wick should be larger than the body. Skip small wicks and doji shapes.
- Engulfing candle. Use it only when it engulfs the prior candle body and closes strong in the trend direction. Better if it engulfs the last two candle bodies on the entry timeframe. Skip “engulfing” that only covers wicks.
- Inside bar break. Use it when price compresses after touching your level, then breaks in the trend direction. Place the trigger at the inside bar high or low. Skip inside bars that form far from the pullback level.
- What to ignore. Patterns that form mid range. Patterns that appear after a big impulse candle without a level. Any candle with a huge spread and a close in the middle. You get chop, not confirmation.
Momentum confirmation, use it as a filter
Momentum tools help you avoid entering when the pullback still has force. They do not time tops and bottoms well. Keep one momentum read, not three.
- RSI divergence limits. Divergence can persist for long stretches in strong trends. It also prints often in ranges. Do not trade divergence by itself.
- Better RSI use case. Use RSI as a regime check. In an uptrend, you want pullbacks that hold above the prior pullback’s RSI low, and recover quickly. In a downtrend, you want the mirror. This keeps you aligned with trend strength.
- ROC limits. Rate of Change reacts fast, but it whipsaws in low liquidity sessions and during news spikes. Treat it as a “too fast, too far” alert, not a signal.
- Better ROC use case. Use ROC to spot pullback exhaustion. You want ROC to fall during the pullback, then stop making new lows before price breaks back in the trend direction. Pair this with a price trigger at the level.
Volatility confirmation, watch range shift
Pullbacks often end when volatility contracts, then expands in the trend direction. You can measure this with ATR, or you can read it from candle ranges. Use one method.
- ATR contraction then expansion. During the pullback, ATR should stop rising and flatten. On completion, you want an expansion candle that closes in the trend direction. Skip trades when ATR keeps climbing through the pullback. That often signals a reversal or a stop run environment.
- Candle range shift. Compare the last 5 to 10 candles. During the pullback, ranges shrink and closes drift. On completion, you see a wider range candle with a close near the edge, aligned with trend direction. This is a clean “pressure change” read with no extra indicator.
Price action micro-structure on the entry timeframe
Micro-structure gives you the cleanest trigger. It also keeps your stop placement logical.
- In an uptrend. Wait for the pullback to print a higher low, then break the last minor lower high. Enter on the break, or on a retest if it is clean.
- In a downtrend. Wait for a lower high, then break the last minor higher low. Same logic, flipped.
- What matters. The swing points must be obvious on your entry timeframe. If you need to zoom in and “find” them, you do not have structure.
Confluence rules, enough to act without curve-fitting
You need confirmation, not a checklist. More signals can reduce trades and increase false confidence.
- Minimum stack. One level that matters, plus one trigger. Level can be prior swing, trendline touch, or a moving average you already use. Trigger can be micro-structure break, or one candlestick trigger. That is enough.
- Quality stack. Add one filter only if it removes clear bad trades. Good filters are volatility behavior, or momentum regime. If the filter does not change your decision often, remove it.
- Curve-fitting warning signs. You require three indicators to agree. You change settings per pair. You skip trades that meet your base rules because one minor tool disagrees. This is how you optimize for the past and miss the next move.
- Practical cap. Use 2 to 3 total inputs, including the level. Example, level plus micro-structure break, plus ATR expansion. Anything beyond this usually becomes overtrading control by complexity. If that is your issue, fix the behavior instead, see how to avoid overtrading.
Risk management built for pullback trading (position sizing and expectancy)
Define risk per trade, then keep it fixed
Set a fixed risk per trade as a percent of your account. Use 0.25 to 1.00 percent. Stay in that range until your data proves you can handle more.
Pullbacks tempt oversized positions. The stop often looks “tight” because the entry sits near a level. You add size to “make it worth it.” One slip and a normal pullback becomes a large account hit.
Fix the rule. You control risk with position size, not with hope.
- Account risk per trade: 0.25% to 1.00%.
- Daily loss cap: 2R to 3R, then stop trading.
- Weekly loss cap: 5R to 8R, then reduce size or pause.
Stop placement logic by setup type
Your stop must match why the trade works. Pullback trades fail in two ways. Structure breaks. Volatility expands. Use one stop logic. Do not mix both after entry.
Structure stop. Use this when your edge comes from market structure and a clean level. Put the stop beyond the swing point that should hold if the trend stays intact.
- Long: below the pullback swing low, plus a small buffer for spread.
- Short: above the pullback swing high, plus a small buffer for spread.
- Best fit: trend pullback into prior support or resistance, break and retest, higher low or lower high entries.
Volatility stop. Use this when your edge comes from volatility regimes and you expect noise. Size down and use ATR-based distance so normal swings do not stop you out.
- Common rule: 1.0 to 1.5 ATR of your entry timeframe.
- Best fit: news-driven sessions, pairs with wide ranges, entries taken after ATR expansion.
Do not place stops at obvious round numbers or exact prior lows. Liquidity sits there. Give the level room, then size correctly.
Risk-to-reward expectations in Forex trends
Expectations need to match how trends actually move. Forex trends push, pause, then push again. Many pullback entries will not run straight to 3R.
- Realistic baseline: target 1R to 2R on most pullback trades.
- Best-case runs: 3R to 5R happens, but you will not get it often without holding through pullbacks.
- Low quality sign: you require 3R+ to make the system “work.” That usually means your win rate will drop.
Plan exits like a trend trader. Take partials at 1R to 2R if you need to smooth equity. Trail the rest behind structure if the trend keeps printing higher lows or lower highs.
R-multiples and expectancy, a simple model
Measure results in R. 1R equals your initial risk. This makes trades comparable across pairs and stop sizes.
- Win +2R means you made two times what you risked.
- Loss -1R means you lost your predefined risk.
Use expectancy to judge if the strategy works.
Expectancy per trade = (Win rate x Average win in R) minus (Loss rate x Average loss in R).
| Input | Value |
|---|---|
| Win rate | 45% |
| Average win | +1.8R |
| Loss rate | 55% |
| Average loss | -1.0R |
| Expectancy | (0.45 x 1.8) - (0.55 x 1.0) = +0.26R |
At +0.26R, 100 trades yields about +26R before costs, if your execution stays consistent. If your expectancy sits near zero, reduce inputs and retest. Then check slippage and spread. If you do not track R and expectancy, your conclusions will drift. Use a simple process to backtest your Forex strategy and validate it with enough trades.
Position sizing, the math you must do every time
Calculate size from your stop distance. Do not guess. Use this order.
- Choose risk: account x risk percent.
- Define stop: structure point or ATR rule.
- Convert stop distance to money per pip for the pair.
- Set lot size so the stop hit equals your chosen risk.
Wide stop means smaller size. Tight stop means larger size, but risk stays the same. If you cannot take the correct size due to broker limits, skip the trade.
Correlation and portfolio risk, avoid stacked USD exposure
Pullback traders often see the same trend on many pairs. You take them all. You think you diversified. You stacked the same risk.
Control it with exposure rules.
- Limit currency concentration: cap total open risk tied to one currency at 1R to 2R.
- Avoid duplicates: EURUSD and GBPUSD often move together. Treat them as one idea when USD drives the move.
- Adjust for correlation: if two pairs correlate strongly, cut risk on each, or take only the cleaner setup.
- Watch USD and JPY clusters: risk can stack fast across majors and crosses.
If you risk 1R on three USD-heavy trades at the same time, you did not risk 1R. You risked a USD event.
Trade management: entries are easy—exits decide performance
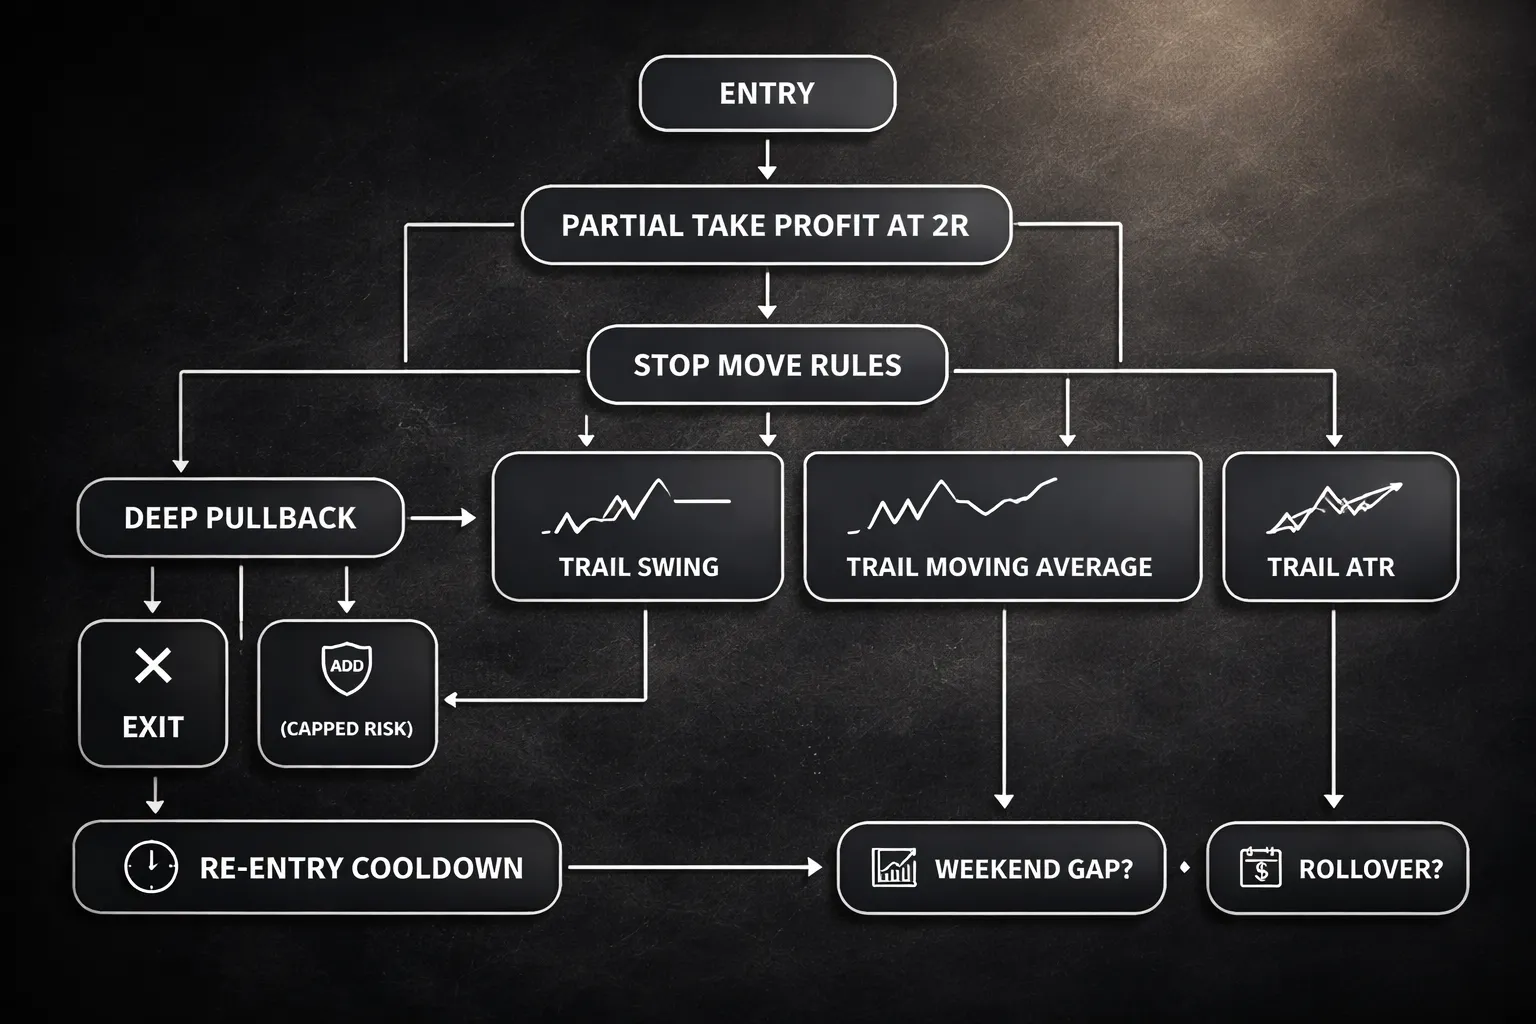
Trade management: entries are easy, exits decide performance
Pullback entries feel clean. Your exit plan decides your expectancy. You need rules for partials, trails, heat, re-entries, and holding risk over the weekend.
Scaling out vs holding: pros, cons, and a rules-based compromise
Scaling out lowers variance. It also cuts your average win when the trend runs. Holding full size captures big moves. It also increases drawdowns and gives back open profit.
- Scale out works best when the pair ranges often, spreads are higher, or you trade lower timeframes.
- Hold full size works best when you trade higher timeframes, trends extend, and you can sit through pullbacks.
Use a compromise you can repeat.
- Set 2R as the first decision point.
- At +1R, move stop to break-even only if structure supports it. If not, keep the original stop.
- At +2R, take 30 to 50 percent off.
- Move stop on the remainder to +0.5R to +1R, or to the last swing level, whichever is tighter without sitting inside noise.
- Let the rest trail until your stop triggers.
This keeps your win rate stable while still giving you exposure to long trend legs. If you do not track R-multiples, fix that first. Learn the basics of risk-reward ratio and use it in every trade.
Trailing stop methods: swing-based, MA-based, and ATR-based trails
Pick one trailing method per strategy. Do not mix methods mid-trade. Mixed logic creates random exits.
- Swing-based trail. Trail below the last higher low in an uptrend, or above the last lower high in a downtrend. Update only after a swing prints. This fits pullback trading because it follows structure.
- MA-based trail. Use a moving average that matches your holding period, like a 20 EMA for faster trends or a 50 EMA for slower ones. Exit on a close beyond the MA, or trail your stop a fixed distance beyond it. This keeps you in trends but can whipsaw in chop.
- ATR-based trail. Use a multiple of ATR from the most favorable price. Common settings cluster around 2 to 3 ATR on swing trades, and 1.5 to 2 ATR on faster trades. ATR adapts to volatility, but it can loosen during spikes and give back profit.
| Trail type | Best for | Main risk | Simple rule |
|---|---|---|---|
| Swing-based | Clean trends, pullback entries | Late exit after a sharp reversal | Stop goes beyond last swing, update only on new swing |
| MA-based | Smooth trends | Whipsaw in ranges | Exit on close across MA, or trail behind MA |
| ATR-based | Volatile pairs, news-heavy sessions | Gives back more during volatility expansion | Stop equals peak minus X ATR, update on new peak |
Handling deep pullbacks after entry: add, hedge, or exit rules
Deep pullbacks happen. Your job is to define what is still a pullback and what is a failed trade.
- Define failure first. If price closes beyond the swing that defines the trend, you exit. Do not negotiate.
- Add only when risk stays capped. Add only if you can move the combined stop so the total position risk stays at or below your original 1R. If you cannot, you do not add.
- Add only on a new setup. You need a fresh pullback trigger, not a falling knife. That means a new structure break in your direction, then a pullback, then your entry trigger.
- Hedging rules. Most retail hedges turn one decision into two. If your broker allows it, hedge only as a planned event hedge, and only with a defined exit time. If you do not have that plan, you exit instead.
One clean rule beats a complex rescue plan. When the pullback breaks structure, you are wrong. Take the loss and keep your risk budget.
When to re-enter after being stopped out: cooldown criteria
Stop-outs happen in trends. Re-entry makes sense only when the trend reasserts.
- Cooldown by time. Wait for one full candle close on your entry timeframe after the stop-out. This blocks instant revenge entries.
- Cooldown by structure. Require a new break of the prior swing in the trend direction. If you do not see it, you do not re-enter.
- Cooldown by location. Re-enter only from a fresh pullback zone, not in the middle of the range that stopped you out.
- Limit attempts. Max two attempts per trend leg. After two stop-outs, stand down until a new higher timeframe setup forms.
Track your re-entry stats. Many traders discover that one re-entry improves expectancy, but repeated attempts destroy it.
Weekend gaps and rollover considerations for swing pullbacks
Swing pullbacks often hold through rollover. You need a rule for costs and gap risk.
- Rollover. Check swap before you hold. If negative swap is large relative to your target, reduce size or tighten your time horizon. Do not let carry bleed your edge.
- Friday exposure. If your stop sits close to price late Friday, reduce risk. Gaps can skip stops. Treat this as a different risk regime.
- Weekend plan. Hold only if you already locked profit, your stop sits beyond a structural level, and the trade still aligns with the higher timeframe trend.
- Event filter. If major risk events hit over the weekend, like elections or emergency meetings, cut size or flatten. The gap can exceed your planned 1R.
Gaps and swap do not care about your chart pattern. You manage them with rules, not hope.
Common mistakes that make pullback traders ‘chase’ anyway
Entering before confirmation and confusing a bounce with a resumption
You chase when you treat the first green candle as proof.
A pullback trade needs a pullback, then a resumption trigger. If you enter inside the pullback, you trade hope. Price can keep correcting and you will keep moving your entry “closer” until you buy the high of a dead bounce.
- Fix: Define confirmation in your rules. Example, break and close back above a pullback lower high in an uptrend, or a bullish engulf that closes above a key level.
- Fix: Use structure, not feelings. If price still prints lower highs and lower lows on your entry timeframe, you do not have resumption.
- Fix: Do not “improve” your price by scaling in before the trigger. You just front-run your own plan.
Using the same stop for every pair and timeframe
One stop size across all markets turns pullbacks into chase trades.
If your stop sits inside normal noise, you get clipped. Then you re-enter higher. That is chasing with extra steps. If your stop sits too wide, you cut size wrong or you skip good trades and then jump in late.
- Fix: Place your stop beyond a structural level that would invalidate the setup. Example, below the pullback low in an uptrend.
- Fix: Adjust for volatility and timeframe. A 15 pip stop on GBPJPY and EURGBP is not the same risk.
- Fix: Keep risk per trade constant. Let position size change, not your discipline. If you need help with mechanics, use this guide on how to set stop loss and take profit.
Taking pullbacks in weak or choppy trends (false trend problem)
Most pullback “failures” come from trading trends that do not exist.
A weak trend gives you shallow pushes, overlapping candles, and frequent level breaks. Pullbacks do not resume cleanly. You enter, price grinds, you exit, then you re-enter later at worse prices.
- Fix: Filter trend quality. You want clear swing structure and impulse legs that move away from the mean.
- Fix: Avoid heavy overlap and constant whipsaws around the same level. That is range behavior.
- Fix: Align with the higher timeframe direction. If the higher timeframe sits in a range, pullbacks on the lower timeframe will trap you.
Over-optimizing indicators and ignoring market regime changes
You chase when your “perfect” indicator settings stop working and you keep forcing trades.
Indicators often fit one volatility regime. Then volatility shifts. Your pullback signals arrive late, or they trigger too often. You respond by taking marginal entries because the indicator says so.
- Fix: Keep indicators secondary. Use them to confirm, not to decide.
- Fix: Track regime basics. Trend strength, volatility level, session behavior, and event risk.
- Fix: Re-test rules after major shifts, like rate cycles or sustained volatility compression or expansion. Use walk-forward thinking, not one static “best” setting.
Revenge trading after missing the first entry and forcing the second-best setup
Missing a clean entry creates the worst entries.
You feel late. You take the next pullback even if it breaks your rules. You tighten the stop to “make it work.” You size up to “make it back.” That is how pullback traders chase trends at the top.
- Fix: Build a missed-trade rule. If price moved more than your allowed distance from the trigger, you stand down.
- Fix: Limit retries. One attempt per setup, or two max if your plan allows re-entry after a valid trigger.
- Fix: Log missed trades as neutral. You pay nothing for no position. You only pay when you force one.
Practical examples and templates you can replicate
Error: Invalid type for 'messages[1].content': expected one of a string or array of objects, but got a boolean instead.Testing and improving your pullback strategy (E-E-A-T: evidence over opinions)
Backtesting vs forward testing, what each can and cannot prove
Backtesting tells you if your rules had an edge on past data. It does not prove your strategy will work next month. It can hide problems like spread changes, execution delays, and news spikes.
Forward testing tells you if you can execute the rules in real time. It includes your platform, your broker conditions, and your decision speed. It still does not prove long-term profitability because the sample stays small at first.
- Use backtests to validate the logic and remove obvious flaws.
- Use forward tests to validate execution and confirm the edge survives current market conditions.
- Use both, with the same rules, position sizing, and risk per trade.
How to define pullbacks objectively for testing (rules and tagging)
If you cannot code it, you cannot test it. Define the pullback with hard rules. Tag trades the same way every time.
- Trend filter. Example, price above a 200 EMA and 200 EMA slopes up by X pips over Y bars.
- Impulse leg. Example, last swing high breaks prior swing high by at least 0.5 ATR(14).
- Pullback depth. Example, retrace 38% to 61.8% of the impulse leg, or pull back 0.8 to 1.5 ATR.
- Pullback structure. Example, at least 3 candles against the trend, and no close below the last swing low (for longs).
- Entry trigger. Example, break of the pullback minor high, or close back above a chosen moving average. Use the same trigger across the dataset.
- Invalidation and stop. Example, stop goes 1 ATR below the pullback swing low, fixed at entry.
- Exit. Example, partial at 1R and final at 2R, or trail behind prior swing lows. Pick one and keep it constant during a test phase.
Keep a tagging sheet for every setup you take or skip. Log trend state, pullback depth, trigger type, session, spread, and whether news was within your exclusion window. If you use moving averages, keep the exact settings stable during a test cycle.
Sample size, market conditions, and avoiding data-mined results
Small samples lie. You need enough trades to see variance.
- Start with at least 100 trades per major pair and timeframe combo, or 300 trades across a basket if the rules stay identical.
- Split data into in-sample to build, and out-of-sample to confirm. Do not tweak rules on the out-of-sample set.
- Test across conditions, strong trends, weak trends, high volatility, low volatility, London session, New York session, and post-news periods if you trade them.
- Use realistic costs, average spread, commissions, and slippage assumptions. If you scalp, increase the slippage inputs.
Avoid data mining. Do not optimize ten parameters at once. Do not keep changing settings until the equity curve looks smooth. If you tune rules, you fit noise. You then lose the edge when conditions shift.
Performance metrics that matter
Track more than win rate. Win rate alone does not measure edge.
Log results by segment. Compare performance by pair, session, pullback depth bucket, and volatility regime. Remove segments only if you can explain the reason and it holds in out-of-sample data.
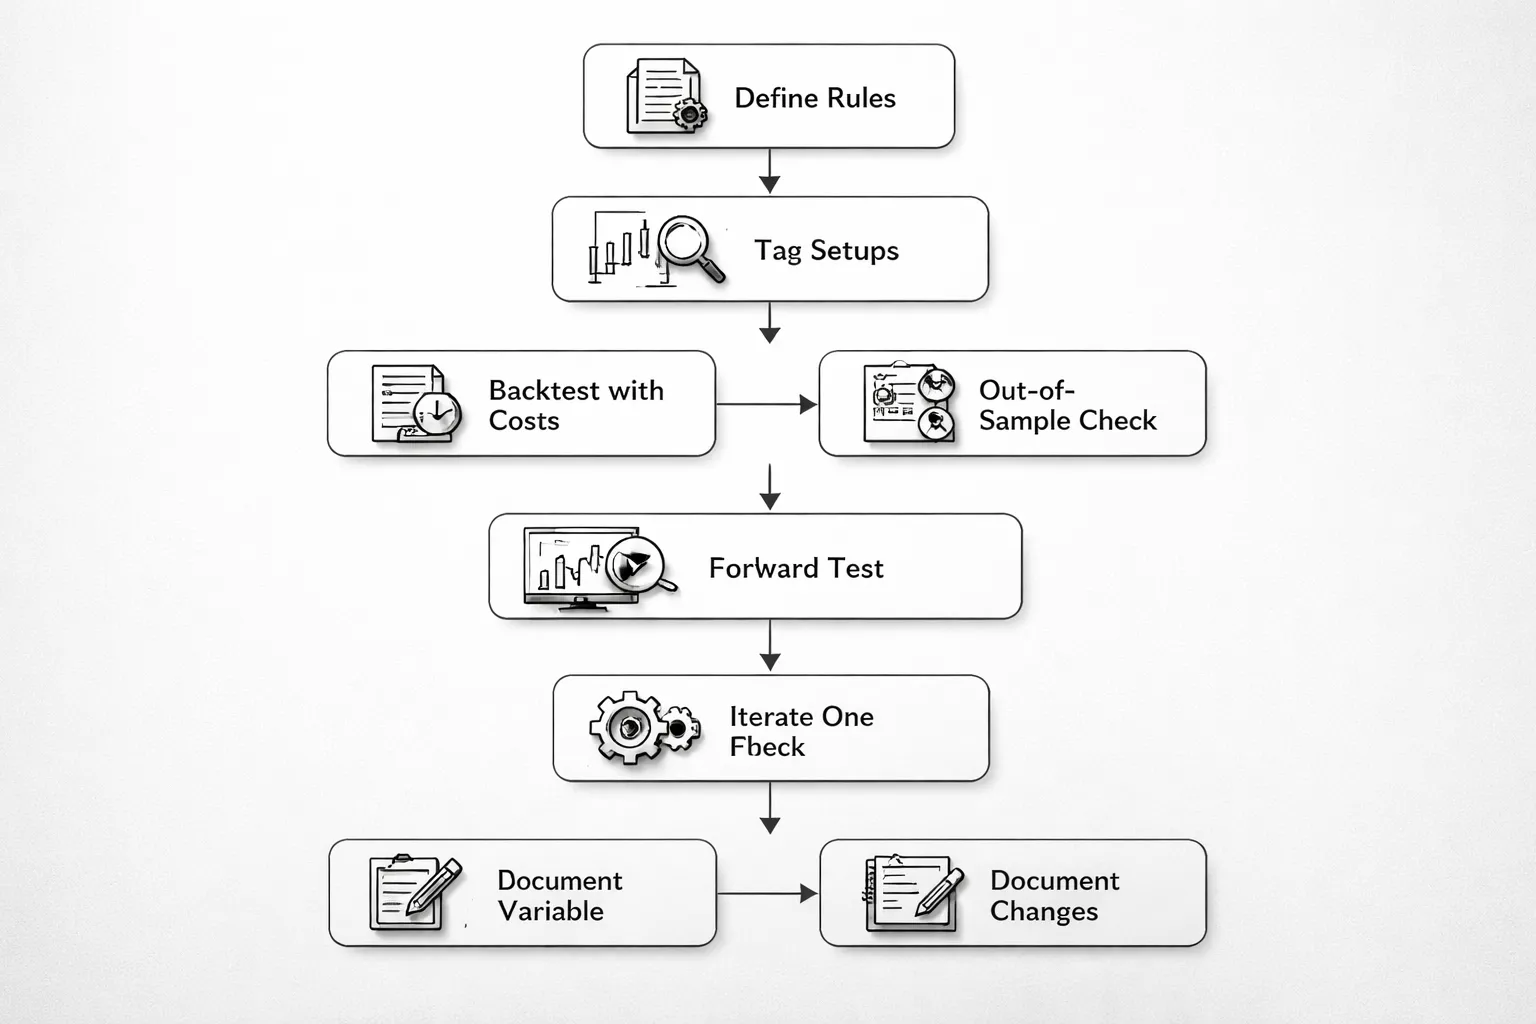
Iteration plan, change one variable and document it
Use a tight loop. One change. One test. One decision.
- Step 1, freeze the baseline. Write the rules in one page. No exceptions.
- Step 2, run a backtest. Record all metrics, plus screenshots of a small sample of wins and losses.
- Step 3, pick one lever. Example, pullback depth, entry trigger, stop placement, or exit method. Change one item only.
- Step 4, re-test on the same dataset. Compare expectancy, drawdown, and time in trade. Do not judge by win rate alone.
- Step 5, confirm out-of-sample. If the improvement disappears, revert.
- Step 6, forward test for execution. Trade small, track slippage, missed entries, and rule breaks.
- Step 7, document. Keep a change log with date, rule change, dataset, metrics before and after, and final decision.
If you want to refine risk control while you test, keep your risk per trade constant and follow clear stop placement rules. For a practical framework, see stop loss vs take profit.
Frequently Asked Questions
What counts as a pullback in forex?
A pullback is a counter-move inside a valid trend. Price stays above the last major swing low in an uptrend, or below the last major swing high in a downtrend. It is a retracement, not a structural break.
How do you confirm the trend before you trade a pullback?
Use market structure. In an uptrend, you need higher highs and higher lows. In a downtrend, lower lows and lower highs. Trade only pullbacks that form after a clear impulse leg and a clean swing point.
How do you avoid confusing a pullback with a reversal?
Watch structure first. A reversal breaks the prior swing and holds beyond it. A pullback respects the swing and stalls at a key level. If price closes through the swing and keeps trending against you, treat it as a reversal.
What is the safest entry trigger for pullback trades?
Enter after the pullback ends, not during the fall. Use a break of the pullback trendline, a close back above a key level, or a break of the pullback swing high in an uptrend. You want proof of resumed momentum.
Where should you place the stop loss on a pullback trade?
Place it beyond the pullback invalidation point. In an uptrend, below the pullback swing low. In a downtrend, above the pullback swing high. Do not use a random pip stop. Your stop must match structure.
What risk per trade works best for pullback strategies?
Keep it small and fixed. Many traders use 0.25 to 1 percent per trade. Your edge comes from repetition, not one trade. If your drawdowns spike, reduce risk before you change rules or add filters.
What timeframes work best for pullback trading in forex?
Higher timeframes give cleaner structure. Many traders identify trend on H4 or D1 and execute on H1 or M15. Pick one combo and stick to it. Your results improve when your rules match your trading window.
How many pullback trades should you test before trusting results?
Test at least 50 to 100 trades per setup. Track win rate, average R, max drawdown, and rule adherence. If execution errors drive losses, fix process before you adjust entry logic.
Should you use RSI for pullback timing?
Use it as a filter, not a trigger. In an uptrend, RSI dipping and then turning up can support a long bias. Confirm with price structure. For a rules-based approach, see the RSI indicator strategy.
What is a common mistake that kills pullback performance?
Buying before the pullback stabilizes. You take heat, widen stops, and break rules. Another mistake is trading every dip. Filter for clean trends, clear pullback legs, and a defined invalidation point.
What should you record in your pullback trading journal?
Log trend definition, entry trigger, stop location, position size, R result, and screenshots. Track slippage and missed entries. Tag rule breaks. Keep a change log for any edits, then compare metrics before and after.
Conclusion
Conclusion
Pullback trading lets you join a trend at a better price. You do it with structure, not speed. Define the trend, wait for a clean pullback, then use one clear trigger.
Keep your edge by controlling what you can control. Use one setup. Use one stop rule. Risk a fixed amount per trade. Track every trade in your journal and remove any rule that you cannot follow in real time.
Final tip. Before you place any order, write your invalidation point first. If you cannot place a stop there, skip the trade. If you can, size the position and execute.
For tighter control over losses, review your risk management rules and keep them constant while you test.
-
Stop Loss vs Take Profit: Differences, Examples & Best Practices
7 months ago -
Forex Trading Psychology Tips: How to Stay Disciplined and Consistent
7 months ago -
How to Set Stop Loss and Take Profit (Step-by-Step)
7 months ago -
Forex Order Types Explained: Market vs Limit vs Stop Orders
7 months ago -
Understanding Forex Candlestick Charts (Beginner Guide)
7 months ago
-
- Step 1: Mark the impulse leg and the line in the sand invalidation
- Step 2: Identify pullback zones
- Step 3: Wait for evidence of resumption
- Step 4: Place orders, market vs limit vs stop entry
- Step 5: Set stop-loss logically
- Step 6: Define targets, swing continuation, measured move, and R planning
- Step 7: Manage the trade, partials, trailing stops, and when to do nothing
-
- Trade management: entries are easy, exits decide performance
- Scaling out vs holding: pros, cons, and a rules-based compromise
- Trailing stop methods: swing-based, MA-based, and ATR-based trails
- Handling deep pullbacks after entry: add, hedge, or exit rules
- When to re-enter after being stopped out: cooldown criteria
- Weekend gaps and rollover considerations for swing pullbacks
-
- Entering before confirmation and confusing a bounce with a resumption
- Using the same stop for every pair and timeframe
- Taking pullbacks in weak or choppy trends (false trend problem)
- Over-optimizing indicators and ignoring market regime changes
- Revenge trading after missing the first entry and forcing the second-best setup
-
-
- What counts as a pullback in forex?
- How do you confirm the trend before you trade a pullback?
- How do you avoid confusing a pullback with a reversal?
- What is the safest entry trigger for pullback trades?
- Where should you place the stop loss on a pullback trade?
- What risk per trade works best for pullback strategies?
- What timeframes work best for pullback trading in forex?
- How many pullback trades should you test before trusting results?
- Should you use RSI for pullback timing?
- What is a common mistake that kills pullback performance?
- What should you record in your pullback trading journal?
-
- Step 1: Mark the impulse leg and the line in the sand invalidation
- Step 2: Identify pullback zones
- Step 3: Wait for evidence of resumption
- Step 4: Place orders, market vs limit vs stop entry
- Step 5: Set stop-loss logically
- Step 6: Define targets, swing continuation, measured move, and R planning
- Step 7: Manage the trade, partials, trailing stops, and when to do nothing
-
- Trade management: entries are easy, exits decide performance
- Scaling out vs holding: pros, cons, and a rules-based compromise
- Trailing stop methods: swing-based, MA-based, and ATR-based trails
- Handling deep pullbacks after entry: add, hedge, or exit rules
- When to re-enter after being stopped out: cooldown criteria
- Weekend gaps and rollover considerations for swing pullbacks
-
- Entering before confirmation and confusing a bounce with a resumption
- Using the same stop for every pair and timeframe
- Taking pullbacks in weak or choppy trends (false trend problem)
- Over-optimizing indicators and ignoring market regime changes
- Revenge trading after missing the first entry and forcing the second-best setup
-
-
- What counts as a pullback in forex?
- How do you confirm the trend before you trade a pullback?
- How do you avoid confusing a pullback with a reversal?
- What is the safest entry trigger for pullback trades?
- Where should you place the stop loss on a pullback trade?
- What risk per trade works best for pullback strategies?
- What timeframes work best for pullback trading in forex?
- How many pullback trades should you test before trusting results?
- Should you use RSI for pullback timing?
- What is a common mistake that kills pullback performance?
- What should you record in your pullback trading journal?
-
How to Place a Forex Trade Step by Step (Your First Trade Explained)
5 months ago -
Forex Trading vs Crypto Trading: Which Market Is Better for Beginners?
5 months ago -
Forex Lot Size Calculator: How to Use It to Size Trades Correctly
7 months ago -
How to Calculate Position Size in Forex (Position Sizing Formula + Examples)
7 months ago -
Forex Leverage Explained: How It Works, Pros, Cons & Examples
7 months ago
-
Forex Trading Platforms Comparison: MetaTrader vs cTrader vs TradingView
7 months ago -
Stop Loss vs Take Profit: Differences, Examples & Best Practices
7 months ago -
Is Forex Trading Legal in the United States? Rules, Regulators & What to Know
7 months ago -
Forex Leverage Explained: How It Works, Pros, Cons & Examples
7 months ago -
Forex Market Hours & Trading Sessions Explained (Best Times to Trade)
7 months ago