Multi-Timeframe Analysis in Forex: How to Align Trend, Entry and Exit

You can find a great setup on one chart and still enter at the worst time. Multi-timeframe analysis fixes that. You use a higher timeframe to define trend, a mid timeframe to plan the trade, and a lower timeframe to time the entry and manage the exit.
This guide shows you how to align three timeframes so your direction, trigger, and risk control match. You will learn how to choose your timeframes, mark the dominant trend, spot key levels, and avoid entries that fight the bigger move. You will also learn a simple workflow for setting entry, stop, and target without guessing.
Multi-timeframe analysis does not replace risk management. It supports it. Pair it with a clear risk-reward ratio so every trade has defined upside and downside.
- In het kort: Start top down. Higher timeframe sets your bias, lower timeframe gives your trigger.
- Use three charts. Trend timeframe, setup timeframe, entry timeframe.
- Keep a fixed ratio between timeframes, often 1:4 to 1:6.
- Trade with the dominant trend. Skip signals that point against the higher timeframe.
- Mark key levels on the higher timeframe first. Support, resistance, and major swing highs and lows.
- Use the middle timeframe to define your setup zone and invalidate level.
- Use the lowest timeframe to time the entry. Wait for a clear break and retest, or a clean rejection at your level.
- Place your stop where your idea fails, beyond structure. Do not place it based on a fixed pip number.
- Set targets from higher timeframe levels. Aim for clean space to the next level.
- Require a clear risk-reward ratio before you enter. If you cannot get it, skip the trade.
- Keep your process repeatable. Same timeframes, same rules, same checklist.
- Track outcomes by timeframe alignment. Log if trend, setup, and entry agreed or conflicted.
- If you use indicators, use them as confirmation, not as the decision. See MACD as one option.
What Multi Time Frame Analysis Means in Forex (and Why It Works)
Definition: linking market structure, trend, and timing across charts
Multi-timeframe analysis means you read the same market on more than one chart.
You use each chart for a specific job.
- Higher timeframe: defines the main trend and key structure levels.
- Middle timeframe: shows the current swing, pullback, or consolidation inside that trend.
- Lower timeframe: gives precise entry and exit timing.
This works because Forex price moves in waves. Each wave contains smaller waves. When the waves align, your trade has fewer conflicts.
Your goal stays simple. Trade in the direction of the higher timeframe. Enter on the lower timeframe when the middle timeframe setup triggers.
Signal vs noise: why lower timeframes lie without context
Lower timeframes print more candles. That means more swings, more fake moves, and more stop runs.
On a 5 minute chart, a 20 pip spike can look like a trend change. On a 4 hour chart, it can register as a wick.
Most losing trades start here. You treat lower timeframe movement as signal. It is often noise unless it happens at a level that matters on the higher timeframe.
Multi-timeframe analysis fixes that. It filters entries. You stop reacting to every micro break. You trade the moves that sit inside a bigger structure.
Where it helps most: trend continuation, pullback entries, and breakout confirmation
- Trend continuation: You stay with the higher timeframe direction. You avoid countertrend trades that look clean on the entry chart but fight the main flow.
- Pullback entries: You mark the trend and structure on the higher timeframe, then wait for the middle timeframe pullback to complete. You enter on the lower timeframe when price resumes, with a tighter stop and a clearer invalidation point.
- Breakout confirmation: You do not buy every breakout candle. You check if the breakout clears a real level on the higher timeframe, then you use the lower timeframe to confirm acceptance, retest, or momentum continuation before you commit.
Trendlines help you keep structure clean and consistent. Use the same drawing rules across timeframes. See how to draw trendlines if your lines keep shifting.
Common misconceptions: more indicators ≠ better analysis
Multi-timeframe analysis does not mean you stack indicators across charts.
It means you align price structure and direction first, then you time the trade.
- More indicators can create more conflicts.
- More charts can create more hesitation.
- More signals do not create better odds if they measure the same thing.
Keep your tools limited. If you use an indicator, use it as confirmation after price and level agree. Your edge comes from alignment, not from adding layers.
Choosing the Right Timeframe Stack (2, 3, or 4 Charts)
The timeframe ratio rule
Pick timeframes that separate cleanly. Use a 4x to 6x step between charts.
- Why it works: Each chart shows a different decision layer. Less overlap means fewer mixed signals.
- Too close: 15m, 30m, 1h. These often repeat the same swings and noise.
- Too far: 1h, 1D, 1M. You will wait longer for alignment and get fewer trades.
Simple math: if you enter on 1h, your trend chart should sit around 4h to 6h. Your execution chart should sit around 10m to 15m.
Popular stacks by trading style
| Style | Trend and context | Setup and entry | Execution and management |
|---|---|---|---|
| Scalping | 1h or 4h | 15m | 1m to 5m |
| Day trading | 4h | 1h | 5m to 15m |
| Swing trading | 1D | 4h | 1h |
| Position trading | 1W | 1D | 4h |
Keep the stack stable. Changing timeframes to force alignment breaks the process.
Two timeframes vs the classic three-timeframe model
Use two charts when your strategy already defines one layer.
- Use 2 timeframes when you trade clear breakouts or pullbacks and you manage risk tight. Example: 4h for direction, 15m for entry.
- Use 3 timeframes when you need a clean separation between trend, setup, and trigger. This is the default for most discretionary traders.
Add a fourth chart only if it has a job you cannot get from the other three. Do not add it to feel safer.
When a 4-chart stack makes sense
A 4-chart stack works when you trade long holds and you need tighter timing without losing the higher trend.
- Example stack: 1W for macro trend, 1D for levels, 4h for setup, 1h for entry.
- Use it if: the pair trends hard, you scale in, or you manage partial exits across days.
- Avoid it if: you trade intraday. You will spend time “checking one more chart” instead of executing.
Avoiding analysis paralysis
Limit charts, tools, and decision points.
- Limit charts: 2 or 3 is enough for most traders. Add a fourth only with a written rule.
- Limit tools: levels and structure first. Add one indicator at most, and use it only as confirmation.
- Limit decisions: define one trend rule, one entry trigger, one exit rule. Your checklist should fit on one screen.
- Standardize exits: pre-mark targets from the higher timeframe, then manage from the entry chart. Use a simple plan for setting take profit so you do not improvise mid-trade.
Your goal is fast alignment. If you need five charts to agree, you will miss trades and you will second-guess the ones you take.
Step-by-Step Workflow: Align Trend, Entry, and Exit
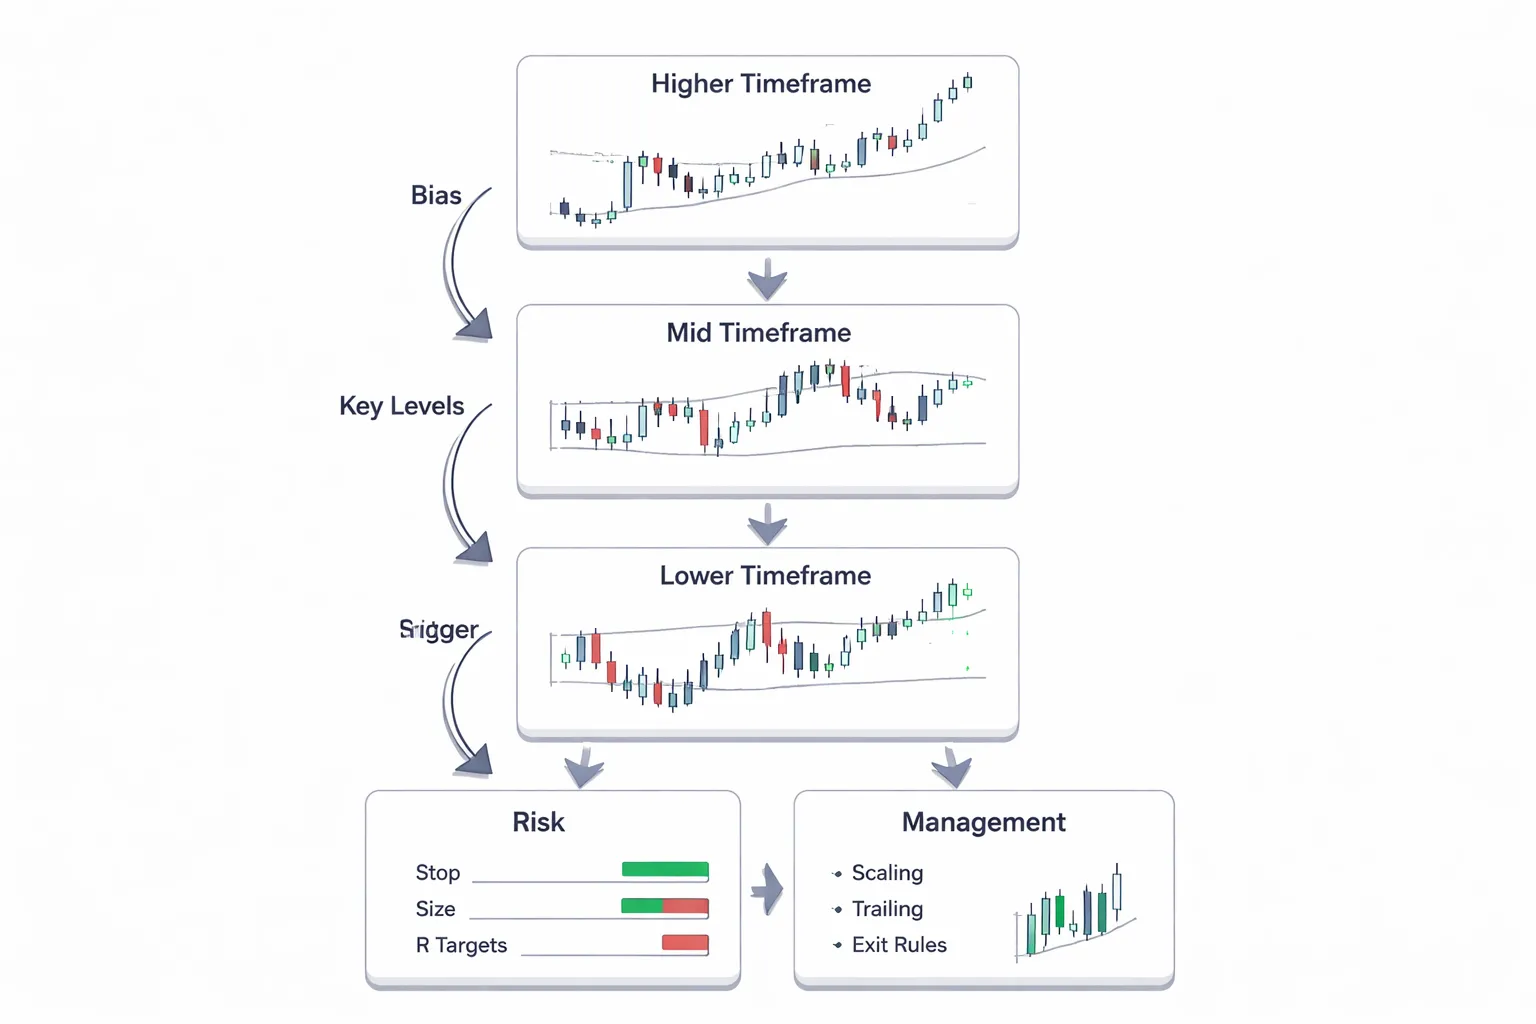
Step 1, Set higher timeframe directional bias with structure
Pick one higher timeframe for bias. Use W1 for swing trades or D1 for intraday trades.
- Bull bias: price prints higher highs and higher lows. You want buys only.
- Bear bias: price prints lower highs and lower lows. You want sells only.
- Neutral: structure is mixed. Stand aside or treat it as range conditions.
Mark the last clear swing high and swing low. If price breaks one side and holds, bias shifts.
Step 2, Mark key levels on the higher timeframe
Your higher timeframe levels set the map. Your lower timeframes only execute.
- Supply and demand zones: base areas before strong impulse moves. Mark the origin, not the middle of the move.
- Support and resistance: prior swing highs and lows, weekly opens, daily highs and lows.
- Liquidity pools: equal highs, equal lows, obvious stop clusters above and below ranges.
Keep levels tight. If a zone spans 80 pips, you will struggle to place a clean stop.
Step 3, Select a mid timeframe setup
Use one mid timeframe to choose the type of trade. Common pairs are D1 to H4, or H4 to H1.
- Pullback: trade with the higher timeframe trend after a retrace into a marked zone.
- Range rotation: fade the extremes of a defined range, target the midpoint or the other side.
- Breakout-retest: wait for a level break, then a retest that holds, then look for continuation.
Skip setups in the middle of price. You want trades at your higher timeframe levels, or right after a confirmed break and hold.
Step 4, Trigger on the lower timeframe
Drop to your execution chart, often M15 to M5 for intraday, or H1 for swing entries. Take the trade only after a clear trigger.
- Price action trigger: rejection from your zone with a close back inside, or a strong continuation close away from the level.
- Micro-structure shift: for buys, you see a lower timeframe sequence flip to higher highs and higher lows. For sells, it flips to lower highs and lower lows.
- Trendline break: break of the lower timeframe pullback line, then a retest that fails to reclaim it. Use one clean line, not a fan of lines. For a process, use this trendline drawing guide.
Do not enter on the first touch if your plan requires confirmation. Do not wait for three confirmations if your edge comes from speed.
Step 5, Build the risk plan before you place the order
Define risk in points first. Then calculate size. Then set targets. Do not reverse the order.
- Invalidation point: the price level that proves your idea wrong. Place the stop beyond it, not on it.
- Position sizing: size the trade so a stop-out equals a fixed percent or fixed amount.
- R-based targets: set at least one target at 1R to 2R, then align final targets with higher timeframe levels.
Keep it consistent. If your stop must be 2 times wider to “make it work,” skip the trade.
Step 6, Manage the trade with simple rules
Your management rules should not change mid-trade. Pick one scaling rule and one trailing rule.
- Scaling: take partials at predefined R levels or at the next higher timeframe level. Example, take 50 percent at 1R, leave the rest for the next zone.
- Trailing logic: trail behind the last valid swing on the entry timeframe, or trail behind a fixed multiple of ATR you use every time. Do not mix methods.
- Exit confirmation: exit if price closes back through the level that supported the trade, or if structure flips against you on the entry timeframe.
When price reaches a higher timeframe level, decide in advance. Either take profit, or require a clean break and hold to stay in.
Reading Trend Correctly Across Timeframes
Market structure hierarchy, when a pullback is not a reversal
Start on your trend timeframe. Mark the last clear swing high and swing low. That structure sets the bias.
- Uptrend on the trend timeframe: price prints higher highs and higher lows. A pullback is valid while it stays above the last higher low.
- Downtrend on the trend timeframe: price prints lower lows and lower highs. A pullback is valid while it stays below the last lower high.
- Reversal signal: the trend timeframe breaks the last protected swing and closes beyond it, then fails to reclaim it on the next push.
Then drop to your entry timeframe. Expect noise. A lower low on the entry chart can still be a higher low on the trend chart. You trade the hierarchy.
Use this rule. If the trend timeframe structure still holds, treat entry timeframe counter moves as pullbacks. If the trend timeframe structure breaks, stop calling it a pullback.
| What you see | What it means | What you do |
|---|---|---|
| Entry timeframe breaks structure against your bias, trend timeframe holds | Pullback expanding | Wait for your entry trigger at a level, keep stops based on entry rules |
| Trend timeframe breaks the last protected swing and closes beyond it | Bias invalid | Stop looking for continuation trades in the old direction |
| Trend timeframe holds, price tags higher timeframe level | Decision zone | Follow your plan, take profit or require break and hold |
Trend strength checks, slope, impulse vs correction, and volatility regimes
Do not label trend by direction alone. Check strength.
- Slope: compare recent swing points on the trend timeframe. Steep and consistent swings show strength. Flat swings show balance.
- Impulse vs correction: in a healthy trend, impulse legs travel farther and faster than pullbacks. If pullbacks match or exceed impulse legs, the trend weakens.
- Volatility regime: rising volatility widens swings and increases stop needs. Falling volatility compresses swings and increases false breaks.
Use one simple measurement to avoid guesswork. Track the average range on your entry timeframe with ATR and note if the current ATR sits above or below its 20-period average. Above means expansion. Below means compression. In expansion, widen targets and reduce position size if needed. In compression, demand cleaner breaks and tighter structure confirmation.
Moving averages as context, not signals
Use moving averages to describe location, not to trigger trades.
- 20 EMA: short-term mean. Good for judging pullback depth on the entry timeframe.
- 50 EMA or 50 SMA: mid-term trend filter. Often acts as a line where pullbacks pause in strong trends.
- 200 SMA: long-term bias line. Useful on daily and 4H charts for major direction and big level reactions.
Read them like this. Price above a rising 50 and 200 supports a long bias. Price below a falling 50 and 200 supports a short bias. If price chops through a flat 50, treat the market as range-bound and prioritize levels over trend continuation.
Momentum confirmation options, RSI, MACD, or rate-of-change
Pick one momentum tool. Use it to confirm structure, not to replace it.
- RSI (14): in uptrends, RSI often holds above 40 on pullbacks and pushes above 60 on impulses. In downtrends, it often holds below 60 and pushes below 40.
- MACD (12,26,9): use the zero line for regime. Above zero supports bullish momentum. Below zero supports bearish momentum. Watch histogram contraction during pullbacks and expansion on breakout.
- Rate of Change (ROC 9 to 14): clean momentum read. Positive supports uptrend pressure. Negative supports downtrend pressure. Divergence matters only at key higher timeframe levels.
Keep your chart clean. Use momentum as a checklist item. If structure aligns across timeframes and momentum agrees, you have confirmation. If momentum fights the setup, reduce risk or pass.
Once you define trend, entry, and exit rules, keep your payoff logic consistent. Use a fixed target or a fixed trailing method, then validate the trade’s risk-reward ratio before you enter.
Mapping Levels That Matter (So Entries Aren’t Random)
How to draw higher-timeframe support and resistance that holds on lower charts
Your levels must come from where price actually turned with force. Start high, then refine.
- Step 1, mark the swing points on the higher timeframe. Use weekly first, then daily. Mark the last two to four clear swing highs and swing lows.
- Step 2, draw zones, not thin lines. Use the cluster of wicks and closes. If price reacted across 10 to 30 pips on EURUSD, your zone should reflect that.
- Step 3, validate the level on your entry chart. Drop to H4 or H1 and check if price respects the same area with multiple touches, rejections, or clean breaks and retests.
- Step 4, keep the count honest. A level matters more when you can point to at least two clear reactions on the higher timeframe.
- Step 5, delete levels that do nothing. If a level gets sliced through without hesitation, it is noise. Remove it.
When you trade lower timeframes, you do not need more levels. You need fewer levels that control where you will enter, place your stop, and take profits.
Using weekly and daily opens, previous day high and low, and session ranges
These levels work because many traders watch them. They also give you fixed reference points for planning.
- Weekly open. Use it as a bias line. If price holds above it and structure points up, favor longs. If price holds below it and structure points down, favor shorts.
- Daily open. Use it as an intraday filter. Trades taken in the direction of price relative to the daily open tend to avoid chop.
- Previous day high and low. Treat them as breakout and reversal triggers. A clean break and hold often leads to continuation. A sweep and rejection often leads to mean reversion back into the range.
- Asia range. Mark the high and low from the quieter session. London often breaks it. Your entry plan should define whether you trade the break, the retest, or the rejection.
- London and New York highs and lows. These often act as intraday targets. They also form tight stop locations when structure supports the setup.
Anchor these levels once per day and once per week. Do not redraw them every hour.
Fibonacci and measured moves, when they add value vs create bias
Use Fibonacci and measured moves as validation tools, not as reasons to trade.
- Add value when they align with structure. If a 50 to 61.8 retracement sits inside a higher-timeframe support zone and price shows continuation structure on the entry chart, you have usable confluence.
- Add value when they give you a clean target. A measured move projection can define a realistic take-profit level before you enter.
- Create bias when you force the anchor points. If you cannot name the swing high and swing low without thinking, do not draw it.
- Create bias when you stack too many tools. Multiple fibs, extensions, and fans turn your chart into a justification machine.
- Rule. If fib does not line up with a level you would trade anyway, ignore it.
Use fib and measured moves to refine entries and exits. Do not use them to invent trades.
Confluence checklist: stacking structure, levels, and momentum
Use one checklist. Keep it binary. Yes or no.
| Item | What you need to see | If missing |
|---|---|---|
| Higher-timeframe trend | Weekly and daily structure point the same way, higher highs and higher lows for longs, lower highs and lower lows for shorts | Drop size or skip |
| Level | Entry occurs at a weekly or daily zone, or a major open, or prior day high or low | No trade, you are guessing |
| Entry trigger | Clear break and retest, or sweep and rejection, on your entry timeframe | Wait for confirmation |
| Momentum | Momentum supports the direction at the moment of entry, strong candles, clean impulse, no immediate stall | Reduce risk or pass |
| Stop placement | Stop sits beyond the level and beyond the swing that invalidates the idea | Skip, your stop will sit in noise |
| Target logic | Target sits at the next higher-timeframe level or measured objective, with acceptable risk-reward ratio | Adjust target or do not enter |
When these items stack, your entry is not random. It is tied to levels that other traders defend, and backed by structure and momentum.
Entry Techniques That Fit Multi Time Frame Analysis
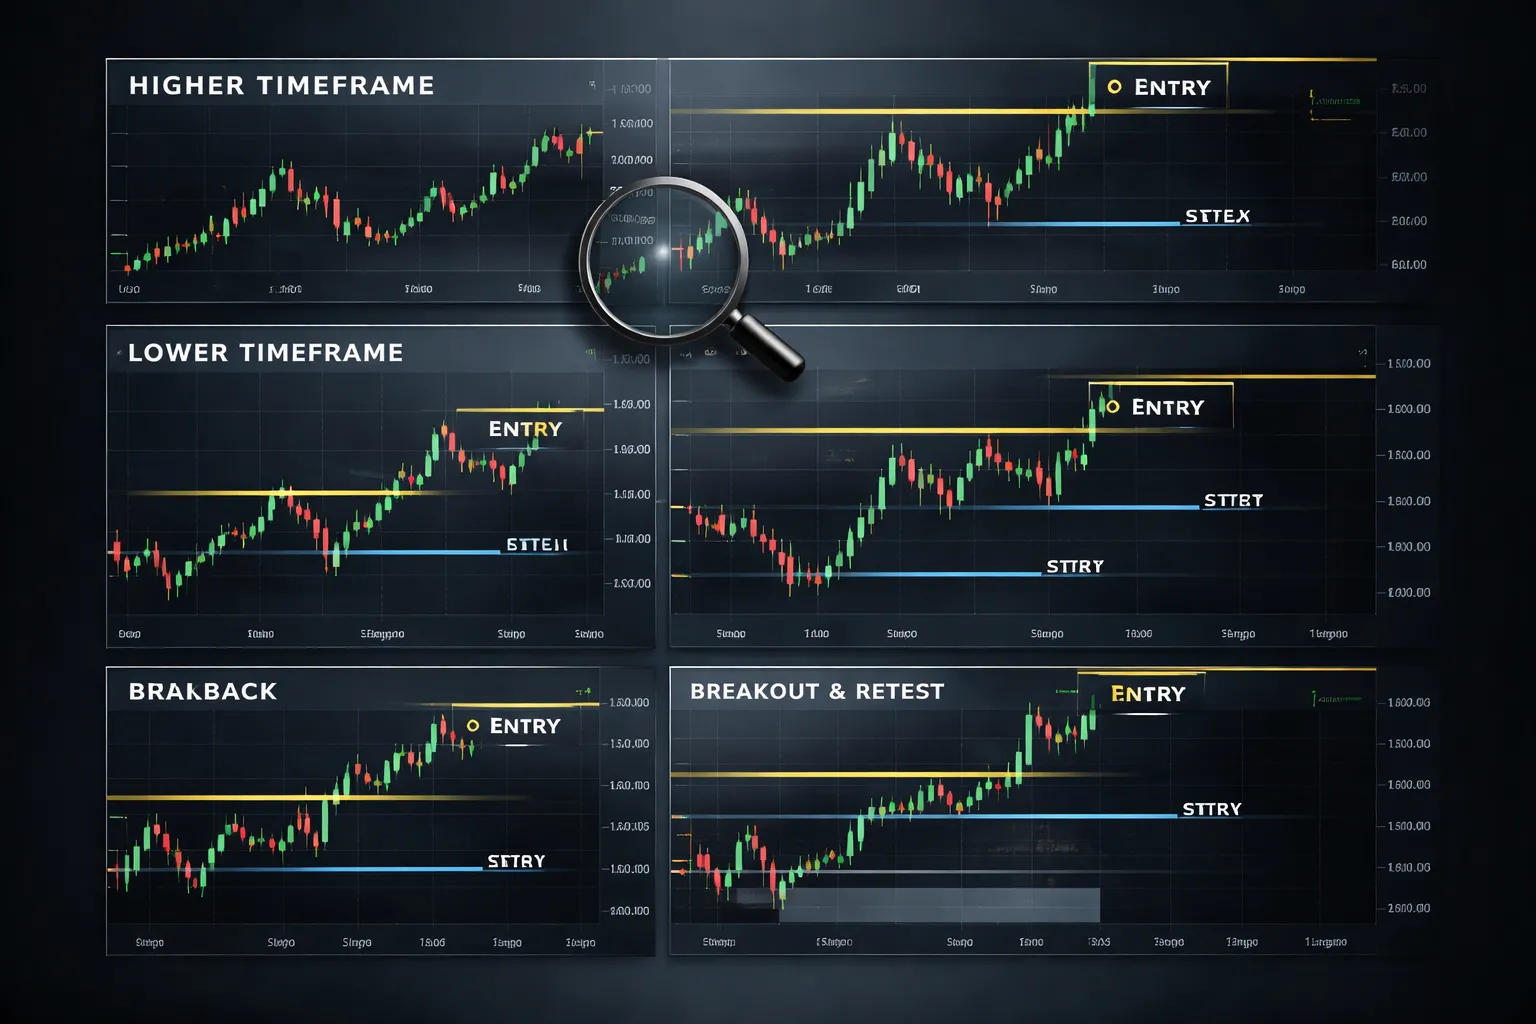
Pullback entry, buy discount and sell premium
Start on the higher timeframe. Mark the trend and the active swing. Your pullback must stay inside that swing. If it breaks the swing, the setup is invalid.
- Trend filter: Trade pullbacks only in the direction of the higher-timeframe trend. Skip countertrend pullbacks unless you trade mean reversion.
- Location: Buy at discount in an uptrend, near higher-timeframe support. Sell at premium in a downtrend, near higher-timeframe resistance.
- Entry trigger: Use the lower timeframe to time the turn. Look for a break of the pullback structure, then a higher low for longs, or a lower high for shorts.
- Invalidation: Place the stop beyond the higher-timeframe swing point that makes the idea wrong, not beyond a small lower-timeframe wick.
- Quality check: If your stop must sit inside the pullback range, skip. Price can tag it without changing the higher-timeframe idea.
Breakout entry, use higher-timeframe context to filter traps
Most false breakouts happen when you trade into higher-timeframe supply or demand. Your job is to define the breakout zone on the higher timeframe first, then use the lower timeframe for execution.
- Breakout level: Use a higher-timeframe level that has clear reactions. Avoid drawing levels from noise candles.
- Space: Confirm you have room to the next higher-timeframe level. If the next level sits close, your breakout has weak upside or downside.
- Structure shift: On the entry timeframe, require a close beyond the level plus a break of the last swing in the direction of the breakout.
- Volatility check: If the breakout candle is extreme relative to recent candles, expect a snapback. Reduce size, wait for a retest, or skip.
- Stop logic: Stop goes beyond the failed breakout point, not just inside the breakout candle.
Breakout-retest entry, rules for depth and confirmation
Retests give you cleaner risk and clearer invalidation. They also fail when the pullback goes too deep. Define “too deep” with structure, not hope.
- Retest depth rule: A valid retest holds above the broken level for longs, or below it for shorts. If price closes back inside the range on your entry timeframe, treat it as failure.
- Retest structure: On the lower timeframe, the retest should form a tight base. Avoid entries during wide, overlapping swings.
- Confirmation: Enter on a break of the retest micro-structure, like a break of the last lower-timeframe swing high for longs, or swing low for shorts.
- Stop placement: Put the stop beyond the retest low for longs, or beyond the retest high for shorts, and beyond the level if the market tends to sweep it.
- Failure signal: A fast reclaim back into the old range, then a lower-timeframe structure break against you, is a strong exit signal.
Range-to-trend transition, spot compression then trade expansion
Trends often start from ranges. Multi-timeframe analysis helps you avoid trading the middle and focus on the expansion that follows compression.
- Higher-timeframe box: Mark the range high and range low on the higher timeframe. Treat the middle as no-trade space.
- Compression signs: Lower highs and higher lows inside the range, reduced candle size, and repeated rejections at the same levels.
- Expansion trigger: On the entry timeframe, wait for a clean break and close outside the range, then trade in the direction of the break.
- Confirmation: Require a higher-timeframe alignment, either a breakout in the direction of the higher-timeframe trend, or a break that creates a new higher-timeframe swing.
- Execution options: Enter on the first breakout, or use a breakout-retest to control risk. Choose based on how close the next higher-timeframe level sits.
- Risk control: If your stop must go inside the range while your target sits near the opposite side, the math is weak. Skip.
| Entry type | Higher-timeframe job | Lower-timeframe job | Common mistake |
|---|---|---|---|
| Pullback | Define trend, swing, key level | Time the turn, confirm structure shift | Stop inside pullback noise |
| Breakout | Confirm level quality and space | Confirm close and swing break | Breaking into nearby resistance or support |
| Breakout-retest | Set the level and invalidate on reclaim | Trade retest base, confirm micro break | Buying after a deep retest back into the range |
| Range to trend | Mark range, identify compression | Trade expansion and follow-through | Trading the range middle |
If you draw levels by hand, keep them consistent across charts. Use the same swing points on all timeframes. This reduces conflicting reads. Follow a simple process from trendline drawing basics, then apply it to your multi-timeframe map.
Exit Planning and Trade Management Across Charts
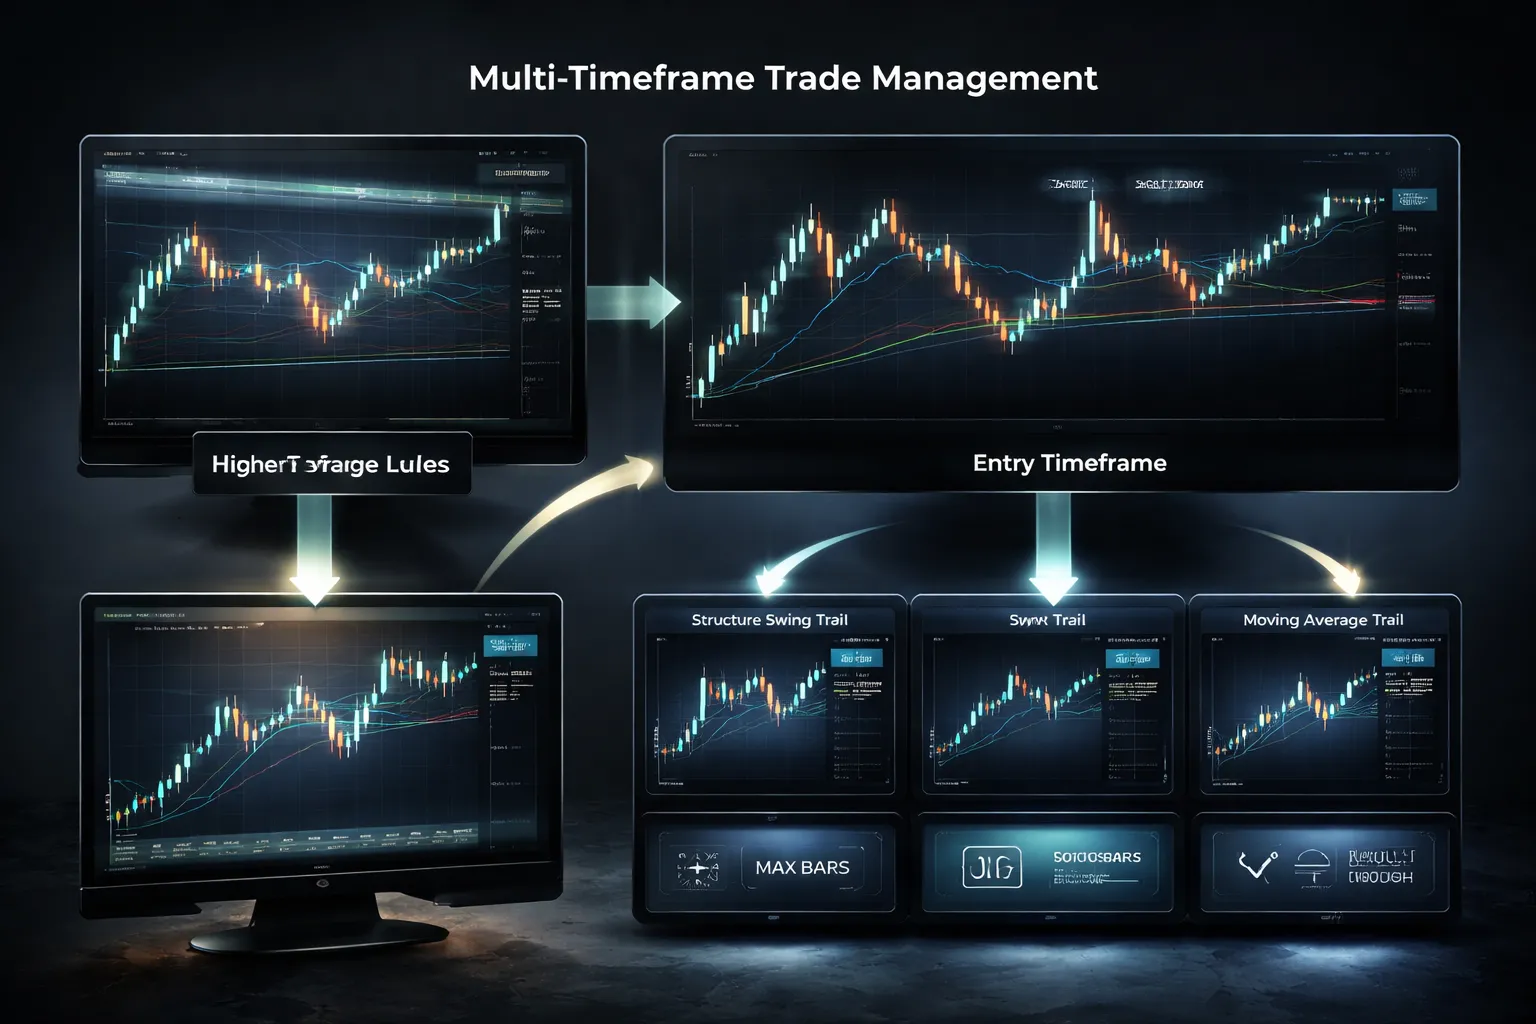
Setting targets across timeframes
Your exit plan starts on the higher timeframe. You decide where price can travel before your entry chart even triggers.
- Primary targets, HTF levels: Use the next weekly or daily swing high or low, supply or demand zone, or range edge. Pick the closest level in the trade direction that price can realistically reach without breaking structure.
- Secondary targets, extensions: If price breaks and holds beyond the first HTF level, aim for the next level. Do not invent targets in empty space.
- ADR or ATR-based objectives: Add a distance filter so your target matches current volatility. Use daily ATR for swing trades, and session ATR for intraday trades. If your first HTF target sits beyond a typical daily move, expect slower progress, more pullbacks, or a miss.
- Partial profits: Scale out at the first logical obstacle. You reduce variance and free your mind to manage the rest. Common splits are 50 percent at T1, then trail the remainder, or 33 percent at T1, 33 percent at T2, and hold the rest for a runner.
| Tool | Best use | Simple rule |
|---|---|---|
| HTF level | Structural targets | Target the next obvious swing or range boundary |
| Daily ATR | Reality check on distance | Avoid targets far beyond 1x daily ATR unless trend is strong |
| Partials | Smooth equity curve | Take something off at the first HTF barrier |
Trailing methods that match your chart map
Pick one trailing method per trade. Mixing methods creates late exits and inconsistent results.
- Structure-based trail: Trail behind the last confirmed swing on your entry timeframe, or one timeframe higher. In an uptrend, move your stop under higher lows. In a downtrend, move it above lower highs. Only adjust after a swing forms, not mid-candle.
- ATR-based trail: Use a fixed multiple of ATR from price, or from the last close. This fits fast trends and news-driven volatility. It fails in tight ranges because it can sit too wide.
- Moving-average trail: Use a single moving average as a line in the sand, like the 20 EMA or 50 EMA on your management timeframe. Exit on a close across the average, or on a retest failure. This works best in clean trends. It lags during sharp reversals.
Match the trail to your trade type. Structure trail for swing structure breaks. ATR trail for momentum continuation. Moving-average trail for smooth directional runs.
Time-based exits when momentum dies
Time is a cost. If price fails to move, your setup loses edge.
- No follow-through after the break: If your entry triggers on a breakout, you want expansion. If price stalls and closes back inside the range on the same timeframe you entered, treat it as failed.
- Maximum bars rule: Set a hard limit in bars on your entry timeframe. Example, if you trade the 1H chart, allow 3 to 6 candles to see progress. If price stays flat and cannot print a new swing in your direction, exit or reduce.
- Session cut-off: For intraday trades, avoid holding dead trades into low liquidity. If your move does not start during your active session, scratch it. This matters most if you use a scalping approach.
Protecting against reversals across charts
You reduce risk when the higher timeframe thesis weakens, or when your entry timeframe structure breaks.
- Break of entry structure: If price takes out the last higher low in a long, or the last lower high in a short, cut risk. Either exit or move to a tight stop and accept the scratch.
- HTF level reaction against you: If price hits a weekly or daily level and prints rejection on your management timeframe, take partials and tighten the stop. Do this even if your entry signal still looks fine.
- Volatility spike without progress: If ATR expands but price cannot push toward your target, you face two-way flow. Reduce size or exit. Wide candles with overlapping closes signal chop.
- One timeframe up flips: If you manage on 1H and the 4H prints a clear reversal structure, respect it. Your trade now fights the next higher timeframe.
- Scratch criteria: Move stop to breakeven only after you get a structural shift in your favor, or after price clears a key level and holds. Do not use breakeven as a comfort move. It turns good trades into small losses of opportunity.
Write these rules before you trade. Then execute them without debate.
Risk Management: The Missing Piece in Most Multi-Timeframe Guides
Position Sizing Comes From Stop Distance, Not From Conviction
Multi-timeframe alignment improves your entry quality. It does not reduce risk. Your stop distance sets your position size. Your opinion does not.
Use a fixed risk per trade. Many traders stay between 0.25% and 1% of account equity per trade. Pick one number. Keep it stable.
- Step 1: Set the stop where the trade becomes invalid, not where the loss feels smaller.
- Step 2: Measure stop distance in pips from entry to stop.
- Step 3: Calculate position size to keep risk fixed.
- Step 4: If the stop is too wide for your risk limit, reduce size or skip the trade.
Basic sizing formula.
- Position size (lots) = Account risk / (Stop pips x Pip value per lot)
Stop distance changes across timeframes. A clean H1 setup inside a D1 trend can still require a wide stop if structure sits far away. Do not force the trade by tightening the stop into noise. Fix the size instead.
| Input | Example |
|---|---|
| Account equity | $10,000 |
| Risk per trade | 0.5% = $50 |
| Stop distance | 25 pips |
| Value per pip | $10 per pip per 1.00 lot |
| Position size | $50 / (25 x $10) = 0.20 lots |
Handling News Risk: CPI, NFP, Central Banks
News breaks multi-timeframe logic. Spreads widen. Volatility spikes. Stops slip. Limit orders miss. Your backtest does not include your broker widening EURUSD from 1 pip to 5 pips.
Treat high-impact events as a separate risk layer.
- CPI: Fast repricing, whipsaws, second moves. Initial candle often reverses.
- NFP: Spread and slippage risk peaks. Price can jump through your stop.
- Central bank rate decisions and pressers: Two events in one. The statement moves price, then Q&A shifts it again.
Rules that hold up in live trading.
- Do not open a new trade right before a major release if your stop sits inside the expected spike range.
- If you stay in, reduce size or widen stop to structure and accept the smaller position.
- Avoid tight stop entries during the minutes around the release. Spread expansion can take you out without a real move.
- Plan exit behavior. If you expect a spike, place targets before the event, or step aside.
If your strategy depends on clean execution, skip the event window. Your job is to survive the worst prints, not to trade every calendar day.
Correlation and Exposure: Do Not Stack the Same Trade
Multi-timeframe analysis often pushes you into the same theme across pairs. That can stack risk without you noticing.
Examples.
- Long EURUSD, long GBPUSD, short USDCHF. You built a single large short USD position.
- Short USDJPY and short USDCAD. You still rely on one currency driver, even if charts look different.
Control exposure with simple limits.
- Set a max total risk per currency. Example, cap USD exposure at 1% across all open trades.
- Count correlated trades as one. If two pairs move together, cut size or take only one setup.
- Avoid doubling down across timeframes. If you already hold a USD short from H4, do not add a second USD short from M15 unless your rules allow scaling and you can define separate invalidation.
This also reduces overtrading pressure. If you want a clearer framework, read how to avoid overtrading.
Defining Invalidation: Every Timeframe Needs a Line in the Sand
Most multi-timeframe guides tell you how to align trend and entry. They skip the one level that matters most, the level that proves you wrong.
Define invalidation on each timeframe you use. Keep it specific.
- Higher timeframe trend filter: The level that breaks the trend premise. Example, last higher timeframe swing low in an uptrend.
- Execution timeframe setup: The level that breaks your entry structure. Example, the low that formed your break and retest base.
- Trade management timeframe: The level that cancels your hold logic. Example, a close back below the reclaimed level you used to trail.
Then pick which invalidation controls the stop. Do not mix them after entry.
- If you trade a higher timeframe hold, your stop must respect higher timeframe structure. Size down.
- If you trade a lower timeframe hit and run, your stop can sit on the execution timeframe. Take profit faster and accept more scratches.
Write your invalidation in one sentence before you place the order. If you cannot define it, you do not have a trade.
Practical Examples (Walkthrough Templates You Can Reuse)
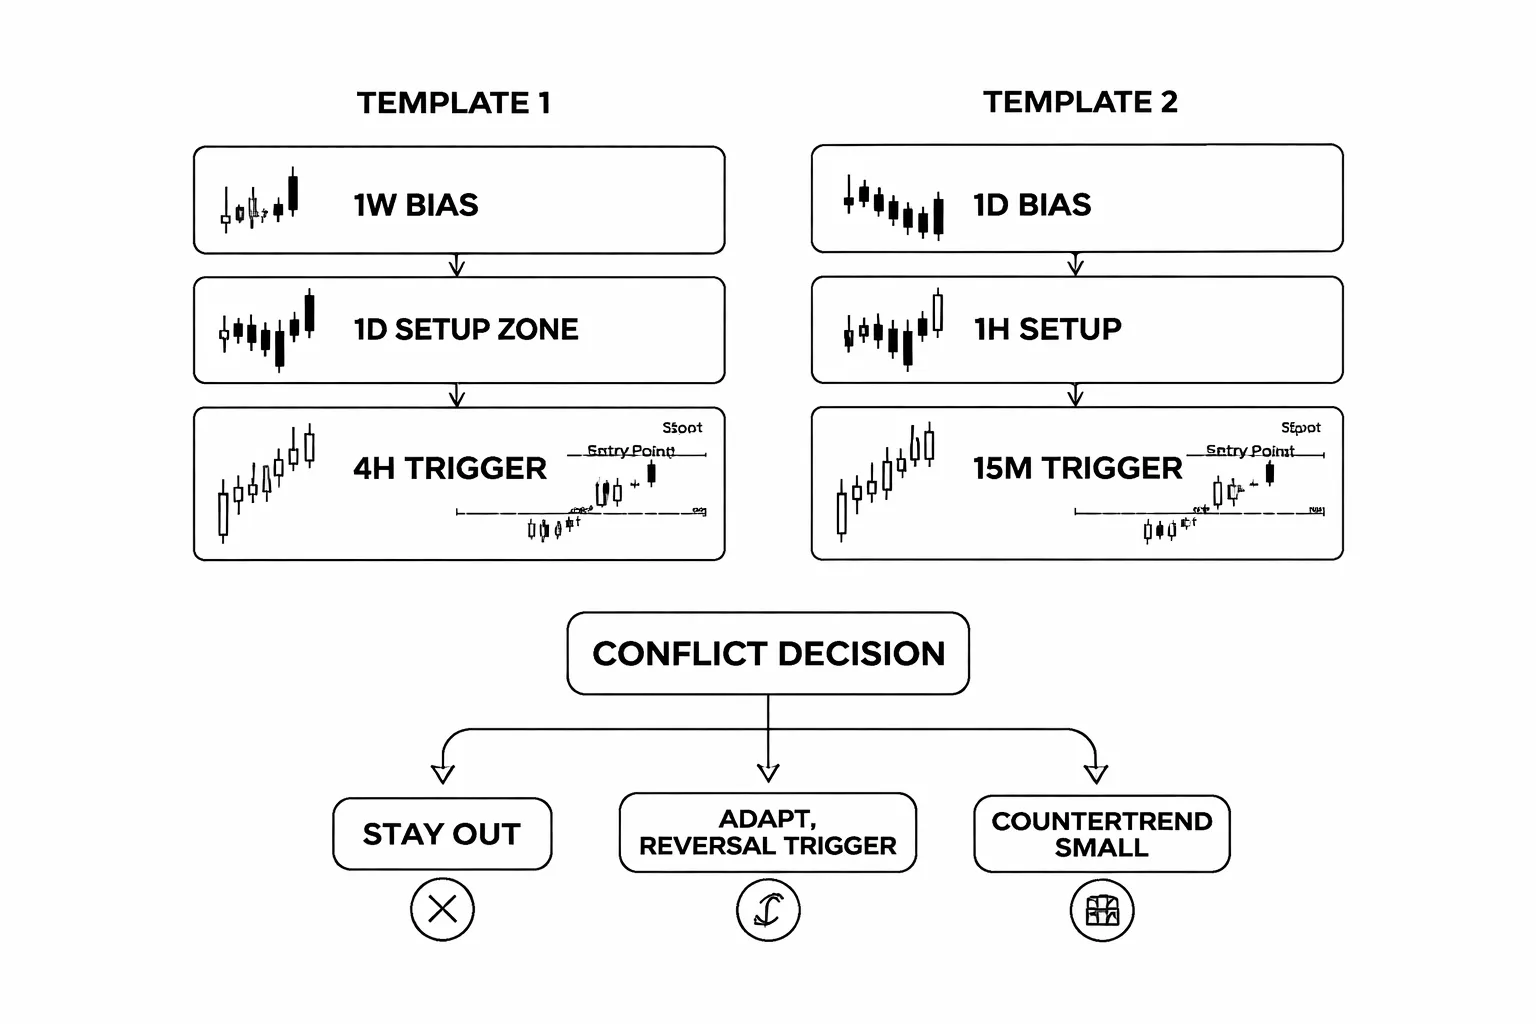
Trend Continuation Example: 1W Bias, 1D Setup, 4H Trigger
Use this when you want a swing trade in the direction of the weekly trend and you can hold for days.
- Timeframes: 1W for bias, 1D for setup zone, 4H for entry trigger and execution stop.
- Holding style: higher timeframe hold. Your stop must respect daily structure. Reduce size.
Template steps
- Step 1, 1W bias: Mark the last clear swing high and swing low. Define trend. Higher highs and higher lows means bullish. Lower lows and lower highs means bearish.
- Step 2, 1W line in the sand: Mark the weekly swing point that would break the trend. This becomes your hard invalidation reference.
- Step 3, 1D setup zone: Identify the most recent daily impulse leg in the weekly direction. Mark the base of that move and the first clean pullback area. This is your zone.
- Step 4, 1D filter: Skip the trade if the daily closes start printing against the weekly bias inside your zone. One spike is noise. Two to three daily closes are information.
- Step 5, 4H trigger: Wait for a 4H break of the pullback structure in the weekly direction. Then wait for a 4H retest to hold. Enter on the retest or on the next 4H continuation close.
- Step 6, stop: Place your stop beyond the daily structure that defines the setup. Do not tuck it behind a 4H swing if you plan to hold the daily move.
- Step 7, targets: First target at the prior daily swing in the trend direction. Second target at the prior weekly swing. If price stalls before the first target, reduce risk or exit.
- Step 8, management rule: After entry, only manage on 4H closes. Do not micromanage on lower timeframes.
One sentence invalidation: “If 1D closes below the daily swing low that defines this pullback, I exit.”
Day-Trade Example: 1D Bias, 1H Setup, 15M Trigger
Use this when you want an intraday move with a tight stop and you plan to flatten the trade the same day.
- Timeframes: 1D for bias, 1H for setup structure, 15M for trigger and execution stop.
- Holding style: lower timeframe hit and run. Your stop can sit on 15M structure. Take profit faster.
Template steps
- Step 1, 1D bias: Mark the daily trend and the nearest daily support and resistance. Decide long-only, short-only, or neutral. Neutral means you cut size or skip.
- Step 2, 1H context: Mark the current 1H range or channel. Note where you are inside it. Middle of the range is low quality.
- Step 3, 1H setup: Pick one setup type for the session. Example, pullback in trend or range fade at an edge. Mark your setup zone on 1H.
- Step 4, 15M trigger: Wait for a clean 15M shift. Break of minor structure in your direction, then a retest that holds. Enter on the retest.
- Step 5, stop: Put the stop beyond the 15M swing that must hold for the trade to work. Keep it outside normal noise for that pair and session.
- Step 6, targets: First target at the nearest 1H opposing level. Second target at the 1D level if momentum stays strong. If the first target sits too close, skip the trade.
- Step 7, time stop: If price does not move in your favor within a fixed number of 15M candles, exit. You avoid dead trades.
One sentence invalidation: “If 15M closes back inside the broken level, I exit.”
To keep your rules simple, pair this with a single trend filter, like the approach in our moving average strategy.
Conflict Example: HTF Bullish but LTF Bearish
You will see this often in pullbacks. The weekly can trend up while the 1H trends down for days. You need a rule set that stops you from forcing trades.
Decision framework
- Step 1, define your trade type: Trend continuation or countertrend. Pick one. Do not mix.
- Step 2, grade the higher timeframe: Strong HTF means clear structure, clean impulses, shallow pullbacks. Weak HTF means overlapping candles and choppy swings.
- Step 3, locate price on HTF: If price sits near weekly resistance in an uptrend, do not buy just because HTF is bullish. If price sits near weekly support, do not short just because LTF is bearish.
- Step 4, choose one of three actions:
- Action A, stay out: Use this when HTF is strong but LTF sells hard and sits mid-range. You have no edge. Wait for LTF to base or break.
- Action B, adapt to HTF: You only take longs, but you demand an LTF reversal trigger. Example, 1H downtrend breaks, then 15M retest holds, then you enter long. Your invalidation sits on LTF structure because you trade the turn, not the full weekly swing.
- Action C, trade countertrend small: You only do this at HTF extremes, into clear HTF levels, with tight targets. You take profit at the first logical support and you accept scratches. You do not “let it run.”
Hard rule: If your planned target sits inside a higher timeframe wall, you cut the trade or skip it. HTF levels win.
Journal Snapshot: What to Record Before, During, After
Keep it short. Record facts. You want repeatable data.
- Pair and session: EURUSD, London, NY, overlap, or Asia.
- Timeframes used: 1W, 1D, 4H, or 1D, 1H, 15M.
- HTF bias: bullish, bearish, neutral, and why in one line.
- Key levels: weekly and daily swings, plus nearest 1H level.
- Setup type: pullback continuation, breakout retest, range fade.
- Entry trigger: the exact candle condition you require.
- Invalidation sentence: one sentence, no extras.
- Stop distance and position size: in pips and in risk percent.
- Planned targets: T1, T2, and the reason each exists.
- Execution notes: entry time, spread at entry, slippage if any.
- Management rule used: “manage on 4H closes” or “manage on 15M closes.”
- Deviation: any rule you broke, written in one sentence.
- Market change: new HTF level reached, news spike, abnormal volatility.
- Result: R multiple, not dollars.
- Exit type: target hit, stop hit, time stop, manual invalidation.
- Screenshot set: HTF chart, setup chart, trigger chart, exit chart.
- Quality score: A if you followed rules, B if minor slips, C if you improvised.
- One improvement: one action for the next trade, not a theory.
Tools, Platforms, and Indicators That Support the Process (Without Overfitting)
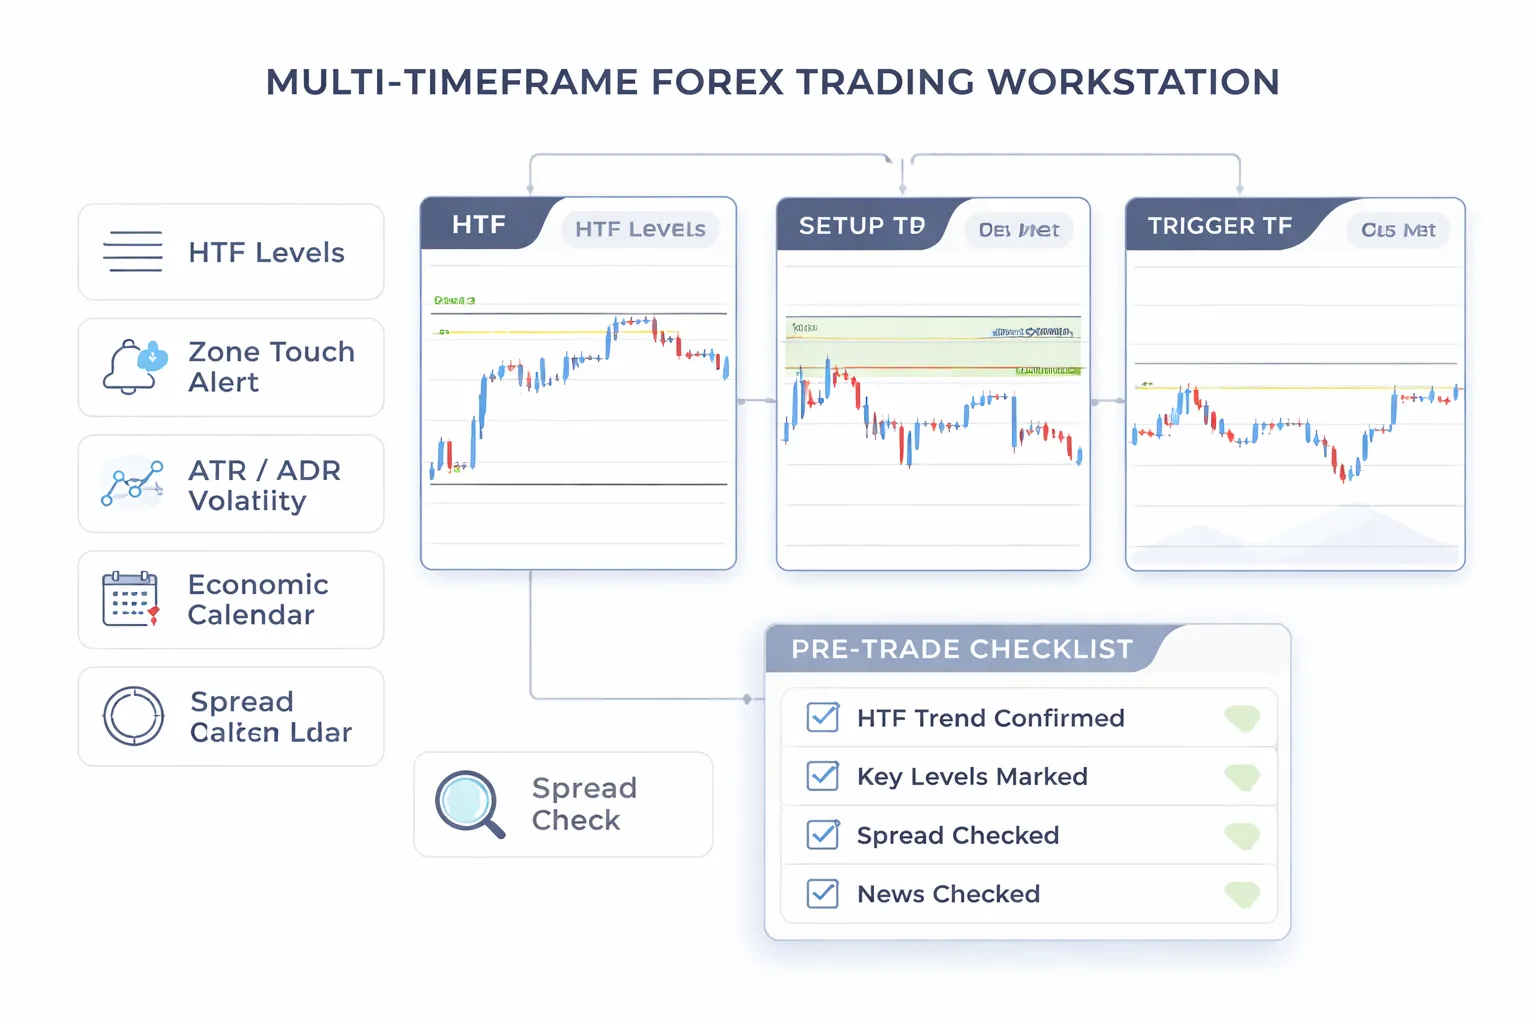
Charting essentials: multi-chart layouts, alerting, and replay/backtest features
Your edge comes from structure, not from stacking indicators. Build a workspace that makes alignment fast and repeatable.
- Multi-chart layout. Keep your HTF, setup TF, and trigger TF visible at the same time. Use the same pair, same broker feed, same session hours. Link crosshair and symbol so one scroll updates all charts.
- Clean templates per timeframe. HTF template for levels and trend. Setup template for zones and structure. Trigger template for execution and risk lines. Do not mix them.
- Key drawings only. HTF levels, swing points, and one trend filter. Skip extra channels, grids, and pattern libraries.
- Alerts that match your rules. Price alert at HTF level. Zone touch alert on setup TF. Break of trigger level on trigger TF. Avoid alerts on every minor candle condition.
- Replay that tests your process. Use bar replay to practice: mark HTF bias, wait for setup, then execute on trigger. Track R. Track rule breaks. Do not optimize settings. Optimize decisions.
- Backtest for frequency and failure modes. You want answers to simple questions: How many valid setups per month, average stop size in pips, average R, and common invalidations.
Volatility tools: ATR, ADR, and session volatility expectations
Volatility tools help you size stops, set realistic targets, and avoid taking trades that cannot move.
- ATR for stop sanity. Use ATR on your setup timeframe to check if your stop is too tight. If your stop sits inside normal candle noise, expect random stop-outs.
- ADR for target realism. Compare distance to target versus typical daily range. If price already traveled most of its ADR, expect slower follow-through and more mean reversion.
- Session expectations. London and New York often move more. Asia often ranges more in many pairs. Adjust expectations for follow-through, not your rules.
- Abnormal volatility filter. If spreads widen and candles spike beyond recent ATR, reduce size, widen stop with lower size, or skip. Do not force precision entries in chaos.
| Tool | What you use it for | What you avoid |
|---|---|---|
| ATR | Stop placement check, volatility regime check | Signal generation, fine-tuning periods for “best” results |
| ADR | Target feasibility, timing expectations | Fixed take-profit rules that ignore nearby HTF levels |
| Session range | When to expect expansion or compression | Trading every session the same way |
Market context inputs: economic calendar, sentiment/positioning, and spreads
Context tools keep you out of bad timing. They do not give you entries.
- Economic calendar. Mark high-impact events for your pair’s currencies. Plan a rule like “no new entries 15 to 30 minutes before red news.” Decide in advance how you handle open trades.
- Event risk mapping. For central bank days and CPI, expect whipsaw. Use wider invalidation logic or stand down. Your charts can look perfect and still fail.
- Sentiment and positioning. Use it as a one-line bias check, not a trigger. If retail is extremely one-sided, it can support a continuation or a squeeze. Do not fade trends on sentiment alone.
- Spreads and execution costs. Track typical spread by session. Avoid entries when spreads widen, especially on lower timeframes. High spread turns good R setups into marginal trades.
Automation aids: checklists, templates, and rule-based alerts
You want automation that reduces mistakes, not automation that replaces judgment.
- Pre-trade checklist. A short list you must pass: HTF trend, HTF level nearby, setup quality, volatility normal, news clear, spread acceptable, risk fixed.
- Post-trade checklist. Log R multiple, exit type, screenshot set, quality score, and one improvement. Keep it consistent so patterns show up fast.
- Templates and hotkeys. One-click drawings for risk box, entry line, stop line, and target line. Reduce friction so you do not improvise under pressure.
- Rule-based alerts. Use alerts for objective states: “price entered zone,” “HTF level touched,” “break and close beyond trigger.” Avoid alerts that require interpretation like “momentum strong.”
- Guardrails against overtrading. Add limits: max trades per day, max losses per day, and a cooldown after a rule break. This pairs well with your plan to avoid overtrading in forex.
Common Mistakes (and How to Fix Them)
Cherry-picking the timeframe that agrees with your bias
You flip timeframes until you find a chart that supports the trade. This removes the edge. It turns analysis into justification.
- Fix: Lock your stack before the session. Example, 1D for trend, 4H for setup, 1H for entry. Do not change it per trade.
- Fix: Define trend with one rule on the HTF and keep it constant. Example, “bull trend if price holds above the last daily swing low.”
- Fix: Add a filter that blocks trades when timeframes conflict. Example, “no longs if daily closes below the 20 EMA.” If you use MAs, keep the method consistent. See moving averages for trend, entries and exits.
Overcomplicating with too many indicators and contradictory rules
More indicators create more disagreement. You hesitate, you override, you miss good trades, then chase late entries.
- Fix: Limit each timeframe to one job. HTF sets direction and key levels. Mid timeframe defines the zone. Trigger timeframe defines entry and stop.
- Fix: Use a max of two confirmations. One structural, one momentum or volatility. Remove anything that does not change your decision.
- Fix: Write rules that cannot conflict. If two rules can point opposite ways, you need a priority order.
| Problem | What it causes | Rule to use instead |
|---|---|---|
| 5 indicators across 3 timeframes | Late entries, skipped trades | 2 confirmations max, fixed priority |
| Indicator says buy, structure says sell | Rule breaks | Structure overrides indicator |
| New indicator after a loss | Strategy drift | Only adjust after 20 trades, not after 1 |
Entering on the trigger timeframe without HTF invalidation clarity
You take the 5 minute or 15 minute signal, but you never define what would prove the higher timeframe idea wrong. You then hold losers too long or cut winners too fast.
- Fix: Set the invalidation level on the HTF first. Example, “long idea invalid if daily closes below support” or “below the daily swing low.”
- Fix: Place the stop where the idea breaks, not where the trigger candle looks clean. If the required stop is too large, skip the trade.
- Fix: Separate entry trigger from trade thesis. Your trigger can fail without the thesis failing. Your plan must state what happens in each case.
Ignoring liquidity and session timing (London and New York overlaps)
Multi-timeframe alignment does not matter if the market runs thin. Spreads widen, fills worsen, and false breaks increase.
- Fix: Trade when your pair has consistent volume. For many major pairs, the London session and the London and New York overlap provide tighter spreads and cleaner continuation moves.
- Fix: Avoid new entries in low liquidity windows. Typical problem periods include late New York, pre-Asia for some pairs, and minutes around major news releases.
- Fix: Add a time filter to your rules. Example, “only take triggers between 07:00 and 11:00 New York time,” or “no trades 15 minutes before high-impact news.”
Changing timeframes mid-trade and breaking your plan
You enter on 1H, then manage on 5 minute because you want control. You react to noise. You exit early, re-enter, and rack up fees and mistakes.
- Fix: Predefine management timeframe. If you enter on 1H, manage on 1H or 4H. Only drop lower if your plan allows it.
- Fix: Use one exit model and keep it stable. Example, “trail below 1H swings,” or “take partial at 1R, then trail to break-even after a 1H close above level.”
- Fix: Add a rule that blocks impulsive switching. Example, “no timeframe changes after entry unless HTF invalidation triggers or target hits.”
Building a Repeatable Multi Time Frame Trading Plan
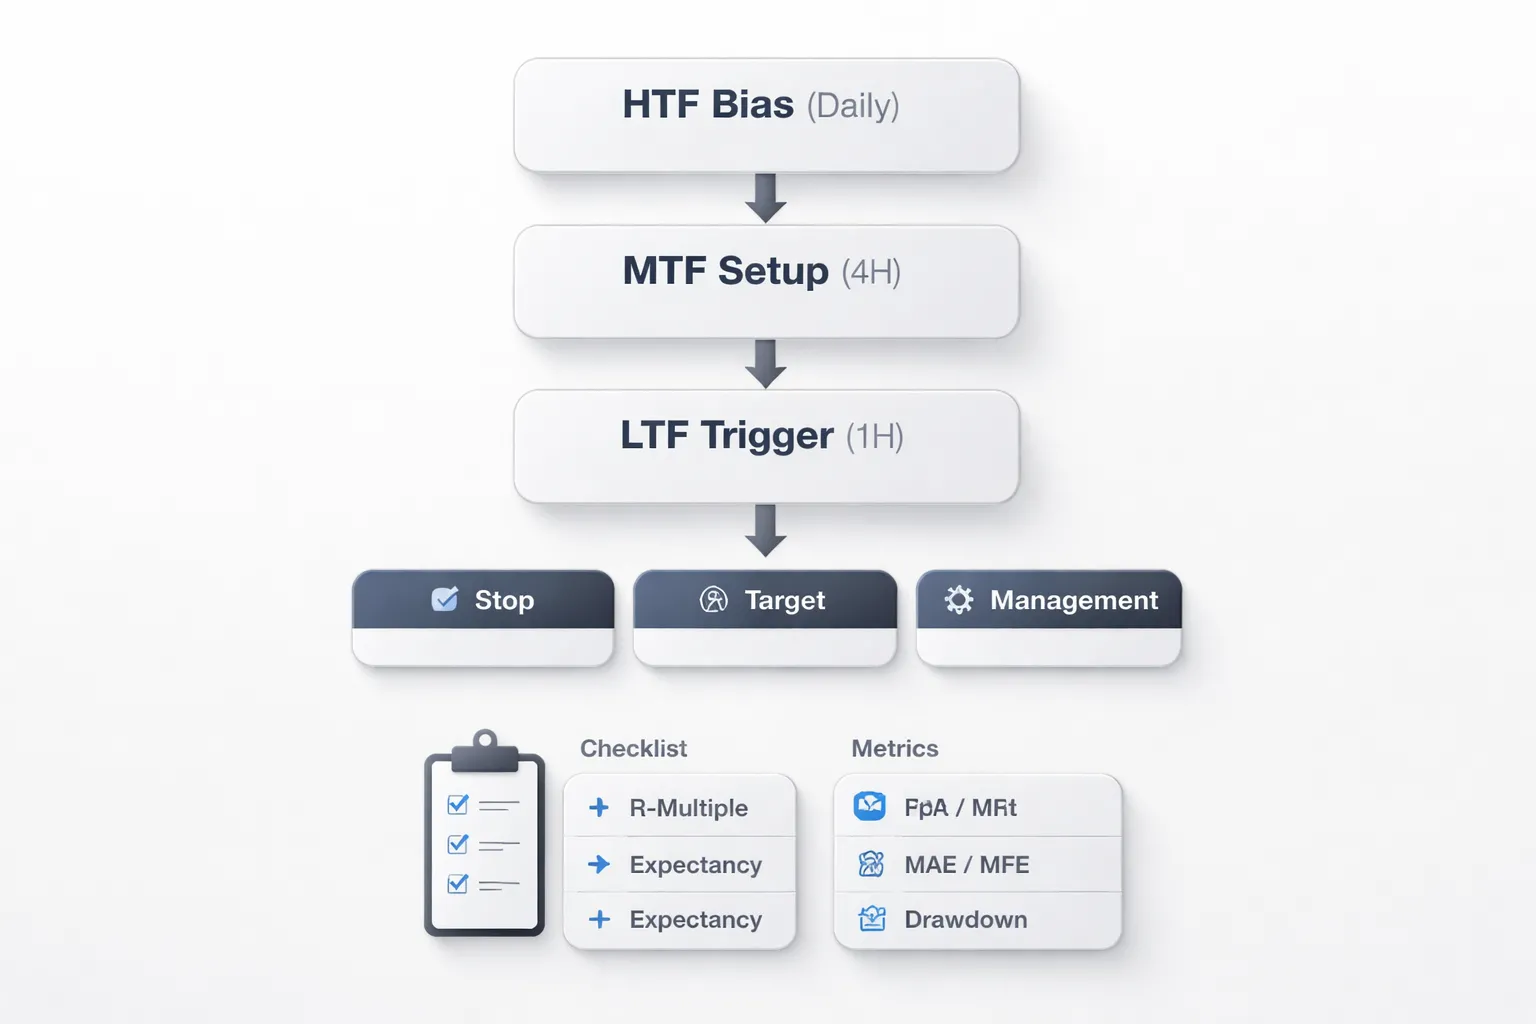
Creating a one-page ruleset, bias to management
You need one plan you can execute the same way each week. Keep it on one page. Make each rule binary, yes or no.
- Timeframe stack: Pick three charts. Example, 1D for bias, 4H for setup, 1H for trigger. Do not add more.
- Bias rule (HTF): Define trend with one method. Example, “Only buy when 1D makes higher highs and higher lows, and price holds above the last 1D swing low.”
- Setup rule (MTF): Define the condition that must exist before you hunt entries. Example, “On 4H, price pulls back into a prior 4H level, and prints a clear rejection close.”
- Trigger rule (LTF): Define the entry signal and the exact candle close you require. Example, “On 1H, enter on close above the trigger level after the 4H setup exists.”
- Stop rule: Place stops where your idea is invalid, not where pain feels smaller. Example, “Stop goes 2 to 5 pips beyond the 1H swing that defines the trigger.”
- Target rule: Predefine primary and secondary exits. Use fixed R-multiples or HTF levels, then stick to it. If you need a framework, use this guide on take profit levels and targets.
- Management rule: Pick one model. Example, “Take 50 percent at 1R, move stop to break-even only after a 1H close beyond level, then trail below 1H swings.”
- Timeframe lock: Write it as a hard constraint. Example, “After entry, no chart below 1H. No timeframe change unless 1D bias breaks or target hits.”
Backtesting and forward-testing by timeframe stack
Test the stack as a single system. Do not mix a 1D bias rule with random 15m triggers and call it the same strategy.
- Sample size: Aim for at least 100 trades per stack and pair group. If you cannot reach that, widen the date range, not the rules.
- What to log per trade: HTF bias state, setup type, trigger candle, stop distance in pips, risk in R, target method, session, news filter, and whether you followed the timeframe lock.
- Measure by layer:
- Bias quality (1D): Win rate and expectancy when bias agrees, versus when bias is neutral. If neutral performs poorly, block those trades.
- Setup quality (4H): Frequency of valid setups per week, and percent that reach 1R before stopping. If too few setups occur, your rules are too tight.
- Trigger quality (1H): Slippage sensitivity and stop-out rate by stop placement type. If stop-outs cluster, your trigger is early or your stop is inside noise.
- Forward-test rules: Run the same plan on a demo or micro size for 20 to 30 trades. Track execution errors as a separate category. Do not change rules mid-batch.
Performance tracking metrics that matter
Track metrics in R so position size does not hide performance. One spreadsheet is enough.
- Segment your stats: By pair, session, and setup type. Do not average everything and assume it will hold.
- Track rule breaks: Log each one. Measure the R impact. If rule breaks cost real R, you have proof, not a feeling.
Psychology and discipline, reduce FOMO with pre-defined conditions
FOMO grows when your plan leaves gaps. Close the gaps with conditions that block action.
- Trade window: Define when you can enter. Example, “Only take new trades in London and early New York.”
- One-trigger rule: If the 1H trigger closes and you miss it, you skip. No chasing on lower timeframes.
- Cooldown rule: After a loss, wait for the next 4H setup. After two losses in a day, stop.
- Checklist before entry: Bias aligned, setup valid, trigger confirmed, stop placed, target mapped, risk set, timeframe lock accepted. If any item fails, no trade.
- Define “no trade” states: Example, “If 1D is ranging and 4H levels overlap, stand down.” This removes the need to decide in the moment.
- Pre-commit your management: Write the exact actions at 1R, at target, and at invalidation. You should not improvise while in drawdown.
Frequently Asked Questions
How many timeframes should you use?
Use three. One for trend, one for setup, one for entry and management. Example, 1D trend, 4H setup, 1H entry. More timeframes add conflict and slow decisions. Fewer timeframes hide context.
What is the best timeframe combo for day trading?
Use 1D for bias, 4H for key levels, 1H for triggers. If you trade faster, shift down to 4H, 1H, 15M. Keep the ratio consistent. Your entry timeframe should be 4 to 6 times smaller than your setup chart.
What is the best timeframe combo for swing trading?
Use 1W for trend, 1D for structure, 4H for entry. Hold periods increase. Stops increase. Position size must drop. Your plan stays the same, trend first, then level, then trigger.
How do you define trend on the higher timeframe?
Use structure. Higher highs and higher lows means uptrend. Lower highs and lower lows means downtrend. If swing points overlap and price chops, mark it as range. Do not force a bias.
What if the higher timeframe and entry timeframe disagree?
Stand down or trade smaller with strict rules. Do not override the higher timeframe. Wait for alignment. If 1D ranges, treat all lower timeframe breakouts as suspect until price clears the range high or low.
How do you avoid analysis paralysis with MTFA?
Lock your stack and your checklist. Use the same three charts every session. Define “no trade” states in writing. Decide your trigger, stop, and target before entry. If any item fails, you skip.
Where should your stop loss go in multi-timeframe trading?
Place the stop where the setup breaks, not where pain feels small. Use the setup timeframe invalidation level. Then size the trade to your fixed risk. Do not widen the stop after entry.
How do you set targets across timeframes?
Use the next higher timeframe level as the first target. Map it before you enter. If you enter on 1H, target 4H levels first, then 1D levels. Trail only after structure prints in your favor.
Should you wait for candle close confirmation?
Yes, on your trigger timeframe. Intrabar signals fail more. Candle close reduces noise and forces discipline. If you need earlier entries, drop one timeframe and keep close confirmation on that lower chart.
Does MTFA work with indicators like RSI?
Yes, but keep one job per timeframe. Use higher timeframe RSI for bias, lower timeframe RSI for trigger timing. Do not stack indicators. If you need a base process, start with price action basics.
What is a simple MTFA checklist?
- Trend: Higher timeframe structure aligned.
- Level: Setup timeframe at a clean zone.
- Trigger: Entry timeframe prints your pattern at the zone.
- Risk: Stop at invalidation, size set, R-multiple planned.
- No trade: Ranging HTF, overlapping levels, news risk.
Conclusion
Conclusion
Multi-timeframe analysis keeps you out of random trades. You start with the higher timeframe, then you drill down. You trade when structure, level, and trigger line up. You pass when they do not.
Keep your stack simple. One bias timeframe. One setup timeframe. One entry timeframe. If you add more charts, you add more conflict.
- Higher timeframe: define direction and key swing levels.
- Setup timeframe: mark the clean zone where you want price to react.
- Entry timeframe: wait for your trigger at that zone, then place the trade.
Your edge comes from consistency. Use the same timeframes, the same trigger, and the same stop rule every trade. Track results in R, not pips. If you need a refresher on structuring trades around R, read risk-reward ratio.
Final tip. Write your bias and invalidation before you drop to the entry chart. If you cannot state both in one sentence, you do not have a trade.
-
Stop Loss vs Take Profit: Differences, Examples & Best Practices
6 months ago -
Forex Trading Psychology Tips: How to Stay Disciplined and Consistent
6 months ago -
Forex Order Types Explained: Market vs Limit vs Stop Orders
6 months ago -
How to Set Stop Loss and Take Profit (Step-by-Step)
6 months ago -
How to Start Forex Trading Step by Step (Beginner Roadmap)
6 months ago
-
- Cherry-picking the timeframe that agrees with your bias
- Overcomplicating with too many indicators and contradictory rules
- Entering on the trigger timeframe without HTF invalidation clarity
- Ignoring liquidity and session timing (London and New York overlaps)
- Changing timeframes mid-trade and breaking your plan
-
- How many timeframes should you use?
- What is the best timeframe combo for day trading?
- What is the best timeframe combo for swing trading?
- How do you define trend on the higher timeframe?
- What if the higher timeframe and entry timeframe disagree?
- How do you avoid analysis paralysis with MTFA?
- Where should your stop loss go in multi-timeframe trading?
- How do you set targets across timeframes?
- Should you wait for candle close confirmation?
- Does MTFA work with indicators like RSI?
- What is a simple MTFA checklist?
-
- Cherry-picking the timeframe that agrees with your bias
- Overcomplicating with too many indicators and contradictory rules
- Entering on the trigger timeframe without HTF invalidation clarity
- Ignoring liquidity and session timing (London and New York overlaps)
- Changing timeframes mid-trade and breaking your plan
-
- How many timeframes should you use?
- What is the best timeframe combo for day trading?
- What is the best timeframe combo for swing trading?
- How do you define trend on the higher timeframe?
- What if the higher timeframe and entry timeframe disagree?
- How do you avoid analysis paralysis with MTFA?
- Where should your stop loss go in multi-timeframe trading?
- How do you set targets across timeframes?
- Should you wait for candle close confirmation?
- Does MTFA work with indicators like RSI?
- What is a simple MTFA checklist?
-
How to Place a Forex Trade Step by Step (Your First Trade Explained)
4 months ago -
Forex Trading vs Crypto Trading: Which Market Is Better for Beginners?
4 months ago -
Forex Lot Size Calculator: How to Use It to Size Trades Correctly
6 months ago -
How to Calculate Position Size in Forex (Position Sizing Formula + Examples)
6 months ago -
Forex Leverage Explained: How It Works, Pros, Cons & Examples
6 months ago
-
Forex Trading Platforms Comparison: MetaTrader vs cTrader vs TradingView
6 months ago -
Stop Loss vs Take Profit: Differences, Examples & Best Practices
6 months ago -
Is Forex Trading Legal in the United States? Rules, Regulators & What to Know
6 months ago -
Forex Market Hours & Trading Sessions Explained (Best Times to Trade)
6 months ago -
Forex Leverage Explained: How It Works, Pros, Cons & Examples
6 months ago