MACD Indicator in Forex Explained: How It Works & How to Trade It

MACD helps you spot momentum shifts and trend direction on any forex pair. You get it for free on most trading platforms, but many traders use it wrong. They treat it like a signal machine and ignore context.
This guide breaks MACD down to what matters. You will learn what the MACD line, signal line, and histogram measure. You will learn how the indicator gets calculated from moving averages, and what that means for lag. You will learn the core trade setups, line crossovers, zero line crosses, and histogram changes. You will learn how to read MACD divergence, and when it fails. You will also learn how to combine MACD with price action, including key candlestick patterns, to plan entries, stops, and exits.
- In het kort: MACD measures momentum with moving averages, so it reacts after price moves.
- MACD has three parts, the MACD line, the signal line, and the histogram.
- Use line crossovers for momentum shifts. Confirm with structure, not the crossover alone.
- Use the zero line to filter trend. Above zero favors longs, below zero favors shorts.
- Use histogram expansion as strength, contraction as weakening momentum. Treat it as an early warning, not a trigger.
- Divergence can flag exhaustion. It fails most in strong trends and during news driven moves.
- Plan trades from price first. Use MACD to time entries and manage exits.
- Set stops beyond recent swing points. Do not place stops on MACD signals.
- Keep one rule set and one timeframe combo. Avoid switching settings to fit past moves.
- Combine MACD with clean levels and breaks, especially in a breakout trading strategy.
What the MACD Indicator Is (Forex Definition in Plain English)
Why momentum matters in currency pairs, and why MACD is popular in FX
Forex trends can run far and reverse fast. You need a way to track momentum, the rate of change in price.
MACD helps you see when momentum speeds up, slows down, or flips direction. It does this without forcing you to guess a “fair value” price. It stays focused on what price does now.
Traders use MACD in FX because it fits how currency pairs move.
- Pairs often trend in waves. MACD highlights the push and the fade inside those waves.
- FX trades 24 hours. MACD works on any session and any liquid pair.
- It is simple to standardize. One set of inputs can cover many markets.
Who created MACD and how it evolved into a mainstream indicator
Gerald Appel created the MACD in the late 1970s. He built it for stocks, but the logic transfers well to forex because it measures momentum, not fundamentals.
Later, traders added the signal line and the histogram. Platforms then packaged MACD as a default indicator. That made it mainstream.
- MACD line tracks the gap between two moving averages.
- Signal line smooths the MACD line to reduce noise.
- Histogram shows the distance between MACD and the signal line, so you can spot momentum shifts faster.
MACD vs moving averages, what MACD adds beyond a simple MA crossover
A basic moving average crossover gives you a binary event, one line crosses another. It often comes late, especially after a fast move.
MACD still uses moving averages, but it adds two practical upgrades.
- It measures distance. MACD tells you how far the fast average pulls away from the slow average. That distance is momentum.
- It measures change in distance. The histogram shows when momentum grows or fades before a crossover happens.
In plain English, MACD is a momentum gauge built from moving averages. You use it to time entries, avoid chasing late moves, and manage exits. You still place orders from your price plan, using the right order type for the setup and stop location. See this guide on market, limit, and stop orders.
MACD Components Explained: Line, Signal, and Histogram
MACD Line, What It Measures
The MACD line is the difference between two exponential moving averages, usually the 12 EMA minus the 26 EMA. It tracks momentum, not price level.
- Rising MACD values mean bullish momentum increases. The fast EMA pulls away from the slow EMA.
- Falling MACD values mean bearish momentum increases. The fast EMA drops below the slow EMA by more.
- MACD flattening signals momentum stalls. You often see this before price ranges or pulls back.
Focus on the slope and the rate of change. A steep climb or drop shows strong momentum. A shallow move shows weak follow-through.
Signal Line, The Smoother
The signal line is an EMA of the MACD line, usually a 9 EMA. It smooths the MACD line so you can see shifts in momentum with less noise.
- MACD above signal shows bullish momentum leads. Crossovers can mark a momentum turn.
- MACD below signal shows bearish momentum leads. Crossovers can mark a momentum turn.
- Wider separation means stronger momentum. Tight separation means momentum fades.
Treat the signal line as a filter. It helps you avoid reacting to every small wiggle in the MACD line.
Histogram, Momentum at a Glance
The histogram plots the distance between the MACD line and the signal line. It shows acceleration and deceleration of momentum fast.
- Bars growing above zero show bullish momentum accelerates.
- Bars shrinking above zero show bullish momentum decelerates. This often happens before a bearish crossover.
- Bars growing below zero show bearish momentum accelerates.
- Bars shrinking below zero show bearish momentum decelerates. This often happens before a bullish crossover.
Use the histogram for early warning. When bars start shrinking, momentum loses strength. You can tighten risk, scale out, or wait for price confirmation.
Zero Line, Trend Bias Filter
The zero line marks where the two EMAs are equal. It acts as a quick trend bias check.
- MACD above zero means the 12 EMA sits above the 26 EMA. Your bias leans bullish.
- MACD below zero means the 12 EMA sits below the 26 EMA. Your bias leans bearish.
- Crossing zero signals a shift in medium-term momentum. It often lags price, so use it to filter, not to chase.
If you trade breakouts, the zero line helps you filter direction and avoid low-quality signals. Pair it with a clean ruleset like this breakout trading strategy.
How MACD Is Calculated (So You Know What You’re Trading)
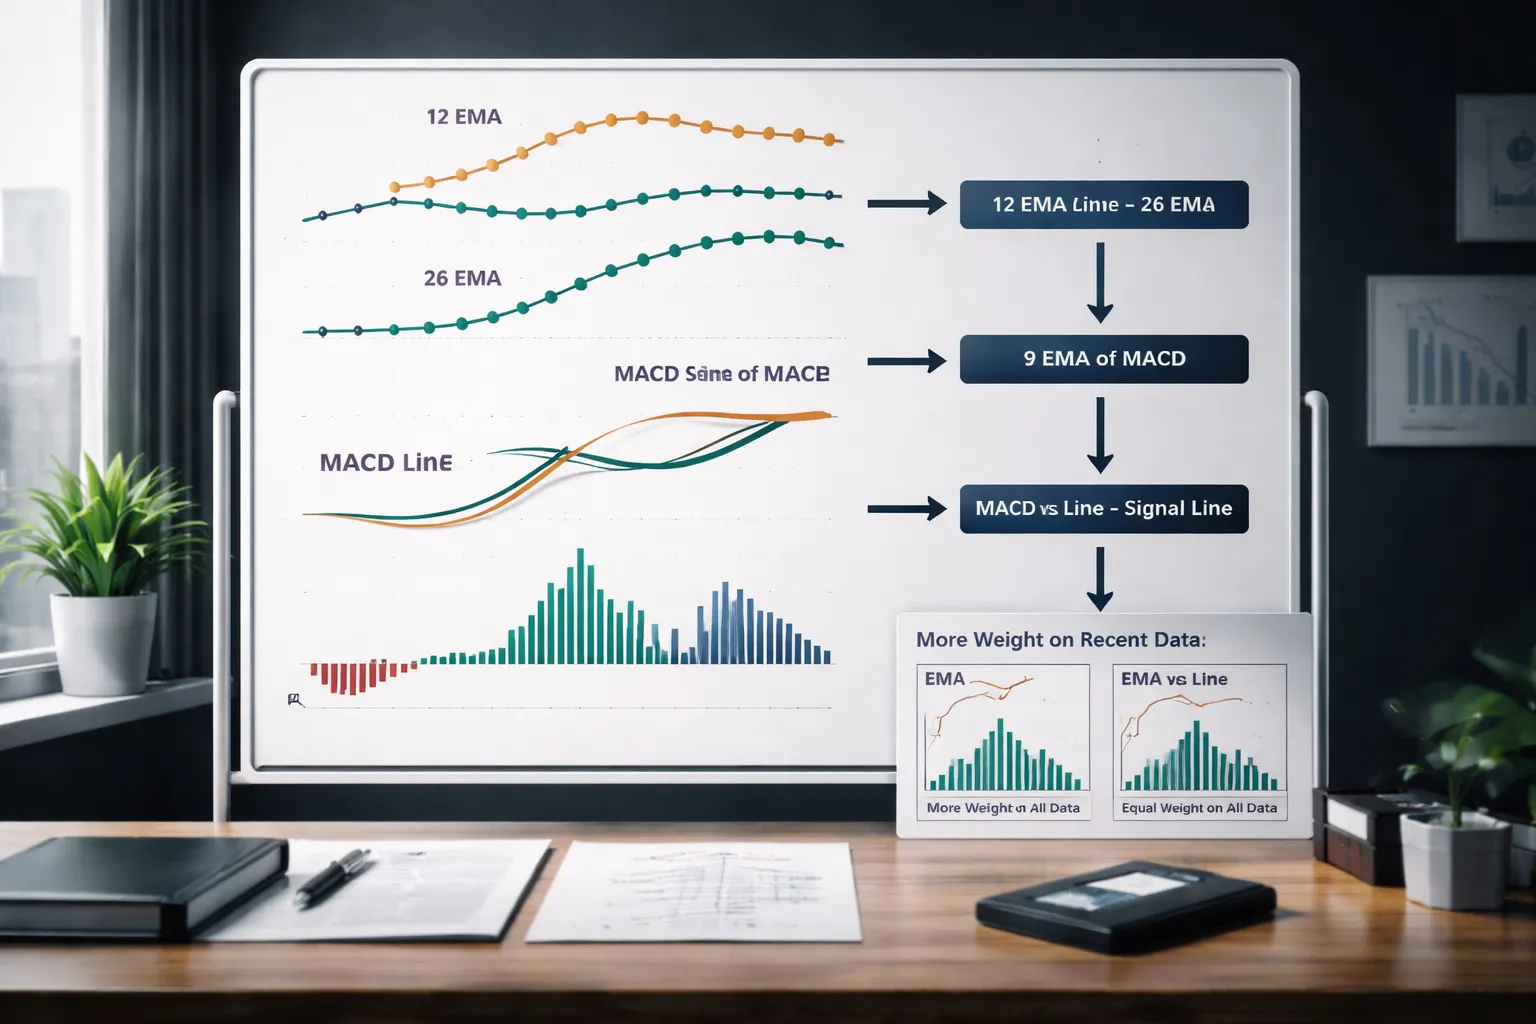
EMA basics, why it reacts faster than an SMA
An EMA tracks the same idea as an SMA, it averages price. The difference is weighting.
An SMA gives each bar equal weight. An EMA gives the newest bars more weight. That makes an EMA turn sooner when momentum shifts.
This matters for MACD because MACD measures the gap between two moving averages. Faster averages change that gap sooner. You get earlier shifts, but you also get more noise when the market chops.
Core MACD formula breakdown
MACD uses three lines.
- MACD line, 12 EMA minus 26 EMA.
- Signal line, 9 EMA of the MACD line.
- Histogram, MACD line minus signal line.
The MACD line shows the spread between short-term and medium-term momentum.
The signal line smooths that spread. Crosses happen when the spread changes fast enough to beat its own average.
The histogram shows the rate of change in that spread. Bigger bars mean momentum increases. Smaller bars mean momentum fades, even if price still trends.
| Component | Default setting | What it measures |
|---|---|---|
| MACD line | 12 EMA minus 26 EMA | Momentum spread between two EMAs |
| Signal line | 9 EMA of MACD | Smoothed momentum spread |
| Histogram | MACD minus Signal | Change in momentum spread |
What changes when you adjust parameters
Settings control sensitivity versus reliability.
- Shorter EMAs, like 8 and 17, react faster. You get earlier crosses. You also get more false signals in ranges.
- Longer EMAs, like 20 and 50, react slower. You get fewer crosses. You also miss more of the early move.
- A shorter signal EMA, like 5, makes the signal line track MACD tighter. Crosses increase. Whipsaws increase.
- A longer signal EMA, like 13, filters noise better. Crosses decrease. Lag increases.
Match settings to your holding time. If you trade fast charts, you need tighter risk control and strict exits. Use a defined stop and target plan, see stop loss vs take profit.
Why calculation details matter in Forex sessions and volatility regimes
MACD responds to the volatility you feed it. Forex volatility shifts by session.
- During Asia, many pairs compress. MACD lines flatten. Crosses cluster. You get more low-quality signals.
- During London and London to New York overlap, range expansion increases. MACD spreads widen. Histogram bars grow. Trend signals hold longer.
- During news spikes, EMAs chase price. MACD can flip fast, then snap back. Treat first crosses after a spike with caution.
The same settings behave differently across pairs. GBP pairs often print wider swings than EURUSD. Wider swings push MACD farther from zero, then pull it back harder. That changes how often you see crosses and how long they last.
Use MACD as a momentum filter. In low volatility, demand extra confirmation. In high volatility, expect more follow-through but manage slippage and stops tighter.
How to Read MACD on a Forex Chart Step by Step
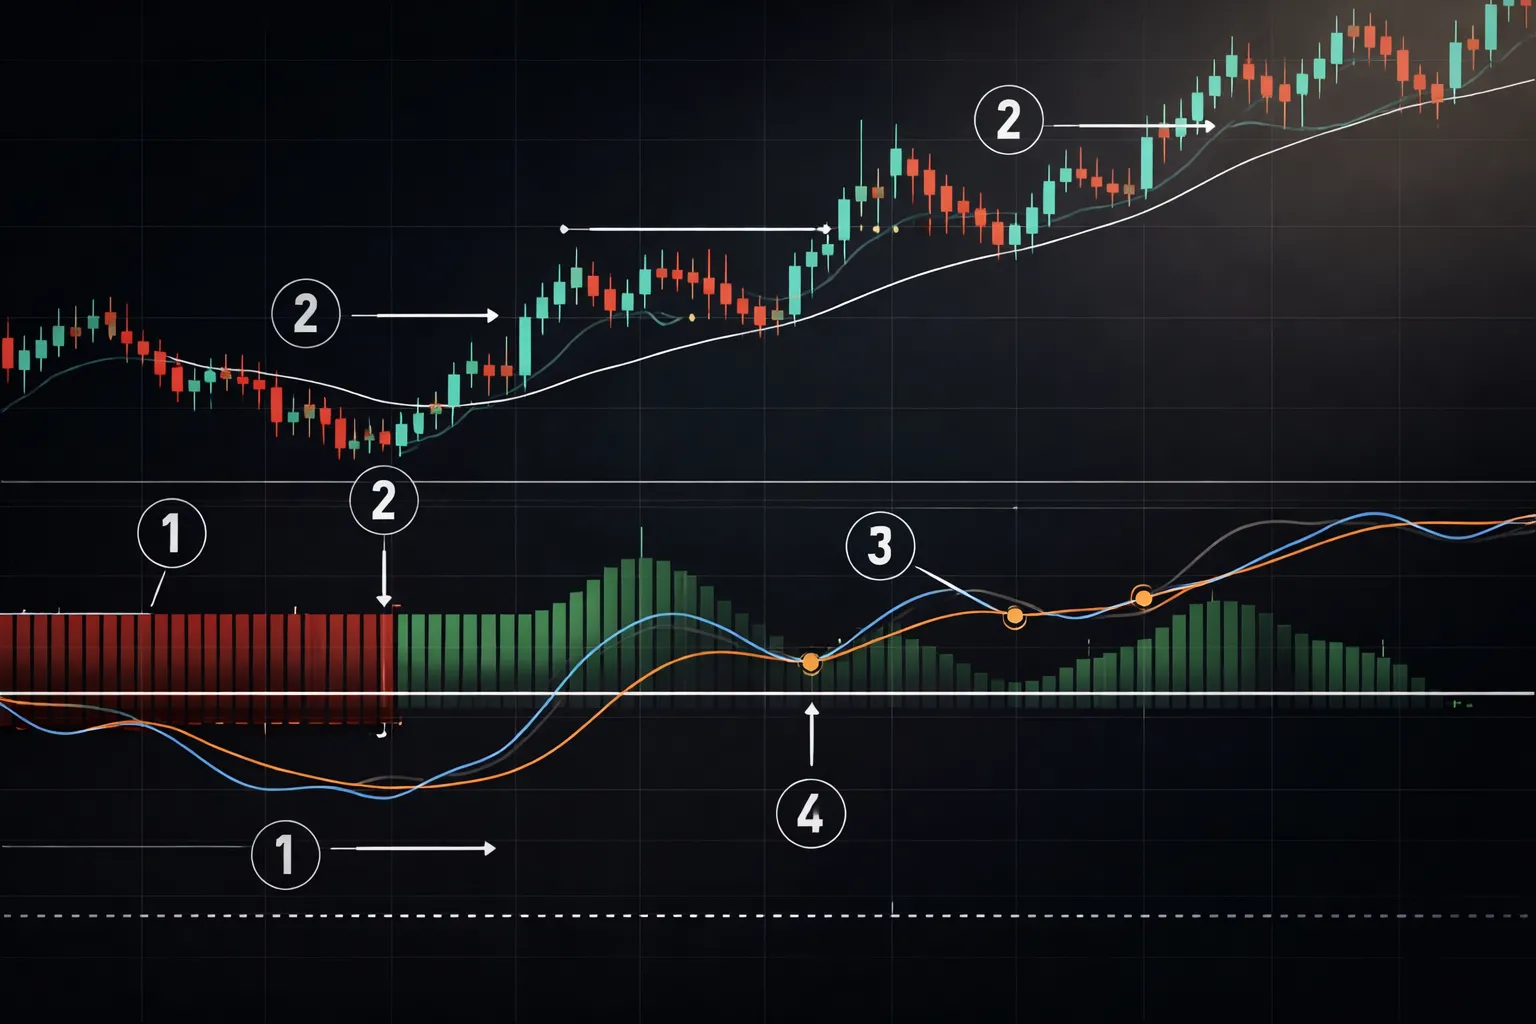
Identifying momentum shifts using histogram slope changes
The histogram measures the gap between the MACD line and the signal line. Read it as momentum speed, not direction by itself.
- Step 1: Find the histogram bars. Note if they sit above or below zero.
- Step 2: Watch the slope. Bars growing taller show momentum building. Bars shrinking show momentum fading.
- Step 3: Mark the first bar that prints smaller after a run of larger bars. That often signals a momentum shift before a line cross.
- Step 4: Compare the change to recent volatility. If the last 20 to 50 bars show small histogram ranges, treat small slope changes as noise.
- Step 5: Use price context. A shrinking histogram into a known resistance zone often matters more than the same signal in open space.
Fast read. Rising histogram while price rises supports continuation. Falling histogram while price rises warns of weakening upside drive. Reverse the logic for down moves.
Spotting trend bias with the zero-line position
The zero line is your bias filter. It tells you which side has the structural edge on that timeframe.
- MACD above zero: Your default bias stays bullish. Favor longs. Treat short signals as countertrend.
- MACD below zero: Your default bias stays bearish. Favor shorts. Treat long signals as countertrend.
- Crossing the zero line: Momentum often shifts from pullback mode to trend mode. It can lag after a strong price move, so you still need a price-based level.
Practical rule. In trends, take signals in the direction of the zero-line bias. In ranges, expect frequent flips and lower follow-through.
Separating early signals from late signals (common misreads to avoid)
- Misread 1: You buy every bullish line cross. In strong downtrends, bullish crosses below zero often fail. You need the zero-line filter.
- Misread 2: You treat the first shrinking histogram bar as a reversal. It often signals a pause, not a turn. Wait for price to break a minor swing high or low, or for a clear line cross.
- Misread 3: You ignore distance from zero. A cross far from zero can arrive late after an extended move. Your stop often has to be wider, which can break your trade math.
- Misread 4: You trade every cross in low volatility. Tight ranges produce rapid flips. Demand a level break, a session expansion, or a higher timeframe alignment.
- Misread 5: You compare MACD values across pairs. Raw MACD magnitude changes with volatility. Compare the current reading to that pair’s own recent history.
Use MACD to time entries inside a plan. Do not use it as a standalone trigger.
Practical chart-reading checklist for beginners
- 1: Pick your timeframe. Start with H1 to H4 for cleaner signals.
- 2: Identify market state. Trend or range. Use simple structure, higher highs and higher lows, or lower highs and lower lows.
- 3: Check zero-line bias. Above zero, look for longs. Below zero, look for shorts.
- 4: Read the histogram slope. Growing supports continuation. Shrinking warns of momentum loss.
- 5: Wait for confirmation. A line cross plus a break of a recent swing point beats a cross alone.
- 6: Define your invalidation level first. Put the stop where the setup fails, not where it feels small. Use your risk rules and position size. See stop loss vs take profit if you need a clean framework.
- 7: Check the next barrier. Mark the nearest support or resistance. If it sits too close, skip the trade.
- 8: Log the outcome. Track pair, session, volatility, and whether the signal came above or below zero. You will see patterns fast.
Core MACD Trading Signals for Forex (With Clear Rules)
Signal-Line Crossover Entries (Clear Rule Set)
This is the core MACD trigger. You trade the MACD line crossing the signal line.
- Bullish entry, MACD line crosses above the signal line and the candle closes.
- Bearish entry, MACD line crosses below the signal line and the candle closes.
- Filter, take longs only when price sits above your chosen trend filter, take shorts only when price sits below it.
- Execution, use a market order on the close, or a limit pullback order if you have a defined level. If you need a refresher, see market vs limit vs stop orders.
- Stop, beyond the swing that invalidates the setup, not a fixed pip number.
- Skip, if the crossover happens inside tight chop, near a major barrier, or after an extended one way run.
Best use cases, liquid sessions, clear swings, and mild to strong trends. Worst use cases, low volatility ranges and news spikes.
Zero-Line Crossover Entries (Trend Confirmation Over Early Entry)
The zero line tells you which side has control. This entry trades the shift from bearish to bullish momentum, or the reverse.
- Bullish entry, MACD crosses from below zero to above zero, candle closes.
- Bearish entry, MACD crosses from above zero to below zero, candle closes.
- Filter, require price to break structure in the same direction, higher high for longs, lower low for shorts.
- Skip, if the zero cross occurs with price stuck inside a well defined range.
This signal triggers later than a signal-line cross. You give up early entry to cut down whipsaws. Use it when you care more about confirmation than catching the first leg.
Histogram Tick Signals (Time Entries With Momentum Turns)
The histogram measures the gap between MACD and the signal line. A tick turn gives you a timing cue inside a trend.
- Bullish tick, histogram bars stop falling and start rising, one bar higher than the prior bar, after a pullback.
- Bearish tick, histogram bars stop rising and start falling, one bar lower than the prior bar, after a pullback.
- Best context, trade in the direction of the higher time frame trend, use the tick to enter after price resets.
- Hard rule, do not take a tick against the dominant trend unless you also have a structure break.
Histogram ticks fire often. Treat them as timing tools, not as standalone trend calls.
Exit Logic Using MACD (Rules You Can Backtest)
You need exits that match what MACD measures, momentum. Use one primary exit and one safety exit.
- Momentum fade exit, exit part or all when the histogram peaks and starts to shrink for 2 to 3 bars, while price fails to make progress.
- Opposite crossover exit, exit when MACD crosses back over the signal line against your position on a candle close.
- Zero-line warning, if you are long and MACD drops back below zero, treat it as a trend failure signal. If you are short and MACD rises back above zero, same logic.
- Structure-based exit, place your target at the next support or resistance, or exit when price prints a clear reversal swing against you.
- Time stop, if MACD stays flat and price goes nowhere for a set number of candles, exit and redeploy risk elsewhere.
| Signal type | What it is best for | Main risk | Best filter |
|---|---|---|---|
| Signal-line cross | Early entries in trends and swings | Chop whipsaws | Trade with trend, avoid nearby barriers |
| Zero-line cross | Trend confirmation | Late entries, worse R:R | Require structure break in same direction |
| Histogram tick | Timing pullback entries | Too many signals | Only take in dominant trend direction |
MACD Strategies for Different Forex Market Conditions
Trending markets, align with the higher timeframe
MACD works best when price trends and pulls back. Your job is to avoid countertrend signals.
- Step 1, define the bias. Use a higher timeframe, one to two levels above your entry chart. If the swing structure points up, you only take longs.
- Step 2, wait for a pullback. Let price retrace into a prior swing zone or a broken level. MACD often compresses toward the zero line during the pullback.
- Step 3, trigger with momentum returning. In an uptrend, you want MACD histogram to turn up again after printing smaller negative bars, or MACD line to cross up through the signal line while price holds the pullback zone.
- Step 4, place the stop where the trend breaks. Put it beyond the pullback low for longs, or beyond the pullback high for shorts. If that level breaks, the setup is invalid.
- Step 5, target structure. Aim for the prior swing high in an uptrend, or swing low in a downtrend. Trail only after price clears the swing.
If you keep getting chopped, you traded MACD crossovers inside a correction. Treat crossovers as a trigger, not a trend filter. For cleaner entries, use a pullback trading approach and let MACD confirm momentum, see pullback trading entries.
Range-bound markets, filter whipsaws and trade mean reversion
Ranges produce frequent MACD signals. Most fail. You need context and tighter rules.
- Trade location first. Only act near range boundaries. Skip signals in the middle of the range.
- Use the zero line as a filter. In a range, MACD hovering around zero means no edge. Favor trades where MACD pushes away from zero at the boundary, then turns back.
- Combine with range structure. Buy at support when price rejects the level and the histogram starts printing higher bars. Sell at resistance when price rejects and the histogram starts printing lower bars.
- Keep targets small. First target is the range midpoint or the next internal swing. Full target is the opposite boundary only if volatility supports it.
- Use hard invalidation. Stop goes beyond the range boundary. If price breaks and holds outside, you exit. Do not “average” a failed range trade.
In ranges, MACD divergence can help, but treat it as secondary. Your main edge is the boundary and the rejection. MACD only times the entry.
High-volatility events (news), know when to avoid MACD signals
News spikes distort MACD. The indicator lags while spread and slippage rise. You can get perfect-looking crosses that mean nothing.
- Avoid trading the release window. Skip new MACD trades before and after major scheduled events. Your exact window depends on the pair and broker conditions, but you need price to normalize.
- Do not use MACD crossovers as breakout confirmation. The move often happens before MACD reacts. You enter late and pay the worst price.
- Watch the histogram “snap back.” A large impulse bar can force extreme histogram readings. The next bars often mean-revert. That reversal can stop you out if you chase.
- If you must trade, reduce exposure. Lower size, wider stops, fewer positions. Plan for gaps and slippage.
Session-based behavior, adjust to liquidity and tempo
MACD signals change quality with liquidity. Sessions change volatility, spread, and follow-through.
- London and New York overlap. You get the cleanest follow-through on trends and breakouts. MACD works better for continuation setups because momentum sustains. You can use faster triggers on lower timeframes, but keep the higher-timeframe bias.
- London open impulse. Early moves can fake out. Wait for the first push, then the first pullback. Let MACD reset toward zero, then take the continuation trigger.
- New York afternoon. Liquidity can drop and ranges form. MACD crossovers increase and quality drops. Tighten filters and trade fewer signals.
- Asia session. Many pairs drift and range. MACD produces whipsaws around zero. Focus on boundary trades, or step aside until liquidity returns.
Best Timeframes and Settings for MACD in Forex
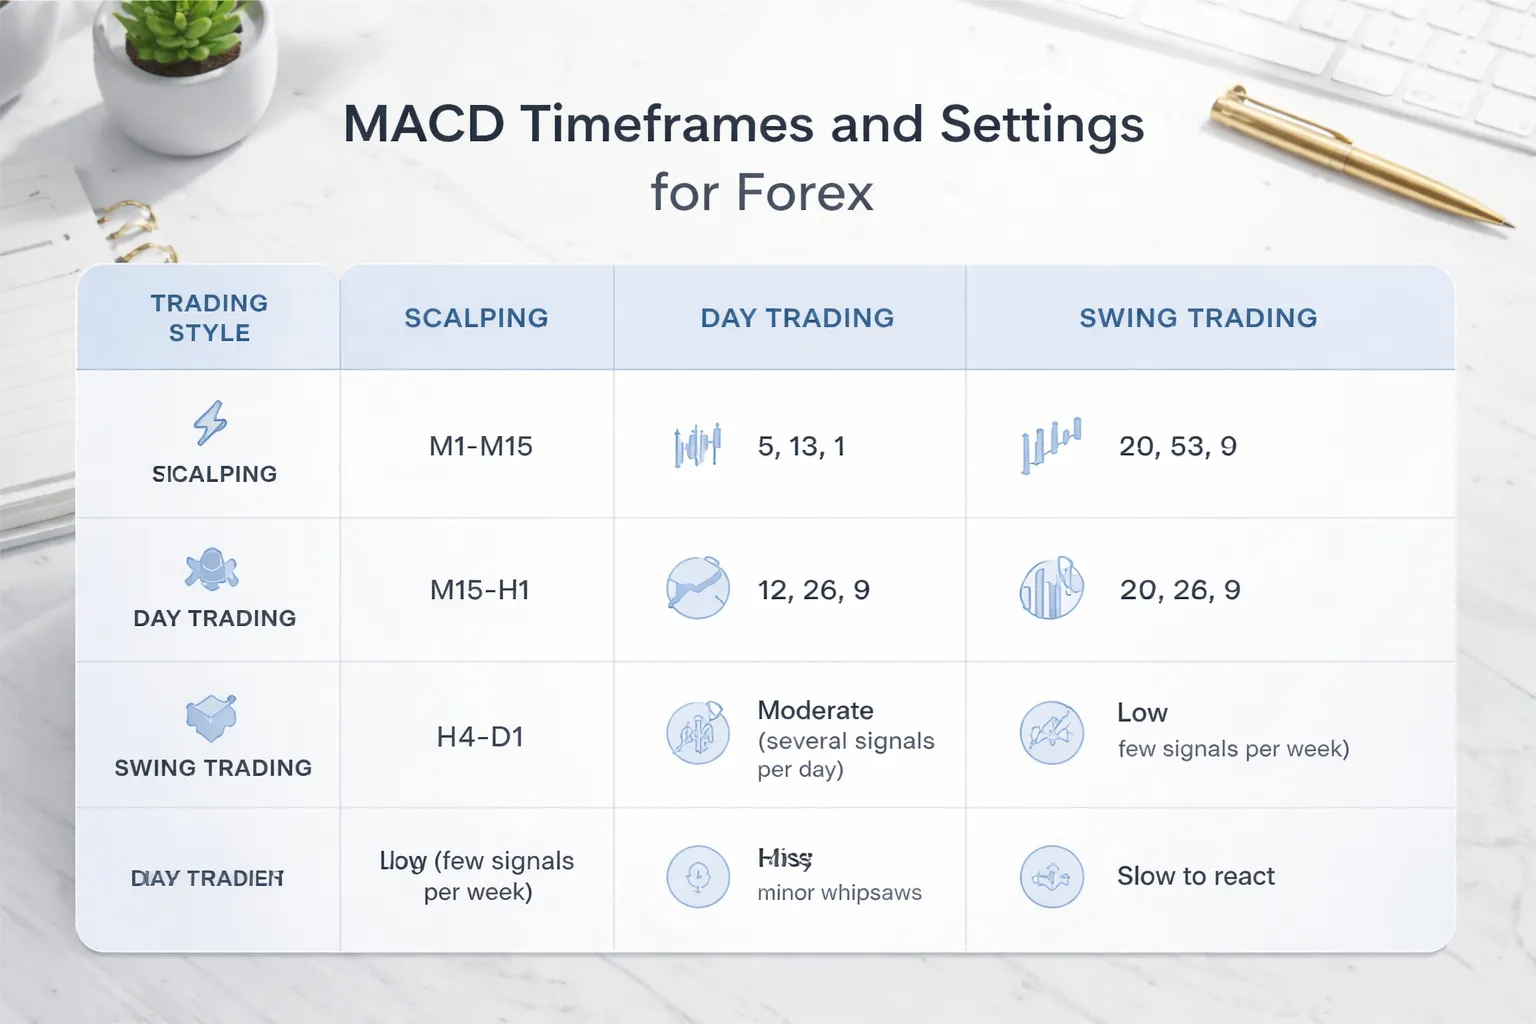
Common Default Settings (12-26-9), Why Traders Use Them
Most platforms default to 12, 26, and 9. Traders keep it because it is stable across many pairs and timeframes. It balances speed and noise.
- 12 EMA reacts fast enough to catch momentum shifts.
- 26 EMA anchors the move and reduces false flips.
- 9 signal smooths the MACD line so you get fewer, cleaner crossovers.
Use 12-26-9 when you want a baseline. Change settings only after you test them. Most “better” settings just curve fit recent price action.
Best Timeframes for MACD in Forex
MACD works best when price trends and liquidity stays consistent. Your timeframe should match your holding time.
- Scalping, M1 to M15. Expect more crossovers, more noise, and more spread impact. Use MACD as a filter, not a trigger by itself.
- Day trading, M15 to H1. Signals slow down. Trend legs show clearer. You can combine MACD with structure and trendlines for cleaner entries. See how to draw trendlines.
- Swing trading, H4 to D1. MACD becomes a trend and momentum gauge. Crossovers come late, but they often align with larger swings.
Avoid forcing MACD to work in tight ranges. On lower timeframes, MACD hovers near zero and whipsaws. On higher timeframes, MACD lags, so you must accept wider stops and longer holds.
Scalping, Day Trading, Swing Trading, How to Adapt Settings
Changing MACD settings changes sensitivity. Faster settings give earlier signals but increase false positives. Slower settings reduce noise but lag more.
- Scalping, consider slightly faster settings like 8-21-5 or 10-20-7. Use stricter filters. Trade with the session trend. Ignore most zero line chop.
- Day trading, start with 12-26-9. If you need faster confirmation, adjust one step at a time, for example reduce the signal to 12-26-7. Keep the change small.
- Swing trading, consider slightly slower settings like 12-26-12 or 19-39-9. Use it to stay in trends longer and avoid early exits.
Do not optimize all three numbers at once. Change one input, test, then decide. If your settings only work on one pair and one month, you overfit.
Pair Selection, Why EUR/USD Differs From GBP/JPY
Pairs have different volatility and mean reversion behavior. That changes how MACD crossovers behave.
- EUR/USD often trends smoother during liquid sessions. MACD signals tend to be cleaner on M15 to H1, with fewer violent reversals.
- GBP/JPY swings harder and spikes more. MACD crossovers can flip fast, especially around news and session opens. You need wider stops, larger filters, or higher timeframes.
- USD/JPY can trend well but reacts sharply to rate headlines. MACD can lag after sudden repricing.
- Crosses like EUR/GBP can range for long periods. MACD stays near zero and produces low quality signals unless you trade range boundaries.
Match your settings to the pair’s typical movement. Higher volatility pairs usually need either a higher timeframe or stricter entry rules. Lower volatility pairs can tolerate faster settings, but spreads and session liquidity still matter.
A Simple Method to Validate Settings Without Overfitting
You need proof beyond a chart screenshot. Use forward testing with strict rules.
- Pick one pair, one timeframe, and one session window.
- Define entry and exit rules in one paragraph. Include spread assumptions and stop size rules.
- Choose two settings only, for example 12-26-9 vs 10-20-7.
- Trade both rules in demo or a replay tool for 30 to 50 trades each. Log every trade.
- Track win rate, average win, average loss, profit factor, and max drawdown.
- Keep the better set. Then run it live in small size for another 20 trades before you scale.
| Metric | What you want | What to watch |
|---|---|---|
| Profit factor | > 1.2 as a start | Falls apart outside one month |
| Max drawdown | Stable and tolerable | One losing streak wipes gains |
| Trade count | Enough samples | Settings “win” on 8 trades |
If you want a cleaner test, keep your market conditions consistent. Same session, same risk per trade, same news filters. That is how you learn if MACD settings help, or if you just got lucky.
MACD + Confluence: Indicators and Price Action That Improve Accuracy
Using Trend Filters to Trade With the Dominant Direction
MACD works best when you trade in the same direction as the higher time frame trend. Add one simple filter. Keep it consistent across tests.
- 200 EMA filter: Only take MACD buys when price holds above the 200 EMA. Only take MACD sells when price holds below it.
- Market structure filter: Only buy after price prints higher highs and higher lows. Only sell after lower highs and lower lows.
- Execution rule: Use your filter on a higher time frame, then take MACD signals on your trading time frame. Do not mix signals across time frames without rules.
This cuts trades. It can also cut drawdown. Your goal is fewer low quality signals, not more trades.
For trend based entries that avoid chasing, use a pullback trading approach and let MACD act as the trigger.
Support and Resistance Mapping for Cleaner Entries and Exits
MACD tells you momentum. It does not tell you where price will react. Map levels first, then use MACD to time the decision.
- Mark higher time frame levels: Prior day high and low, weekly high and low, obvious swing highs and lows, range boundaries.
- Entry filter: Take MACD signals only if price sits near a level you can define. Skip signals in the middle of nowhere.
- Stop placement: Put your stop beyond the level that proves you wrong, not at an arbitrary pip count.
- Targets: Aim for the next level. If the next level sits too close, skip the trade.
When you test MACD setups, log where the signal happened. Signals at levels often behave differently than signals in open space.
Adding RSI or Stochastics for Timing, Without Indicator Overload
Use one oscillator with MACD. Give it one job. Timing. Do not stack three oscillators that measure the same thing.
- Trend continuation timing: In an uptrend, wait for RSI to pull back near 40 to 50, then take the MACD trigger back up. In a downtrend, watch RSI near 50 to 60, then take the MACD trigger back down.
- Range timing: If price sits inside a clear range, use RSI 30 to 70 or Stochastics extremes to avoid taking MACD signals into the middle of the box.
- Hard rule: If MACD and your oscillator disagree, you skip. No exceptions. This keeps your sample clean.
Measure results with and without the extra filter. If it raises win rate but kills average R multiple, you did not improve the system.
Volume and Volatility Tools (ATR) for Better Stops and Targets
MACD gives you direction and timing. ATR helps you size the stop and target to current volatility. That reduces random stop outs in fast sessions and oversized stops in quiet sessions.
- ATR stop: Set stop distance using a multiple of ATR, then place it beyond structure. Example, 1.0 to 1.5 ATR beyond the swing point.
- ATR target: Use the next resistance or support level first. If the level is far, you can cap the target at a set ATR multiple so you keep exits consistent.
- Trade filter: If ATR is very low, expect chop. MACD will flip more. Reduce size or skip.
| Confluence tool | What it fixes | Simple rule to test |
|---|---|---|
| 200 EMA or structure | Bad countertrend MACD signals | Only trade in the trend direction |
| Support and resistance | Random entries and exits | Only take signals at mapped levels |
| RSI or Stochastics | Poor timing in ranges or pullbacks | Require agreement or skip |
| ATR | Stops and targets that ignore volatility | Stop and target based on ATR plus structure |
Keep confluence minimal. One trend filter, one level map, one timing tool, one volatility tool. Then test. Change one variable at a time.
Risk Management When Trading MACD in Forex
Stop-Loss Placement: Structure First, MACD Second
MACD gives signals. It does not set risk.
Place your stop where your trade idea breaks. Use price structure.
- Trend trade (buy): Put the stop below the most recent swing low that supports your entry.
- Trend trade (sell): Put the stop above the most recent swing high that caps your entry.
- Breakout trade: Put the stop beyond the broken level, outside the retest zone, not inside the noise.
- Range trade: Put the stop beyond the range boundary, past the wick zone.
Avoid indicator-based stops like “exit when MACD crosses back.” They fail in fast reversals and they widen losses in slow chops.
Then check volatility. If the structural stop sits inside normal daily movement, you will get clipped often.
Use ATR as a reality check and as a buffer, but keep structure as the anchor. See ATR stop loss using volatility for the sizing logic.
Position Sizing in Forex: Risk Per Trade Model
Pick a fixed risk per trade. Keep it small. Keep it consistent.
- Set account risk at 0.25% to 1.0% per trade.
- Measure stop distance in pips from entry to invalidation.
- Convert that pip risk into lot size. Your stop decides your size, not your confidence.
Use this workflow.
- Step 1: Account size times risk percent equals cash risk.
- Step 2: Cash risk divided by pip risk equals value per pip.
- Step 3: Value per pip converted to lots equals position size.
| Input | Example |
|---|---|
| Account size | $10,000 |
| Risk per trade | 0.5% |
| Cash risk | $50 |
| Stop size | 25 pips |
| Allowed $ per pip | $50 / 25 = $2 per pip |
If your stop must be wider, your size must drop. Do not “keep the same lot size” and hope MACD saves you.
Setting Targets: R-Multiples, Swing Points, Trailing
Define reward in R. One R equals your stop distance.
- Fixed R target: Take profit at 1R, 1.5R, 2R. Pick one and test it.
- Swing target: Target the next clear swing high or swing low, or the next mapped level.
- Hybrid: Take partial at 1R, then manage the rest with structure.
Trailing works best when the market trends. Use price, not MACD, for the trail.
- Swing trail: Move the stop behind each new swing in your direction.
- ATR trail: Trail at a fixed ATR distance, but only after price breaks away from your entry.
Avoid moving targets based on MACD “strength.” MACD can stay strong while price stalls at resistance.
MACD Mistakes That Increase Drawdowns, And Fixes
- Using MACD as a stop trigger. Fix: place the stop at invalidation, then size your trade to that stop.
- Trading every crossover. Fix: filter with one trend tool, then only take MACD signals that align.
- Ignoring nearby levels. Fix: map levels first. Skip signals into support or resistance.
- Stops inside normal volatility. Fix: check ATR. Add a buffer beyond structure so noise does not tag your stop.
- Wide stops with unchanged lot size. Fix: keep risk fixed. Wider stop means smaller size.
- Moving stops away. Fix: accept the loss. A moved stop breaks your math and spikes drawdown.
- Over-confluence stacking. Fix: one trend filter, one level map, one timing tool, one volatility tool. Then test.
Risk management makes MACD tradable. Without it, MACD becomes a signal generator that feeds drawdown.
MACD Pros, Cons, and Limitations (Honest Evaluation)
Strengths: Trend Clarity and Momentum in One View
- Clear trend bias. The MACD line relative to the signal line, and the zero line, gives you a quick read on trend direction. Above zero points to bullish pressure, below zero points to bearish pressure.
- Momentum visualization. The histogram shows acceleration and deceleration. Rising histogram bars support continuation. Shrinking bars warn that momentum fades, even if price still trends.
- Simple rule set. You can define entries, exits, and filters with objective conditions. That makes it easier to backtest and keep your trading plan consistent.
- Works best in clean trends. When price trends with higher highs or lower lows, MACD signals tend to align with follow-through. You get fewer mixed messages.
Weaknesses: Lag, Whipsaws, and Consolidation Traps
- It lags price. MACD uses moving averages. That means you often enter after the move starts and exit after the move weakens. Your edge must come from risk control and staying with the trend, not perfect timing.
- Whipsaws in ranges. In consolidation, price flips around the averages. MACD crossovers cluster and fail. Your win rate drops and your costs rise.
- False “early” reversals. Histogram contraction can signal momentum loss, but trends can pause and then continue. If you exit every time momentum dips, you cut your winners short.
- Parameter sensitivity. The default 12, 26, 9 settings do not fit every pair and timeframe. Small tweaks can change signals a lot. If you optimize, you can overfit fast.
MACD Myths: Why “Crossovers Always Work” Is a Trap
- Crossovers do not create an edge by themselves. A crossover just tells you two averages crossed. In a range, this happens often and means little.
- More signals does not mean more profit. Lower timeframes produce more crossovers and more noise. You pay more spread and slippage and you take more marginal trades.
- Divergence is not a timing tool. Divergence can appear early and persist while price keeps trending. If you trade divergence like a reversal trigger, you can short strong uptrends or buy strong downtrends too soon.
- “Zero line = safe trade” is wrong. Zero line context helps, but it does not replace structure, volatility, and risk rules. A trade can fail even with MACD above or below zero.
When to Consider Alternative Tools
- Use ADX when you need trend strength. MACD shows direction and momentum, but it does not grade trend quality cleanly. If you keep getting chopped up, add ADX as a filter and skip low-strength conditions.
- Use moving averages when you need cleaner trend rules. If MACD feels busy, a simple MA slope and price location rule can give you fewer, clearer decisions.
- Use price action only when you need structure first. If your losses come from trading inside compression, focus on levels, swings, and breakouts. Patterns and structure matter more than oscillator signals. Use price patterns to define when the market actually shifts.
- Trade ranges with range tools. If price respects support and resistance, treat it as a range. Oscillator crossovers will churn you. Use a range plan and take trades at the edges, not in the middle.
| Market Condition | MACD Fit | What to Do |
|---|---|---|
| Strong, directional trend | Good | Use MACD for trend bias and momentum confirmation, manage risk, let winners run. |
| Choppy consolidation | Poor | Reduce trading, demand a trend filter like ADX, or switch to range rules. |
| High volatility spikes | Mixed | Expect lag and slippage, size down, widen stops only if you cut position size. |
| Late-stage trend, momentum fading | Mixed | Use histogram contraction as a warning, tighten rules, avoid aggressive countertrend entries. |
Practical Examples: MACD Trade Plans for Long and Short Setups
Example Bullish Plan: Bias, Trigger, Stop, Target
Market: Trending pair with clean swings. Avoid tight ranges.
- Top-down bias: On D1 or H4, price sits above the 200 EMA. The last major swing structure prints higher highs and higher lows.
- Setup zone: You wait for a pullback into a prior breakout level or a rising 20 to 50 EMA area. Price must hold above the last swing low.
- MACD condition: Histogram prints negative during the pullback, then starts rising toward zero. This shows selling pressure fading.
- Trigger: On your entry timeframe, MACD line crosses above the signal line, and the histogram prints its first higher bar above the prior bar. You enter on the close, not mid-candle.
- Stop: Place your stop 1 ATR below the pullback swing low, or below the structure level you used as support, whichever is further. If that distance breaks your risk limit, skip the trade.
- Target: First target at the prior swing high. Second target at 2R or the next resistance zone. Move stop to breakeven only after price closes beyond the prior swing high or you bank partial profit.
- Management rule: If the histogram contracts for 3 to 5 bars while price stalls under resistance, reduce risk. Take partials, tighten stop, or exit on a MACD bearish cross.
Use a multi-timeframe approach so your MACD trigger matches the higher timeframe trend. See multi-timeframe analysis for alignment rules.
Example Bearish Plan: Confirmation and Invalidation Rules
Market: Downtrend with momentum, not a flat range.
- Trend confirmation: On D1 or H4, price trades below the 200 EMA. Structure shows lower highs and lower lows. You avoid selling into major support without room.
- Pullback filter: Price rallies into a prior support turned resistance zone, or into a falling 20 to 50 EMA area. You want rejection, not a straight grind higher.
- MACD condition: Histogram rises toward zero during the pullback, then stalls and turns down. This signals fading buying pressure.
- Entry trigger: MACD line crosses below the signal line, and the histogram prints its first lower bar after the turn. You enter on the close of the trigger candle.
- Stop placement: Stop goes 1 ATR above the pullback swing high, or above the resistance zone that defines the setup, whichever is further.
- Targets: First target at the prior swing low. Second target at 2R or the next support zone. Take partial profits if the pair hits support with a shrinking histogram.
- Invalidation rules: Exit if price closes above the pullback swing high. Exit if MACD flips bullish and stays bullish for 2 closes while price holds above your entry level.
- No-trade rule: Skip the setup if the pullback drives the histogram above zero and holds it there. That often marks a deeper reversal, not a clean continuation.
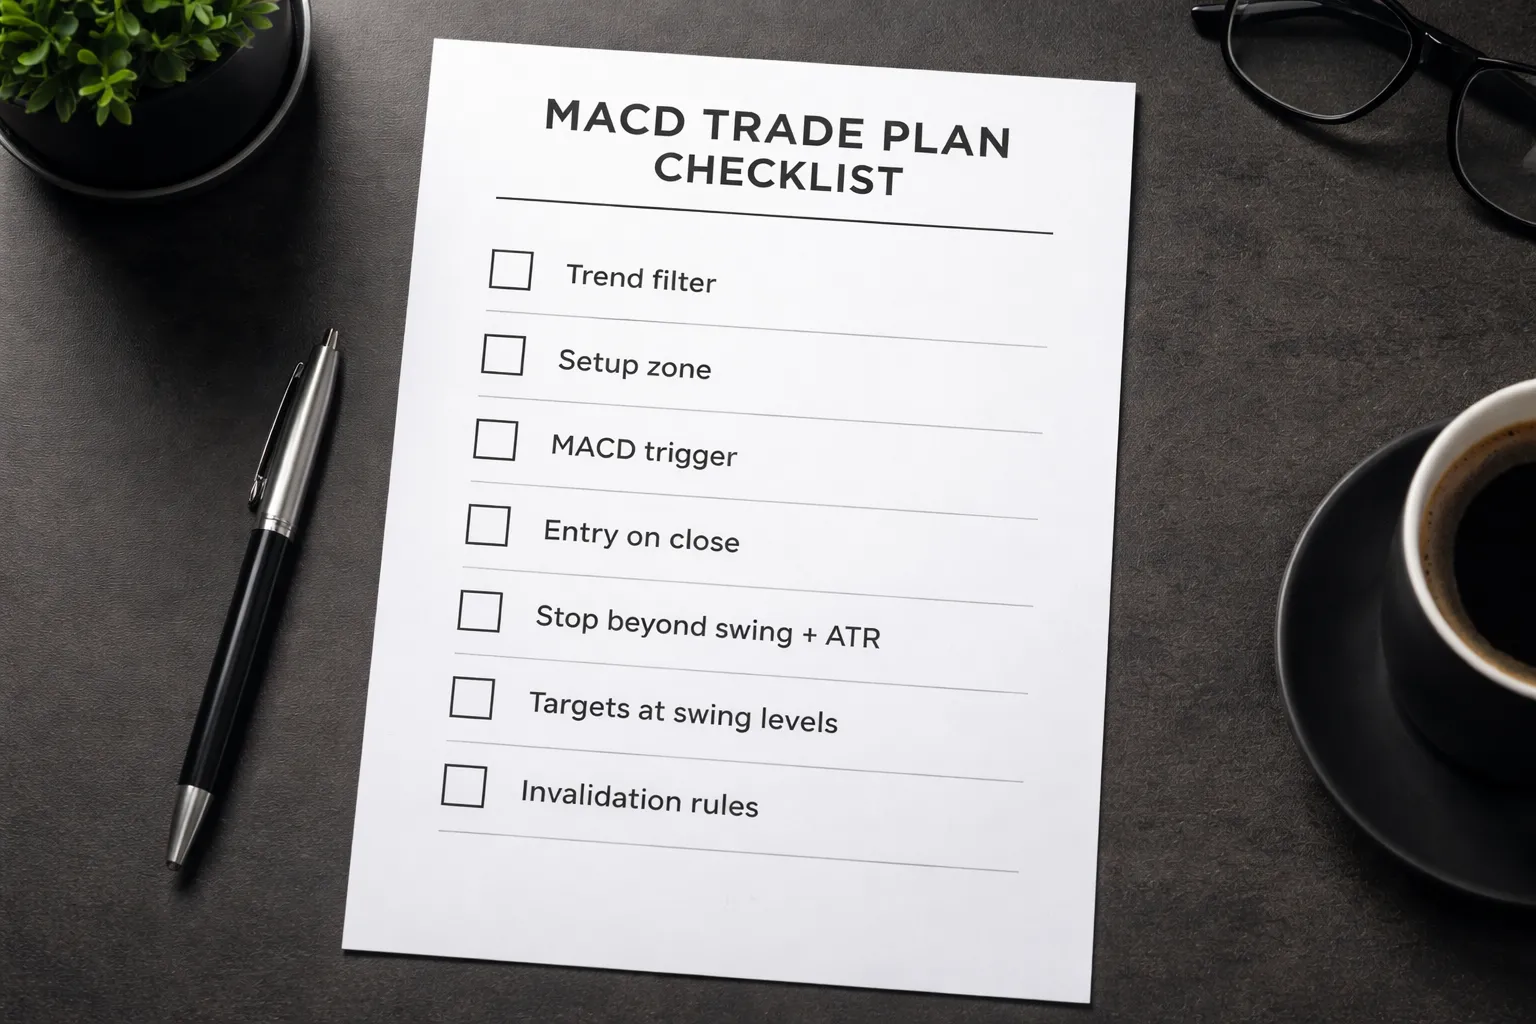
Printable MACD Trade Checklist
- Market type: Trend present on H4 or D1. No tight consolidation.
- Trend filter: Price on the right side of 200 EMA. Structure supports direction.
- Room: Next major support or resistance gives at least 1.5R of space.
- Setup: Pullback into a level or moving average zone. Clear swing point formed.
- MACD context: Histogram shows pullback pressure, then starts to reverse toward the trend.
- Trigger: MACD line crosses signal in your direction. Histogram confirms with a higher bar for longs, lower bar for shorts.
- Entry: Enter on candle close. No chasing after a large impulse candle.
- Stop: Beyond swing point plus ATR buffer. Position size fits your fixed risk.
- Target plan: T1 at last swing. T2 at 2R or next zone. Partial and trail rules defined.
- Failure plan: Invalidation level set. Exit rules for MACD flip and structure break written down.
- Execution check: Spread and volatility acceptable. News risk checked. Order type set.
FAQ
What does the MACD indicator measure in Forex?
MACD measures momentum and trend strength. It compares two moving averages, then tracks their distance from each other. Rising MACD shows increasing bullish momentum. Falling MACD shows increasing bearish momentum. It reacts slower than price, so use it as confirmation.
What are the MACD settings for Forex?
The default is 12, 26, 9. It works well on most major pairs. Faster settings increase signals and noise. Slower settings reduce signals and lag more. Keep one set of settings per strategy, then stick to it for consistent testing.
Is MACD better for day trading or swing trading?
MACD fits both. It tends to work cleaner on higher timeframes because noise drops. For day trading, use stricter filters like structure and session rules. For swing trading, use MACD to confirm pullbacks and continuation entries near key zones.
What timeframe works best with MACD?
Start with H1, H4, or D1. You get fewer, clearer signals. If you trade M5 to M15, expect more false flips and more spread impact. Match the timeframe to your holding time and your stop size, then backtest it.
How do you read a MACD crossover?
A bullish crossover happens when the MACD line crosses above the signal line. A bearish crossover is the opposite. Treat it as momentum confirmation, not an entry by itself. Require market structure alignment and a defined stop beyond a swing point.
What does the MACD histogram tell you?
The histogram shows the distance between the MACD line and the signal line. Expanding bars signal strengthening momentum. Contracting bars signal weakening momentum. A histogram flip often comes before a line crossover, but it also whipsaws in ranges.
How do you trade MACD divergence in Forex?
Divergence appears when price makes a new high or low, but MACD does not. Use it as a warning, not a trigger. Wait for a structure break or a failed push, then enter on a retest. Place your stop beyond the swing.
Why does MACD give false signals?
MACD fails most in tight ranges and during news spikes. Crossovers cluster and reverse fast. Reduce false signals by trading in clear trends, aligning with higher timeframe direction, and avoiding low liquidity hours. Clear rules help prevent impulsive entries.
Can you use MACD alone to trade Forex?
You can, but results often degrade. MACD lacks context on support, resistance, and volatility. Combine it with structure, ATR-based stop placement, and defined targets. If you struggle with overtrading, use tighter filters and fixed trade limits.
How do you set stop-loss and take-profit with MACD?
Place your stop beyond the invalidation swing, then add an ATR buffer. Set position size to keep risk fixed. Take partial at the last swing, then target 2R or the next zone. Use a trail only after structure confirms.
What is the best MACD strategy for beginners?
Trade trend pullbacks. Confirm higher timeframe direction. Wait for a pullback to a level, then a MACD histogram turn or crossover. Enter on a retest, not an impulse candle. Use fixed risk, a swing-based stop, and a pre-set target plan.
Does MACD repaint?
MACD does not repaint on closed candles. Values can change while the current candle forms. Make decisions only after candle close. This reduces whipsaws and makes backtests match live trading more closely.
How do you avoid overtrading with MACD?
Limit trades to your best conditions, trend alignment, clean structure, acceptable spread, and no high-impact news. Skip repeated crossovers in ranges. Use a checklist. Follow a rules-based plan, and review mistakes weekly. See how to avoid overtrading.
Conclusion
MACD measures momentum and trend. It does not predict price. Use it to filter trades, time entries, and manage exits.
- Trade with the higher time frame trend. Use MACD to confirm direction, then take setups that match structure.
- Use one trigger. Pick crossover, zero-line break, or histogram shift. Do not mix signals mid-trade.
- Demand clean conditions. Skip ranges and messy swings. If price chops, MACD will chop with it. Use a range trading plan instead.
- Wait for candle close. Reduce false signals and make your testing match execution.
- Control risk first. Define invalidation, set your stop, size the position, then look for the signal.
Final tip. Write a MACD checklist on one page. Backtest 100 trades on one pair and one time frame. Track win rate, average win, average loss, and maximum drawdown. Keep the rules that hold up, cut the rest.
-
Stop Loss vs Take Profit: Differences, Examples & Best Practices
6 months ago -
Forex Trading Psychology Tips: How to Stay Disciplined and Consistent
6 months ago -
Forex Order Types Explained: Market vs Limit vs Stop Orders
6 months ago -
How to Set Stop Loss and Take Profit (Step-by-Step)
6 months ago -
How to Start Forex Trading Step by Step (Beginner Roadmap)
6 months ago
-
- What does the MACD indicator measure in Forex?
- What are the MACD settings for Forex?
- Is MACD better for day trading or swing trading?
- What timeframe works best with MACD?
- How do you read a MACD crossover?
- What does the MACD histogram tell you?
- How do you trade MACD divergence in Forex?
- Why does MACD give false signals?
- Can you use MACD alone to trade Forex?
- How do you set stop-loss and take-profit with MACD?
- What is the best MACD strategy for beginners?
- Does MACD repaint?
- How do you avoid overtrading with MACD?
-
-
- What does the MACD indicator measure in Forex?
- What are the MACD settings for Forex?
- Is MACD better for day trading or swing trading?
- What timeframe works best with MACD?
- How do you read a MACD crossover?
- What does the MACD histogram tell you?
- How do you trade MACD divergence in Forex?
- Why does MACD give false signals?
- Can you use MACD alone to trade Forex?
- How do you set stop-loss and take-profit with MACD?
- What is the best MACD strategy for beginners?
- Does MACD repaint?
- How do you avoid overtrading with MACD?
-
-
How to Place a Forex Trade Step by Step (Your First Trade Explained)
4 months ago -
Forex Trading vs Crypto Trading: Which Market Is Better for Beginners?
4 months ago -
Forex Lot Size Calculator: How to Use It to Size Trades Correctly
6 months ago -
How to Calculate Position Size in Forex (Position Sizing Formula + Examples)
6 months ago -
Forex Leverage Explained: How It Works, Pros, Cons & Examples
6 months ago
-
Forex Trading Platforms Comparison: MetaTrader vs cTrader vs TradingView
6 months ago -
Stop Loss vs Take Profit: Differences, Examples & Best Practices
6 months ago -
Is Forex Trading Legal in the United States? Rules, Regulators & What to Know
6 months ago -
Forex Market Hours & Trading Sessions Explained (Best Times to Trade)
6 months ago -
Forex Leverage Explained: How It Works, Pros, Cons & Examples
6 months ago