Price Action Trading Forex for Beginners: The Complete Starter Guide

Price action trading uses price movement as your main signal. You read candles, swings, and key levels. You ignore most indicators and focus on what buyers and sellers do on the chart.
This guide shows you how to trade forex with price action from scratch. You will learn how to spot trends and ranges, mark support and resistance, identify common candle patterns, and plan entries and exits with clear rules. You will also learn basic risk control, including position sizing and a simple risk-reward ratio framework.
You will finish with a beginner-ready checklist you can use on any major currency pair and timeframe.
Key Takeaways
- In het kort: Trade what price does, not what you think it should do.
- In het kort: Start with market structure, trend, range, and key levels.
- In het kort: Use clear entry and exit rules, then control risk first.
- In het kort: Keep position size fixed by risk per trade, not by feelings.
- In het kort: Track every trade, review weekly, improve one rule at a time.
- Price action means you read candles and swing points to map direction and momentum.
- You need three labels before you look for setups, trend, range, or transition.
- Mark support and resistance from obvious swing highs and lows, then validate them with repeated reactions.
- One level beats five lines. Too many levels kill decision speed.
- Trade with the higher timeframe bias, then time entries on your execution timeframe.
- Use a small set of candle patterns. Focus on where they form, at levels, after a clear move.
- Plan entries with a trigger, limit, stop, and target before you click buy or sell.
- Place stops where your idea breaks, beyond the level that defines the setup.
- Set targets at the next logical liquidity area, prior swing, range edge, or key round number. Use a simple framework for take profit levels.
- Risk a fixed percent per trade. Many beginners use 0.5 to 1.0 percent. Pick one number and stick to it.
- Aim for reward that justifies your risk. If the chart cannot offer it, skip the trade.
- One good setup beats constant trading. Fewer trades, better rules, better data.
- Use a checklist on every trade, market type, level, setup, entry trigger, stop logic, target logic, risk size, and invalidation.
What Is Price Action Trading in Forex (Beginner-Friendly Definition)
What Price Action Trading Means
Price action trading means you make trading decisions using price movement on the chart. You focus on raw price, key levels, and clear structure. You read what buyers and sellers did, then you plan your entry, stop, and target.
You do not need a complex toolset. You need a repeatable way to answer five items, market type, key level, setup, trigger, and exit logic.
How Price Action Differs From Indicator-Based Trading
Indicators transform price into another line, value, or signal. They usually lag because they use past candles. Price action uses the source data first.
- Price action first: structure, levels, breakouts, rejections, and volatility on the chart.
- Indicators second: confirmation, filters, and risk sizing, not prediction.
- Fewer inputs: fewer rules to conflict, easier journaling, clearer review.
- Cleaner invalidation: you place stops where the setup breaks, not where an indicator flips.
What Candlesticks Reveal About Buyers and Sellers
Each candle records a fight between buyers and sellers over a fixed time. You read three things, speed, rejection, and follow-through.
- Body size: tells you who controlled most of the period. Larger bodies often show stronger commitment.
- Wicks: show rejection. A long upper wick near resistance often means sellers pushed price back down. A long lower wick near support often means buyers defended.
- Close location: matters more than the open. Closes near the high suggest buyers kept control into the end of the period. Closes near the low suggest sellers kept control.
- Context: the same candle means different things at a major level than in the middle of nowhere.
If you want a focused list of common formations, use this guide on candlestick patterns.
Core Vocabulary You Must Know
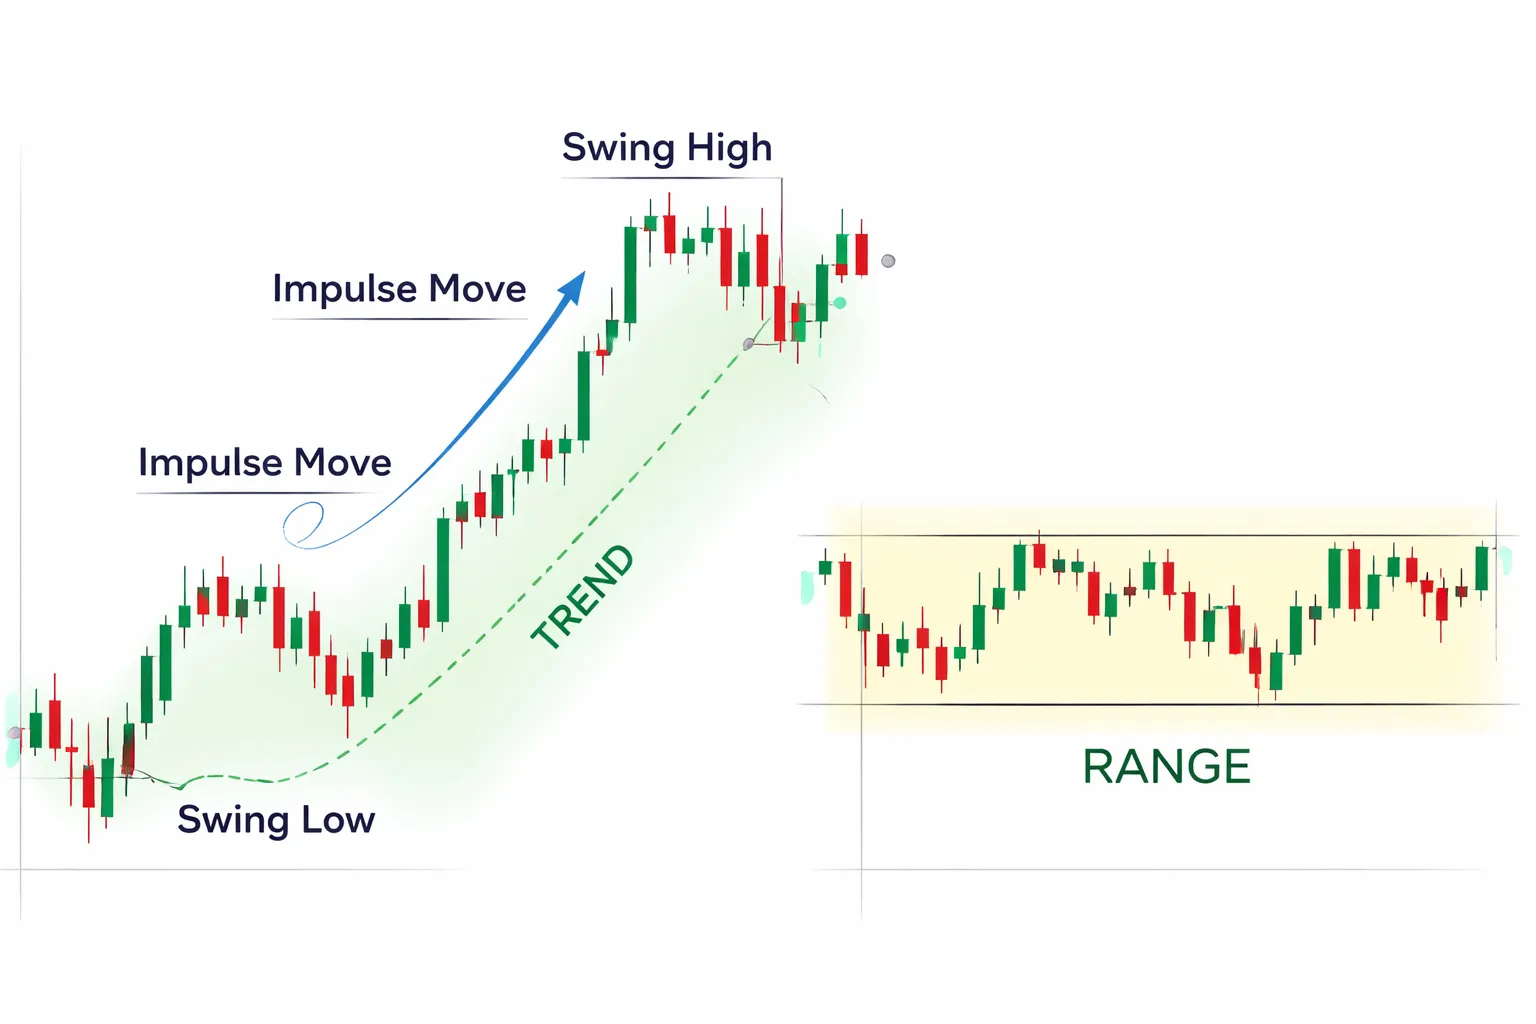
- Swings: visible turning points. A swing high forms when price stops rising and turns down. A swing low forms when price stops falling and turns up.
- Impulse vs correction: impulse is the strong move that advances price. Correction is the pause or pullback that retraces part of the impulse.
- Trend: price makes higher highs and higher lows in an uptrend, lower lows and lower highs in a downtrend.
- Range: price oscillates between support and resistance without progress. Breakouts fail more often in choppy ranges.
- Key levels: areas where price reacted before, support, resistance, and major swing points. Levels matter more when many candles respected them.
When Price Action Works Best, and When It Struggles
Price action works best when the chart shows clean structure and clear levels.
- Best conditions: strong trend with orderly pullbacks, or a well-defined range with repeated touches and clean reactions.
- Best pairs and times: liquid sessions with steady flow, often London and New York overlap. Spreads stay tighter and levels hold cleaner.
- Hard conditions: low-liquidity hours, wide spreads, and erratic spikes. Stops get hit more often without real follow-through.
- News risk: major releases can override structure. Price can gap, spike, and invalidate levels fast.
- Chop risk: tight, overlapping candles create false breaks. You need stricter filters or you skip.
Forex Basics You Must Know Before Reading Charts
How currency pairs are quoted and what a pip means
Forex trades in pairs. One currency buys, the other sells.
Base currency sits first. Quote currency sits second.
- EUR/USD 1.0850 means 1 euro costs 1.0850 US dollars.
- If EUR/USD rises, the euro strengthens versus the dollar. If it falls, the euro weakens.
A pip is the standard price step for most pairs. For most pairs, 1 pip equals 0.0001. For JPY pairs, 1 pip equals 0.01.
- EUR/USD from 1.0850 to 1.0851 equals +1 pip.
- USD/JPY from 150.20 to 150.21 equals +1 pip.
Many brokers also show fractional pips. You may see 1.08503. The last digit is a tenth of a pip.
Pips turn into money through your position size. Bigger size means each pip matters more.
Spreads, swaps, commissions, and why costs change your results
Your trade starts with a cost. That cost comes from the spread, commission, and sometimes swap.
Spread is the gap between bid and ask. You buy at ask. You sell at bid. The spread is what you pay to enter.
- If EUR/USD bid is 1.08500 and ask is 1.08508, the spread is 0.8 pips.
- Your trade begins down 0.8 pips before price moves.
Commission is a fixed fee per lot on many low spread accounts. Some brokers charge per side. Some charge round trip.
Swap is the overnight financing charge or credit. You pay or earn it when you hold past the broker cutoff time. It depends on the pair, direction, and rate environment.
Costs change your win rate needs.
- If your average winner is 10 pips and your average cost is 2 pips, you give up 20% of each winner.
- If your stop is 10 pips and your average cost is 2 pips, your effective loss becomes closer to 12 pips.
Costs also change chart signals. Wide spreads can make a clean level look broken. Tight spreads keep structure readable.
Trading sessions and volatility: London, New York, and overlaps
Price action depends on participation. Liquidity and volatility shift by session.
- London session often brings strong direction and clean breaks, especially on EUR and GBP pairs.
- New York session often drives USD pairs and can extend or reverse London moves.
- London and New York overlap often brings the most volume and tighter spreads. Many key highs and lows form here.
Your chart behaves differently outside these windows. Low liquidity hours can create thin moves, wider spreads, and stop runs with no follow-through.
News can override everything. One release can expand spreads and blow through levels. You need a rule for news, either you avoid it or you trade it with smaller size and wider error margins.
Leverage and margin explained without the hype
Leverage lets you control a larger position with a smaller deposit. It does not reduce risk. It increases how fast you can lose.
Margin is the amount your broker sets aside to keep a position open. It is not a fee. It is locked while you hold the trade.
Example with simple numbers.
- You deposit $1,000.
- You open a position that needs $200 margin.
- Your free margin becomes $800 before profit and loss moves.
If price moves against you, your equity drops. If equity drops too far, your broker can close trades to protect the loan. This is a margin call or stop out, depending on the broker rules.
High leverage makes small price moves matter more because you can open positions too large for your account. Keep position size tied to a fixed risk per trade. If you need that framework, read this guide on risk-reward ratio.
| Term | What it means | Why it matters on charts |
|---|---|---|
| Base/Quote | First currency priced in the second | Defines what “up” and “down” means for the pair |
| Pip | Standard price step, usually 0.0001 or 0.01 for JPY pairs | Measures movement and helps size stops and targets |
| Spread | Bid-ask gap | Can fake breaks and widen effective stops |
| Commission | Broker fee per lot | Raises breakeven distance, changes expectancy |
| Swap | Overnight financing | Matters for multi-day holds and trend trades |
| Margin | Collateral held to support open trades | Limits position size, protects against forced closures |
Price Charts & Candlesticks: The Minimum You Need to Start
Choosing Chart Types, Candles vs Bars vs Line
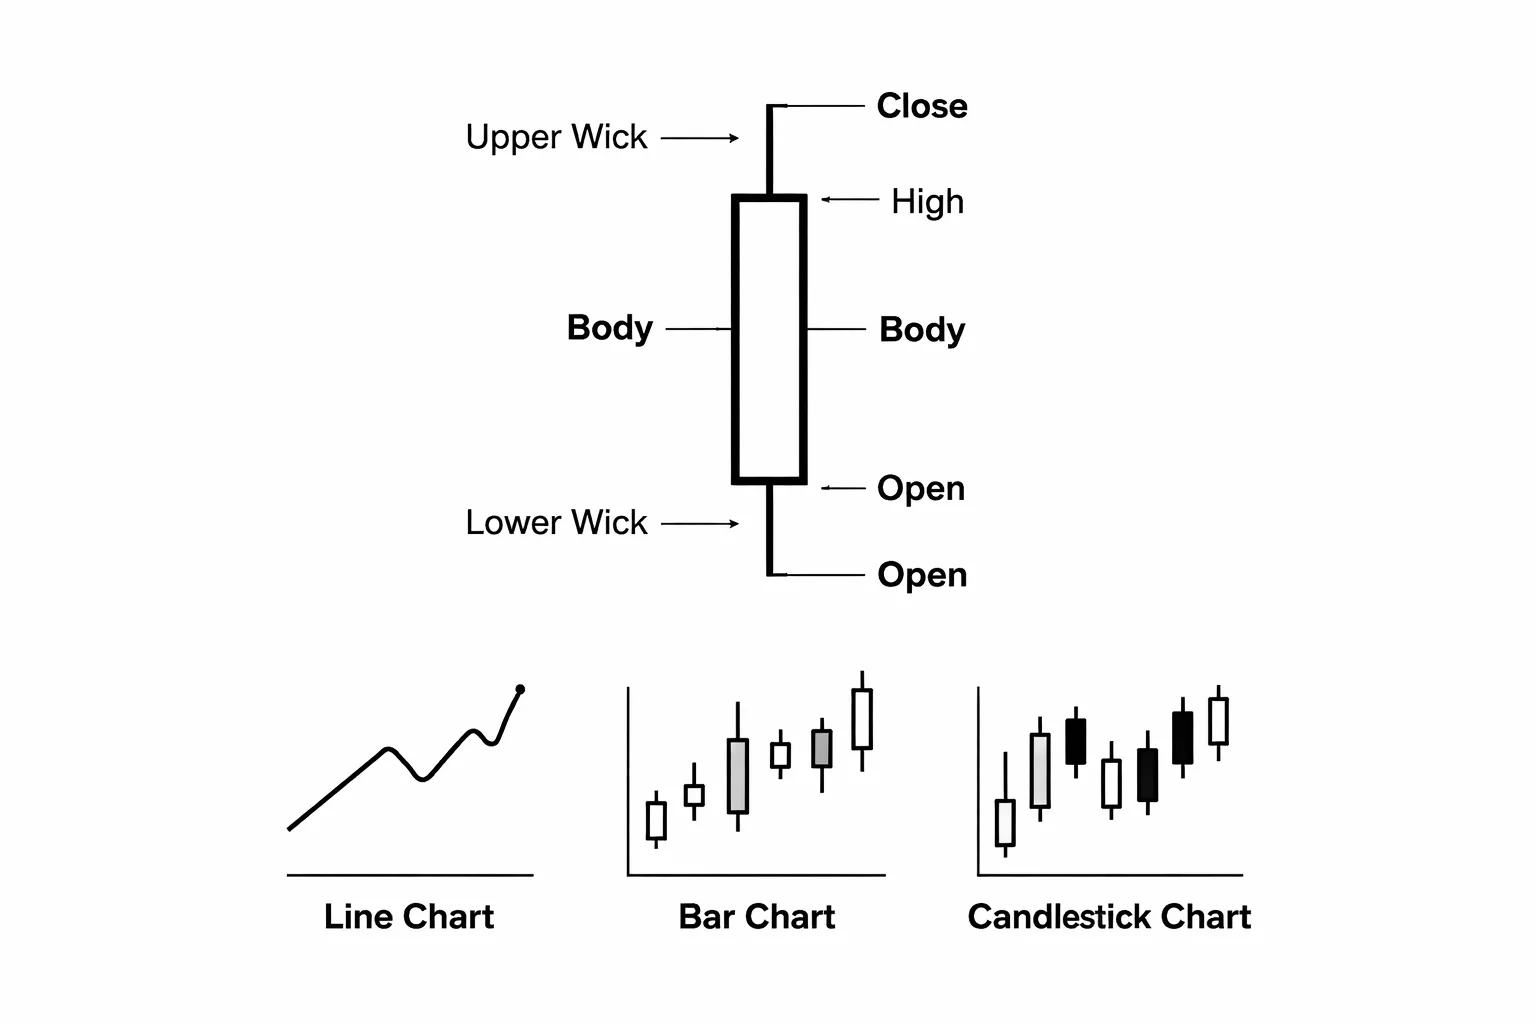
You can view price three main ways: line, bar, or candlestick. All use the same data. They just display it differently.
- Line chart, shows only the close price. It hides the highs and lows. Use it for a fast trend check only.
- Bar chart, shows open, high, low, close (OHLC). It is accurate but harder to scan at speed.
- Candlestick chart, shows the same OHLC as bars. It is easier to read because the body highlights the open to close range.
Candles dominate because you can spot momentum and rejection faster. You see who controlled the session, buyers or sellers, without decoding small bar ticks.
Anatomy of a Candlestick, What It Tells You
- Open, where the candle starts for that timeframe.
- Close, where the candle ends for that timeframe.
- Body, the distance between open and close. Bigger body usually means stronger directional push.
- Wicks, the highs and lows beyond the body. Long wicks show rejection and failed pushes.
Focus on close-to-close meaning. The close matters because it locks in the outcome of that timeframe. Many simple price action rules use closes, for example a daily close above resistance, or an hourly close back inside a range after a break.
Use candles to answer two questions. Did price push with strength, or stall. Did price break a level and hold, or break and snap back.
Timeframes for Beginners, Use H1, H4, and D1
Lower timeframes print more noise. Spreads, random spikes, and small order bursts matter more. Your chart looks busy and your decisions get rushed.
Start with higher timeframes.
- H1, good for learning structure and practicing execution without constant whipsaw.
- H4, fewer signals, clearer swings, easier stop placement.
- D1, cleanest structure, best for planning levels and holding trades longer.
Match your chart to your time. If you can only check charts a few times per day, use H4 or D1. If you can check hourly, use H1.
Keep one top-down flow. Mark levels on D1. Refine on H4. Execute on H1. Do not jump to M5 to force entries.
Clean-Chart Principles, What to Remove and What to Keep
Your goal is to read price. Most indicators add lag and clutter. Start clean.
- Remove, stacked indicators, multiple oscillators, auto trendlines, and signal arrows.
- Remove, unnecessary grids, extra sessions, and alert spam.
- Keep, candlesticks, a simple color scheme, and clear levels.
- Keep, support and resistance zones, major swing highs and lows, and obvious trend structure.
- Keep, at most one moving average if it helps you see trend bias. If it distracts you, delete it.
Limit your markings. Three to six key levels per pair usually beats twenty lines. If you cannot explain why a level matters, remove it.
Use the same chart layout every day. Consistency reduces errors and makes your review process faster.
If you trade breakouts, focus on closes around the level, then manage risk with clear stops and targets. Use this guide for the rules and traps: breakout trading strategy rules.
Market Structure: The Foundation of All Price Action Setups
Market Structure: The Foundation of All Price Action Setups
Market structure tells you who controls price. Buyers or sellers. It also tells you where your setup has room to work, or where it will fail fast.
Start with one job. Label swings. Then decide if price trends, ranges, or compresses.
Identifying Higher Highs and Higher Lows vs Lower Highs and Lower Lows in Real Time
You do not need to mark every wiggle. You need consistent swing rules.
- Pick a timeframe first. Do your structure work on that chart. Do not mix swings from other timeframes.
- Define a swing high. A high with clear rejection, then price moves away and breaks a prior minor low.
- Define a swing low. A low with clear rejection, then price moves away and breaks a prior minor high.
- Confirm with closes. Use candle closes to confirm breaks, not wicks.
Then label the sequence.
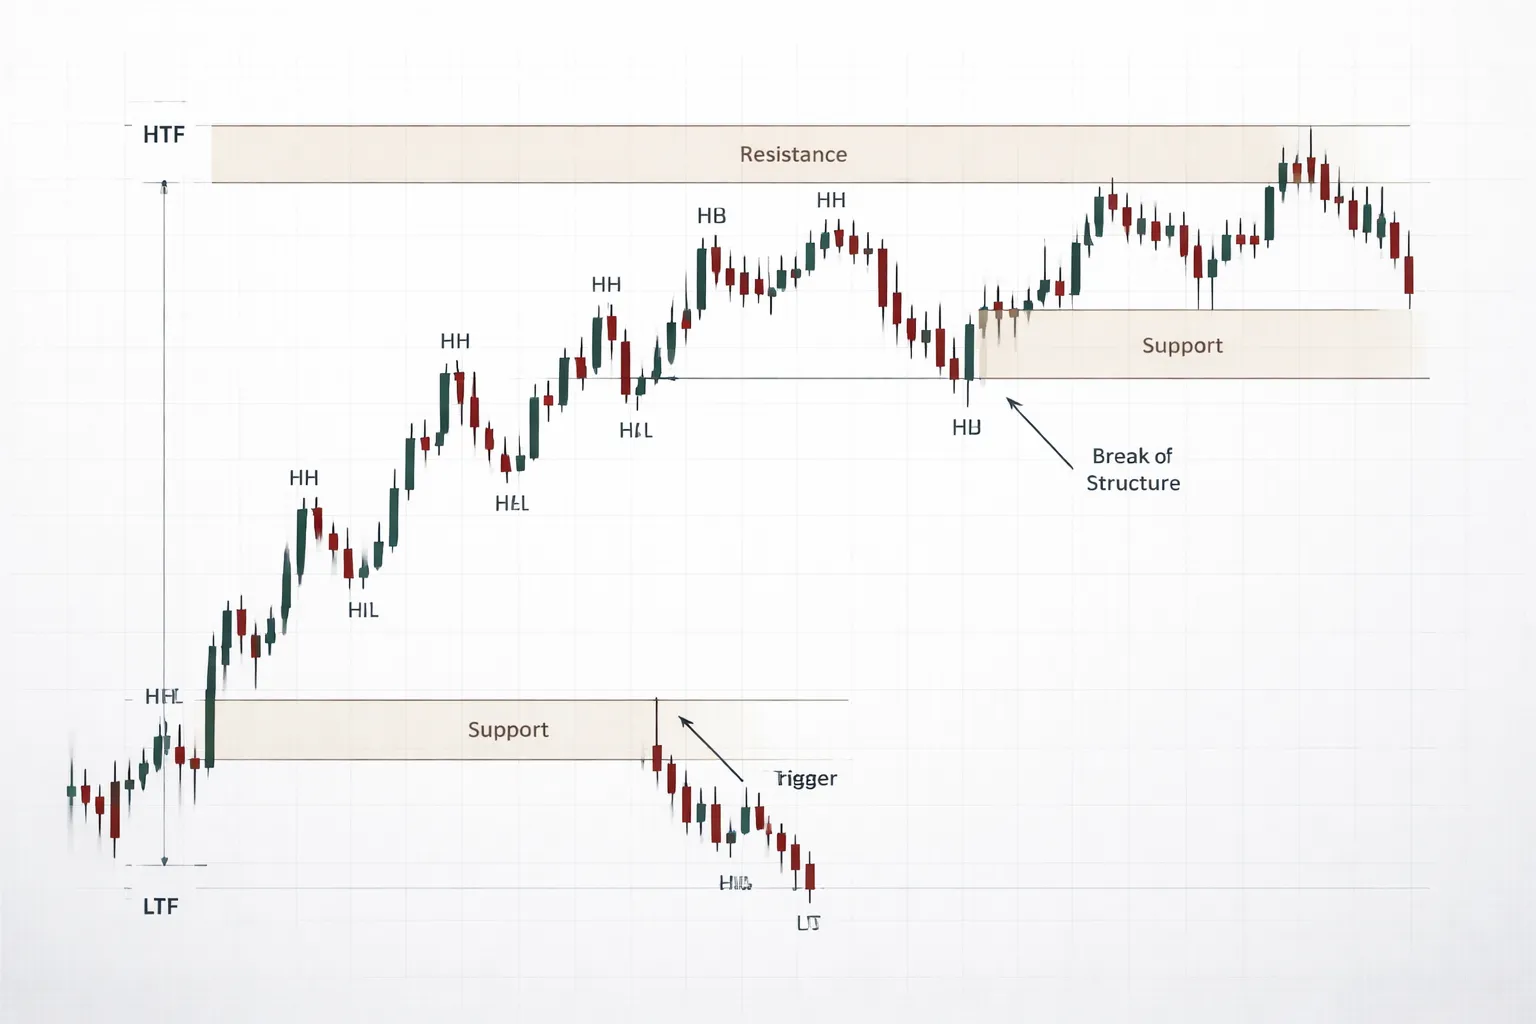
- Uptrend structure: higher high, higher low, higher high. Your pullback should hold above the prior swing low.
- Downtrend structure: lower low, lower high, lower low. Your bounce should hold below the prior swing high.
- Loss of momentum: price fails to make a new high in an uptrend, or fails to make a new low in a downtrend. Treat it as a warning, not a reversal signal.
Practical rule for beginners. If you cannot point to the last two clear swings, you do not have tradeable structure yet.
Break of Structure vs Trend Continuation: How to Avoid False Conclusions
Many traders call one spike a reversal. They get trapped. You avoid this by separating three events: sweep, break, and follow-through.
- Liquidity sweep: price wicks above a prior swing high or below a prior swing low, then snaps back. This often traps breakout traders.
- Break of structure (BOS): price closes beyond the key swing that defines the current trend. In an uptrend, that means a close below the last higher low. In a downtrend, a close above the last lower high.
- Confirmation: after the break, price should fail to reclaim the broken level, or it should retest it and reject it.
Use this checklist before you label a true BOS.
- Was the broken swing significant? If it did not lead to a strong impulse, it often does not matter.
- Did you get a close beyond it? Wicks alone cause most false calls.
- Did structure shift on your trading timeframe? A lower timeframe break inside a higher timeframe trend often means nothing.
- Did price reclaim the level fast? If price closes back inside the prior structure within one to three candles, treat it as a failed break.
When you trade a BOS, you need clear invalidation. Place stops beyond the swing that proves you wrong, then plan targets so your trade has acceptable risk-reward.
Ranges and Consolidation: Spotting Balance and Compression
Trends pause. Price balances. Your job is to tell the difference between a clean range and a tight compression that can break hard.
Use simple range rules.
- Range high: two or more rejections from a similar price area.
- Range low: two or more rejections from a similar price area.
- Range acceptance: multiple closes inside the boundaries. This tells you the market accepts those prices.
Then check for compression.
- Lower highs into equal lows: bearish pressure. Sellers step down. Buyers hold one floor.
- Higher lows into equal highs: bullish pressure. Buyers step up. Sellers cap one ceiling.
- Shrinking candle bodies: less progress per candle. Energy builds, but direction stays unclear.
Range trading and breakout trading need different rules. In ranges, you expect failures at the edges. In compression, you expect a close outside the boundary, then a retest. If you treat compression like a range, you will fade the move that continues.
Multi-Timeframe Mapping: Top-Down Process From Higher to Lower Timeframe
Top-down mapping keeps your bias aligned with the chart that matters most. It also prevents you from taking a lower timeframe setup straight into higher timeframe support or resistance.
Use a fixed sequence. Do it the same way every session.
- Step 1, higher timeframe direction. Mark the last two major swings. Decide uptrend, downtrend, or range.
- Step 2, higher timeframe levels. Mark the clean swing high and swing low that define the current structure. Add one to three key levels that price has respected.
- Step 3, execution timeframe context. Drop to your trading chart. Identify if price sits near a higher timeframe level, or in the middle of space.
- Step 4, entry trigger. Only take patterns that agree with the higher timeframe context. Trade with the trend near pullback zones, or trade the range edges with tight invalidation.
- Step 5, manage with structure. Use the next swing level as your first decision point. Trail behind new swings only after price proves the move.
| Timeframe | Your job | What to mark |
|---|---|---|
| Higher timeframe | Bias and boundaries | Major swings, range edges, key levels |
| Middle timeframe | Setup zone | Pullback area, compression, acceptance or rejection |
| Lower timeframe | Entry and risk | Trigger candle, invalidation swing, first target level |
Market structure is your filter. It tells you when a pattern has meaning, and when it is noise.
Support & Resistance (and Why ‘Key Levels’ Beat Random Lines)
Support & Resistance (and Why “Key Levels” Beat Random Lines)
Support and resistance are areas where orders cluster. Price reacts because other traders react. Your job is to find the levels that keep working across time, then trade around them.
Random lines come from random points. Key levels come from obvious structure. Use key levels as decision points, not as predictions.
Finding High-Quality Levels: Touches, Reactions, and Clean Swing Points
Start on the higher timeframe. Mark the most visible swing highs and swing lows. If you need to zoom in to “see” it, skip it.
- Touches matter, but reactions matter more. Count the times price hits the area and then moves away with speed or range expansion.
- Clean swing points beat messy chop. A clean swing has a clear push away and a clear return. Chop creates fake levels.
- Fresh levels tend to work better. The more times price trades through a level, the more it gets “used up.”
- Confluence helps, structure first. If a level lines up with a pullback tool like a Fibonacci retracement, treat it as a bonus, not the reason.
Zones vs Single Lines: When Precision Hurts Beginners
Beginners lose money by drawing perfect lines. FX does not respect perfect lines. It respects areas.
- Use zones when wicks keep piercing a price. Mark the wick cluster as the outer edge and the candle bodies as the inner edge.
- Use lines when the market prints clean closes at one price. If several candles close at the same level and reject it, a line can work.
- Place risk beyond the zone, not on it. If your stop sits inside the zone, normal noise takes you out.
| What you see on the chart | What to draw | Why |
|---|---|---|
| Repeated wick spikes through the same area | Zone | Liquidity grabs and stop runs are common |
| Multiple clean closes rejecting one price | Single line | Acceptance and rejection are clear |
| One big impulse move starts from a base | Zone around the base | Institutions often defend the origin area |
Round Numbers and Psychological Levels in FX
Round numbers attract attention and orders. They often act as magnets and pivots, especially in major pairs.
- Big figures: 1.1000 on EURUSD, 150.00 on USDJPY. These levels often stall price or trigger breakouts.
- Half levels: 1.1050, 149.50. These can act as intraday decision points.
- Do not trade them alone. Use them when they overlap with a swing high, swing low, range edge, or breakout retest.
Common Mistakes: Drawing Too Many Levels and Curve-Fitting
More lines do not create more edge. They create more confusion.
- Marking every minor high and low. You end up with a chart where price is always “at a level.”
- Adjusting levels after the fact. If you keep moving the line to match the last wick, you train yourself to rationalize losses.
- Ignoring timeframe hierarchy. A 5 minute level inside a daily level is not equal. Higher timeframe levels set the boundaries.
- Forcing symmetry. Two touches in random chop do not make a valid level. You want clear displacement away from the area.
Limit yourself. Pick the top 3 to 6 key levels from the higher timeframe, then refine only the one you plan to trade.
Trendlines, Channels, and Breakouts the Right Way
How to draw trendlines using swings, not wicks everywhere
Trendlines work when you anchor them to clear swing points. You want structure, not noise.
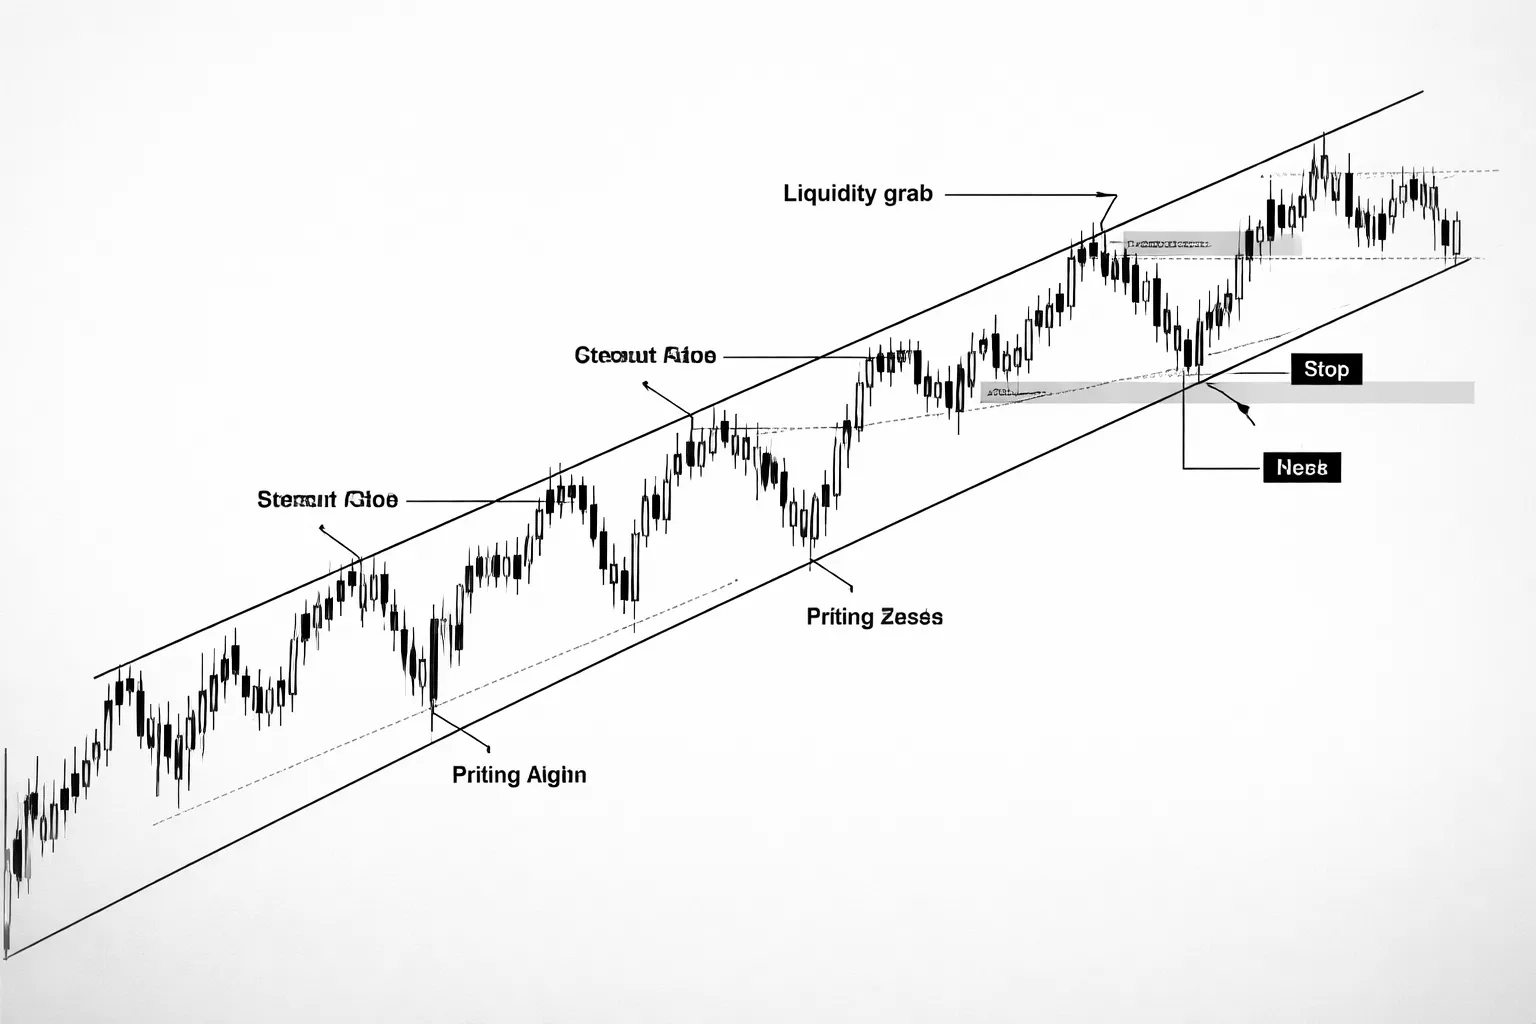
- Use swing highs and swing lows. Mark the obvious turning points where price changed direction and displaced.
- Start with the close. Use bodies as your first reference. Allow a few wick pierces, but do not build the line around them.
- Require at least three reactions. Two points draw a line. The third touch gives it value.
- Keep the angle reasonable. A steep line breaks often. If you need a steep line to “make it fit”, you forced it.
- Respect timeframe hierarchy. Draw lines on the daily or 4H first, then refine on 1H. A 5 minute trendline does not override a daily one.
If you want a repeatable process, follow this step-by-step trendline guide and apply it the same way on every chart.
Valid breakouts vs liquidity grabs, what to look for
Most “breakouts” fail because they run stops, fill orders, then reverse. You need rules that filter weak breaks.
- Breakout location matters. A break into higher timeframe support or resistance has lower odds. A break away from a major level has higher odds.
- Look for displacement. You want a strong push through the line or range with larger candles and clean distance.
- Look for a close outside. A wick through the level is not enough. A close beyond it matters more.
- Watch the immediate follow-through. A real breakout should not snap back inside on the next one to three candles on your execution timeframe.
- Spot the liquidity grab. Price spikes beyond the level, stalls, then closes back inside. The next move often runs the other side of the range.
Retest entries, turning breakouts into higher-probability trades
Chasing the first break gives you poor entries. Retests improve price, reduce risk, and expose fake breaks.
- Step 1, mark the broken level. Use the trendline, channel boundary, or range high or low that just broke.
- Step 2, wait for the pullback. You want price to come back to the level, not hover far from it.
- Step 3, demand a hold. Price should respect the level and fail to close back through it.
- Step 4, enter on confirmation. Use a small reversal signal at the level, like a strong rejection candle or a break of the retest swing on your lower timeframe.
- Stop placement. Place your stop beyond the retest swing and beyond the level. If price clears both, the setup failed.
- Targets. Aim for the next higher timeframe level, or the opposite side of the prior structure.
Skip the retest trade if the pullback cuts deep and closes well beyond the level. That often signals absorption and a failed breakout.
Using channels to frame pullbacks and targets
Channels help you trade trend continuation with structure. They also give you clear target zones.
- Build the channel from swings. Draw the main trendline along swing lows in an uptrend or swing highs in a downtrend. Then copy it to the opposite side to capture the swing extremes.
- Trade pullbacks inside the channel. In an uptrend, focus on buys near the lower channel line after a pullback. In a downtrend, focus on sells near the upper channel line.
- Use the midline as a decision point. Price often reacts at the channel midpoint. Use it to manage risk, take partials, or tighten stops.
- Set targets with the opposite boundary. If you buy near the lower line, the upper line becomes a logical first target. If you sell near the upper line, the lower line becomes a logical first target.
- Read channel breaks carefully. A clean break with displacement can signal trend acceleration. A shallow poke and snap back often signals a liquidity grab.
High-Probability Price Action Patterns Beginners Should Master
Pin Bars (Rejection Candles): Context Rules and Ideal Locations
A pin bar shows rejection. The wick marks where price tried to go, then failed. Trade them for location, not for shape.
- Only take them at clear levels. Prior swing high or low, range edge, channel boundary, or a clean daily level.
- Align with the higher time frame. A bullish pin bar works best inside an uptrend pullback, or at the bottom of a range. A bearish pin bar works best inside a downtrend pullback, or at the top of a range.
- Demand a close back inside the area. If the wick breaks a level but the close returns back above it for bullish, or back below it for bearish, rejection is real.
- Avoid pins in the middle. If it forms in open space with no nearby structure, skip it.
- Entry plan. Conservative entry uses a break of the pin bar high for bullish, or low for bearish. Aggressive entry uses a limit near the middle of the candle after the close.
- Stop placement. Put the stop beyond the wick, plus a small buffer. If price breaks that wick again, the rejection failed.
- Target plan. First target is the next opposing level. In a range, target the opposite boundary.
Engulfing Candles: Momentum Clues and Confirmation Criteria
An engulfing candle shows a fast shift in control. It matters most when it breaks structure, not when it just looks big.
- Best locations. After a pullback into support in an uptrend, or into resistance in a downtrend. Also at range edges after a false break.
- Confirmation rule. The engulfing candle should close beyond the prior candle body. Stronger signals also close beyond a nearby minor swing point.
- Look for displacement. A clean, wide body that moves away from the level suggests real intent. Small bodies with large wicks often chop.
- Filter the noise. Skip engulfing candles that form inside tight congestion, or directly into a major opposite level.
- Entry plan. Enter on a pullback to the midpoint of the engulfing candle, or on a break of its high or low if you want confirmation.
- Stop placement. Put the stop beyond the engulfing candle low for bullish, or high for bearish.
- Target plan. Target the next liquidity pool, prior swing, or the opposite range boundary. Take partials near the first obvious obstacle.
Inside Bars: Volatility Contraction and Breakout Plans
An inside bar signals contraction. It often leads to expansion. Your job is to avoid random breakouts and trade the ones with context.
- Trade them with trend or at key levels. Best setups form during a trend pullback, or tight consolidation under resistance, or above support.
- Use the mother bar range. The high and low of the prior candle define the battlefield. The inside bar is just the pause.
- Breakout plan. Place buy stop above the mother bar high, and sell stop below the mother bar low, only if the location supports both outcomes. Otherwise, set one direction and ignore the other.
- Reduce false breaks. Avoid inside bars in the middle of a range with no edge nearby. Avoid trading into major news spikes.
- Stop placement. Put the stop on the other side of the mother bar. If the breakout fails and breaks back through, you exit fast.
- Target plan. Measure to the next structure level. If you break from a range, your first target is the opposite side.
- Volatility sizing. Inside bars can be tight, but the mother bar can be wide. Size your position so the stop still fits your risk. If you need help with volatility-based stops, use an ATR-based stop loss as a simple benchmark.
Two-Legged Pullbacks: Simple Continuation Logic Without Indicators
A two-legged pullback is a trend continuation pattern. Price pulls back in two pushes, then resumes the trend. You trade the failure of the pullback, not the pullback itself.
- First define the trend. You want higher highs and higher lows for longs, lower lows and lower highs for shorts.
- Wait for two pushes against the trend. In an uptrend, you get a drop, a bounce, then a second drop that often stalls near support. In a downtrend, you get the mirror.
- Look for weakening on the second leg. Smaller candles, more overlap, or rejection wicks near a prior swing point signal the pullback is running out of pressure.
- Entry trigger. Enter when price breaks the pullback trendline, or when it breaks above the last minor lower high in an uptrend, or below the last minor higher low in a downtrend.
- Stop placement. Put the stop beyond the second leg extreme. If price takes that level, the pullback did not fail.
- Target plan. First target is a retest of the trend high or low. Next target is the next structure level in the trend direction.
- Common beginner error. Buying the first dip in a strong pullback. You want the second leg and a break in structure, then you act.
Supply & Demand and Order-Flow Concepts (Simplified for Beginners)
What “Imbalance” Means on a Retail Chart
Order-flow drives price. Your chart shows the result, not the orders.
Imbalance means one side hit harder than the other. Buyers overwhelm sellers, or sellers overwhelm buyers. Price moves fast. It leaves a clean leg with little overlap.
- How it looks: strong candles in one direction, small pullbacks, long bodies, and gaps in structure.
- What it signals: aggressive buying or selling, plus a lack of opposite orders at that price.
- What you do with it: mark the origin of the move. That area often acts as a decision zone later.
Base-Rally-Drop and Base-Drop-Rally Zones (How to Validate Them)
These patterns show a pause, then a displacement move, then a reversal move. The pause is the base. The strong move away is the clue.
- Base-Rally-Drop (BRD): price bases, pushes up, then sells off hard. Often forms supply.
- Base-Drop-Rally (BDR): price bases, pushes down, then rallies hard. Often forms demand.
Validate a zone with simple checks. Keep it strict.
- 1) Displacement: price leaves the base with strong candles and little overlap. Weak drifts do not count.
- 2) Structure break: the move away should break a recent swing high or swing low. No break, lower odds.
- 3) Clean base: 1 to 4 candles is enough. Big messy ranges create wide zones and bad risk.
- 4) First return: the first retest of a fresh zone works best. Each touch consumes orders.
- 5) Location: zones near major highs or lows matter more than zones in the middle of noise.
Mark zones as a range. Use the base high to base low. Do not chase a single line.
Liquidity, Stop Hunts, and Why Wicks Form Near Obvious Levels
Liquidity is available orders. Big players need it to enter and exit without huge slippage.
Stops and breakout orders create liquidity. They cluster at obvious places.
- Above recent swing highs.
- Below recent swing lows.
- Above equal highs and below equal lows.
- At round numbers and session highs and lows.
A stop hunt is a quick push into that pool of orders. Price grabs the liquidity, then snaps back when the burst of orders dries up.
Wicks form because price moves fast into a level, fills orders, then reverses. The wick shows rejection. The close shows who kept control.
- Long upper wick at a high: buyers got trapped, sellers absorbed buying, price could not hold.
- Long lower wick at a low: sellers got trapped, buyers absorbed selling, price could not stay down.
Do not treat every wick as a reversal. Require context. A wick into a fresh supply or demand zone means more than a wick in the middle of a range.
Avoiding Overcomplication: Practical Rules to Keep It Tradable
- Rule 1: trade with the current structure. In an uptrend, prefer demand zones. In a downtrend, prefer supply zones.
- Rule 2: only mark zones that caused a clear structure break with displacement.
- Rule 3: use the first return to the zone, skip later touches unless structure resets.
- Rule 4: avoid wide zones. If your stop must be huge, skip the setup.
- Rule 5: combine zone entry with a trigger, such as a rejection wick, an engulfing close, or a break of a minor swing inside the zone.
- Rule 6: keep orders simple. Use limit entries at the zone or a stop entry after confirmation. Know the difference between market, limit, and stop orders, see market vs limit vs stop orders.
| Concept | What you look for | Beginner filter |
|---|---|---|
| Imbalance | Strong leg, little overlap | Skip if candles look choppy |
| Supply or demand zone | Base plus displacement plus structure break | Skip if base is large or retested |
| Liquidity sweep | Push beyond obvious high or low, quick rejection | Wait for close back inside prior range |
Keep your chart clean. Mark a few zones. Track the current structure. Let price come to you.
A Simple Price Action Trading Strategy for Beginners (Rules-Based)
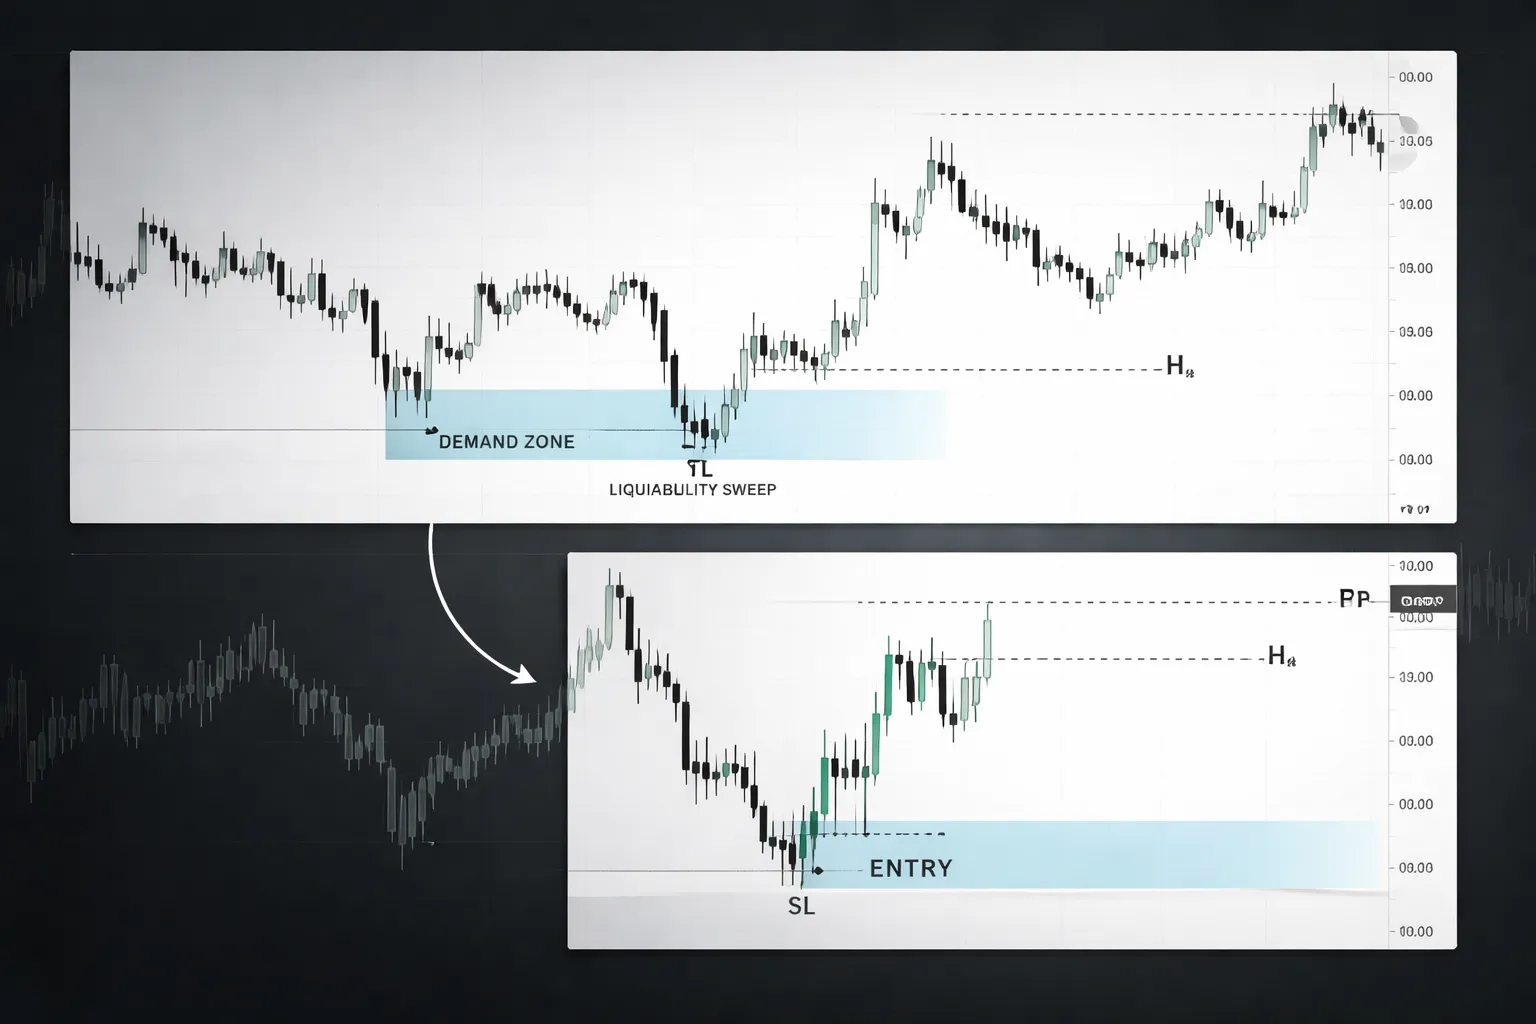
Setup Criteria
- Timeframes: Use H4 for structure and zones. Use H1 for entries.
- Pairs: Start with major pairs. Avoid exotic pairs. Spreads and spikes hurt clean execution.
- Risk per trade: Cap risk at 0.5 percent to 1 percent of your account.
- Trend filter (H4): Trade with the current leg. Mark the last clear swing high and swing low. If price makes higher highs and higher lows, look for longs. If price makes lower highs and lower lows, look for shorts.
- Level selection (H4): Use one of these only.
- Pullback level: Prior swing high or low that price broke with a strong leg.
- Supply or demand zone: Base, displacement, then structure break. Small base. Fresh zone. No multiple retests.
- Liquidity sweep level: An obvious high or low that gets swept, then price closes back inside the prior range.
- Acceptable market conditions:
- Clear swings. Clean candles. Limited overlap.
- Space to the next level. Do not trade into nearby support or resistance.
- Skip low range sessions if your pair goes flat. Skip heavy news spikes if you cannot manage slippage.
- Skip if price sits inside a tight box. Skip if your zone sits in the middle of the range.
Entry Triggers
- Option A, close confirmation (beginner default):
- Wait for price to tap your level or zone on H1.
- Enter only after an H1 candle closes back in your direction.
- Long trigger: sweep or rejection at support, then an H1 close above the prior H1 candle high, or above the rejection candle midpoint.
- Short trigger: sweep or rejection at resistance, then an H1 close below the prior H1 candle low, or below the rejection candle midpoint.
- Option B, limit entry (advanced for beginners):
- Place a limit at the edge of the zone, after the setup forms on H4.
- Use only fresh zones with strong displacement and no retest.
- Skip limits if candles turn choppy near the level. You lose the edge.
Stop-Loss Placement
- Put your stop where your idea fails. Do not pick a fixed pip number.
- For longs: Place the stop below the swing low that defines the pullback. If you trade a demand zone, put it below the zone low. If you trade a sweep, put it below the sweep low.
- For shorts: Place the stop above the swing high that defines the pullback. If you trade a supply zone, put it above the zone high. If you trade a sweep, put it above the sweep high.
- Placement rule: Your stop should sit beyond the level that price must break to invalidate the setup. If that distance makes your position size too small, skip the trade.
Take-Profit Approaches
- Method 1, fixed R-multiples:
- Target 2R as your base case.
- At 1R, you can reduce risk by moving the stop to breakeven only if price breaks and closes beyond a minor structure point. Do not move it just because you feel up money.
- Method 2, next level target:
- Mark the next H4 swing high or low, or the next supply or demand zone.
- Take profit before the level. Front run by a small buffer. Price often reacts early.
- Method 3, trailing stop:
- Trail below higher lows in an uptrend. Trail above lower highs in a downtrend.
- Only trail after price prints a new impulse leg and then a clean pullback.
- Exit on an H1 close that breaks your trailing structure.
- Do not mix all methods. Pick one per trade before you enter.
Example Trade Walkthrough, Bullish Continuation at Support
- Step 1, trend filter: On H4, price prints higher highs and higher lows.
- Step 2, level: Mark the prior H4 swing high that broke with a strong bullish leg. This becomes support on a retest.
- Step 3, conditions check: Price pulls back in controlled candles. You see room to the next H4 swing high.
- Step 4, trigger: On H1, price taps the level, sweeps a nearby minor low, then closes back above the level. Enter long at the close.
- Step 5, stop: Put the stop below the sweep low, or below the pullback swing low, whichever is lower.
- Step 6, target: Choose one.
- Fixed: take profit at 2R.
- Level: take profit just before the next H4 swing high or supply zone.
- Trail: once price breaks the pullback high and prints a new higher low, trail under that higher low.
- Step 7, management rule: If price closes on H1 below the support level right after entry, exit. The reaction failed.
Example Trade Walkthrough, Bearish Reversal at Resistance
- Step 1, context: On H4, price runs into a clean resistance zone, or a prior swing high with multiple touches.
- Step 2, level: Mark the resistance. Mark the obvious high where stops sit.
- Step 3, liquidity event: Price pushes above the obvious high, then rejects. Wait for an H1 close back below the prior range high.
- Step 4, trigger: Enter short on the H1 close back inside the range, or on the next minor pullback that fails to reclaim the level.
- Step 5, stop: Put the stop above the sweep high, or above the zone high.
- Step 6, target: Choose one.
- Fixed: take profit at 2R.
- Level: take profit just before the next H4 demand zone or swing low.
- Trail: trail above lower highs as price trends down. Exit on an H1 close above your trailing structure.
- Step 7, invalidation rule: If price reclaims resistance and holds above it with H1 closes, exit. The sweep failed.
Track these rules in a log. Backtest the exact triggers and exits on your pair and timeframe before you trade live. Use this guide on how to backtest a forex strategy to keep your results clean.
Risk Management & Position Sizing (The Part Most Beginners Skip)
Defining Risk Per Trade (And Why 0.5% to 2% Works)
Your edge means nothing if one trade can damage your account.
Define risk as a fixed percent of your account per trade. Keep it small and consistent. A practical range is 0.5% to 2%.
- 0.5% suits beginners. It keeps mistakes cheap while you build execution skill.
- 1% fits most retail accounts. You can take enough trades to learn without big drawdowns.
- 2% is aggressive. Use it only after you prove your system and your discipline.
Do not change risk based on confidence. Your best trades and worst trades look the same before they play out. Keep the risk flat.
Position Sizing Formula Using Stop Distance and Account Size
Price action trading needs stops that fit structure. That means stop size changes. Your position size must change with it.
Use this every time.
- Risk amount ($) = Account balance x Risk %
- Position size (units) = Risk amount / Stop distance (in price) / Value per 1 unit per 1 price move
If you trade with pips, this is the clean version most spot forex traders use.
- Risk amount ($) = Account x Risk %
- Position size (lots) = Risk amount / (Stop pips x Pip value per lot)
| Input | Example |
|---|---|
| Account balance | $10,000 |
| Risk per trade | 1% |
| Risk amount | $100 |
| Stop distance | 25 pips |
| Pip value | $10 per pip per 1.0 lot |
| Position size | $100 / (25 x $10) = 0.40 lots |
Two rules keep you safe.
- Set the stop based on structure first. Then size the position.
- If the stop is too wide for your max size limits, skip the trade. Do not tighten the stop to force a trade.
Risk-to-Reward vs Win Rate, Understanding Expectancy
Profit comes from expectancy, not from being right often.
Expectancy tells you what you make per trade on average.
Expectancy (R) = (Win rate x Average win in R) - (Loss rate x Average loss in R)
- 1R equals your risk on a trade.
- If you risk $100, then 1R is $100.
| Win rate | Average win | Average loss | Expectancy |
|---|---|---|---|
| 40% | 2R | 1R | (0.40 x 2) - (0.60 x 1) = 0.20R |
| 55% | 1.2R | 1R | (0.55 x 1.2) - (0.45 x 1) = 0.21R |
| 70% | 0.8R | 1R | (0.70 x 0.8) - (0.30 x 1) = 0.26R |
What matters is your real distribution, not your best-case screenshots. Track these metrics in your trade log.
- Win rate over the last 50 to 100 trades.
- Average win in R and average loss in R.
- Largest drawdown in R.
Lock this into your process with a written plan. Use a simple forex trading plan template so you do not improvise under pressure.
Handling Losing Streaks Without Random System Changes
Losing streaks happen in every system. Your job is to survive them without panic edits.
Use a fixed response.
- Step 1. Cut risk, do not cut rules. If you trade 1%, drop to 0.5% for the next 10 trades.
- Step 2. Audit execution. Check entry trigger, stop placement, and exit rules against your screenshots.
- Step 3. Separate bad trades from good losses. A good loss follows the rules. A bad trade breaks them.
- Step 4. Do not optimize after 5 trades. Review after a minimum sample, at least 30 to 50 trades, on the same pair and timeframe.
- Step 5. Set a hard daily and weekly loss limit. Example, stop for the day at 2R down, stop for the week at 5R down.
Do not react to noise. React to data. If your backtest and your forward log match, keep trading the plan. If execution drifts, fix execution first.
Building a Beginner Forex Trading Plan Around Price Action
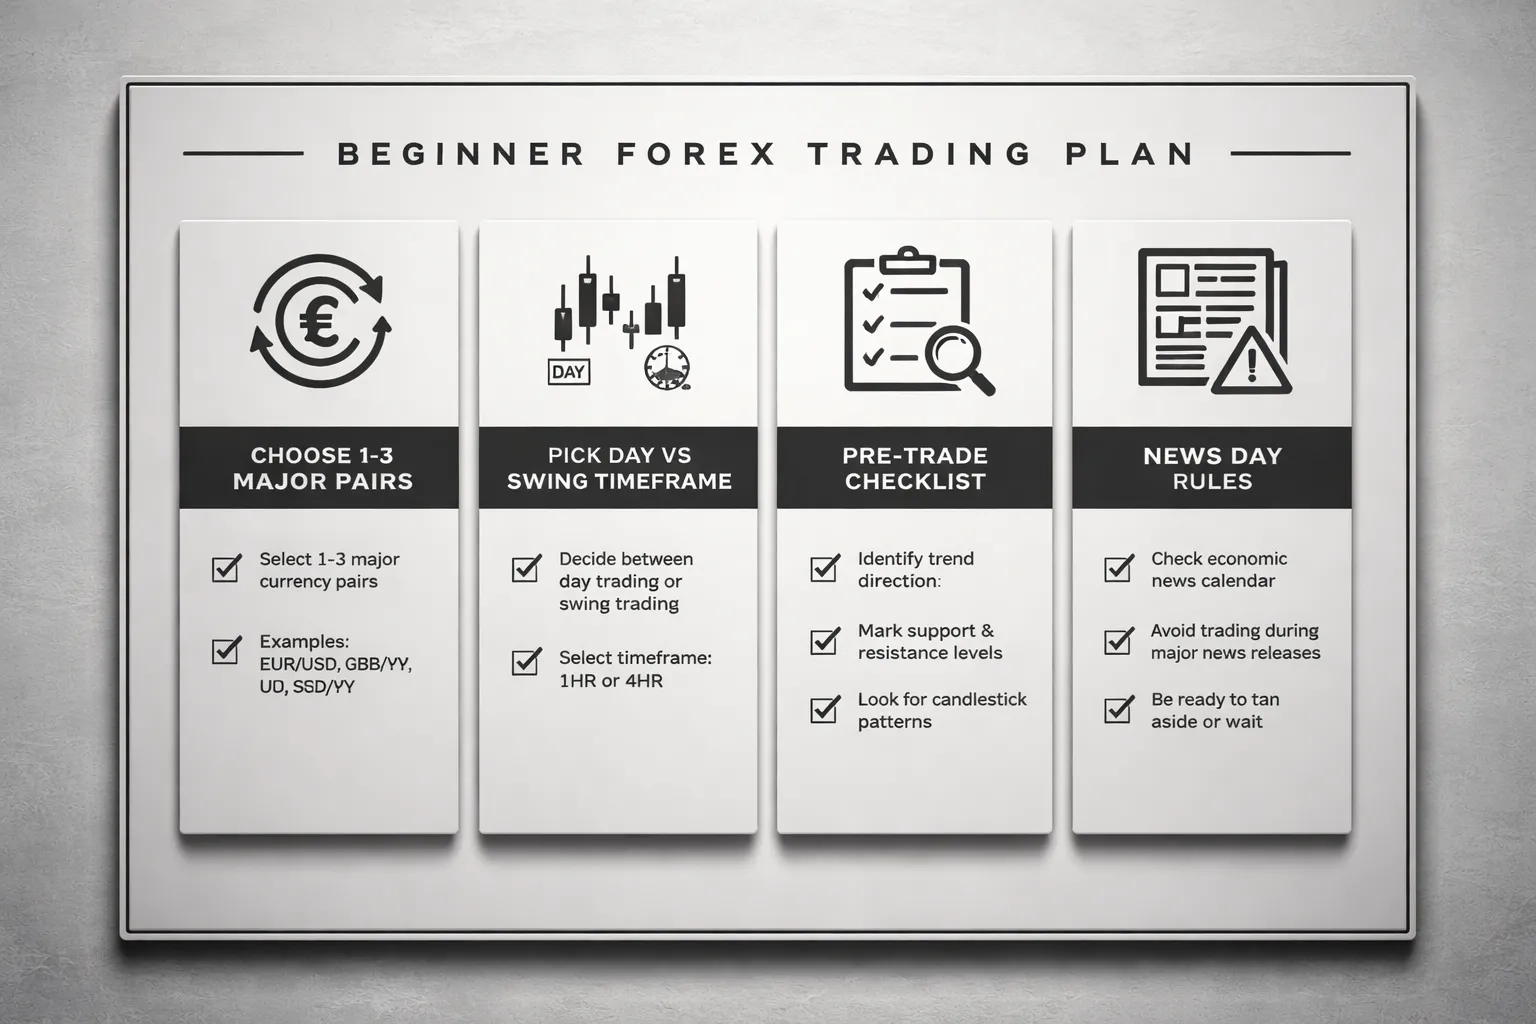
Choose Your Pairs, Start Narrow
You do not need 20 pairs. You need one to three pairs you can study and repeat.
Start with majors. They trade more, spread less, and fill cleaner. That matters when you place stops and limit orders.
- Good starter majors: EURUSD, GBPUSD, USDJPY, AUDUSD.
- Skip early on: exotic pairs. They often have wider spreads, worse fills, and sharper spikes.
- Be careful with crosses: EURJPY, GBPJPY, EURGBP. They can move fast and whip more around key levels.
Pick pairs that match your schedule. If you trade London hours, EURUSD and GBPUSD make sense. If you trade Asia, USDJPY and AUDUSD often show cleaner movement.
Keep your basket simple so your stats mean something. Also avoid stacking the same exposure across similar pairs. Use a basic forex correlation list to spot when two trades are the same trade.
Set Your Trading Style, Match It to Your Life
Price action works for day trading and swing trading. Your plan must fit your time, risk tolerance, and ability to follow rules.
- Day trading: more screen time, more decisions, more noise. You aim for smaller moves. You must execute fast and take fewer marginal setups.
- Swing trading: less screen time, fewer trades, wider stops. You hold through sessions. You must accept open risk overnight and through news gaps.
Choose one timeframe as your execution chart. Beginners do best when they stop timeframe hopping.
- Common swing setup: identify bias on D1, execute on H4.
- Common day setup: identify bias on H1, execute on M15.
Write your holding rules. Define when you stop managing and when you step in.
- Day trading rule example: flat before major scheduled news, flat before end of your session.
- Swing rule example: hold until stop or target, no manual exits unless your invalidation level breaks.
Create a Pre-Trade Checklist, Kill Impulse
Your checklist forces a pause. It turns a chart glance into a repeatable decision.
Keep it short. Five to ten items max. If you will not follow it, it is too long.
- 1. Pair and timeframe: is this one of your approved pairs and your execution timeframe.
- 2. Market state: trend, range, or breakout. Trade only the state your plan covers.
- 3. Key level: mark the nearest support and resistance that matters. Use the same method every time.
- 4. Setup type: name it. Example, pullback to level, rejection candle at level, breakout and retest. If you cannot name it, skip it.
- 5. Entry trigger: define the exact candle close or break you need. No guessing.
- 6. Invalidation: where the trade is proven wrong. Place your stop there, not where it feels safe.
- 7. Target: next logical level, not a random multiple. Confirm you have enough space to target.
- 8. R multiple: record planned R and minimum acceptable R. Do not take trades that fail your minimum.
- 9. Position size: risk a fixed percent or fixed R per trade. No exceptions.
- 10. Screenshot and log: before you place the order, capture the chart and write the reason in one line.
Rules for News Days
News creates spread widening, slippage, and fast reversals. Price action still works, but your execution must change.
Stand aside when conditions break your ability to control risk.
- Stand aside: high impact events on your pair, central bank rate decisions, CPI, NFP, FOMC statements, unexpected geopolitical headlines.
- Stand aside: when spreads widen beyond your normal range, or your broker shows unstable pricing.
- Stand aside: when your stop would sit inside the typical news spike zone near a key level.
Wait for the dust to settle when you can get clean structure again.
- Wait rule: let the first impulse move complete, then wait for a pullback and a new swing structure.
- Time rule: do not trade the first 15 to 30 minutes after the release on lower timeframes. On higher timeframes, wait for the candle to close.
- Structure rule: trade only after price respects a level again. You need a clear rejection or a clean retest.
Do not trade news because it feels like opportunity. Trade after the market prints information you can measure.
Backtesting, Demo Trading, and Journaling (Your Skill-Building Loop)
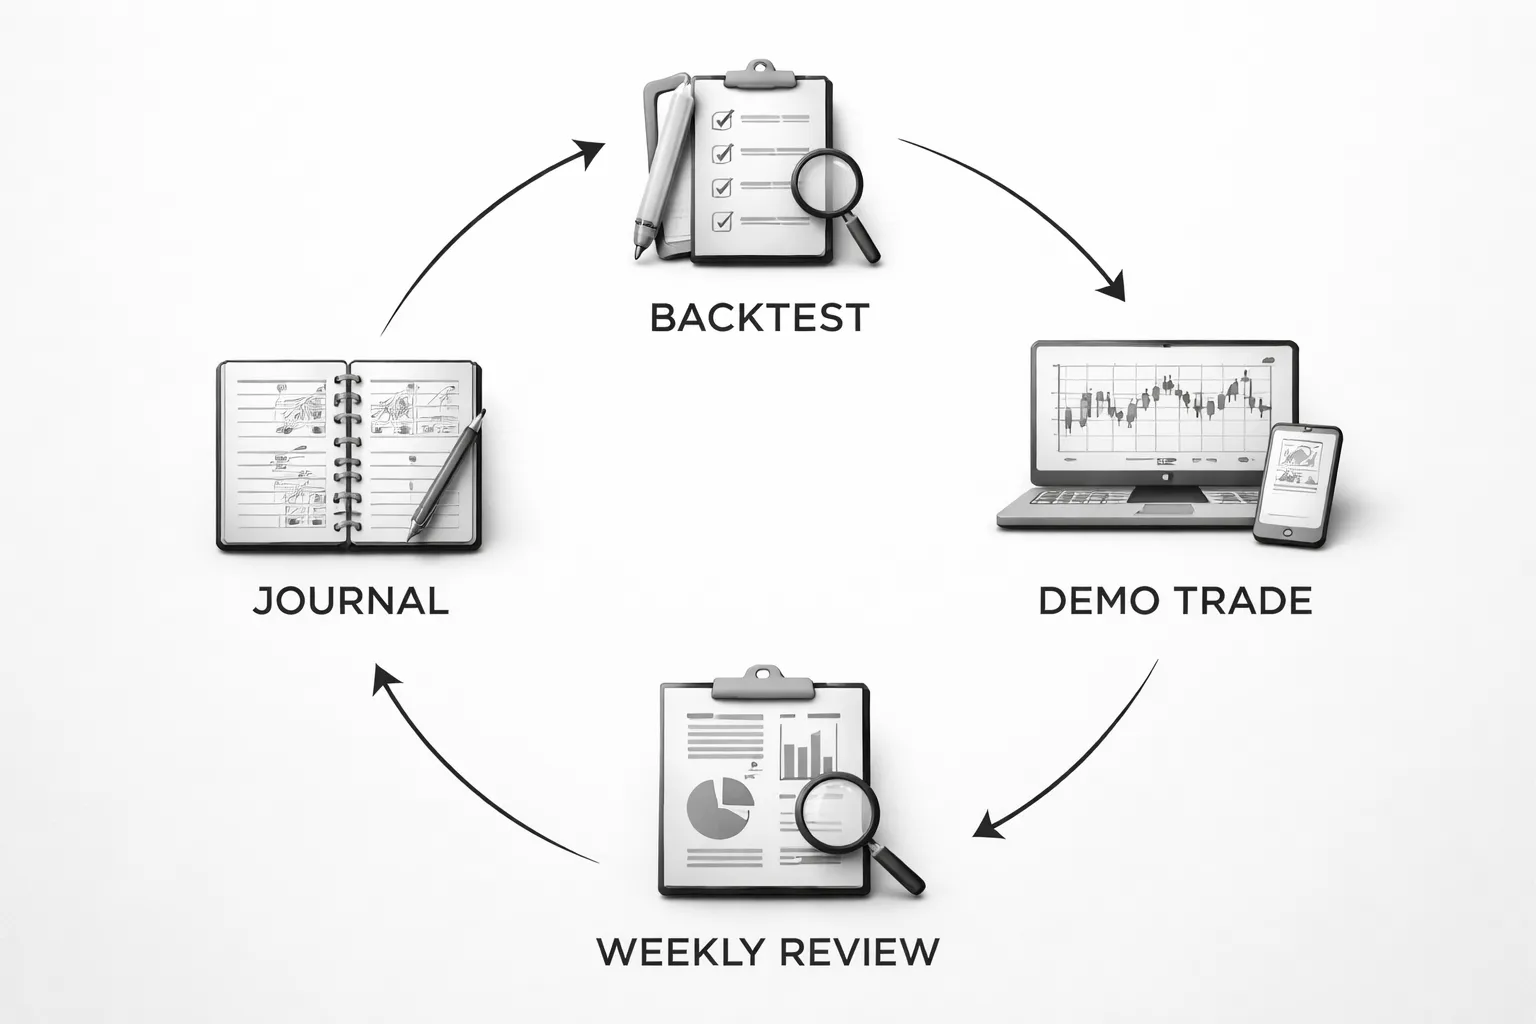
How to Backtest Price Action Objectively
Backtesting is not chart scrolling. It is a repeatable test with clear rules and clean data.
- Write your setup rules first. Define your market filter, entry trigger, stop placement, and exit rule. If you cannot code it in words, you cannot test it.
- Fix your universe. Pick 1 to 3 pairs and one timeframe. Keep sessions consistent. Avoid changing pairs when results disappoint you.
- Use a real sample size. Aim for at least 50 trades per setup type. 100 is better. Ten trades tells you nothing.
- Tag every trade. You need categories so you can find what works. Use tags like: trend, range, breakout, pullback, reversal, session, level type, and confluence factors.
- Log the same fields every time. Entry, stop in pips, target, risk in R, outcome in R, and notes on rule compliance.
- Track expectancy, not win rate. A 40 percent win rate can work if your average winner is larger than your average loser.
- Separate A setups from B setups. If you mix them, you will blame the strategy for your selection mistakes.
If you need a full process and tool list, use this guide on how to backtest a forex strategy.
| Metric | What to record | Why it matters |
|---|---|---|
| Win rate | Wins divided by total trades | Tells you how often you are right |
| Average win (R) | Mean R on winners | Shows if you let winners run |
| Average loss (R) | Mean R on losers | Shows if your stops and discipline work |
| Expectancy | (Win rate x avg win) minus (loss rate x avg loss) | One number that summarizes edge |
| Max drawdown | Largest peak to trough in R | Sets realistic risk limits |
| Rule compliance | Percent of trades that follow your rules | Separates strategy issues from execution issues |
Demo vs Live, What Changes
Demo proves your process. Live exposes your behavior. Treat them as different tests.
- Execution changes. Live includes spreads, slippage, and partial fills. Demo often looks cleaner.
- Decision speed changes. Live makes you hesitate or chase. Demo makes you click faster.
- Risk feels real. Live triggers fear of loss and fear of missing out. Your rules will feel optional unless you train them.
- Position sizing matters. In demo, size is a number. In live, size is stress. Start small enough that you can follow your plan.
- Routine matters more. Live punishes random trading hours. Keep the same session, same pairs, same checklist.
Use demo to prove you can execute 50 to 100 trades with high rule compliance. Go live only when you can follow your rules without negotiation.
What to Record in Your Trading Journal
Your journal should help you make one decision, keep doing this, stop doing that.
- Market context. Trend or range on your higher timeframe. Key levels you used. Session.
- Setup tag. Pullback, breakout, reversal, or your exact label. One trade, one label.
- Entry trigger. Pin bar, engulfing, break and retest, or your defined trigger. No vague notes.
- Stop and target logic. Where you placed the stop and why. Your planned target and exit rule.
- Risk and result in R. Always in R. This keeps your data comparable across pairs.
- Execution quality. Followed rules, yes or no. If no, state the rule you broke.
- Emotional state. One line. Calm, rushed, angry, bored. Keep it factual.
- Screenshot before and after. One chart at entry, one at exit. Same template each time.
Review Framework, Find the One Change That Moves Results
Review weekly. Keep it mechanical. You want the single constraint that produces the biggest gain.
- Step 1, filter by rule compliance. Split trades into followed rules and broke rules. Fix the rule breaks first.
- Step 2, filter by setup tag. Rank tags by expectancy. Cut the bottom tag. Trade the top one more.
- Step 3, filter by context. Compare results by session, trend vs range, and level quality. Remove the worst context.
- Step 4, locate the main leak. Common leaks include moving stops, early exits, late entries, and trading low quality levels.
- Step 5, choose one change. One rule tweak for the next 20 trades. Examples: trade only London session, require candle close at the level, minimum 1.5R target, or skip first touch trades.
- Step 6, retest and measure. Compare the next batch to the prior batch using expectancy and drawdown. Keep the change only if it improves both edge and execution.
This loop is your edge builder. Backtest to find a structure that works. Demo to prove you can execute it. Journal to remove your biggest mistake.
Common Beginner Mistakes in Price Action Forex Trading (and Fixes)
Trading patterns without context (the #1 reason setups fail)
Most beginners trade the candle pattern. They ignore where it prints.
A pin bar in the middle of a range is usually noise. An engulfing candle into clean space can run. Context decides.
- Mistake: Taking every “textbook” signal you see.
- Fix: Filter patterns with a context checklist. No checklist, no trade.
Use this simple context checklist:
- Location: Is the signal at a level that mattered before. At least two clear touches.
- Trend: Are you trading with the higher time frame bias. If you countertrend, require stronger confluence and smaller size.
- Space: Do you have room to your target before the next barrier. If the next level sits 0.7R away, your 1.5R plan is fantasy.
- Structure break: Did price sweep liquidity then reject, or did it break and hold. Avoid “maybe” structure.
- Close: Require candle close for confirmation. Many fakeouts look good mid candle.
Log this as data. Tag each trade with context scores. You will see the same pattern performs differently based on location and space.
Overtrading and revenge trading: implementing trade limits
Overtrading kills expectancy. Revenge trading kills accounts.
You feel busy. Your stats get worse.
- Mistake: Trading because you are bored, down money, or “need to make it back.”
- Fix: Add hard limits that turn your platform into a rules engine.
- Max trades per day: 1 to 3. You pick the number, you obey it.
- Max losses per day: 2 strikes, then stop. No exceptions.
- Cooldown rule: After any loss, wait for the next session block or at least 30 to 60 minutes.
- A-plus only rule: If the setup does not match your checklist, you skip it. Do not “practice” with live risk.
- Time window: Trade only your chosen session. Outside that window, you do not open new positions.
Track it with two numbers in your journal: trades taken, trades allowed. If you exceed the limit, you mark the day as a rule failure, even if you made money.
For a deeper reset plan, read how to avoid overtrading in forex.
Moving stops and targets emotionally: rule-based management fixes
You move your stop because you do not want to be wrong. You move your target because you want to lock profit. Both actions change the system mid trade.
- Mistake: Widening stops, cutting winners early, or taking profit because price “feels heavy.”
- Fix: Predefine stop, target, and management rules before entry. Then execute.
Use one management model. Keep it simple.
- Stop rule: Stop goes beyond structure. Not beyond your pain threshold. If structure says 25 pips and you want 10, you skip the trade.
- Target rule: Target goes at the next clear level, or a fixed multiple like 1.5R to 3R. No mid trade bargaining.
- Break-even rule: Move to break even only after price hits 1R and closes beyond a minor structure point. No instant break-even.
- Trail rule: Trail behind swing highs and lows, or behind a moving average you defined in testing. Do not invent a trail mid trade.
- Invalidation rule: If price closes beyond your invalidation level, you exit. Do not “give it room” after the fact.
Your goal is consistent execution so you can measure edge. If every trade has different management, your backtest means nothing.
Use the right order for the job. Market, limit, and stop orders change your fills and your risk. See the key forex order types.
Indicator overload vs ‘naked charts’: striking a practical balance
Indicators do not fix a weak process. Naked charts do not fix a lack of rules.
You need a chart you can read fast, and rules you can repeat.
- Mistake: Stacking indicators until you get a signal you like.
- Fix: Use price first, then one or two tools that solve a specific problem.
Use this balance:
- Core: Candles, levels, market structure, and space to the next level.
- One trend filter: Higher time frame swing direction, or a single moving average. Pick one.
- One volatility tool: ATR for stop sizing and realistic targets.
- No signal clutter: If an indicator does not change a decision rule, remove it.
Write each tool into your plan as a rule. Example, “Trade only when price sits above the 200 MA on H4,” or “Stop equals 1.2 x ATR(14).” If you cannot write it as a rule, it is decoration.
Tools, Platforms, and Chart Settings to Start (Without Overspending)
Platform Basics, MT4 or MT5 vs TradingView
You need two jobs covered, chart analysis and trade execution.
- MT4: Simple, fast, common at many brokers. Good for basic charting and manual execution. Limited built-in tools.
- MT5: More timeframes and order tools than MT4. Better for multi-asset brokers. Still built for execution first.
- TradingView: Best for clean charting, drawing, layouts, and alerts. Many brokers do not support direct execution. You often analyze on TradingView and place orders on MT4 or MT5.
Start with one setup. Use TradingView for analysis and alerts, then use MT4 or MT5 to execute if your broker supports it.
Skip paid platforms at the start. A free TradingView plan plus a free MT4 or MT5 install covers most beginner needs.
Chart Templates, Minimal Layout for Structure and Levels
Your chart should show structure, not noise.
- Use candlesticks.
- Pick one or two timeframes for your plan. Many beginners use H4 and D1 for direction, then H1 or H4 for entries.
- Mark swing highs and swing lows. Draw horizontal levels where price reacted more than once.
- Add one trend tool, either a simple trendline or a moving average. If you use an MA, keep it at one setting and use it as a bias filter, not as an entry signal.
- Keep the background clean. Remove extra indicators.
Save the template. Apply it to every pair. Consistency beats constant tweaking.
If you trade pullbacks, keep your structure lines and levels clear so you do not chase entries. Use this pullback trading approach as a reference for clean trend entries without forcing trades: pullback trading approach.
Alerts, Stop Staring at Screens
Alerts reduce overtrading. They also cut emotional decisions.
- Set alerts at your key levels, not in the middle of nowhere.
- Use “crossing” alerts for levels. Use “touch” alerts for zones if your platform supports it.
- Use time-based checks. Example, review charts at the New York close only, or every 4 hours for H4 trading.
- When an alert triggers, do a fast checklist, level, trend bias, space to target, risk size. If it fails, you skip.
Do not turn alerts into a reason to trade more. Use them to trade less, but better.
Broker Selection Checklist, Regulation, Spreads, Execution, Funding
Your broker choice matters more than your indicator set.
- Regulation: Choose a broker regulated in a top-tier jurisdiction when possible. Verify the license number on the regulator site, not on the broker site.
- Spreads and commissions: Compare the total cost. For many accounts, cost equals spread plus commission. Check typical spreads during active sessions, not the broker’s “from” number.
- Execution and slippage: Look for clear order types, fast fills, and transparent policies on slippage. Test with a small account first.
- Order features: You need stop loss, take profit, and pending orders. Avoid brokers that restrict stops too close to price if you trade lower timeframes.
- Funding and withdrawals: Check deposit methods, withdrawal fees, processing time, and limits. Read the terms for inactivity fees and bonus clauses.
- Account protection: Prefer negative balance protection where available. Use sensible leverage even if the broker offers more.
- Support: You want fast responses and clear answers on spreads, swaps, and execution.
Open the smallest live account you can after demo practice. Prove your process before you scale size.
Pros, Cons, and Realistic Expectations for New Traders
Strengths of Price Action: Adaptability and Clarity
Price action uses one core input, price. You focus on what the market does, not what you hope it will do.
- Works across pairs and timeframes. The same tools apply on EUR/USD, GBP/JPY, or gold. You just adjust risk and trade frequency.
- Fewer moving parts. You remove indicator conflicts. You watch trend, structure, and key levels.
- Clear trade planning. You can define entry, stop, and target from visible swing points and levels.
- Fits different styles. You can swing trade daily charts or day trade lower timeframes. The process stays similar.
- Supports rule based execution. You can turn setups into checklists and track them in a journal.
Limitations: Subjectivity and the Learning Curve
Price action looks simple. The hard part is doing it the same way every time.
- You can misread structure. New traders mark too many levels and see patterns that do not matter.
- Context changes outcomes. The same candle pattern can work in a trend and fail in a range.
- Lower timeframes add noise. Spreads, slippage, and quick reversals can break good ideas.
- Risk of overtrading. Clean setups are not constant. You must sit out many sessions.
- Execution costs matter. A small edge can vanish after spreads and swaps. Track net results.
Realistic Expectations: How Long It Takes to Become Consistent
Consistency comes from repetition, data, and risk control. Most beginners underestimate the time and the number of trades needed.
- First 4 to 8 weeks. Learn market structure, basic candle reading, and one setup. Trade demo or micro size. Focus on process, not profit.
- Months 2 to 4. Build a playbook. Journal every trade. You should start to see which conditions help your setup and which kill it.
- Months 4 to 8. Reduce mistakes. Improve entries and stops. You should produce stable execution and smaller drawdowns.
- Months 8 to 12. You aim for consistent months, not perfect weeks. You refine position sizing and stop trading low quality conditions.
Measure progress with numbers. Track win rate, average win, average loss, and maximum drawdown. A strategy can win less than 50 percent and still work if your average win beats your average loss.
A Practical Path From Beginner to Intermediate: What to Learn Next
Keep your learning narrow. Add one skill at a time. Use data to decide what stays.
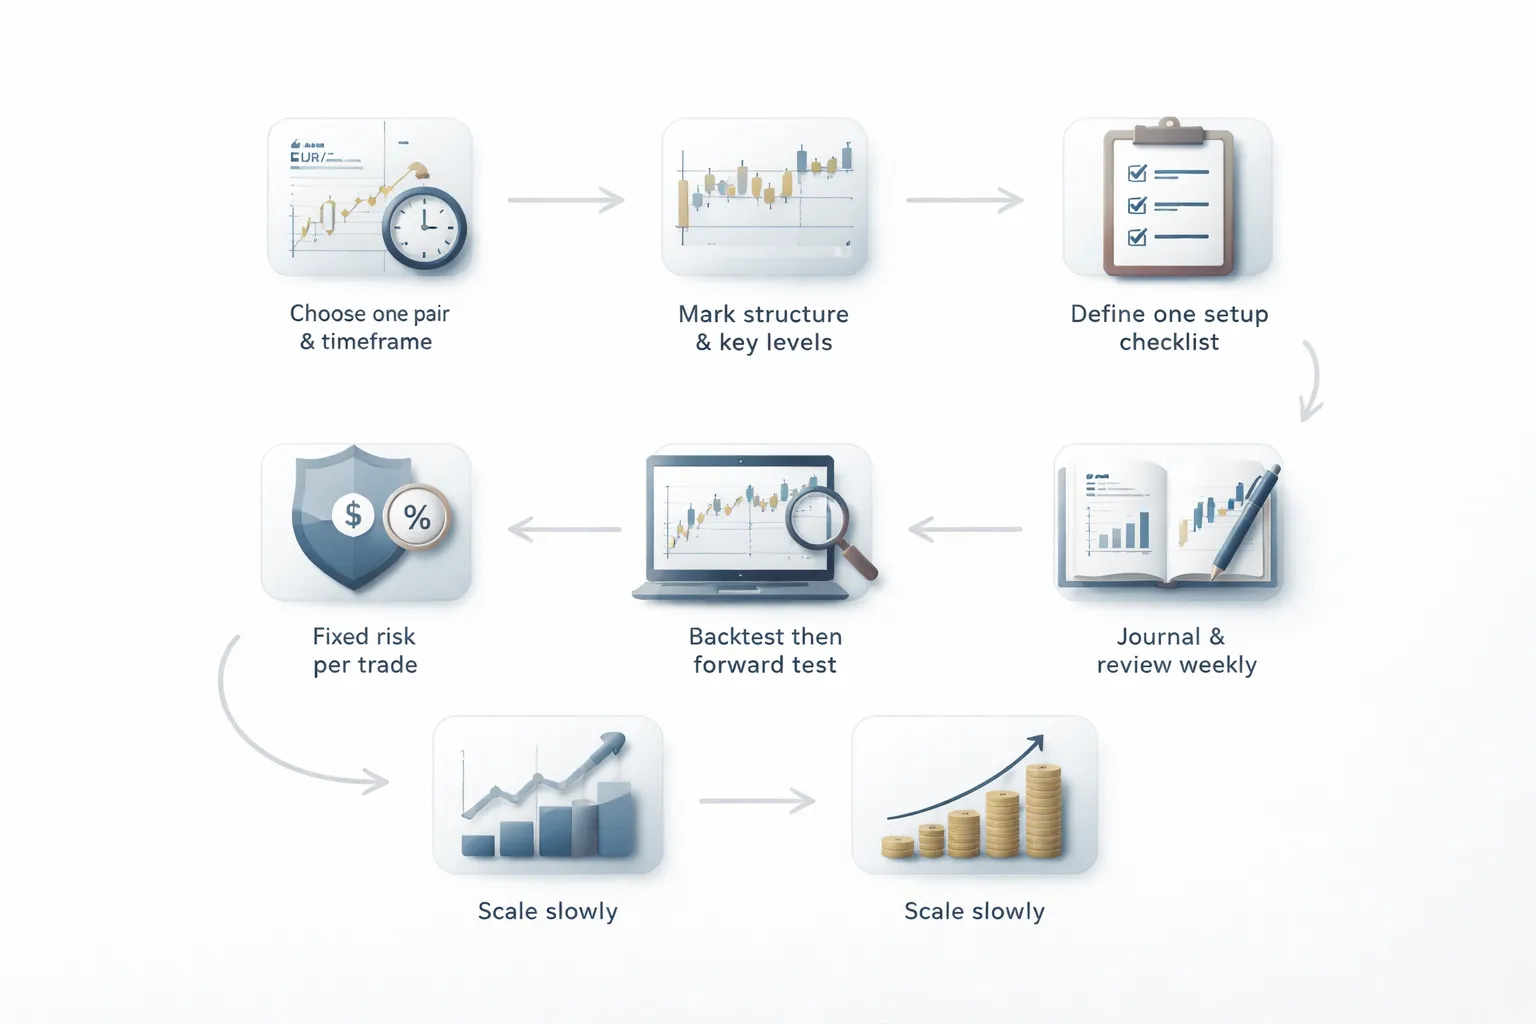
- 1. Lock one market and one timeframe. Start with one major pair and one main chart, often H4 or D1. You will see cleaner structure and trade less.
- 2. Define structure rules. Write how you mark swing highs and lows, trend direction, and valid ranges. Do not change these rules mid week.
- 3. Build a single setup checklist. Example items, trend, level, trigger candle, stop location, minimum reward to risk.
- 4. Standardize risk. Risk a fixed small percent per trade. Keep it low enough to survive a bad streak.
- 5. Backtest and forward test. Backtest to check if your idea has an edge. Forward test to prove you can execute it live. Use this guide on how to backtest a forex strategy.
- 6. Add a second setup only after proof. You want at least a few dozen trades with stable stats before you expand.
- 7. Improve trade management. Learn simple target rules, partials, and stop movement. Keep them consistent. Do not manage trades from emotion.
Veelgestelde vragen
What is price action trading in forex?
You trade what price does on the chart. You use structure, swing highs and lows, and clean levels. You skip indicators or keep them minimal. Your goal is to read intent from candles and context, then execute one repeatable setup.
Do you need indicators for price action?
No. Indicators can help with organization, not decisions. If an indicator changes your entries, you likely trade the indicator, not price. Keep tools simple. Use the same chart template every session so you stay consistent.
Which timeframe works best for beginners?
Start with H1 to H4 for setups and levels. Use D1 for the main trend and key zones. Avoid M1 to M5 early on. Fast charts punish hesitation and increase mistakes. Higher timeframes give cleaner structure and fewer trades.
How do you mark support and resistance correctly?
Mark zones, not single lines. Use obvious swing highs and lows and areas with repeated reactions. Keep only the levels price respects. Delete weak levels. Use this guide on support and resistance in forex.
What is a high-probability price action setup?
One with clear context. Trend or range defined. Level mapped. Entry trigger clean, like a break and retest or a rejection candle at a zone. Stop placement obvious. Reward at least 1R. If you cannot define these fast, skip.
How much should you risk per trade?
Risk 0.25% to 1% per trade. Keep it fixed. Do not increase risk to recover losses. A small risk keeps your learning curve survivable. You want enough trades to build data without blowing up your account.
How many trades do you need to know if your strategy works?
Track at least 30 to 50 trades per setup. More is better. Record win rate, average R, and max drawdown. Do not judge by a short streak. You want stable stats across different weeks and market conditions.
Can price action work without fundamentals and news?
Yes, but you must respect scheduled news. Avoid new entries right before high impact releases. Spreads widen. Slippage increases. Your stop can fail. If you trade through news, reduce size and use wider stops based on structure.
What is the biggest mistake beginners make with price action?
They trade every candle pattern. Patterns mean little without location. A pin bar in the middle of nowhere is noise. You need context, level, and a plan. Fewer trades, better trades. Focus on one setup until you prove it.
Should you start on a demo account?
Yes. Use demo to build execution and routine. Treat it like real money. Log every trade. Replay sessions. Fix one mistake at a time. When you hit stable stats for weeks, move to small live size. Use a structured routine.
How do you avoid overtrading?
Use a checklist. Trade only at pre marked zones. Limit sessions and limit trades per day. If you miss a trade, skip the chase. Review after the session, not during it. Your edge comes from selectivity and repetition.
Conclusie
Price action works when you keep it simple and repeatable. Mark your zones. Wait for clean setups. Define your risk before you enter. Set one stop. Set one target. Then let the trade play out.
Your edge comes from process, not predictions. Track three numbers every week. Win rate. Average R. Max drawdown. If the stats slip, reduce size and fix one rule at a time.
- One market, one session, one setup.
- Hard risk limit, fixed percent per trade.
- Minimum R target, do not take trades that do not meet it. Review your risk-reward ratio.
- Trade log, screenshot, entry reason, exit reason.
- Weekly review, keep what works, cut what does not.
Final tip. Build a checklist and treat it like a contract. If one item fails, you do not trade. This alone will remove most bad trades and speed up your learning.
-
Stop Loss vs Take Profit: Differences, Examples & Best Practices
6 months ago -
Forex Trading Psychology Tips: How to Stay Disciplined and Consistent
6 months ago -
Forex Order Types Explained: Market vs Limit vs Stop Orders
6 months ago -
How to Set Stop Loss and Take Profit (Step-by-Step)
6 months ago -
How to Start Forex Trading Step by Step (Beginner Roadmap)
6 months ago
-
- Market Structure: The Foundation of All Price Action Setups
- Identifying Higher Highs and Higher Lows vs Lower Highs and Lower Lows in Real Time
- Break of Structure vs Trend Continuation: How to Avoid False Conclusions
- Ranges and Consolidation: Spotting Balance and Compression
- Multi-Timeframe Mapping: Top-Down Process From Higher to Lower Timeframe
-
- What is price action trading in forex?
- Do you need indicators for price action?
- Which timeframe works best for beginners?
- How do you mark support and resistance correctly?
- What is a high-probability price action setup?
- How much should you risk per trade?
- How many trades do you need to know if your strategy works?
- Can price action work without fundamentals and news?
- What is the biggest mistake beginners make with price action?
- Should you start on a demo account?
- How do you avoid overtrading?
-
-
- Market Structure: The Foundation of All Price Action Setups
- Identifying Higher Highs and Higher Lows vs Lower Highs and Lower Lows in Real Time
- Break of Structure vs Trend Continuation: How to Avoid False Conclusions
- Ranges and Consolidation: Spotting Balance and Compression
- Multi-Timeframe Mapping: Top-Down Process From Higher to Lower Timeframe
-
- What is price action trading in forex?
- Do you need indicators for price action?
- Which timeframe works best for beginners?
- How do you mark support and resistance correctly?
- What is a high-probability price action setup?
- How much should you risk per trade?
- How many trades do you need to know if your strategy works?
- Can price action work without fundamentals and news?
- What is the biggest mistake beginners make with price action?
- Should you start on a demo account?
- How do you avoid overtrading?
-
-
How to Place a Forex Trade Step by Step (Your First Trade Explained)
4 months ago -
Forex Trading vs Crypto Trading: Which Market Is Better for Beginners?
4 months ago -
Forex Lot Size Calculator: How to Use It to Size Trades Correctly
6 months ago -
How to Calculate Position Size in Forex (Position Sizing Formula + Examples)
6 months ago -
Forex Leverage Explained: How It Works, Pros, Cons & Examples
6 months ago
-
Forex Trading Platforms Comparison: MetaTrader vs cTrader vs TradingView
6 months ago -
Stop Loss vs Take Profit: Differences, Examples & Best Practices
6 months ago -
Is Forex Trading Legal in the United States? Rules, Regulators & What to Know
6 months ago -
Forex Market Hours & Trading Sessions Explained (Best Times to Trade)
6 months ago -
Forex Leverage Explained: How It Works, Pros, Cons & Examples
6 months ago