RSI Indicator Forex Strategy (How to Use RSI the Right Way)

Most traders use RSI as a simple overbought and oversold signal. That leads to late entries, early exits, and bad trades in strong trends.
This guide shows you how to use the RSI indicator in forex the right way. You will learn what RSI measures, which settings matter, and how to read RSI in trend and range conditions. You will also learn high-probability RSI setups, including pullback entries, divergence filters, and multi-timeframe confirmation. You will get clear rules for entries, exits, and risk control, so your RSI signals stay consistent.
If you want to validate the rules before you trade them live, use this step-by-step guide on how to backtest a forex strategy.
Key Takeaways
Key Takeaways
- In het kort: Use RSI as a context tool first, then as a trigger.
- In het kort: In trends, treat RSI as momentum, not as an overbought or oversold alarm.
- In het kort: In ranges, fade the extremes, but only near clear support and resistance.
- In het kort: Use pullbacks for entries, not random mid-chart crosses.
- In het kort: Use divergence as a filter, not a standalone signal.
- In het kort: Confirm with a higher timeframe so your signals align with the bigger move.
- In het kort: Keep rules fixed for entries, exits, and risk so results stay measurable.
- Start with market type. Trend or range. Your RSI rules change with that choice.
- In an uptrend, RSI holding above 50 supports long bias. In a downtrend, RSI holding below 50 supports short bias.
- Use overbought and oversold levels as regime clues. Strong trends can stay “overbought” or “oversold” for a long time.
- Pullback setup: trade with the trend after RSI cools off and turns back in the trend direction. You avoid chasing.
- Divergence setup: require structure. Pair divergence with a break of the swing level or a clear rejection zone.
- Multi-timeframe check: align direction on the higher timeframe, then execute on the lower timeframe. You cut low-quality trades.
- Risk stays simple. Define your stop before you enter. Target a minimum R multiple, then track it. Use a fixed risk-reward ratio rule.
- Keep one playbook. Same RSI settings, same trigger, same stop logic. You make backtests and live results comparable.
What the RSI Indicator Really Measures (and What It Doesn’t)
Momentum explained in plain English, relative gains vs losses
RSI measures momentum. It compares your recent average gains to your recent average losses.
The standard RSI uses 14 periods. On a 1H chart, that means the last 14 hours. On a 5M chart, the last 70 minutes.
When gains outweigh losses, RSI rises. When losses outweigh gains, RSI falls. RSI does not measure how far price moved from a “fair value.” It measures the balance of recent buying pressure vs selling pressure.
RSI is bounded between 0 and 100. That range comes from the calculation. It does not mean price is “stuck” between limits.
Why RSI is not a trend indicator (but can help you trade trends)
RSI does not tell you the trend by itself. It does not read market structure. It does not mark higher highs and higher lows.
RSI reacts to price changes. Price leads, RSI follows. In forex, a strong directional move can keep RSI elevated or depressed for long stretches.
Use RSI as a filter and a trigger, not as your trend definition. Define trend with structure or a higher timeframe bias, then use RSI to time entries.
How RSI behaves in strong trends vs sideways markets
RSI behaves differently based on regime. Most losing RSI trades come from using the same overbought and oversold rules in both regimes.
| Market condition | Typical RSI behavior | What this means for your trades |
|---|---|---|
| Strong uptrend | RSI stays high. Pullbacks often hold above 40 to 50. Peaks often reach 70 to 85. | Do not auto-sell at 70. Look for buy setups on pullbacks and continuation. |
| Strong downtrend | RSI stays low. Rallies often fail below 50 to 60. Troughs often reach 15 to 30. | Do not auto-buy at 30. Look for sell setups on rallies and continuation. |
| Range, sideways | RSI swings more cleanly between 30 and 70. Mean reversion signals show up more often. | Classic 30 to 70 logic can work, but you still need a level and a stop. |
In trends, treat 50 as a momentum line. Above 50 favors bullish pressure. Below 50 favors bearish pressure. In ranges, treat 50 as noise and focus on the edges with price levels.
Common RSI myths that cause losing trades in forex
- Myth: RSI above 70 means price must drop. Reality: In trends, RSI can stay above 70 while price keeps rising. You end up shorting strength.
- Myth: RSI below 30 means price must bounce. Reality: In downtrends, RSI can stay below 30 and grind lower. You catch falling knives.
- Myth: Divergence equals reversal. Reality: Divergence is a warning, not a signal. It needs structure confirmation and a clear invalidation level.
- Myth: RSI gives precise entry and exit points. Reality: RSI is a condition filter. Your entry still needs price context, and your exit still needs a plan.
- Myth: One RSI setting works the same across all pairs and sessions. Reality: Volatility changes RSI behavior. London and New York can push RSI into extremes faster than Asia.
- Myth: Overbought and oversold means “too high” and “too low.” Reality: It means recent gains or losses dominate. It does not measure value.
If you want RSI to help, you must pair it with rules you can repeat. That includes risk rules. Use a fixed risk plan and follow it trade to trade, see risk management in forex.
RSI Formula and Calculation Basics (So You Can Trust the Signal)
RS and the smoothing method, what changes from candle to candle
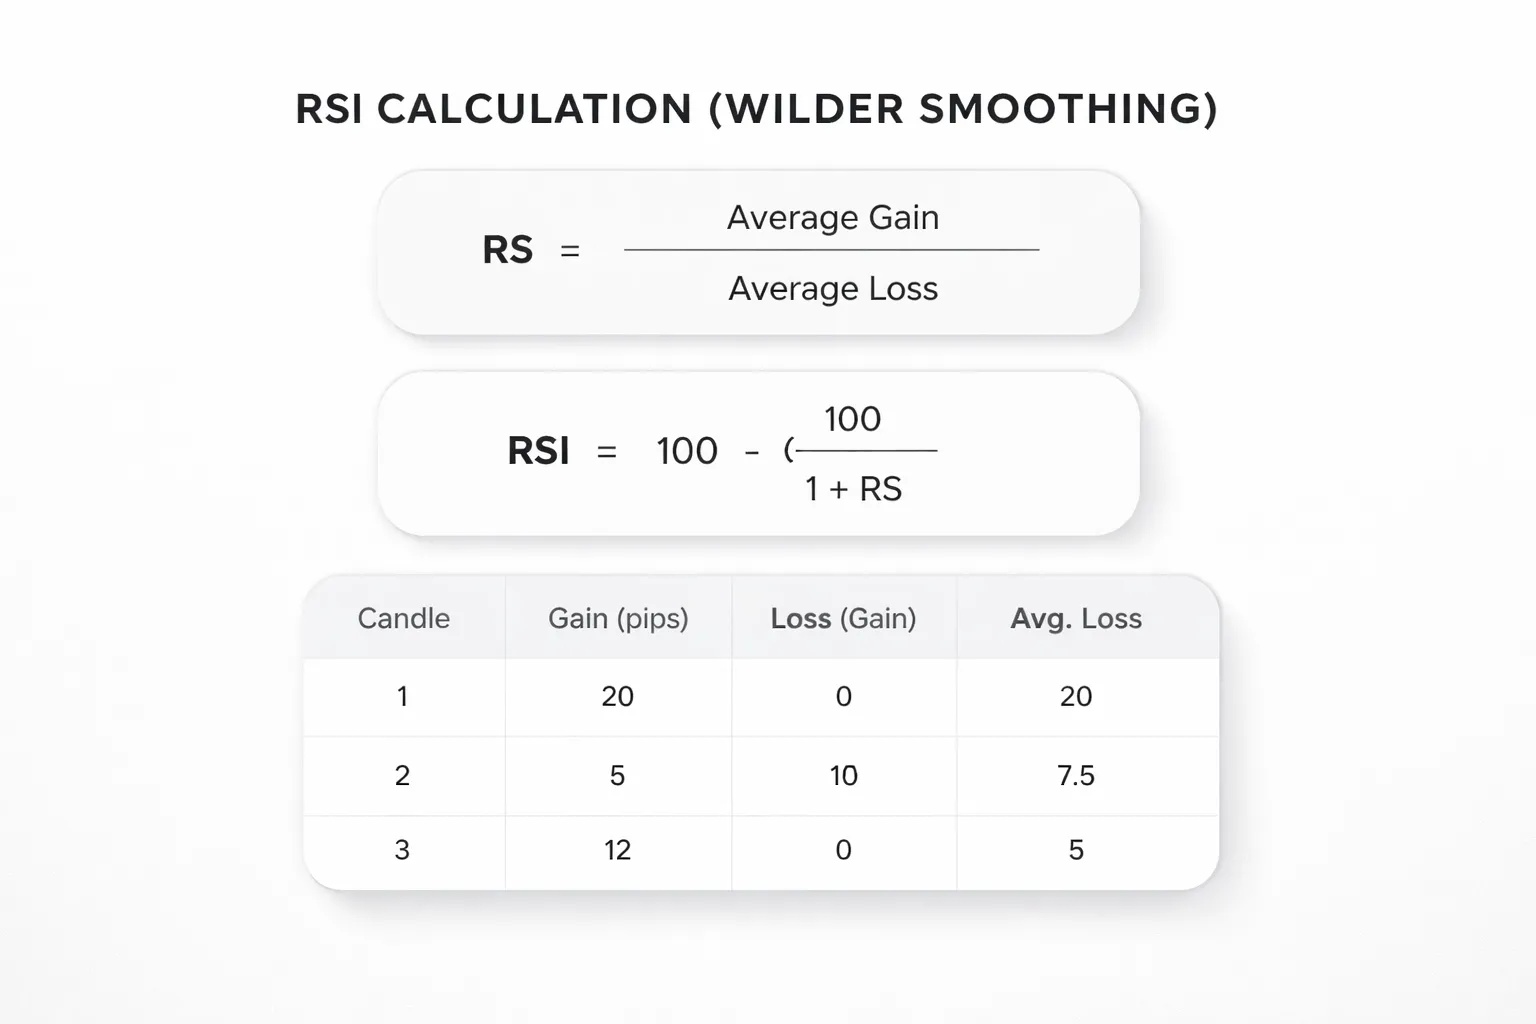
RSI is built from RS, the Relative Strength of recent gains versus recent losses.
RS = Average Gain / Average Loss
Then RSI converts RS to a 0 to 100 scale.
RSI = 100 - (100 / (1 + RS))
Most platforms use Wilder’s smoothing for the averages. It behaves like an EMA. It does not recalculate from scratch each candle after the first window.
With a 14-period RSI, you calculate the first averages from the first 14 closes.
- Average Gain (first) = sum of gains over 14 periods / 14
- Average Loss (first) = sum of losses over 14 periods / 14
After that, each new candle updates the averages with one step.
- Average Gain (new) = (previous average gain x 13 + current gain) / 14
- Average Loss (new) = (previous average loss x 13 + current loss) / 14
Only one new gain or loss enters, and most of the prior value stays. That is why RSI reacts fast to a shock candle, then cools slowly.
Why RSI can stick at extreme values, and what that implies
RSI can stay above 70 or below 30 for a long time because the smoothing keeps prior momentum in the averages.
Two mechanics cause the “stick.”
- Runs of same-color closes. A series of higher closes adds gains again and again while losses stay small. RS stays high, RSI stays high.
- Losses need size, not just frequency. A few small pullbacks may not lift average loss enough to drag RSI down.
What that means for your trading.
- Do not treat 70 or 30 as an automatic reversal trigger.
- In strong trends, extreme RSI often signals trend strength, not exhaustion.
- Wait for your rule-based confirmation, like a break of structure, a failed swing, or a clear exit plan. Use defined stop loss vs take profit levels so the “stick” does not trap you in a fade trade.
A quick manual example, so you interpret RSI moves realistically
Assume a 14-period RSI. Your current smoothed averages are:
- Average Gain = 0.00050
- Average Loss = 0.00025
Then:
- RS = 0.00050 / 0.00025 = 2.0
- RSI = 100 - 100 / (1 + 2.0) = 66.7
Next candle closes up by 0.00100. So current gain = 0.00100, current loss = 0.
- Average Gain (new) = (0.00050 x 13 + 0.00100) / 14 = 0.0005357
- Average Loss (new) = (0.00025 x 13 + 0) / 14 = 0.0002321
- RS (new) = 0.0005357 / 0.0002321 = 2.308
- RSI (new) = 100 - 100 / (1 + 2.308) = 69.8
One strong green candle moved RSI about 3 points. It did not “reset” the indicator.
Now the next candle pulls back by 0.00100. Current gain = 0, current loss = 0.00100.
- Average Gain (new) = (0.0005357 x 13 + 0) / 14 = 0.0004974
- Average Loss (new) = (0.0002321 x 13 + 0.00100) / 14 = 0.0002870
- RS (new) = 0.0004974 / 0.0002870 = 1.733
- RSI (new) = 100 - 100 / (1 + 1.733) = 63.4
One red candle dropped RSI about 6 points. That drop happened because the loss was large relative to the current smoothed loss, so it pulled the average up fast.
Use this mental model when you read RSI.
- RSI rises when new gains outsize the existing average gain.
- RSI falls when new losses outsize the existing average loss.
- RSI “sticks” when the new candles do not change the smoothed averages enough.
Best RSI Settings for Forex (Timeframe, Pair, and Volatility)
Default 14-Period vs Faster or Slower RSI
RSI(14) works because it balances speed and stability. It fits most forex pairs on M15 to H4.
Change the period when your trade horizon changes.
- RSI(7) to RSI(10), use when you trade fast charts, M1 to M15. You get earlier signals and more false signals. You must filter with trend and structure.
- RSI(14), use when you trade M15 to H4. You get fewer whipsaws and you still see momentum shifts.
- RSI(21) to RSI(28), use when you swing trade H4 to D1. You get cleaner trend context and later entries. You miss some reversals.
Do not optimize the period per pair until you have a repeatable rule set. If you change settings every week, you curve fit and you lose trust in your read.
Thresholds Beyond 30/70, Use 40/60 and 20/80
30/70 works best in ranges. Trends break it.
In strong trends, RSI often stays above 40 in uptrends and below 60 in downtrends. Use that.
- 40/60 for trend mode. In an uptrend, treat RSI pullbacks that hold above 40 as continuation strength. In a downtrend, treat rebounds that fail below 60 as continuation weakness.
- 30/70 for range mode. Use it when price rotates between clear support and resistance and RSI swings cleanly.
- 20/80 for extremes. Use it when the pair is volatile or the session is fast. It reduces noise and forces you to wait for real exhaustion.
Pick one regime rule. Example, if D1 trend is up, you use 40 as your “line in the sand” and you stop treating 70 as a sell signal.
Adapt RSI for Volatile Pairs and News Sessions
Volatility changes RSI behavior. Big candles can shove RSI to extremes and keep it there.
Adjust the rules, not your discipline.
- High-volatility pairs, GBPJPY, XAUUSD, some crosses. Use RSI(14) with 20/80 or RSI(21) with 30/70. This cuts the number of “fake” overbought and oversold reads.
- Low-volatility pairs, some majors in quiet sessions. RSI(10) to RSI(14) with 30/70 can work. You still need a clear range or structure trigger.
- News-driven sessions, CPI, NFP, rate decisions. RSI spikes fast because the new loss or gain dominates the average. Treat the first spike as information, not a signal. Wait for a retest and a candle close back through your key level, 40, 50, or 60.
If you cannot size stops to current volatility, do not trade the RSI signal. Use an ATR-based stop plan. Read the ATR indicator for forex guide.
Multi-Timeframe RSI Alignment, Higher-Timeframe Bias and Lower-Timeframe Trigger
Use one timeframe to define bias and one to time entries. Keep it simple.
- Bias timeframe, H4 or D1 for most traders. You want stability.
- Trigger timeframe, M15 or H1. You want a workable entry.
Rules you can apply:
- Bull bias. On the bias timeframe, RSI stays above 50, or pullbacks hold above 40. On the trigger timeframe, wait for RSI to dip and then reclaim 50, or reclaim 40 after a deeper pullback.
- Bear bias. On the bias timeframe, RSI stays below 50, or rebounds fail below 60. On the trigger timeframe, wait for RSI to pop and then lose 50, or lose 60 after a deeper rally.
This alignment keeps you from selling strength in an uptrend and buying weakness in a downtrend. It also reduces overtrading because you stop taking every 30/70 touch on the lower chart.
Reading RSI the Right Way: Signals That Matter
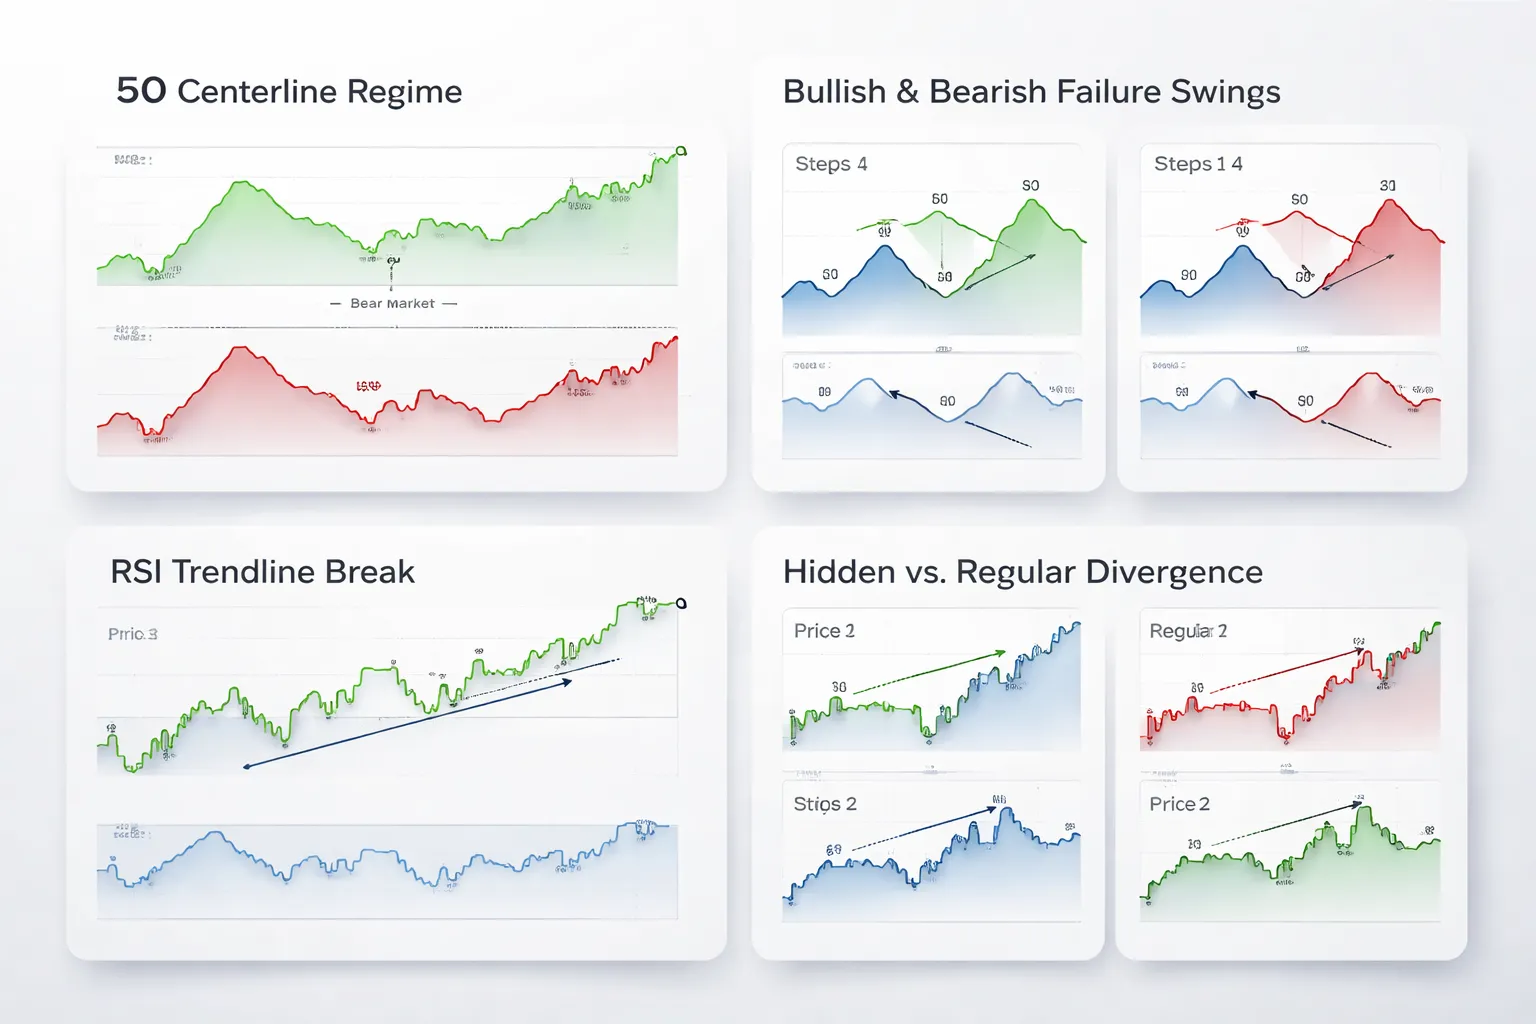
Centerline Logic (50-Level): Momentum Regime Shifts and Trend Confirmation
Stop treating RSI like a simple overbought, oversold tool. The 50-level matters more.
- RSI above 50 signals bullish momentum. You want long setups. You pass on most shorts.
- RSI below 50 signals bearish momentum. You want short setups. You pass on most longs.
Use 50 as a regime filter on your bias timeframe. Then use the trigger timeframe to time entries with a clean cross and hold.
- Bull regime confirmation: RSI breaks above 50 and stays above it. Pullbacks hold above 40 to 45. Rebounds reach 60 or higher.
- Bear regime confirmation: RSI breaks below 50 and stays below it. Rallies fail below 60. Pullbacks reach 40 or lower.
This keeps your trades aligned with momentum. It also cuts low-quality signals that cause churn. If you struggle with taking too many setups, read how to avoid overtrading.
Failure Swings: A Structured Signal Many Traders Ignore
Failure swings give you a clean RSI-only signal. You do not need divergence, and you do not need a price pattern. You need structure.
- Bullish failure swing: RSI drops below 30, rallies above 30, pulls back but holds above 30, then breaks the prior RSI swing high.
- Bearish failure swing: RSI pushes above 70, drops below 70, rallies but fails below 70, then breaks the prior RSI swing low.
Trade it with the trend filter. In an uptrend, a bullish failure swing works best when RSI also reclaims 50 soon after. In a downtrend, a bearish failure swing works best when RSI also loses 50 soon after.
Failure swings matter because they show a momentum reset and a momentum break in the same sequence. You get a trigger and confirmation without guessing.
RSI Trendlines and Breaks: Using Momentum Structure as a Leading Clue
You can draw trendlines on RSI like you do on price. RSI trendlines often break before price does. That gives you an early clue, not a trade by itself.
- In a bull regime, draw an RSI uptrend line across rising RSI swing lows. A clean break warns that the push is weakening.
- In a bear regime, draw an RSI downtrend line across falling RSI swing highs. A clean break warns that selling pressure is fading.
Use the break as a condition, then require follow-through with the centerline.
- Bull continuation: RSI breaks its downtrend line, then holds above 50.
- Bear continuation: RSI breaks its uptrend line, then holds below 50.
This keeps you from acting on one candle. You wait for momentum to flip and stay flipped.
Hidden Divergence vs Regular Divergence: Continuation vs Reversal Context
Most traders use divergence as a reversal call. That is the hard way to use it.
Regular divergence often fights the trend. Hidden divergence often aligns with it.
- Regular bullish divergence (reversal context): price makes a lower low, RSI makes a higher low. It can mark a bottom. It fails often in strong downtrends.
- Regular bearish divergence (reversal context): price makes a higher high, RSI makes a lower high. It can mark a top. It fails often in strong uptrends.
- Hidden bullish divergence (continuation context): price makes a higher low, RSI makes a lower low. It often signals a pullback end in an uptrend.
- Hidden bearish divergence (continuation context): price makes a lower high, RSI makes a higher high. It often signals a rally end in a downtrend.
Combine divergence with the 50-level to avoid false calls.
- For hidden bullish divergence, you want RSI to hold above 50 or reclaim it quickly after the signal.
- For hidden bearish divergence, you want RSI to hold below 50 or lose it quickly after the signal.
Divergence is a clue. The centerline decides the regime. The trigger timeframe decides the entry.
Build a Complete RSI Indicator Forex Strategy (Rules, Not Hunches)
Build a Complete RSI Indicator Forex Strategy (Rules, Not Hunches)
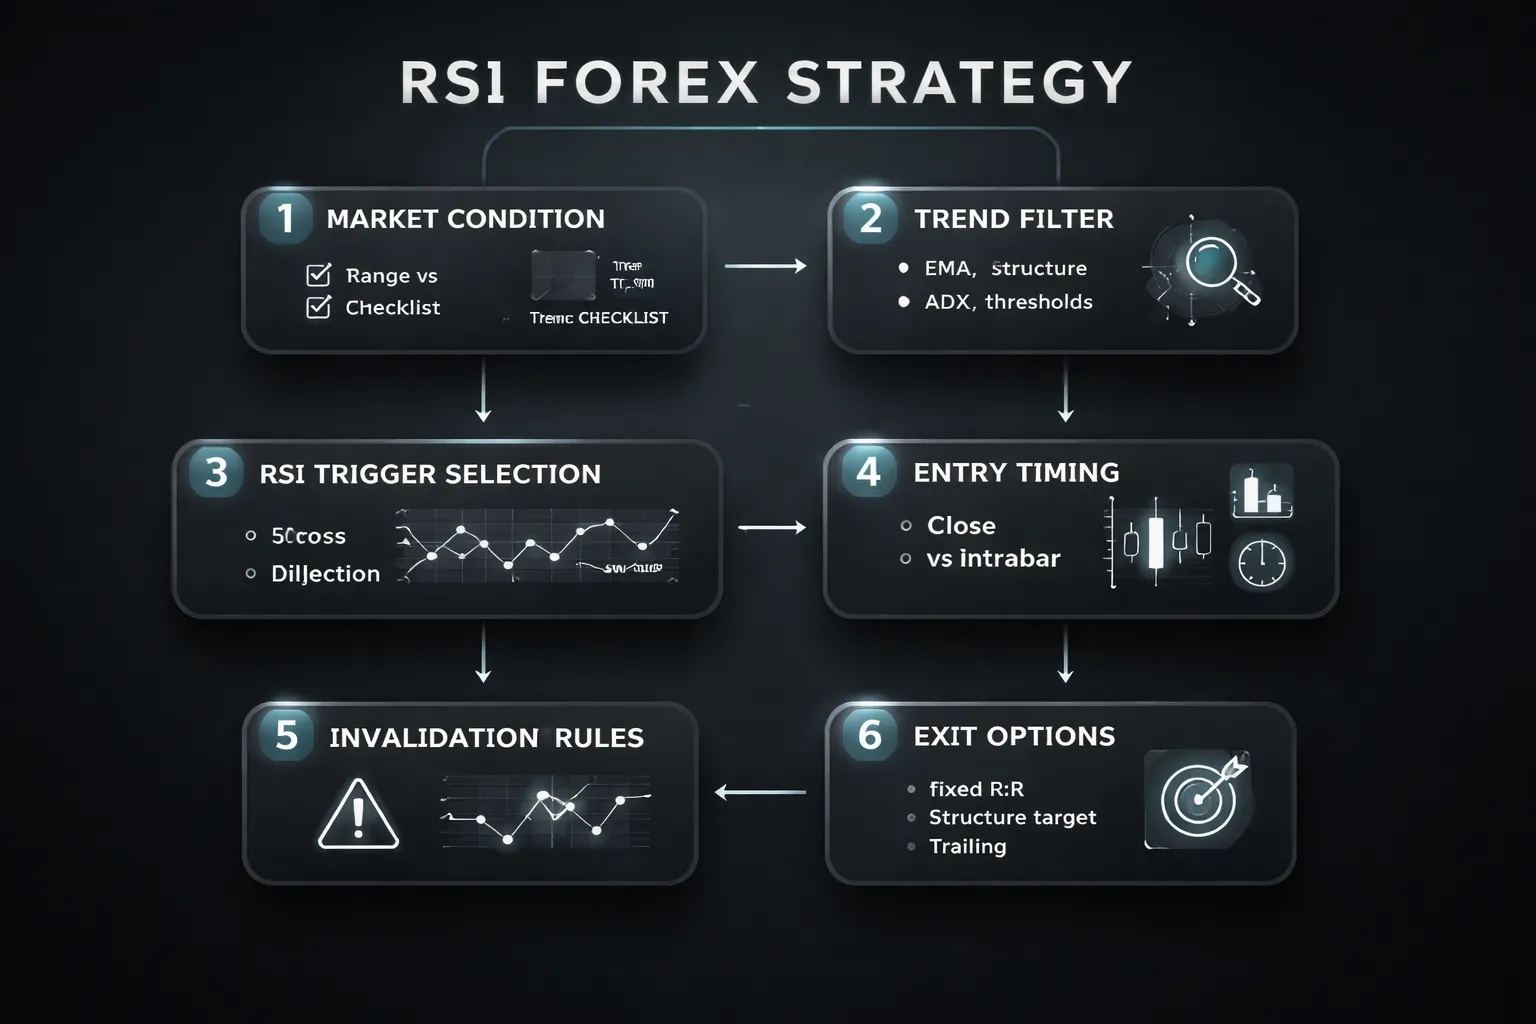
1) Define the market condition first, range-bound vs trending
RSI fails when you trade the wrong environment. Start with a quick checklist. Label the market, then pick the RSI trigger that fits.
- Range-bound checklist, price makes similar highs and lows, no clean higher highs or lower lows, repeated rejections at the same levels, RSI crosses 50 often.
- Trending checklist, price prints higher highs and higher lows for an uptrend, or lower lows and lower highs for a downtrend, pullbacks look controlled, RSI stays mostly above 50 in uptrends or below 50 in downtrends.
- Rule, use mean reversion RSI triggers in ranges, use momentum and pullback RSI triggers in trends.
2) Choose one trend filter, and stick to it
A trend filter stops you from shorting every overbought print in an uptrend, and buying every oversold print in a downtrend. You need one filter that defines direction and avoids mixed signals.
- Moving averages, simple and fast. Define trend as price above a rising 200 EMA for longs, below a falling 200 EMA for shorts. Add a 50 EMA to time pullbacks. You trade with the slope, not the touch.
- Market structure, clean and accurate. Longs only after a higher high and higher low on your higher timeframe. Shorts only after a lower low and lower high. This keeps your RSI signals aligned with price reality.
- ADX, helps you decide range vs trend. Use ADX(14). If ADX is below 20, treat it as range conditions. If ADX is above 25, treat it as trend conditions. This matters because RSI overbought and oversold can persist when ADX stays high.
3) Select your RSI trigger, cross, rejection, divergence, or failure swing
Pick one primary trigger. Add one confirmation. More signals usually means more discretion.
| Trigger | Best environment | Clear rule |
|---|---|---|
| 50-level cross | New trend phase | Long when RSI closes above 50 and price is in bullish regime by your filter. Short when RSI closes below 50 and price is in bearish regime. |
| 50-level rejection | Trend pullbacks | In an uptrend, RSI dips below 50 then closes back above 50. In a downtrend, RSI pops above 50 then closes back below 50. |
| Divergence | Pullback continuation, not blind reversal | Hidden bullish divergence plus RSI holding above 50 favors continuation longs. Hidden bearish divergence plus RSI holding below 50 favors continuation shorts. |
| Failure swing | Range turns | Bullish, RSI makes a low below 30, bounces, pulls back above 30, then breaks the prior RSI swing high. Bearish is the inverse around 70. |
4) Entry timing, candle-close confirmation vs intrabar
Your entry rule decides your consistency. Intrabar entries feel better, but they produce more false triggers.
- Candle-close confirmation, you enter after the RSI signal candle closes. You trade fewer signals. You avoid most repaint style noise.
- Intrabar entry, you enter the moment RSI crosses a level. You get earlier fills. You also take more failed crosses. If you use intrabar, you need a second rule, like price must also close beyond a structure level.
- Simple rule, test with close-only signals first. Add intrabar entries only if data proves it improves your results.
5) Invalidation logic, where the idea is wrong before the stop
Stops protect capital. Invalidation protects your thesis. Define both, before you enter.
- Regime invalidation, if you took a long because RSI reclaimed 50 in an uptrend, the idea breaks if RSI closes back below 50 and stays there for one full bar, or your trend filter flips.
- Signal invalidation, if you entered on a 50 rejection, the idea breaks if RSI fails to hold the reclaim and price breaks the pullback low.
- Divergence invalidation, if you used hidden divergence for continuation, the idea breaks if RSI loses the centerline and price breaks the structure that defined the trend leg.
- Execution rule, when invalidation hits, you exit or cut risk. Do not wait for the full stop if the setup no longer exists.
6) Exit plan options, fixed R:R, structure targets, trailing
Choose one exit model per strategy. Mix-and-match exits produces random results.
- Fixed risk to reward, take profit at a preset multiple, like 1.5R or 2R. This fits systematic testing and keeps decisions simple. Learn the math behind it in risk-reward ratio.
- Structure-based targets, target the next opposing level, prior swing high or low, or a range boundary. This fits markets that respect clean levels. You must define the exact level before entry.
- Trailing methods, follow the trend until it ends. Trail behind the last swing in price, behind a moving average like the 20 EMA, or use an RSI rule like exit long on RSI close back below 50 in a trend strategy. Trailing works best when the trend filter says trend, not range.
Put it together as a ruleset, market condition, one trend filter, one RSI trigger, entry timing at close, invalidation, then exit. If any piece is missing, you are trading your mood.
RSI Strategy #1: Trend-Following Pullbacks (High-Probability Use Case)
RSI Strategy #1: Trend-Following Pullbacks (High-Probability Use Case)
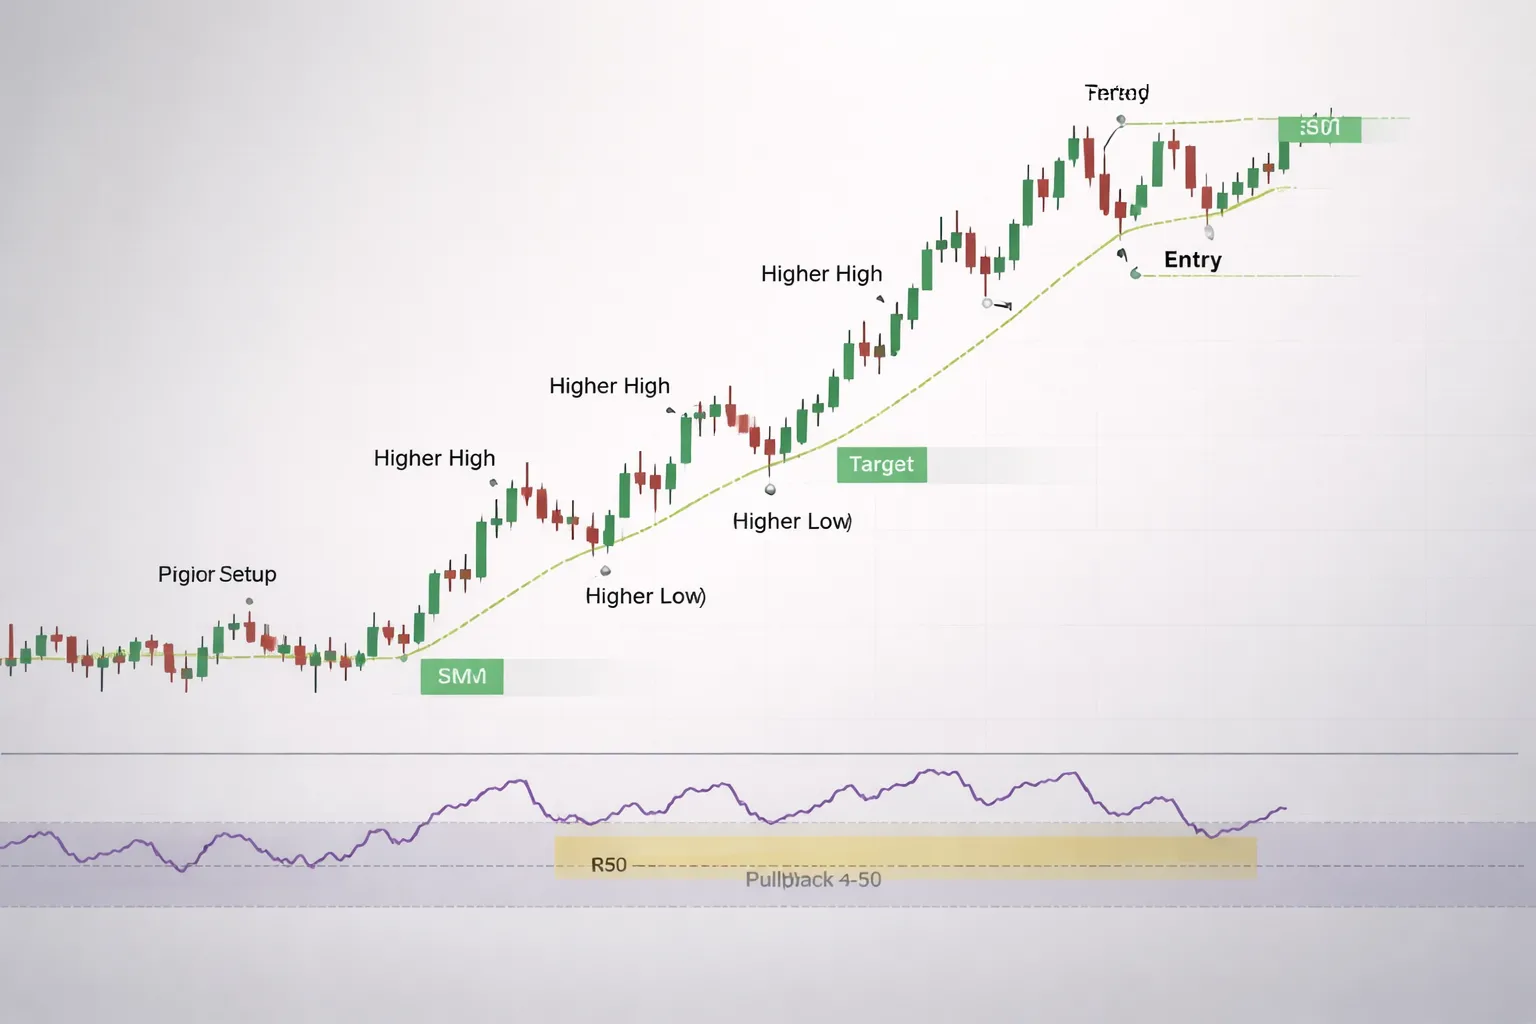
This RSI setup works when price trends and you buy or sell pullbacks. You do not trade it in ranges. You use RSI to time the pullback entry, not to call tops and bottoms.
Market condition and trend definition (price structure first)
Define trend with structure, not feelings.
- Uptrend: higher highs and higher lows. Price holds above the last higher low.
- Downtrend: lower highs and lower lows. Price holds below the last lower high.
- No trade: mixed structure. Equal highs and equal lows. Choppy overlap.
Trend filter (pick one and stick to it)
Use one filter so you do not curve-fit.
- 20 EMA filter: long only if price closes above the 20 EMA. Short only if price closes below the 20 EMA.
RSI pullback zones (the core rule)
RSI behaves differently in trends. You want the pullback zone, not the oversold or overbought headline.
- Uptrend pullback zone: RSI drops into 40 to 50, then turns back up.
- Downtrend pullback zone: RSI rallies into 50 to 60, then turns back down.
This keeps you trading with the path of least resistance. It also filters many weak countertrend signals.
Entry trigger (RSI reclaim plus minor structure break)
Do not enter just because RSI touches a level. You need momentum back and a price confirmation.
- Long setup: trend is up. RSI pulls into 40 to 50. Then RSI closes back above 50. Enter on the candle close that also breaks above a minor lower high from the pullback.
- Short setup: trend is down. RSI pulls into 50 to 60. Then RSI closes back below 50. Enter on the candle close that also breaks below a minor higher low from the pullback.
Minor structure means the small swing created during the pullback, not the major trend swing. You want proof that the pullback ended.
Invalidation and stop-loss placement
Your stop goes where the idea is wrong. Choose one method and apply it consistently.
- Swing-based stop: for longs, stop below the pullback swing low. For shorts, stop above the pullback swing high. This matches structure.
- ATR-based stop: place the stop 1.5 to 2.5 ATR(14) beyond your entry, in the direction that gives the trade room. Use this when swings are tight or noisy.
Invalidation also includes trend break. If an uptrend prints a lower low, you stop taking long pullbacks until structure resets.
Take-profit logic (simple, repeatable)
Use exits that match trend trading. You want clean targets and controlled management.
- Primary target: prior swing high in an uptrend, prior swing low in a downtrend.
- Extension target: measured move of the pullback leg, or a 1.5R to 3R objective based on your stop size.
- Partials: take partial profit at the prior high or low, then trail the rest behind the last swing or behind the 20 EMA.
- RSI exit rule option: in longs, exit the remainder if RSI closes back below 50. In shorts, exit if RSI closes back above 50.
Track your risk-reward ratio per setup. Pullback trend trades often win less than 100 percent of the time. Your R multiple keeps the math on your side.
Ruleset summary (use this as your checklist)
| Component | Long | Short |
|---|---|---|
| Market | Higher highs, higher lows | Lower highs, lower lows |
| Trend filter | Close above 20 EMA | Close below 20 EMA |
| RSI pullback zone | RSI 40 to 50 | RSI 50 to 60 |
| Trigger | RSI close above 50 plus break of minor pullback high, enter at close | RSI close below 50 plus break of minor pullback low, enter at close |
| Stop | Below pullback swing low or 1.5 to 2.5 ATR | Above pullback swing high or 1.5 to 2.5 ATR |
| Exit | Prior high, then trail, optional RSI close below 50 | Prior low, then trail, optional RSI close above 50 |
RSI Strategy #2: Range Trading with RSI (Mean Reversion Done Safely)
How to confirm a true range
Mean reversion works best when price moves sideways and volatility drops. Do not trade RSI extremes inside a trend. Your first job is to prove you have a range.
- Mark clean boundaries. Draw horizontal support and resistance from at least two recent touches on each side. Ignore levels that only worked once.
- Check spacing. The range should have room for profit. If the distance between support and resistance is smaller than your stop, skip it.
- Look for volatility contraction. ATR should flatten or fall. Candle sizes should shrink. Wicks often increase near the edges.
- Avoid one sided structure. If highs keep printing higher, or lows keep printing lower, you have a trend or a breakout setup, not a range.
Using 30/70 vs 20/80 to prevent premature entries
RSI can stay extreme while price keeps pushing into the range boundary. Using tighter thresholds cuts false signals.
- Use 30/70 for wide, stable ranges. This fits higher timeframes and ranges with clear swings. You get more trades, but more early entries.
- Use 20/80 for messy ranges. This forces deeper exhaustion before you act. You get fewer trades, but better location near the boundary.
- Match thresholds to volatility. Higher ATR, use 20/80 more often. Lower ATR, 30/70 can work.
- Do not fade the middle. Only look for RSI signals near support or resistance. RSI by itself is not a range signal.
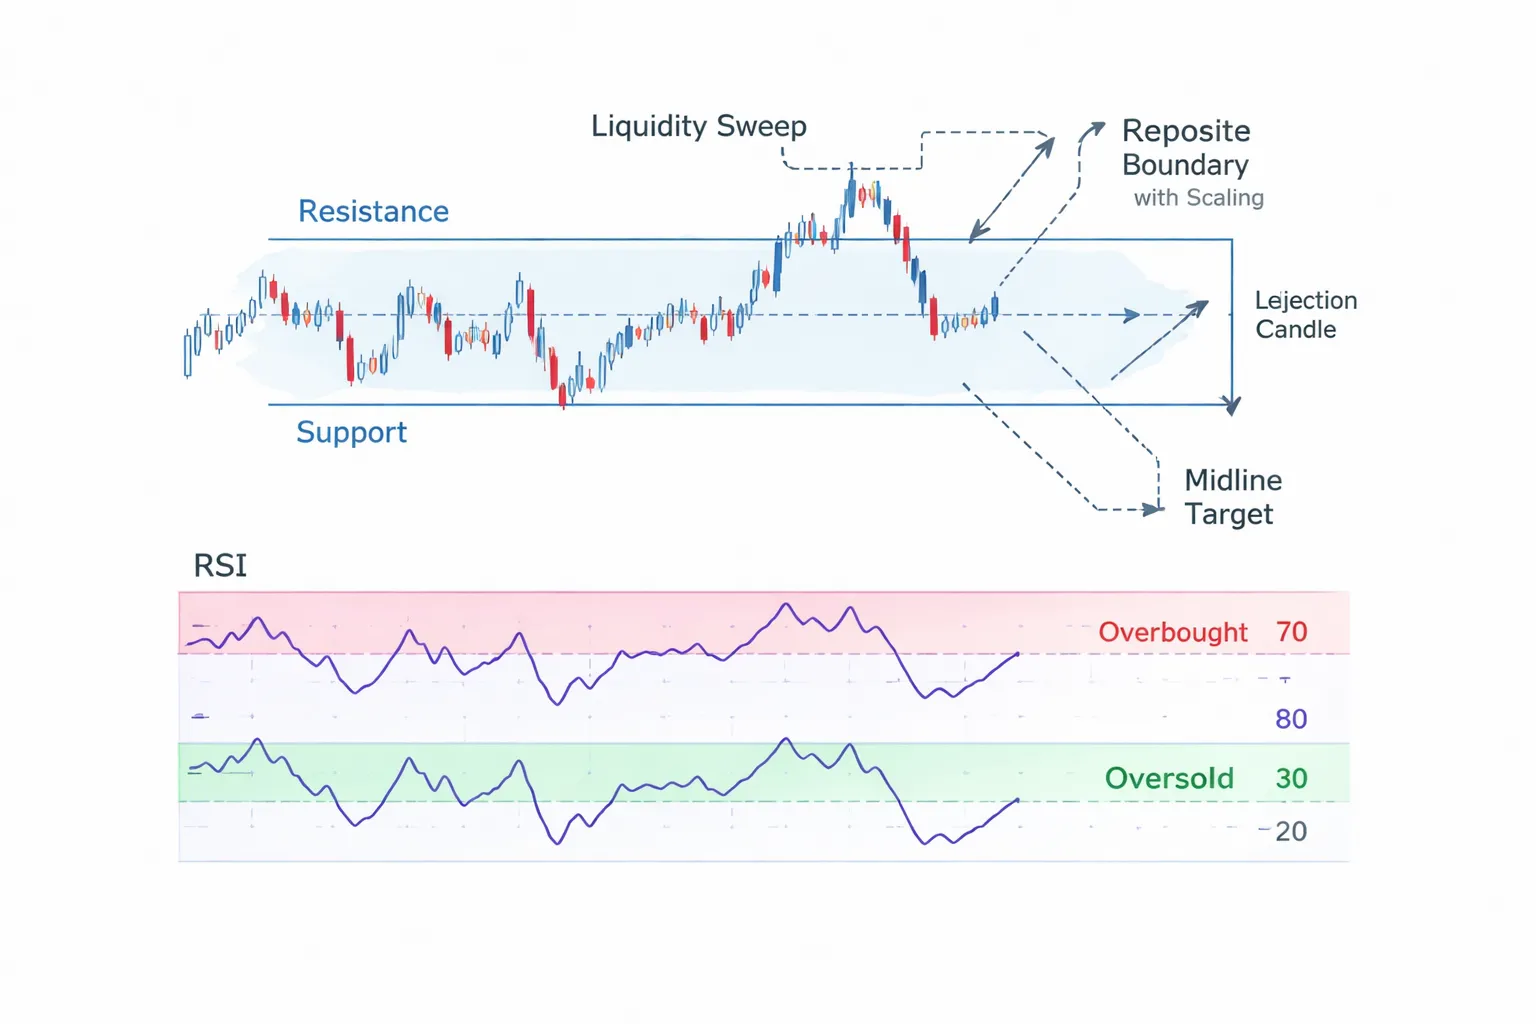
Add a confirmation layer: rejection candles and liquidity sweeps
You need proof that the boundary held. RSI gives you a condition, price action gives you the trigger.
- Rejection candle at the boundary. Long wick into support or resistance, close back inside the range. The close matters more than the wick.
- Liquidity sweep. Price breaks the boundary intrabar, then snaps back and closes inside. This often traps breakout traders and fuels the reversal.
- RSI alignment. For longs, RSI should be oversold and turning up. For shorts, RSI should be overbought and turning down.
- Entry timing. Enter at the close of the rejection candle, or on a break of its high for longs, or low for shorts. Use a stop order if you want confirmation.
If you need a refresher on order placement, review these forex order types.
Range exits: midline targets vs opposite boundary with scaling
Range trades fail when you hold for too much. Use structured exits that match the range size and volatility.
- Conservative exit, midline target. Take profit at the 50 percent level of the range. This boosts win rate and reduces time in trade.
- Aggressive exit, opposite boundary. Hold for the other side of the range when the move starts with a sweep plus strong rejection.
- Scale out. Take partial at the midline, then trail the rest toward the far boundary. This locks profit and keeps upside.
- Stop placement. Put your stop beyond the sweep wick or beyond the boundary plus a volatility buffer. If price closes outside the range and holds, exit.
- Track your R multiple. Skip trades that cannot reach at least 1.5R to the midline, or 2R to the opposite boundary. Use a consistent risk-reward ratio framework.
RSI Strategy #3: Divergence Trading (Reversals with Confirmation)
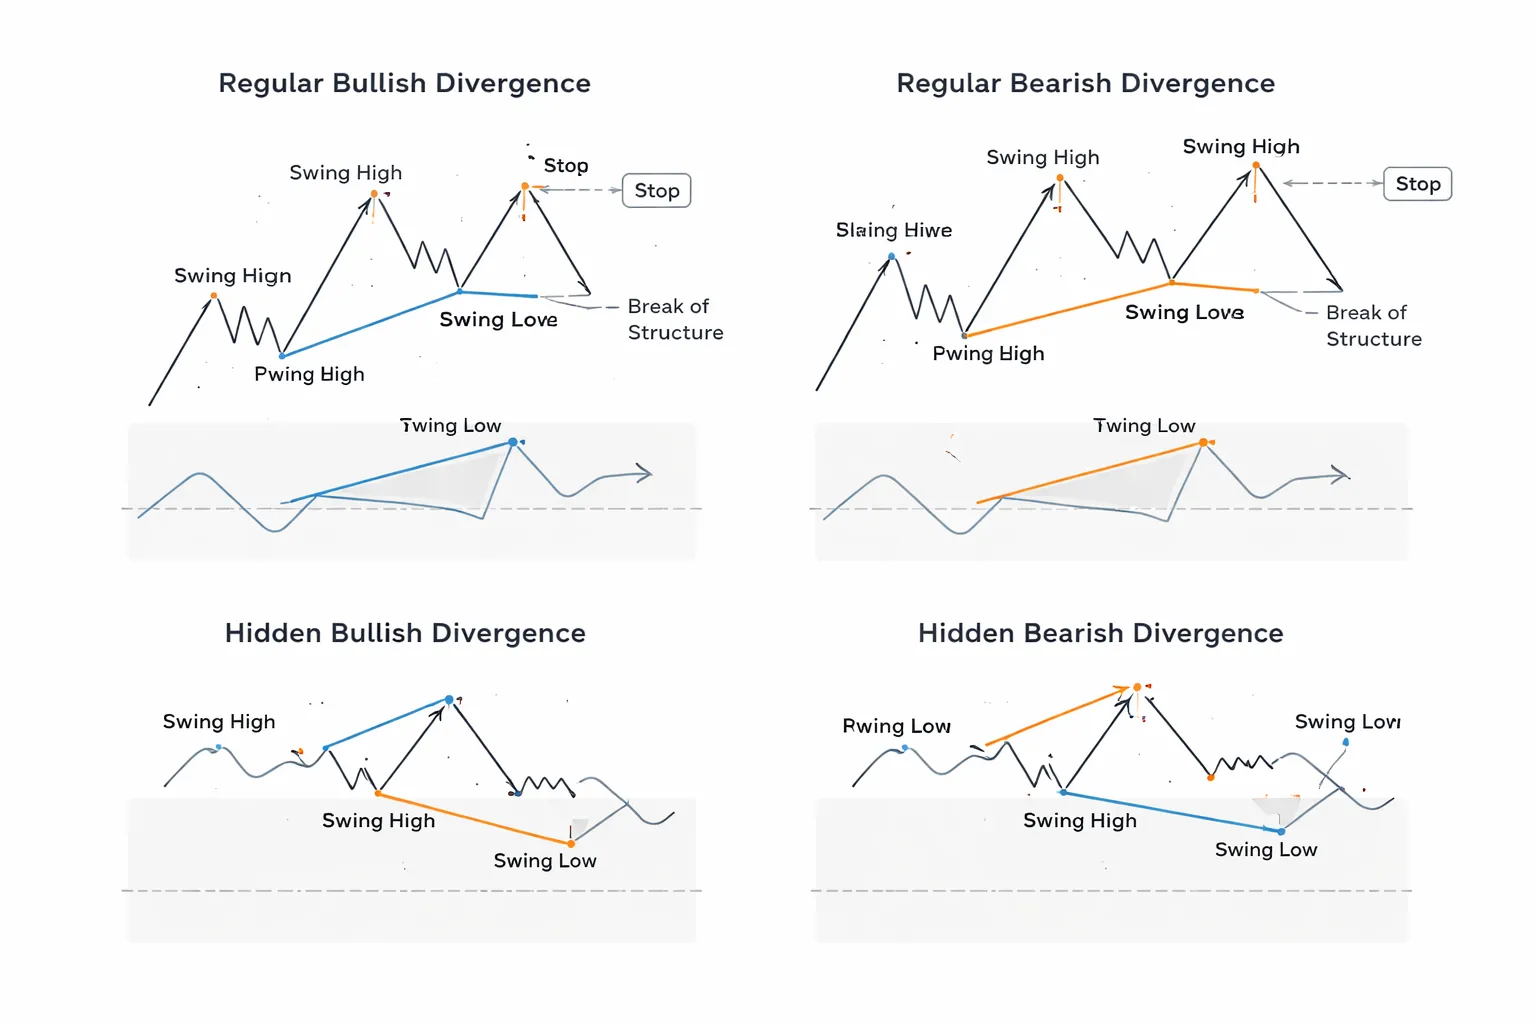
Regular Divergence, Reversal Signal With Limits
Regular divergence forms when price and RSI disagree at a swing point.
- Regular bullish divergence: price makes a lower low, RSI makes a higher low. It signals selling pressure is weakening.
- Regular bearish divergence: price makes a higher high, RSI makes a lower high. It signals buying pressure is weakening.
Divergence does not mean price will reverse right away. It does not mark the exact top or bottom. In strong trends, divergence can persist while price keeps pushing.
Hidden Divergence, Trend Continuation Setups
Hidden divergence fits pullbacks inside an existing trend. You use it to rejoin the trend, not to fade it.
- Hidden bullish divergence: price makes a higher low, RSI makes a lower low. It supports trend continuation in an uptrend.
- Hidden bearish divergence: price makes a lower high, RSI makes a higher high. It supports trend continuation in a downtrend.
You need a clear trend first. Define it with swing structure, higher highs and higher lows, or lower highs and lower lows. Skip hidden divergence in choppy ranges.
Confirmation Tools That Keep You Out of Early Entries
Trade divergence only after price confirms. Use one clean trigger. Avoid stacking indicators.
- Structure break: after bullish divergence, wait for price to break the last lower high. After bearish divergence, wait for price to break the last higher low.
- Trendline break: draw a simple trendline across the pullback swings. Enter after a decisive break and a retest that holds.
- MA reclaim: use a single moving average as a filter. For bullish setups, wait for price to reclaim and hold above it. For bearish setups, wait for price to lose and hold below it.
If you want a candle trigger, use a single reversal pattern at the swing, then confirm it with the structure break. Keep it simple. See common patterns in candlestick patterns.
Risk Management for Divergence, Stops Must Respect the Swing
Divergence trades fail when you place stops where noise lives. Your stop must sit beyond the swing point that created the divergence.
- Regular bullish divergence: stop below the swing low. Add a volatility buffer based on your market, or a recent average range.
- Regular bearish divergence: stop above the swing high. Add the same buffer.
- Hidden divergence: stop beyond the pullback swing that should hold if the trend continues.
Plan targets before entry. First target sits at the next structure level, prior swing high or low, midline of the range, or a key moving average. Take partials there. Trail the rest behind new swing points. Do not hold if price breaks back through the level that confirmed your entry.
| Setup | Signal | Entry Trigger | Stop Location |
|---|---|---|---|
| Regular bullish divergence | Lower low in price, higher low in RSI | Break of last lower high, or trendline break | Below divergence swing low plus buffer |
| Regular bearish divergence | Higher high in price, lower high in RSI | Break of last higher low, or trendline break | Above divergence swing high plus buffer |
| Hidden bullish divergence | Higher low in price, lower low in RSI | Pullback ends, then reclaim of structure or MA | Below pullback swing low plus buffer |
| Hidden bearish divergence | Lower high in price, higher high in RSI | Pullback ends, then loss of structure or MA | Above pullback swing high plus buffer |
RSI Strategy #4: 80/20 Breakout-to-Reversal (When Extremes Actually Work)
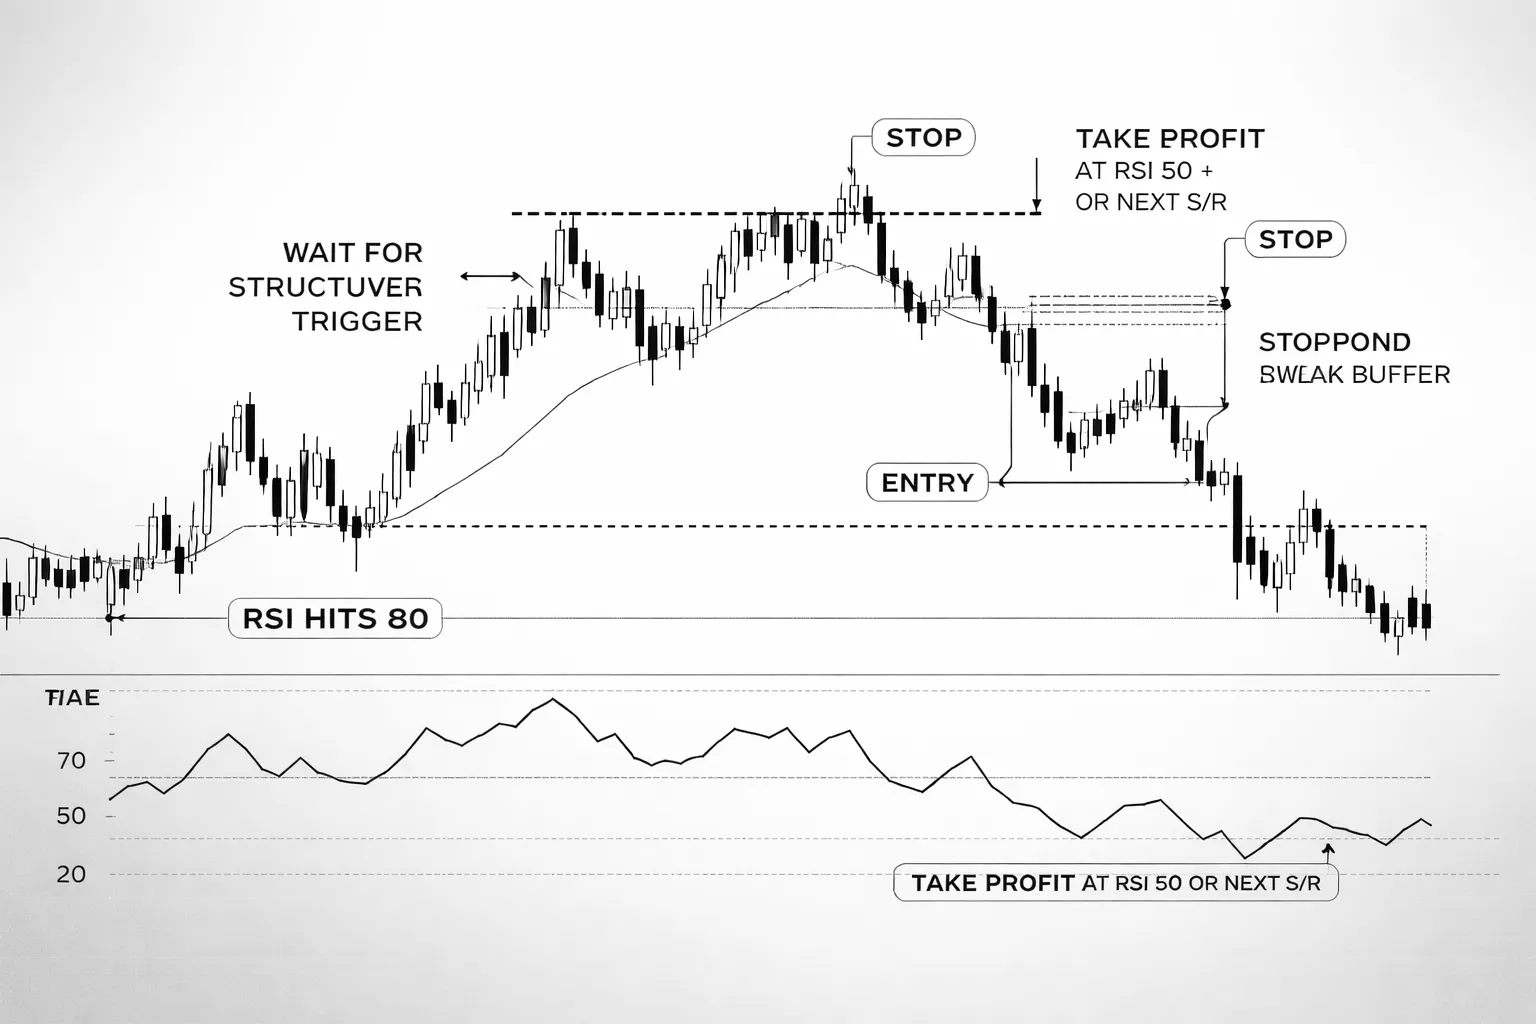
When to Use Extreme Thresholds
The 80/20 RSI levels work best in two conditions.
- Strong impulse: Price pushes hard in one direction with large candles and little pullback. RSI reaches 80 or 20 fast.
- Clear exhaustion: The impulse stalls at a known level. Price prints rejection, small bodies, or a final spike. RSI stays extreme but stops expanding.
Skip this strategy in clean trends with no nearby level. RSI can stay above 80 or below 20 longer than your account can stay patient.
Entry Logic: Extreme RSI Plus a Trigger
Do not fade the first touch of 80 or 20. You need a price action trigger.
- Short setup: RSI hits 80+. Price tags a higher timeframe level or session high. You enter after a bearish trigger, like a break below the last minor higher low, or a bearish engulfing close. Conservative entry waits for a lower high to form.
- Long setup: RSI hits 20-. Price tags a higher timeframe level or session low. You enter after a bullish trigger, like a break above the last minor lower high, or a bullish engulfing close. Conservative entry waits for a higher low to form.
Think in two steps. Extreme first, trigger second. This keeps you out of most blind reversals that never reverse.
Filtering False Reversals
Most losses come from taking extremes in the wrong place or time.
- Trade near liquid sessions: London open, London to New York overlap, New York open. Avoid late session chop where RSI spikes on thin moves.
- Use higher timeframe levels: Mark the prior day high and low, weekly open, and obvious H4 swing points. Extremes mean more when they occur at these levels.
- Respect trend context: In a strong uptrend, treat RSI 80 as a warning, not a sell signal. Take shorts only when price breaks structure. In a strong downtrend, do the same for RSI 20.
- Check distance to the mean: If price already snapped back to the 20 EMA or a mid-range level, you missed the edge. Do not chase.
Exit Logic: Mean Return vs Structural Target
You have two clean exit plans. Pick one before you enter.
- Mean return exit: Take profit when RSI returns to 50, or when price reaches the midline of the prior range. This fits fast reversals and keeps you from overstaying.
- Structural target exit: Target the next support or resistance, like the opposite side of the range, a prior swing, or the daily open. This fits reversals that turn into real moves.
Place your stop beyond the extreme swing point that created the setup, plus a small buffer. If price breaks that point, the reversal failed. Keep position size fixed and risk capped, use the same rules from this forex risk management guide.
| Rule | Long (RSI 20) | Short (RSI 80) |
|---|---|---|
| Location | At support, prior low, or session low | At resistance, prior high, or session high |
| Trigger | Break above minor lower high, or bullish engulfing close | Break below minor higher low, or bearish engulfing close |
| Stop | Below the extreme low plus buffer | Above the extreme high plus buffer |
| Take profit | RSI back to 50, or next resistance level | RSI back to 50, or next support level |
RSI Confluence: Combining RSI with Other Tools (Without Indicator Overload)
RSI + Market Structure, the Simplest, Most Robust Pairing
Start with structure. Use RSI second. Structure tells you where price has to react, RSI tells you if momentum supports the reaction.
- Mark levels first. Prior day high and low, session high and low, clean swing highs and lows.
- Trade from a level, not from RSI. You want RSI oversold near support, RSI overbought near resistance.
- Use RSI 50 as a filter. Above 50 favors longs, below 50 favors shorts. In ranges, 50 works as a mean reversion magnet.
- Use divergence as a warning, not a trigger. Wait for a structure break or rejection candle.
This pairing stays clean. It avoids indicator stacking. Price gives the setup, RSI confirms timing.
RSI + MACD, Momentum Confirmation vs Redundancy
RSI and MACD both measure momentum. That creates overlap. Use MACD only if you define one job for it.
- Use MACD for trend momentum. Prefer longs when MACD histogram stays above zero, prefer shorts when it stays below.
- Use RSI for pullback timing. In an uptrend, you want RSI dips to the 40 to 50 zone, then a turn up. In a downtrend, look for 50 to 60 zone failures.
- Avoid double confirmation. If you wait for RSI oversold, MACD cross, and histogram flip, you enter late and miss the move.
If MACD does not change your decision, remove it.
RSI + Moving Averages, Trend Bias and Pullback Validation
Moving averages help you trade RSI the right way. They stop you from fading strong trends.
- Pick one trend MA. Use 50 EMA or 200 EMA. Do not stack three averages.
- Define bias. Price above the MA, you look for long setups. Price below, you look for short setups.
- Validate pullbacks. In an uptrend, RSI often holds above 40. In a downtrend, RSI often holds below 60.
- Use 50 RSI to stay with trend. In trends, RSI often respects 50 as support or resistance.
This creates a simple rule set, trend first, RSI second.
RSI + Candlestick Patterns, Which Add Edge and Which Are Noise
Candles help you time entries after RSI reaches a zone. Focus on a few patterns that show real order flow.
- Patterns that add edge. Bullish and bearish engulfing closes at key levels, pin bars with clear rejection wicks, strong closes back inside a level after a sweep.
- How to use them. Let RSI define the condition, overbought or oversold near structure. Let the candle define the trigger, strong close and follow through.
- Patterns that are often noise. Doji clusters, weak inside bars without a level, random two candle names in the middle of a range.
Keep it strict. Pattern plus level plus RSI zone. If one piece is missing, skip the trade. Use this candlestick charts guide if you need a quick refresher on clean pattern definitions.
RSI + ATR, Volatility Based Stops and Position Sizing
ATR fixes a common RSI mistake, stops that ignore volatility. Use ATR to size your stop and your position.
- Set the stop with structure plus ATR. Place the stop beyond the swing extreme, then add a buffer like 0.5 to 1.0 ATR.
- Keep risk consistent. If ATR expands, your stop grows, your position size shrinks. If ATR contracts, your stop shrinks, your position size grows.
- Avoid tight stops in high ATR. RSI can stay overbought or oversold longer when volatility rises. ATR helps you survive the noise.
| Market state | ATR behavior | Adjustment |
|---|---|---|
| High volatility | ATR rising | Wider stop, smaller size, fewer trades |
| Low volatility | ATR falling | Tighter stop, normal size, focus on clean levels |
Risk Management for Any RSI Indicator Forex Strategy
Position sizing basics, risk per trade and account protection
RSI gives signals. Risk rules keep you in the game.
Set a fixed risk per trade. Use a small number. Most retail traders stay in the 0.25% to 1% range. Go lower when you trade higher timeframes with wide stops, or when your drawdown grows.
Calculate position size from your stop distance, not from how strong the RSI signal looks.
- Step 1: Choose risk per trade in dollars.
- Step 2: Define stop distance in pips or points.
- Step 3: Convert to position size so a stop-out equals your risk.
Protect the account with hard limits.
- Daily loss limit: stop trading after 2R to 3R down.
- Weekly loss limit: reduce size or stop after 5R to 8R down.
- Max open risk: cap total risk across positions, often 1R to 2R at once.
Stop-loss types, hard stops, technical stops, and time-based stops
Use a hard stop on every trade. Do not manage risk with mental stops. Fast markets will punish it.
- Hard stop: a fixed stop placed at entry. It defines your risk. It must sit in the market from the start.
- Technical stop: placed beyond a level that should hold if your setup is valid. Examples include the swing high or low, a structure break level, or a pattern boundary from chart patterns.
- Time-based stop: exit if price does not move in your direction within a set number of candles. This cuts slow trades that tie up risk and often drift into chop where RSI flips.
Match stop type to your RSI use case.
- If you trade RSI mean reversion, use a technical stop beyond the extreme that invalidates the bounce.
- If you trade RSI trend pullbacks, use a technical stop beyond the last swing that defines the trend leg.
- If RSI gives frequent signals in a range, add a time stop to avoid death by small losses and spread.
R-multiples and expectancy, how to evaluate whether the strategy works
Track results in R, not in pips. R equals your initial risk.
- 1R loss means you hit your stop.
- 2R win means you made twice your risk.
Expectancy tells you if the strategy has an edge.
Expectancy (in R) = (Win rate × Avg win in R) − (Loss rate × Avg loss in R).
Example:
- Win rate 40%.
- Average win 2.5R.
- Average loss 1R.
Expectancy = (0.40 × 2.5) − (0.60 × 1) = 1.0 − 0.6 = +0.4R per trade.
Track at least 50 to 100 trades per setup. Separate results by market type. RSI performance often splits between trending and ranging conditions.
Avoiding overtrading, limiting signals by session and setup quality
RSI can fire many signals in chop. More trades can mean more spread and more noise.
Set filters that reduce low quality entries.
- Session filter: trade your pair in its liquid session. Example, focus EURUSD signals during London and New York overlap. Skip thin hours.
- One trade per setup: take the first clean signal, then stop. Do not chase every RSI cross back and forth.
- Structure filter: require a clear level. If price sits mid-range, skip it.
- Limit trades per day: cap at 1 to 3 trades. This forces selection.
Write a minimum checklist. If one item fails, you pass.
News and spreads, why RSI signals fail around high-impact events
High impact news breaks RSI logic. Price can gap, spike, and reverse in seconds. Your stop can slip. Your fill can worsen.
Spreads also expand around releases and rollovers. That can trigger stops that would not hit in normal conditions. It can also turn a valid RSI entry into a bad price.
- Avoid new entries 10 to 30 minutes before top tier releases for the currencies you trade.
- Wait for spreads to normalize before you trade again.
- Reduce size if you must hold through news. Better, flatten exposure.
- Watch for broker rollover time. Spreads often widen and RSI signals degrade.
Risk management does not improve your RSI signal. It makes sure a bad run does not end your account.
Backtesting and Journaling RSI Setups (E-E-A-T Edge)
Backtesting and Journaling RSI Setups (E-E-A-T Edge)
You do not earn confidence from opinions. You earn it from logged trades and repeatable results.
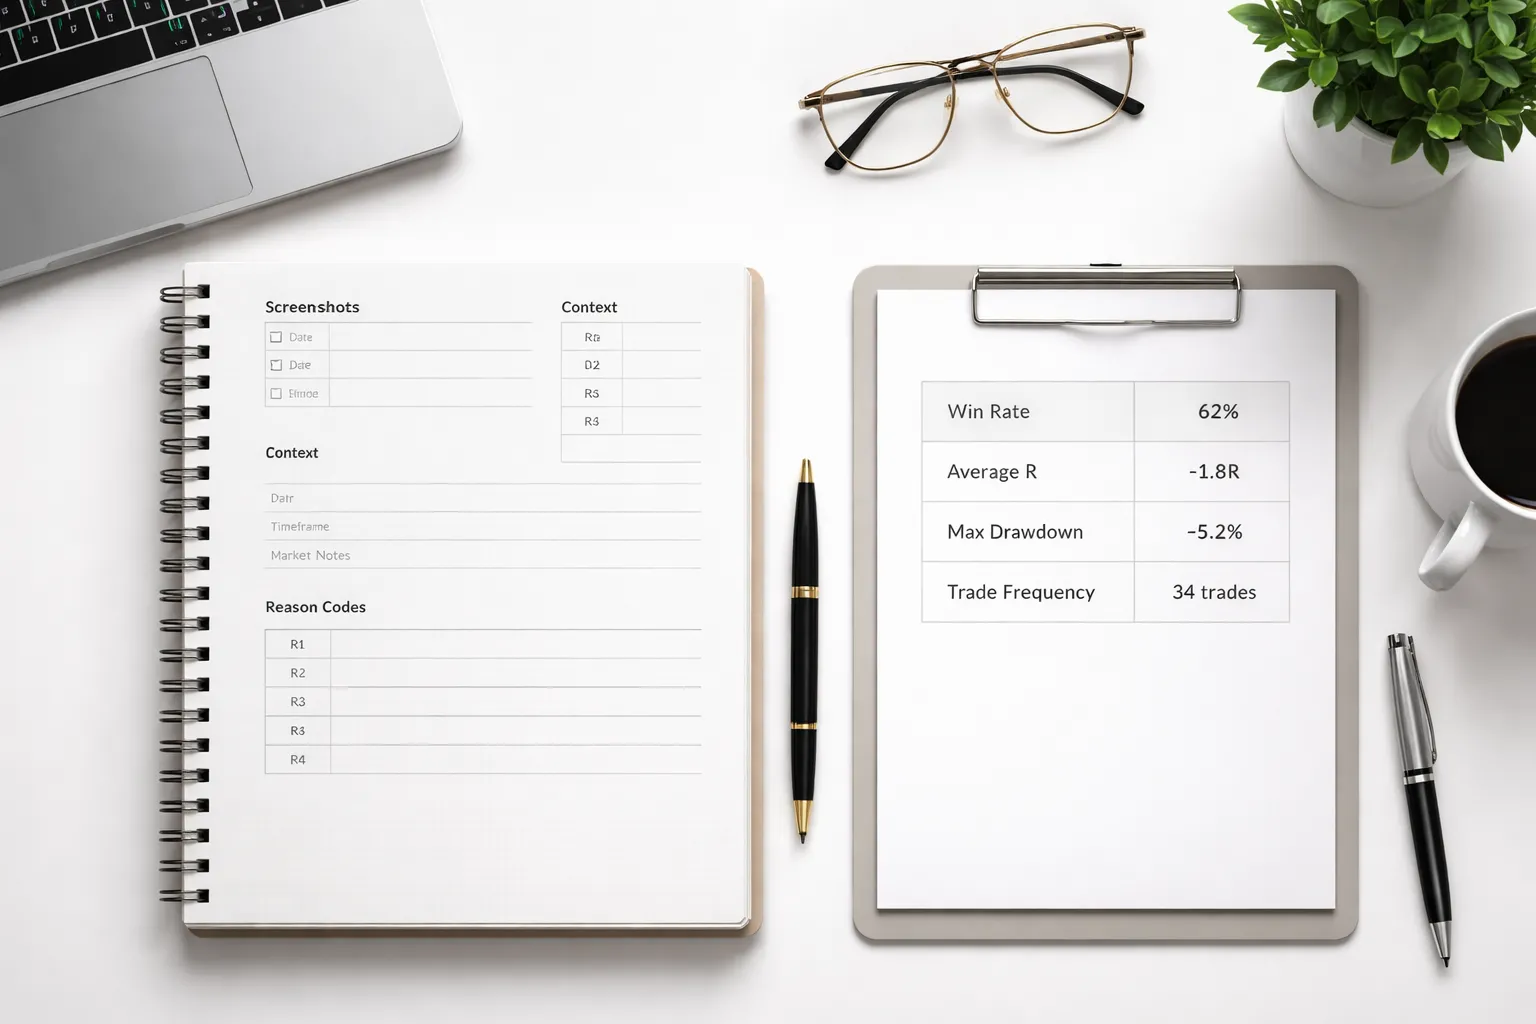
What to record in your RSI journal
Log every setup the same way. Keep it fast. Keep it strict.
- Screenshot at entry: Include RSI, price, and your levels. Mark the trigger candle.
- Screenshot at exit: Show where you took profit or where you stopped out.
- Market context: Pair, session, timeframe, date, spread, and whether price trends or ranges. Add key support and resistance.
- Entry details: Entry type, price, stop distance in pips, position size, and planned risk in R.
- Exit details: Target method, exit price, partials if used, and final R result.
- Execution notes: Slippage, late entry, early exit, or missed trade.
- Reason codes: Use fixed tags so you can filter later. Example codes below.
| Category | Reason code | Meaning |
|---|---|---|
| RSI trigger | R30 | RSI cross back above 30 after a dip below |
| RSI trigger | R70 | RSI cross back below 70 after a push above |
| Trend filter | TF1 | Higher timeframe trend aligns with trade |
| Structure | SR1 | Entry at clean support or resistance level |
| Volatility | SP1 | Spread normal, no rollover, no news window |
| Invalidation | IV1 | Stop placed beyond structure, not a fixed pip guess |
| Mistake | MS1 | Entered before signal close |
| Mistake | MS2 | Moved stop wider |
Sample RSI test plan
Test one ruleset at a time. Do not mix filters mid-test.
- Pairs: Start with 3 to 5 major pairs. Avoid highly correlated duplicates. Use a forex correlation pairs list to prevent double exposure.
- Sessions: Pick one. London or New York. Log session for every trade.
- Timeframe: Choose one execution timeframe, M15 or H1. Use one higher timeframe for context, H1 or H4.
- Date range: Use at least 6 to 12 months of data. Include slow and fast periods.
- Minimum sample size: 100 trades per ruleset. If you cannot reach 100, your filters are too strict or your market is too narrow.
- Rules freeze: Lock entries, exits, and filters before trade one. Change rules only after you finish the sample.
Key metrics that matter
Track performance in R. It keeps your results comparable across pairs and volatility.
- Win rate: Wins divided by total trades. Do not chase a high number. Chase a stable number.
- Average R per trade: Mean R across all trades. This is the core output.
- Max drawdown in R: Worst peak-to-trough run. This tells you what the strategy demands from your mindset and sizing.
- Trade frequency: Trades per week or month. Low frequency raises variance and slows learning.
| Metric | How to calculate | What you do with it |
|---|---|---|
| Win rate | Wins / Total | Check stability by month and by pair |
| Average R | Sum of R / Total | Decide if the ruleset has a real edge |
| Max drawdown | Largest equity drop in R | Set risk limits and stop trading thresholds |
| Trade frequency | Total trades / Time | Know how long it takes to get valid data |
Forward testing: demo vs small live size
Backtests prove logic. Forward tests prove execution.
- Demo forward test: Run 20 to 30 trades to confirm you can follow rules. Focus on timing, spreads, and discipline.
- Small live test: Move to the smallest size your broker allows. Run another 30 to 50 trades. This exposes real spreads, slippage, and emotions.
- One change at a time: If results break, do not add new filters. Fix the single weak step, then retest.
- Kill switch: Pause trading if you hit your planned max drawdown. Review logs first. Do not improvise.
Common RSI Trading Mistakes in Forex (and How to Fix Them)
Selling Just Because RSI Is Overbought in a Strong Uptrend
RSI can stay above 70 for a long time in a strong trend. If you short every overbought reading, you fight flow and pay spreads.
- Mistake: You treat RSI 70 as a sell signal.
- Fix: First classify trend. Use structure and direction. If price makes higher highs and higher lows, only take RSI sells after a clear break in structure.
- Fix: In strong uptrends, shift your mindset. RSI overbought means momentum, not automatic reversal. Look for pullback buys instead of tops.
- Rule: Only fade overbought when you also get a lower high in price and RSI fails to reclaim 60 on the bounce.
Ignoring Higher-Timeframe Momentum Regime
RSI signals flip meaning across regimes. In a higher-timeframe uptrend, “oversold” on a lower timeframe often marks a buy zone. In a downtrend, “overbought” often marks a sell zone.
- Mistake: You trade RSI on one chart and ignore the next timeframe up.
- Fix: Set a top down filter. Pick one higher timeframe and label it bull, bear, or range.
- Fix: Use regime thresholds. In bull regimes, treat 40 to 50 as support and 70 as momentum. In bear regimes, treat 50 to 60 as resistance and 30 as momentum.
- Rule: Trade in the direction of the higher timeframe. Skip countertrend RSI trades unless you have a defined range with clear boundaries.
Treating Divergence as a Guaranteed Reversal
Divergence warns you about slowing momentum. It does not force price to reverse. Trends can print multiple divergences and keep running.
- Mistake: You enter on divergence alone and place tight stops.
- Fix: Require confirmation. Wait for a break of the last swing level, or a failed retest, before entry.
- Fix: Grade divergence. Give more weight to higher timeframes and to divergences that form after an extended move into a major level.
- Rule: Divergence is a filter, not a trigger. Your trigger comes from price action, then RSI supports it.
Using One RSI Setting for All Pairs and Timeframes
Pairs move differently. Timeframes behave differently. One RSI length and one set of levels can overtrade one market and undertrade another.
- Mistake: You use RSI 14 with 70 and 30 everywhere and expect stable results.
- Fix: Standardize the process, not the number. Backtest a small set of lengths, then lock one per timeframe, not per mood.
- Fix: Adjust thresholds to regime and pair behavior. Many trending pairs respect 80 and 40 more than 70 and 30.
- Rule: Pick one RSI length per setup, then validate it with at least 100 trades or a full market cycle. Do not change settings mid sample.
No Predefined Exits, Turning Signals Into Hope Trades
RSI entries feel precise. Exits often stay vague. That creates long holds, wide losses, and random profits.
- Mistake: You enter on RSI, then you “see how it goes.”
- Fix: Define the stop before entry. Place it beyond the swing level that proves you wrong.
- Fix: Define one primary exit. Use either a fixed R multiple, the next structure level, or an RSI based exit. Do not mix methods inside the same test.
- Fix: Track expectancy. Log win rate, average win, average loss, and maximum adverse excursion. If your average loss grows, your exit rules fail.
- Resource: If you need a clear target method, use this guide on setting take profit levels.
Pros and Cons of Using RSI in Forex Trading
Strengths
- Simplicity. You get one line, one scale, and clear reference levels. You can define rules fast and test them fast.
- Versatility. RSI works on any liquid FX pair and any timeframe. You can use it for entries, filters, and exits.
- Momentum context. RSI helps you separate strong moves from weak ones. In trends, you can use it to avoid fading momentum too early. In ranges, you can use it to time mean reversion with structure.
- Easy to combine with price levels. RSI gives timing, price action gives location. If you trade from clear levels, learn how to draw support and resistance and let RSI confirm the reaction.
Limitations
- Lag. RSI uses past closes. Your signal often comes after the move starts. If you chase the first cross, you can enter late and eat the pullback.
- Regime dependency. RSI behaves differently in trends vs ranges. A rule that prints in a range can fail in a strong trend. You must define the market type in your plan.
- False extremes. Overbought and oversold do not mean reversal. In strong trends, RSI can sit above 70 or below 30 for long stretches. If you short every overbought print, your loss streaks will grow.
- Parameter sensitivity. RSI 14, 9, and 21 can give different entries. If you optimize settings on a small sample, you will curve fit. Lock settings and test across pairs and years.
Who RSI Works Best For
- Scalpers. Use RSI as a momentum filter, not a reversal trigger. Trade with the session move, use RSI to avoid entries when momentum fades. Keep rules tight and spreads low.
- Day traders. Best fit is structure plus RSI. Use higher timeframe bias, then take intraday entries when RSI confirms the bounce or breakdown. Use fixed risk and one exit method.
- Swing traders. Best fit is trend continuation. Use RSI to stay with the trend, buy pullbacks when RSI holds in a bull range, sell rallies when RSI holds in a bear range. Use wider stops and fewer trades.
| Trader type | Best RSI use | What to avoid |
|---|---|---|
| Scalper | Momentum filter, quick confirmation | Fading every 70 and 30 print |
| Day trader | Structure timing, entry confirmation | Signals without a level or plan |
| Swing trader | Trend pullback entries, trend holding | Over-optimizing RSI settings |
FAQ
What is the best RSI setting for forex?
Start with RSI 14. It fits most pairs and timeframes. If you scalp, test 7 to 10 for faster signals. If you swing trade, test 14 to 21 for smoother signals. Keep one setting for a full sample, at least 50 trades.
Should you use 70 and 30 levels?
Use 70 and 30 as context, not as automatic entry signals. In trends, RSI can stay overbought or oversold for long periods. In ranges, 70 and 30 work better. Pair the level with structure, like a swing high, swing low, or range boundary.
What RSI level works better in trends?
In uptrends, treat 40 to 50 as the buy zone and 70 as strength. In downtrends, treat 50 to 60 as the sell zone and 30 as weakness. This reduces fade trades against trend and keeps you aligned with market direction.
How do you confirm an RSI signal?
Use price first. Mark support, resistance, and the current swing structure. Then use RSI as confirmation. Enter only when RSI agrees with your level and your trigger candle. If the level fails, you exit. RSI does not override price.
Does RSI divergence work in forex?
Yes, but treat it as a warning, not a signal. Divergence works best at major levels and after an extended move. Skip it in strong trends unless price also breaks structure. You need a level, then a failure pattern, then a clear stop.
Which timeframe is best for RSI?
Use the timeframe you trade. For scalps, use M5 to M15. For day trades, use M15 to H1. For swings, use H4 to D1. If you use multiple timeframes, keep RSI on the entry chart and use higher timeframe for trend only.
Can you use RSI alone?
You can, but results usually degrade. RSI alone pushes you into random entries. Add one filter. Trend via moving averages works well, see moving average strategy. Then use RSI to time pullbacks or confirm momentum.
How do you set stops and targets with RSI?
Place your stop beyond the structure that invalidates the idea, not at an RSI level. Targets should sit at the next liquidity area, like prior swing highs or lows. If RSI reaches an extreme into your target, you can scale out and trail.
How many RSI trades should you take per session?
Fewer than you think. Cap your attempts. Two to five quality setups per session beats constant signals. If you see RSI touch 70 or 30 many times without clean levels, you are in chop. Reduce size, widen stops, or stand down.
What is the biggest RSI mistake?
Fading every 70 and 30 print. This creates repeated losses in trends. Your fix is simple. Define trend or range first, then choose the right RSI play. Trade RSI as a confirmation tool, not as a trigger that replaces market structure.
Conclusion
Conclusion
RSI works when you treat it like context, not a button.
- Start with market structure. Mark trend or range.
- In trends, use RSI to join momentum. Favor pullbacks, not top picking.
- In ranges, use RSI to time mean reversion at clear support and resistance.
- Filter signals. Skip trades when price chops and RSI hits 70 or 30 without clean levels.
- Control risk on every trade. Set the stop from structure, size the position from the stop.
Your best edge comes from consistency. Use one RSI setup, one timeframe plan, and one risk rule set. Track 50 trades. Keep what holds up. Cut what fails. Review your risk management rules before you change indicators.
-
Stop Loss vs Take Profit: Differences, Examples & Best Practices
4 months ago -
Forex Order Types Explained: Market vs Limit vs Stop Orders
4 months ago -
How to Set Stop Loss and Take Profit (Step-by-Step)
4 months ago -
How to Start Forex Trading Step by Step (Beginner Roadmap)
4 months ago -
Risk Management in Forex for Beginners (Rules That Keep You in the Game)
4 months ago
-
- Build a Complete RSI Indicator Forex Strategy (Rules, Not Hunches)
- 1) Define the market condition first, range-bound vs trending
- 2) Choose one trend filter, and stick to it
- 3) Select your RSI trigger, cross, rejection, divergence, or failure swing
- 4) Entry timing, candle-close confirmation vs intrabar
- 5) Invalidation logic, where the idea is wrong before the stop
- 6) Exit plan options, fixed R:R, structure targets, trailing
-
- RSI Strategy #1: Trend-Following Pullbacks (High-Probability Use Case)
- Market condition and trend definition (price structure first)
- Trend filter (pick one and stick to it)
- RSI pullback zones (the core rule)
- Entry trigger (RSI reclaim plus minor structure break)
- Invalidation and stop-loss placement
- Take-profit logic (simple, repeatable)
- Ruleset summary (use this as your checklist)
-
- Position sizing basics, risk per trade and account protection
- Stop-loss types, hard stops, technical stops, and time-based stops
- R-multiples and expectancy, how to evaluate whether the strategy works
- Avoiding overtrading, limiting signals by session and setup quality
- News and spreads, why RSI signals fail around high-impact events
-
- What is the best RSI setting for forex?
- Should you use 70 and 30 levels?
- What RSI level works better in trends?
- How do you confirm an RSI signal?
- Does RSI divergence work in forex?
- Which timeframe is best for RSI?
- Can you use RSI alone?
- How do you set stops and targets with RSI?
- How many RSI trades should you take per session?
- What is the biggest RSI mistake?
-
How to Place a Forex Trade Step by Step (Your First Trade Explained)
2 months ago -
Forex Trading vs Crypto Trading: Which Market Is Better for Beginners?
2 months ago -
Forex Lot Size Calculator: How to Use It to Size Trades Correctly
4 months ago -
How to Calculate Position Size in Forex (Position Sizing Formula + Examples)
4 months ago -
Forex Leverage Explained: How It Works, Pros, Cons & Examples
4 months ago
-
Is Forex Trading Legal in the United States? Rules, Regulators & What to Know
4 months ago -
Forex Market Hours & Trading Sessions Explained (Best Times to Trade)
4 months ago -
Forex Trading Platforms Comparison: MetaTrader vs cTrader vs TradingView
4 months ago -
Forex Leverage Explained: How It Works, Pros, Cons & Examples
4 months ago -
What Is a Lot Size in Forex? Lot Types + Quick Examples
4 months ago