Range Trading Strategy (Forex): How to Trade Support & Resistance Safely

Range trading targets the space between support and resistance. You buy near support. You sell near resistance. You take smaller, repeatable moves instead of chasing breakouts.
This guide shows you how to spot clean ranges, mark support and resistance with price action, and filter trades so you avoid choppy, low-quality setups. You will learn entry rules, stop placement, and realistic profit targets based on the range width. You will also learn when to stop range trading, because many losses come from trading a range that is breaking.
Range trading is simple. Execution is not. Your edge comes from discipline, clear levels, and tight risk control. Use a defined stop every time, see how to place a stop loss.
Key Takeaways
- In het kort: Trade ranges only when support and resistance are clear and respected.
- In het kort: Enter at the edges, not in the middle.
- In het kort: Use a fixed stop loss beyond the level, every trade.
- In het kort: Set targets from the range width, not hope.
- In het kort: Stop range trading when the range breaks or turns choppy.
- Mark the range on higher time frames first. Then refine on your entry chart.
- Use the cleanest levels. Multiple touches matter more than perfect lines.
- Wait for price to reach support or resistance. Do not chase moves inside the range.
- Plan the trade before you enter. Entry, stop, target, position size.
- Place your stop beyond the level and beyond the noise. Keep risk small and consistent.
- Use limit orders when you can. They reduce slippage and force discipline. Learn the basics of order types.
- Take profit before the opposite edge if the range is tight. Give the trade room only when the range is wide and stable.
- Do not add to losers at support or resistance. One idea, one risk.
- Stop trading the range after a strong close outside the boundary, a volatility spike, or repeated level failures. That is when breakouts and fakeouts increase.
- Track results by range width, session, and pair. Many pairs range better than others.
What a Range Trading Strategy in Forex Is (and When It Works)
Definition: a sideways market with two-sided rotation
A range trading strategy targets a sideways market. Price moves between a clear ceiling (resistance) and floor (support). You sell near the top and buy near the bottom. You take profits as price rotates back toward the middle or the opposite side.
Ranges work because order flow stays balanced. Buyers and sellers both defend levels. That creates repeatable swings and mean rotation inside the boundaries.
Range boundaries vs consolidation vs distribution and accumulation
Do not label every pause as a range. You need boundaries that traders respect.
- Tradable range boundaries: At least two clean touches on support and two on resistance. Price reacts fast at the edges. Wicks can pierce, closes should stay mostly inside.
- Consolidation: Price compresses and swings get smaller. Boundaries shift. This often becomes a breakout setup, not a stable range. Your edge drops because targets shrink and stops stay similar.
- Distribution or accumulation: Price looks flat but the market loads one side. You see repeated tests of one boundary, weaker bounces, and more closes near the edge. That often ends with a trend move.
Best conditions: stable volatility, technical respect, no directional catalyst
- Stable volatility: Range width stays similar across several hours or sessions. ATR does not surge. Candle size stays consistent.
- Technical respect: Support and resistance hold on closes. Breaks fail fast and snap back. Rejections show up as wicks and quick reversals at the edges.
- No strong catalyst: No major rate decision, CPI, jobs data, or surprise headline risk near your holding window. The market has no reason to reprice hard in one direction.
- Order placement fits the structure: Limit entries at edges and stop entries for breakout confirmation each have a place. Use the right tool for the job. See forex order types if you need a quick refresher.
Worst conditions: strong trends, post-news expansion, thin liquidity
- Strong trends: Higher highs and higher lows, or lower lows and lower highs, across multiple time frames. Pullbacks stay shallow. Range trades keep fading a move that keeps pushing.
- Post-news expansion: Volatility jumps, spreads widen, and candles close outside the boundary. That is when stops cluster and slippage rises. Breakouts and fakeouts both increase.
- Thin liquidity sessions: Late Friday, holidays, and low-volume hours can turn ranges into random spikes. Levels can “work” until a single sweep takes you out. Treat these periods as higher risk.
Market Regime Detection: Confirm It’s a Range Before You Trade It
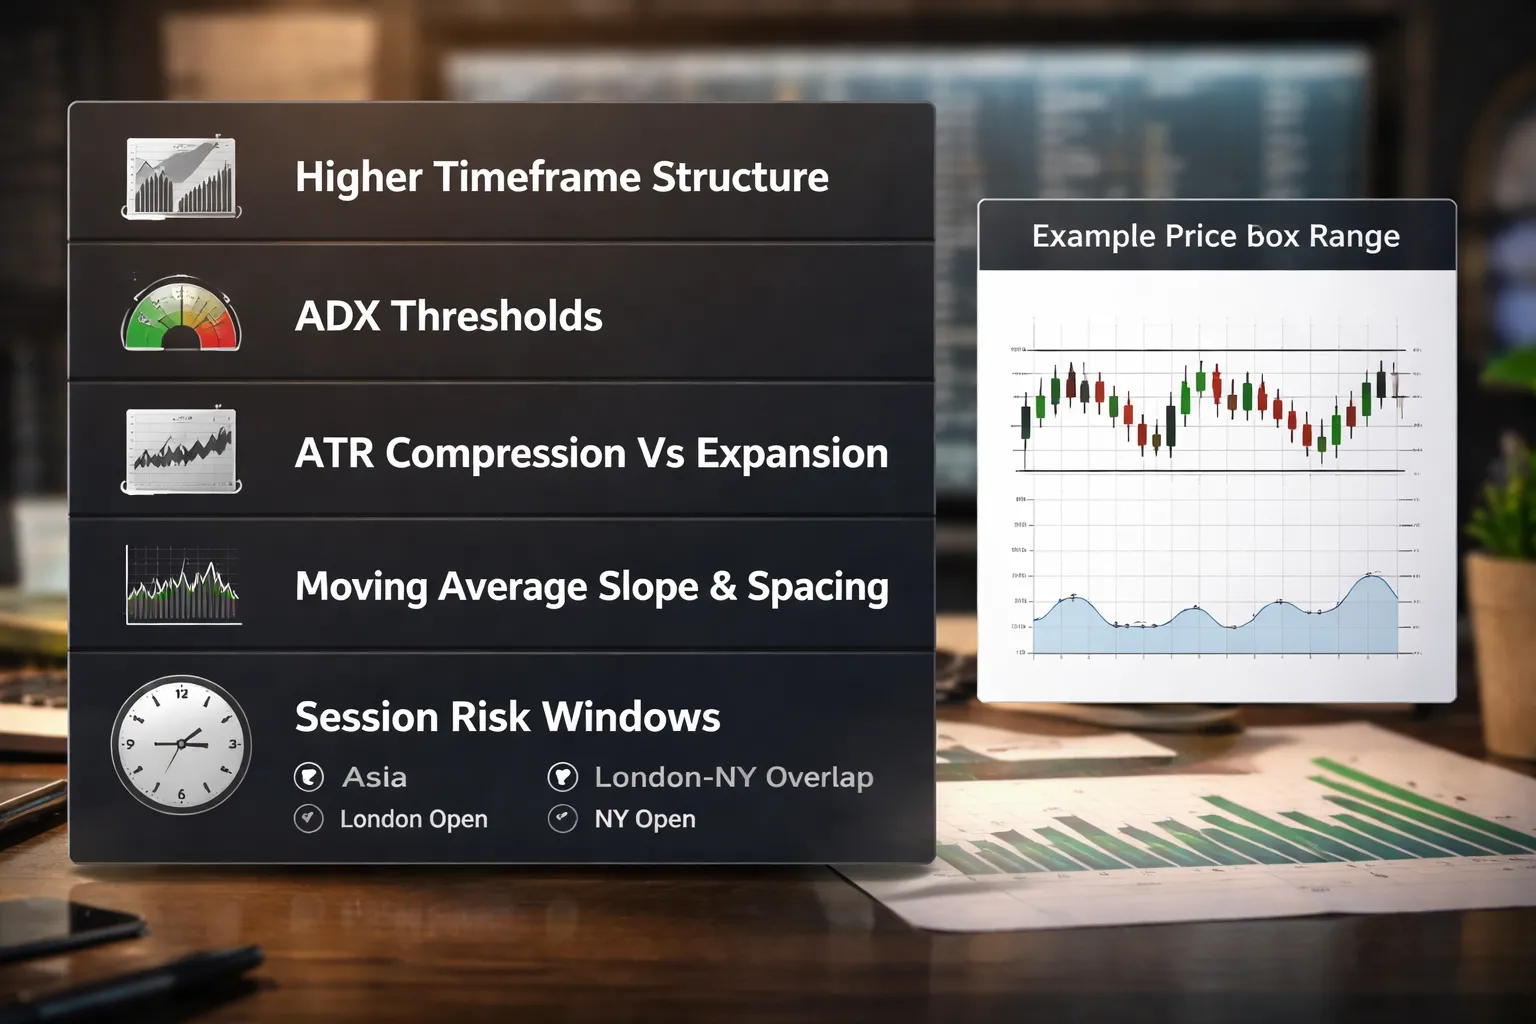
Higher-timeframe bias, map the range inside the larger structure
Start one to three timeframes higher than your entry chart. Mark the last clear swing high and swing low. Then mark the current consolidation inside it.
- If price ranges in the middle of a higher-timeframe leg, treat it as a pause. Expect more breakouts.
- If price ranges at a higher-timeframe support or resistance zone, treat it as balance. Expect more two-sided order flow.
- If the higher timeframe prints higher highs and higher lows, avoid selling the top of a small range. You fight the primary flow.
- If the higher timeframe prints lower highs and lower lows, avoid buying the bottom of a small range.
Keep your range boundaries tied to closes and repeated reactions, not single wicks. If you cannot mark at least two clean touches on both sides, you do not have a range. You have noise.
ADX guidelines for range conditions, and why ADX alone fails
Use ADX as a trend strength filter, not a range signal by itself. On most FX pairs, ADX under 20 suggests weak trend conditions. ADX 20 to 25 is mixed. ADX above 25 suggests trend strength and higher breakout risk.
- Range-friendly: ADX below 20 and flat for multiple bars.
- Caution: ADX rising from below 20, it often marks the start of expansion.
- Avoid: ADX above 25 while price sits near a boundary, breakouts and stop runs become more likely.
Common mistakes:
- You use ADX without the +DI and -DI context. ADX can rise inside a choppy move. You still get whipsawed.
- You use one timeframe only. A low ADX on M15 can sit inside a strong H4 trend.
- You treat ADX < 20 as a trade trigger. It is a condition, not an entry.
ATR and realized volatility, spot compression versus expansion
Ranges work best during volatility compression. They fail when volatility expands. Measure it.
- Check ATR(14) on your trading timeframe. Compare the current ATR to the last 20 to 50 bars.
- If ATR drifts lower while price respects both boundaries, you have compression. Mean reversion setups improve.
- If ATR turns up fast, or one candle prints a large true range, you have expansion. Reduce size, widen stops, or stand aside.
Also track realized range, the average high to low of the last N candles. When realized range jumps while price sits at a boundary, you often get sweeps and failed limit fills.
Moving average slope and spacing, a fast trend-versus-range filter
Use moving averages to filter structure. Do not use them to define the boundaries.
- Range-like: a 20 EMA is flat and price crosses it often. A 20 and 50 EMA sit close together.
- Trend-like: the 20 EMA slopes hard and price stays on one side. The 20 and 50 separate and keep separating.
- Transition: the slope flips and spacing expands. Treat this as breakout risk.
If your chart shows a clean diagonal push and pullbacks that do not reach the mean, skip range entries. You will keep fading strength.
Session behavior, London and New York can break the “quiet” Asian range
Many pairs form tight Asian ranges. London often tests and breaks them. New York can extend the move or reverse it with a sweep.
- If your range forms during Asia, treat the first hour of London as a risk window. Expect stop hunts above and below the box.
- During London and the London to New York overlap, volatility and volume rise. A range that held in Asia can fail fast.
- If your plan depends on a calm tape, avoid opening new range trades right before major session opens.
Confirm range conditions with what you see on the candles, strong closes outside the boundary matter more than wick pokes. If you need a refresher on reading candle closes versus wicks, use this candlestick charts guide.
| Check | Range-friendly read | Breakout risk read |
|---|---|---|
| Higher timeframe | Consolidation at a major zone, balanced swings | Consolidation mid-leg, strong directional structure |
| ADX | < 20 and flat | > 25 or rising fast |
| ATR, realized range | Drifting lower, stable candles | Turning up, large true range prints |
| Moving averages | Flat slope, tight spacing, frequent crosses | Strong slope, widening spacing, one-sided price action |
| Session context | After open volatility settles | London open, NY open, overlap window |
How to Identify High-Quality Support and Resistance Zones
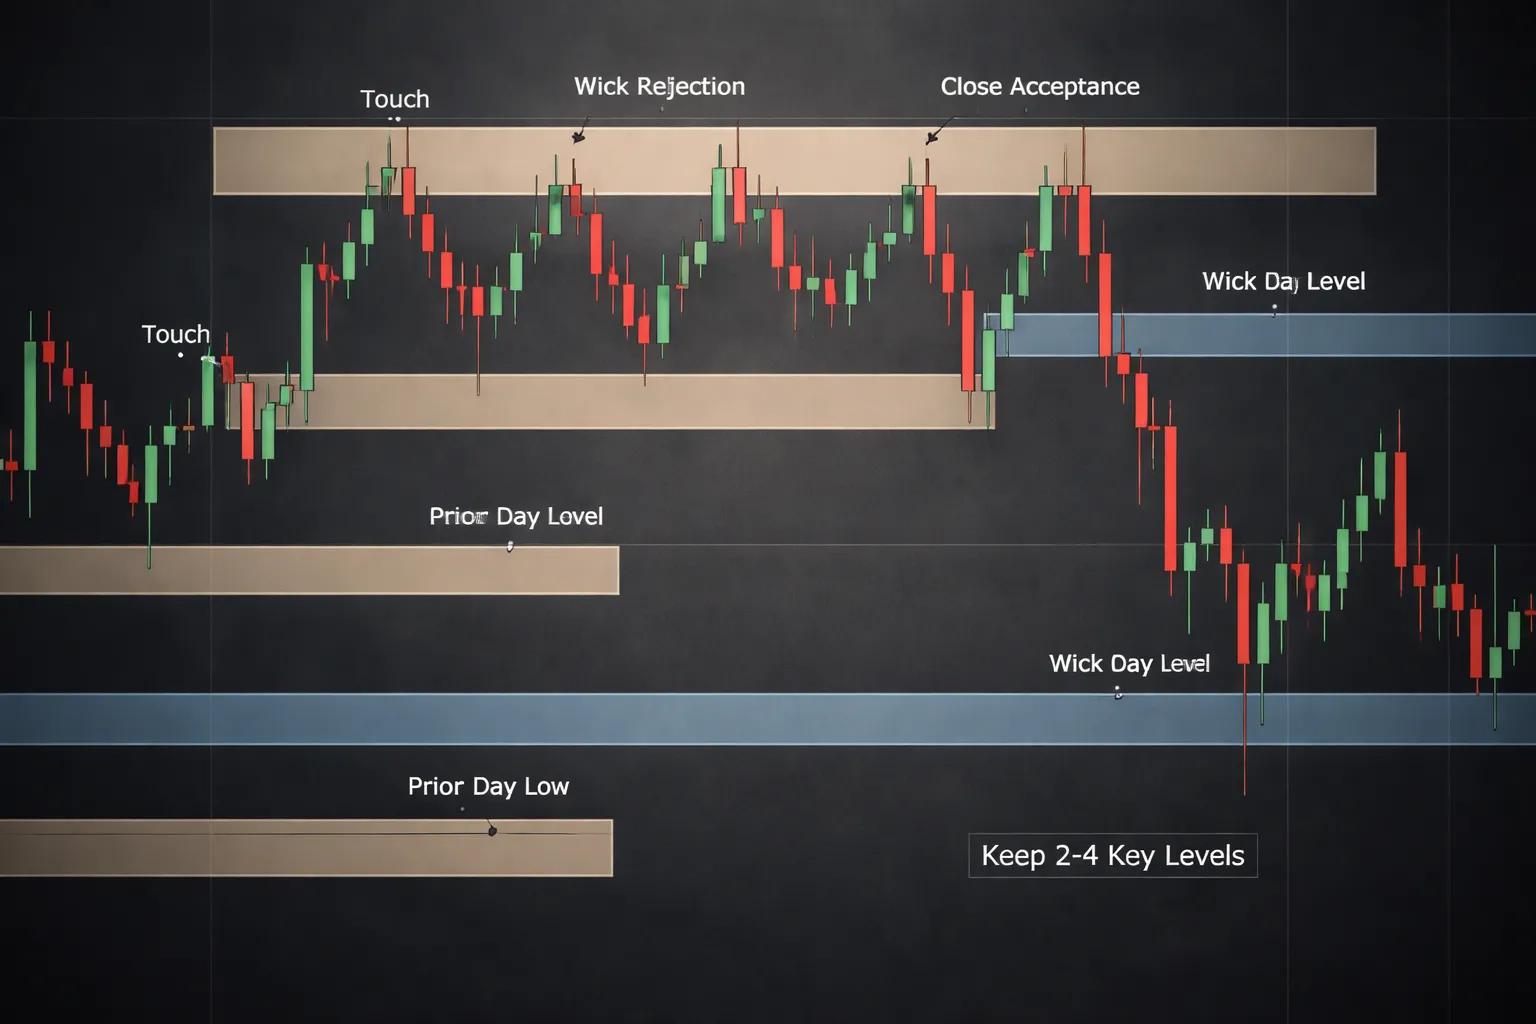
Zone-based levels, why rectangles beat single lines in forex
Forex levels rarely turn at one exact price. Liquidity sits in bands. Spreads vary. News spikes print wicks. If you draw one line, you will “miss” valid reactions and overtrade false breaks.
Mark support and resistance as zones. Use rectangles that cover the cluster of turning points.
- For support, anchor the zone to the wick lows that keep rejecting lower prices, then include the nearby closes that show acceptance.
- For resistance, anchor the zone to the wick highs that keep rejecting higher prices, then include the nearby closes.
- Zone width rule, keep it proportional to current volatility. A practical guide is 0.5 to 1.0 ATR of your trading timeframe, measured in price.
Minimum touches, spacing, and symmetry, a checklist for range quality
High-quality zones show repeated defense. They also show structure. Use this checklist before you commit risk.
- Touches, at least 3 clean reactions at each boundary. Two touches can happen by chance.
- Spacing, reactions should be separated by time. You want independent tests, not one burst of noise.
- Symmetry, swings from support to resistance should look similar in size and speed. One side should not grind while the other side snaps.
- Midrange behavior, price should travel through the middle without stalling every few candles. If it chops everywhere, the range has no clear auction.
- Respect on close, strong ranges reject intrabar but also struggle to close beyond the zone.
Wick rejections and failed auctions, reading acceptance vs. rejection
Wicks tell you where price got rejected. Closes tell you where price got accepted.
- Rejection, long wicks into the zone, followed by closes back inside the range. This shows trapped breakout attempts and defensive flow.
- Acceptance, multiple closes inside and beyond the zone, with bodies building in the new area. This shows the market is comfortable trading there.
- Failed auction, a brief push outside the zone, then a fast return, then continuation across the range. Treat this as range confirmation.
- Real breakout, a close outside the zone, then a retest that holds on closes, not just wicks. If you see this, stop range trading that boundary.
If you want a fast way to label the candles you see at the edges, use a simple library of candlestick patterns, but prioritize location and closes over pattern names.
Confluence factors, round numbers, prior day high/low, weekly levels, VWAP
One level can work. Confluence raises the odds. You want multiple reasons for orders to sit in the same area.
- Round numbers, 00 and 50 levels often attract resting orders and take-profit flows.
- Prior day high and low, these mark recent extremes where stops cluster.
- Weekly high and low, these matter more when your range spans multiple sessions.
- Session VWAP, optional. When VWAP sits near the midrange, you often get cleaner mean reversion. When VWAP trends hard toward one edge, you often get pressure on that boundary.
- Compression into the zone, smaller candles and declining ATR into support or resistance often precede sharp bounces. Expanding range into the zone often precedes breaks.
Avoiding “level clutter”, selecting the 2 to 4 levels that matter
Too many lines create false signals. Keep the chart simple. Limit yourself to the levels that control trade decisions.
- Start from higher timeframes, mark the nearest weekly level, then the nearest daily level. Stop when you have the closest relevant zones above and below price.
- Prioritize recent structure, a zone that caused the last two reversals matters more than a level from months ago.
- Pick the range boundaries, one support zone and one resistance zone. Add a midrange level only if price repeatedly pivots there.
- Remove weak levels, delete zones that price cuts through with multiple closes and no reaction.
- Define your decision points, you should know where you will look for entries, where the range fails, and where you will take profits. If a zone does not change those decisions, you do not need it.
Core Range Trade Setups (Rules-Based)
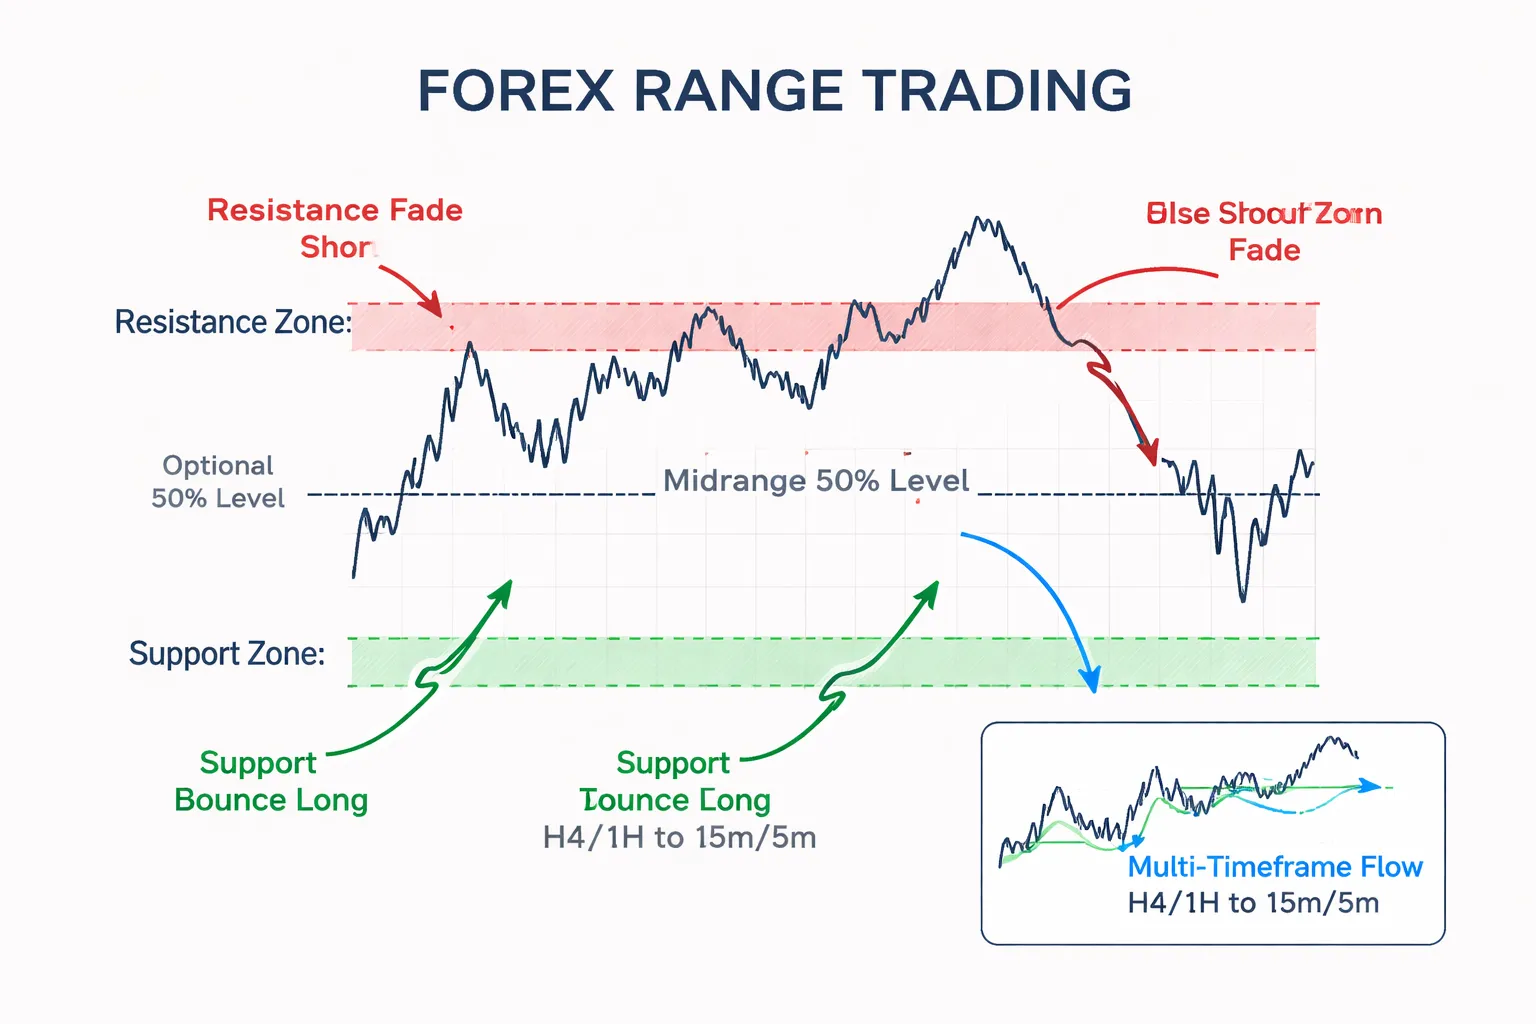
Support Bounce Setup (Long) and Resistance Fade Setup (Short)
You trade the edges. You do not chase the middle.
Support bounce long, rules
- Market condition: H4 or 1H shows a clean range. Price has respected support at least 2 times with clear reactions.
- Entry area: inside the support zone, not above it.
- Stop: a few pips beyond the support zone low. Your range is invalid if price closes below the zone on 1H.
- Target: first target at midrange if it is validated. Final target at resistance zone front edge. Scale out if the range is tight.
Entry triggers, pick one and keep it consistent
- Price action trigger: 5m or 15m prints a rejection at support, then breaks and closes above the last lower high inside the zone.
- Price action trigger: double bottom or sweep of the prior swing low into the zone, then a strong close back above support.
- Indicator confirmation: RSI(14) on 5m or 15m goes below 30 inside the zone, then crosses back above 30 after a rejection candle. You still need a close back above support.
- Indicator confirmation: Stochastic (14,3,3) crosses up from oversold inside the zone, only after price stops making lower closes.
Resistance fade short, rules
- Market condition: H4 or 1H range. Resistance has at least 2 clear rejections.
- Entry area: inside the resistance zone, not below it.
- Stop: a few pips beyond the resistance zone high. Your range is invalid if price closes above the zone on 1H.
- Target: first target at midrange if validated. Final target at support zone front edge.
Short entry triggers
- Price action trigger: 5m or 15m rejection at resistance, then break and close below the last higher low inside the zone.
- Price action trigger: sweep of the prior swing high into the zone, then strong close back under resistance.
- Indicator confirmation: RSI(14) goes above 70 inside the zone, then crosses back below 70 after rejection. Do not short only because RSI is high.
Mid-Range Trades (50% Level): Valid Use and Common Trap
The midrange level works only when price proves it matters.
Midrange is valid when
- Price pivots there at least 3 times on 1H, with clean turns and follow-through.
- Moves from midrange to an edge reach at least 1R often enough to matter in your backtest.
- Spreads and average 1H range leave room for profit after costs.
Midrange trade, rules
- Direction: take trades only in the direction of the last clear swing from an edge to midrange. Do not guess the next flip.
- Trigger: on 5m or 15m, wait for a rejection at midrange plus a structure break in your direction.
- Stop: beyond the midrange rejection swing, not beyond the full range.
- Target: the nearest edge. Exit if price stalls and prints multiple small closes through midrange.
Midrange is a trap when
- Price cuts through it with multiple 1H closes and no reaction.
- The range is narrow and noise dominates. You get chopped and pay spread twice.
- News spikes hit the middle first, then run both sides.
False Breakout (Liquidity Grab) Setup: Fade Stops Beyond the Boundary
You fade the break only after price fails.
Rules
- Setup: price pushes beyond support or resistance and takes the obvious stop pool beyond the last swing.
- Confirmation: price closes back inside the range on 5m or 15m. One wick is not enough.
- Entry: enter on the retest of the boundary from the inside, or on a break of the failure candle low or high.
- Stop: beyond the false breakout extreme.
- Target: midrange first. Then the opposite edge if momentum holds.
Filters that keep you out of bad fades
- Skip if the 1H closes outside the boundary. That is not a grab, it is a breakout.
- Skip if the breakout candle is large relative to recent 1H candles. That often starts a trend leg.
- Skip near high-impact news. Slippage can erase your edge.
Multiple Timeframe Alignment: H4 and 1H for Structure, 15m and 5m for Timing
You map the range on higher timeframes. You execute on lower timeframes.
- Step 1, H4: mark the main support and resistance zones. Keep them wide enough to cover typical wicks.
- Step 2, 1H: confirm the range still holds. Delete levels that price closes through repeatedly.
- Step 3, 15m: find current swing direction inside the range. Identify the most recent swing high and swing low.
- Step 4, 5m: wait for your trigger at the zone, rejection plus structure break, or false breakout close back inside.
- Step 5, risk: set stop beyond the zone or beyond the false break extreme. Size your position so one loss is a small fixed percent. Use your rules from risk management.
One clean checklist for every range trade
- H4 or 1H range is clear.
- Edge level has at least 2 prior reactions.
- Entry triggers only at an edge, or at a proven midrange.
- Stop location matches the reason for the trade.
- Target is defined before entry.
Entries, Stops, and Take-Profit: The “Safe” Execution Framework
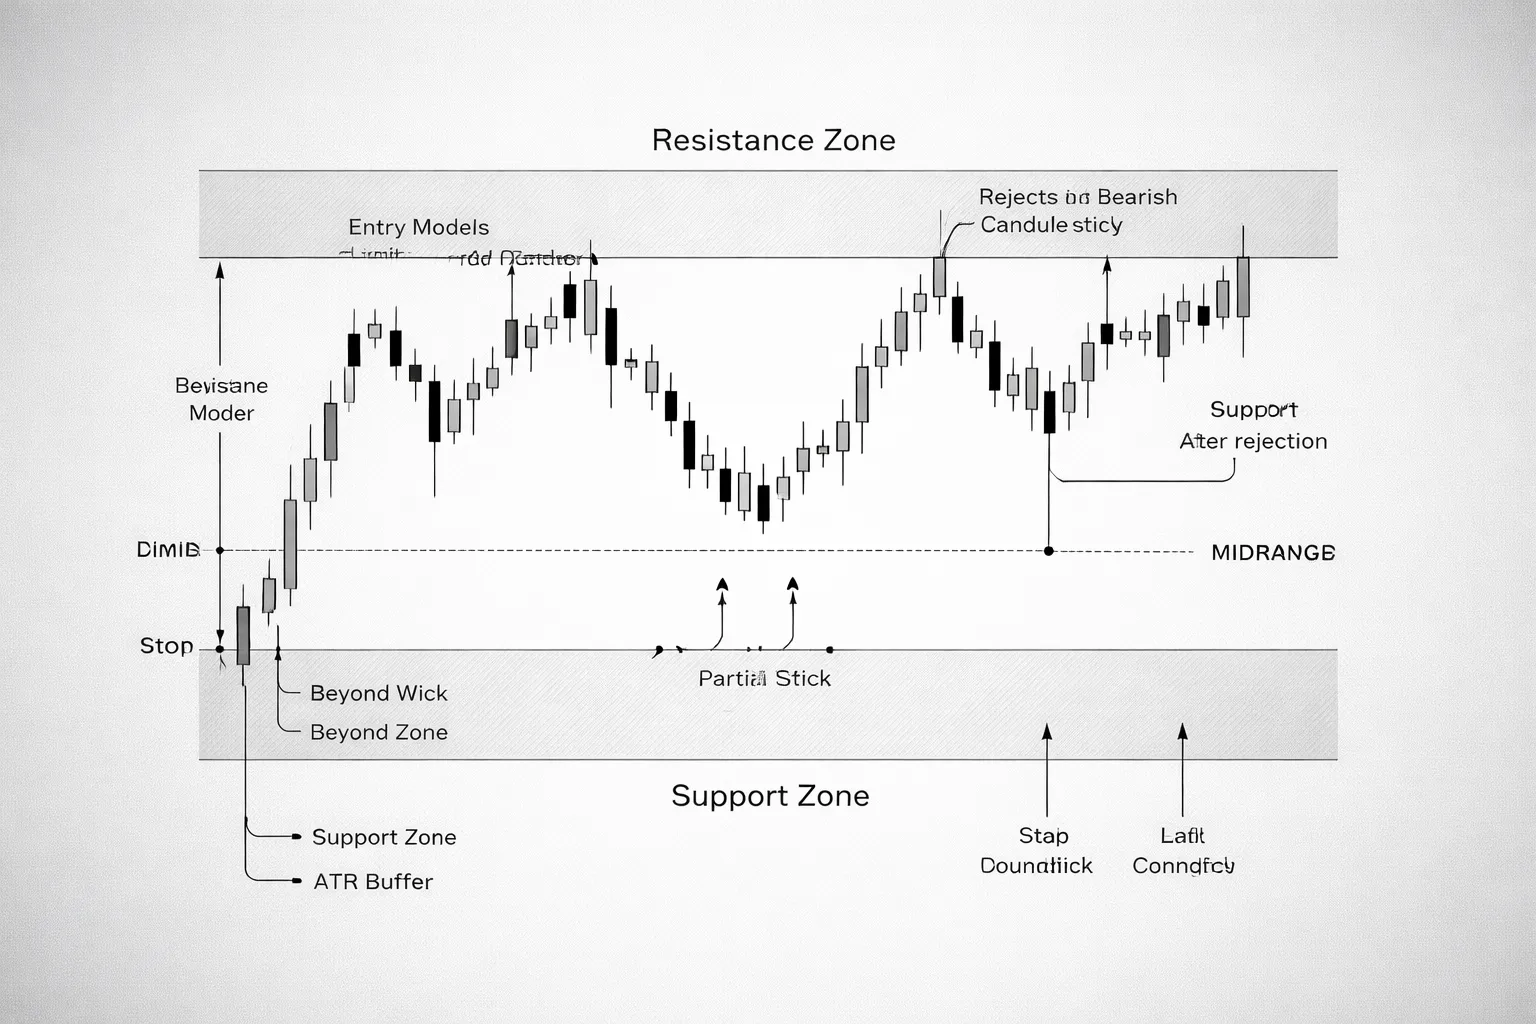
Entry models that reduce mistakes
You have two clean entry models in a range. Pick one and standardize it.
- Limit entry at the zone edge. Place a limit order inside your support or resistance zone. Keep it near the outer third of the zone. This keeps your stop smaller and your R multiple higher. It also increases the chance you get tagged in a grind.
- Confirmation entry after rejection. Wait for price to hit the zone, reject it, then enter on the next pullback. Your trigger can be a clear rejection wick, a strong close back inside the range, or a break of the rejection candle. This lowers false entries. It often increases your stop size and cuts R multiple.
Use limit entries when the range is clean and volatility is stable. Use confirmation entries when the level is messy, news just hit, or session opens are near.
Stop placement that matches the reason for the trade
Your stop must sit where your idea is proven wrong, not where it feels small.
- Beyond the wick extreme. Place the stop a few pips beyond the rejection wick high or low. Use this when the wick is the key evidence of trapped liquidity. Avoid it when the edge often prints long wicks.
- Beyond the zone. Place the stop beyond the entire support or resistance zone. Use this when the zone, not the wick, is your signal. This handles minor overshoots better.
- Volatility-based stop. Size the stop using recent volatility so normal noise does not stop you out. Practical methods: use a fixed fraction of the daily ATR, or use the average swing size on your trading timeframe. Put the stop beyond the zone by that buffer.
Pick one stop method per setup type. Then backtest it. If you mix methods at random, your results will not mean anything.
Take-profit logic that pays you before the range breaks
Ranges end. Your exits must assume failure can arrive fast.
- Primary target at the opposing boundary. If you buy support, your default target sits near resistance. If you sell resistance, your default target sits near support. Place it before the exact edge to improve fill rate.
- Partials at midrange. Take a first partial at the midpoint, or at the last minor pivot inside the range. This reduces the damage from reversals that never reach the far side.
- Scale out, then protect. After you take a partial, move your stop to reduce risk only if structure supports it. Do not auto-move to breakeven too early. Many ranges retest the entry area before continuing.
Define your targets before entry. Write the numbers down. You want one decision, not five decisions under pressure.
Risk-to-reward reality in ranges
A high win rate can still lose money.
If your average win is smaller than your average loss, a normal drawdown wipes weeks of gains. This happens when you take small profits at midrange but keep full-size stops beyond the zone.
| Win rate | Avg win (R) | Avg loss (R) | Expected value per trade |
|---|---|---|---|
| 70% | 0.5 | 1.0 | -0.05R |
| 55% | 1.0 | 1.0 | +0.10R |
| 45% | 1.5 | 1.0 | +0.18R |
Track your average win in R, not pips. Then track your average loss in R. Improve the smaller one first. Most range traders need better exits, not more entries.
Order types and slippage, especially at session opens
Your execution method must match the market conditions.
- Limit orders. Best for range edges in calm conditions. You control entry price. You risk missing trades when price turns early.
- Stop orders for confirmation. Useful when you wait for a break of a rejection candle. You get filled only if price proves momentum. You risk worse fills in fast moves.
- Market orders. Use only when spread is stable and liquidity is deep. Avoid them around session opens and red news.
Be careful at the London open and New York open. Spreads can widen, price can spike through both sides, and your stop can fill with slippage. If your plan relies on tight stops, skip the first minutes of the session. If you trade them, widen your stop buffer and cut size so risk stays fixed.
If you need a simple way to standardize these rules, build them into your written checklist and execution steps using a forex trading plan.
Risk Management for Range Trading (Non-Negotiables)
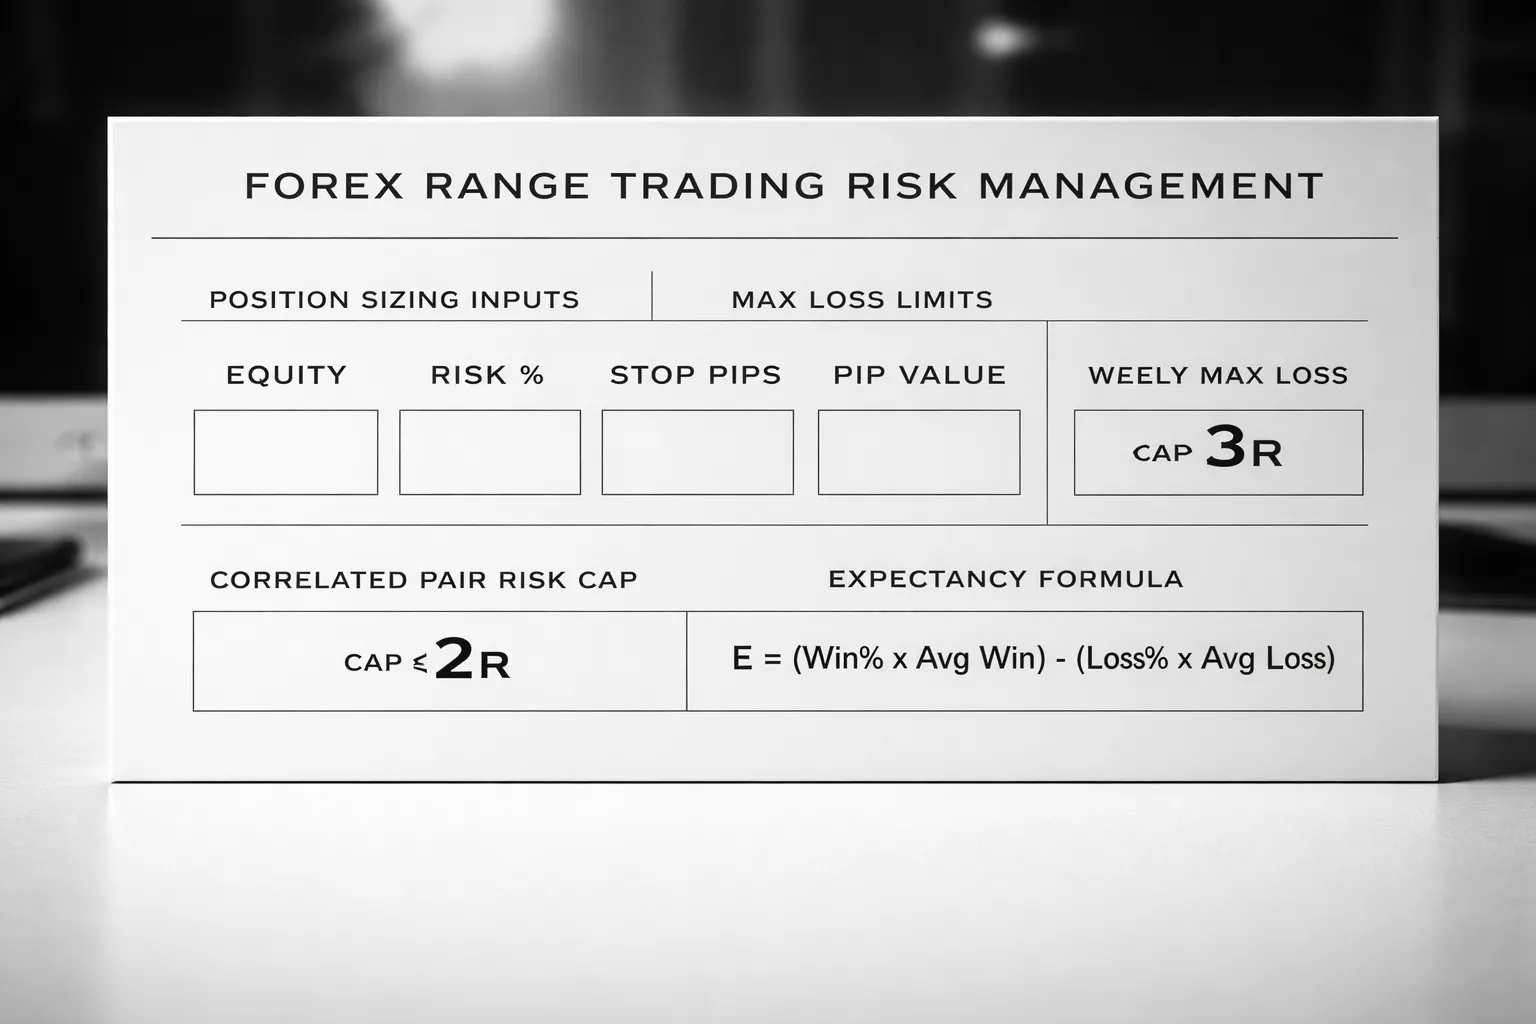
Position sizing formula (fixed fractional risk per trade)
In ranges, your edge comes from repetition. Your risk must stay stable trade to trade.
Use fixed fractional risk. You pick a percent of equity to risk per trade, then size the position from your stop distance.
- Risk per trade ($) = Account equity x Risk %
- Position size (units) = Risk per trade ($) / (Stop distance in pips x Pip value per unit)
Example 1, USD account, EURUSD:
- Equity: $10,000
- Risk: 0.5% = $50
- Stop: 20 pips
- On EURUSD, 1 standard lot (100,000 units) is about $10 per pip. So 0.10 lots is about $1 per pip.
- Needed pip value = $50 / 20 = $2.50 per pip
- Position size = 0.25 lots (25,000 units)
Example 2, same account, wider stop because the range is wider:
- Risk: $50
- Stop: 40 pips
- Needed pip value = $50 / 40 = $1.25 per pip
- Position size = 0.125 lots (12,500 units)
Do not keep lot size constant. Keep risk constant.
If you need a refresher on core rules, use this guide on risk management in forex.
Max daily and weekly loss limits (stop overtrading the box)
Ranges invite revenge trading. You get many signals. Many are low quality.
Set hard loss limits. Stop trading when you hit them.
- Daily max loss: 2R or 3R.
- Weekly max loss: 6R to 10R.
- Max losing trades per day: 2 or 3.
Rules that work in practice:
- After 2 losses, stop for the session. You avoid the third trade you take to “get it back”.
- After you hit daily max loss, you do not “reduce size and keep going”. You stop. You review.
- If spread widens or price starts breaking both sides, you stop. That is a regime change.
Handling correlated pairs (avoid hidden concentration risk)
Range trades often cluster. You see the same range structure on related pairs.
If you take them all, you stack risk without noticing.
- EURUSD and GBPUSD often move together against USD.
- USDCHF often moves opposite EURUSD.
- AUDUSD and NZDUSD often move together.
- EURJPY and GBPJPY often move together when JPY drives the move.
Simple concentration rules:
- Treat highly correlated trades as one idea.
- Cap total open risk across correlated pairs at 1R or 1.5R.
- If two trades share the same driver, cut size on both. Or take only the cleanest setup.
- If you hedge by taking opposite pairs, do the math. Hedges fail when correlations shift.
Practical check: if one USD spike can stop out all your positions, you are overexposed.
R-multiples and expectancy (prove the range strategy pays)
Measure performance in R. R is your initial risk on a trade.
- 1R = your stop distance.
- If you risk 20 pips and you make 10 pips, that is +0.5R.
- If you risk 20 pips and you lose 20 pips, that is -1R.
Use expectancy. It tells you if the strategy makes money over many trades.
- Expectancy (R) = (Win rate x Avg win in R) - (Loss rate x Avg loss in R)
Example A, typical range profile:
- Win rate: 55%
- Avg win: +0.8R
- Avg loss: -1.0R
- Expectancy = (0.55 x 0.8) - (0.45 x 1.0) = 0.44 - 0.45 = -0.01R
This loses after spread and slippage. You must fix targets, entries, or filters.
Example B, small improvement:
- Win rate: 55%
- Avg win: +1.0R
- Avg loss: -1.0R
- Expectancy = (0.55 x 1.0) - (0.45 x 1.0) = +0.10R
At +0.10R per trade, 200 trades is about +20R before costs. Costs decide if it survives. Track net results after spreads and commission.
Trade journaling fields specific to ranges
Your journal must capture why a trade worked inside the box, and why it failed when the box broke.
- Range width: in pips and as ATR multiple.
- Range age: how long price respected the boundaries.
- Boundary quality: number of touches at support and resistance.
- Entry location: distance from boundary in pips.
- Stop buffer: beyond support or resistance in pips, plus spread.
- Target logic: midline, opposite wall, partial at midline.
- Regime filter: trend state on higher time frame, ADX, moving average slope, or your chosen filter.
- Session: Asia, London, New York, overlap.
- Catalyst: news event, data release, central bank speaker, fix, option expiry.
- Execution quality: spread at entry, slippage, limit vs market.
- Outcome in R: include maximum favorable excursion and maximum adverse excursion in R.
After 30 to 50 trades, sort by session and catalyst. You will see where the range rules hold, and where they fail.
Indicators and Tools That Improve Range Trading (Without Overcomplicating)
ADX as a Regime Filter (Keep You Out of Trends)
Range trades fail when the market trends. ADX helps you filter those periods.
- Use ADX on the same timeframe you trade. If you enter on H1, filter on H1. If you enter on M15, filter on M15.
- Simple threshold ideas. ADX below 15 to 20 supports range conditions. ADX above 25 warns of trend strength. Treat 20 to 25 as a no trade zone unless price sits at a hard boundary with clean rejection.
- Reduce whipsaws. Do not act on one candle. Require ADX to stay below your threshold for 5 to 10 bars before you allow new range entries.
- Block trades when ADX rises. If ADX turns up for several bars, stop fading the range. Your edge shrinks fast when compression ends.
Keep ADX as a filter, not an entry trigger. Your entry still comes from support and resistance.
Bollinger Bands and Keltner Channels (Time the Extremes)
Bands help you judge when price sits at a true extreme versus drifting inside the range.
- Bollinger Bands. In clean ranges, price often tags the outer band near support or resistance, then snaps back toward the middle band. Use that tag as timing, then confirm with a boundary signal.
- Band width matters. Narrow bands signal compression. That raises breakout risk. Size down or skip mean reversion trades when bands pinch hard.
- Keltner Channels. Keltner uses ATR, so it reacts smoother. In choppy ranges, Keltner can reduce false “extreme” readings that Bollinger sometimes prints.
- Squeeze read. When Bollinger contracts inside Keltner for a sustained period, expect expansion soon. Do not keep selling the top and buying the bottom into a tightening coil.
Do not stack too many bands. Pick one. Track how often “touch and reject” produces an R gain in your journal.
RSI or Stochastic for Confirmation (Divergence and Failure Swings)
Oscillators help you avoid fading a boundary when momentum still pushes through it.
- Use them as a yes or no check. Your level comes first. The oscillator confirms the rejection.
- Divergence at boundaries. At resistance, price makes a marginal higher high, RSI or Stoch makes a lower high. At support, price makes a marginal lower low, oscillator makes a higher low. Treat it as a warning that the push is weakening.
- Failure swings. These often signal a better entry than raw overbought or oversold.
- Bearish failure swing. RSI pushes above 70, pulls back, fails to break the prior RSI high, then breaks the pullback low. If this happens at resistance, you have structure plus momentum shift.
- Bullish failure swing. RSI drops below 30, bounces, fails to break the prior RSI low, then breaks the bounce high. If this happens at support, it supports the long.
- Avoid “stuck” signals. In trends, RSI can stay overbought or oversold. Your ADX filter should block most of these traps.
Keep settings standard unless you have data that proves a change improves your results.
ATR for Dynamic Stops, Targets, and Pair Selection
ATR turns vague risk control into consistent numbers.
- Dynamic stop sizing. Set stops with ATR so they match current volatility. Example approach, stop distance equals 1.0 to 1.5 ATR from your entry, placed beyond the level, not on it.
- Dynamic targets. If the range is small relative to ATR, you will not get paid. You need room for the trade to breathe and still hit a target before noise stops you out.
- Range width test. Measure the distance between support and resistance in pips, then divide by ATR. If the range is under about 2 ATR wide, it often trades like chop. If it is 3 to 5 ATR wide, it often gives cleaner swings.
- Pair selection. Use ATR to avoid pairs that look like ranges but have thin payoff after spread. This also helps you avoid taking too many low quality setups, a common driver of overtrading.
ATR does not predict direction. It tells you whether your stop and target make sense for the current environment.
Support and Resistance Mapping Tools (Pivots, Prior Highs and Lows)
You need levels that other traders also see. Simple tools work best.
- Pivot points.
- Pros. Fast, consistent, and widely watched. Useful on intraday ranges.
- Cons. They can clutter your chart. Price can respect multiple pivots, which can confuse your plan.
- How to use. Mark the nearest pivot above and below price. Treat them as zones, not exact prices. Combine with a clear range boundary.
- Prior period highs and lows.
- Pros. Clean. Objective. Strong reaction points around the prior day high and low, prior week high and low, and session high and low.
- Cons. They can fail during news or when a real trend starts. They also attract stop runs before reversal.
- How to use. Mark prior day high and low first. Add prior week high and low for context. Use them as the outer walls of a range, then trade rejection with tight rules.
A Step-by-Step Range Trading Plan You Can Follow Daily
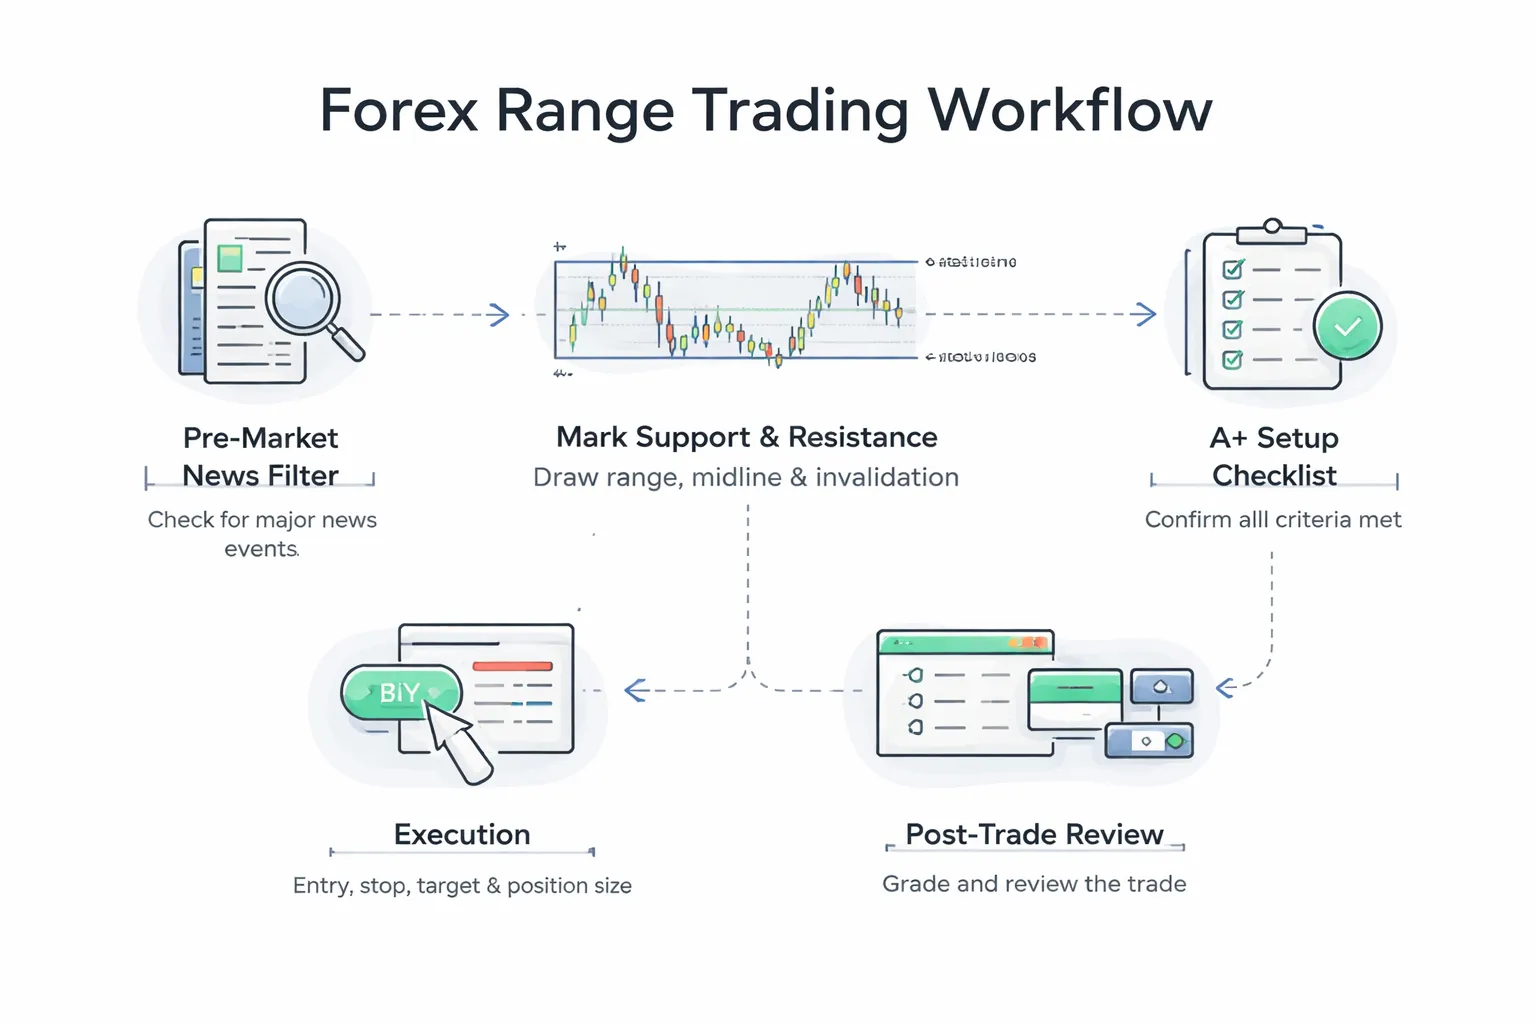
Pre-market routine, news scan, calendar red flags, and do-not-trade windows
- Check the economic calendar first. Mark high-impact events for both currencies in your pair. Focus on central bank decisions, CPI, jobs data, GDP, and speeches.
- Create do-not-trade windows. Skip new entries 30 minutes before and 30 minutes after high-impact releases. Widen to 60 minutes on central bank events and press conferences.
- Scan headlines in 3 minutes. Look for surprise risk events, interventions, emergency meetings, or major geopolitical escalation. If you see uncertainty, trade smaller or stand down.
- Check session context. Range trades work best when price respects levels. If you expect a trend day due to news or strong session momentum, avoid fading boundaries.
- Set a daily limit. Define max trades per pair and a max daily loss. Stop when you hit either.
Marking the range, boundaries, midline, and invalidation point
- Start with a higher time frame. Use H4 and H1 to find the active box. Then execute on M15 or M5.
- Draw the boundaries. Mark the most touched swing high zone and swing low zone. Use zones, not single lines. Keep the zones tight.
- Require at least three reactions. You want multiple rejections across time, not one clean touch.
- Measure the range size with ATR. If the range height is less than 1x to 1.5x your trading time frame ATR, spreads and noise can dominate. Skip it.
- Draw the midline. Put it at the 50% level of the range. Treat it as a profit-taking area and a decision point. Many ranges flip there.
- Set the invalidation point. Decide what proves you wrong before you enter. Use a close beyond the boundary on your execution time frame, or a break plus retest that holds.
Defining your A+ setup criteria and acceptable confirmation signals
- Trade only at the edges. You buy at support and sell at resistance. You do not initiate at the midline unless your plan allows a clear midline bounce setup.
- Define your A+ filter list. Keep it short and strict.
- A+ range conditions.
- Clear boundaries on H1 or higher.
- At least three clean reactions at each side.
- No high-impact news in your do-not-trade window.
- Range height supports your target, at least 2R potential from entry area to a realistic exit.
- A+ entry conditions at the boundary.
- Price reaches your zone and slows.
- Wicks show rejection or a failed push through the zone.
- RSI or Stochastic shows loss of momentum at the edge, divergence helps but do not force it.
- Optional, a simple reversal candle pattern if you use them. Keep rules fixed. See key candlestick patterns.
- What does not count as confirmation.
- One oscillator signal in isolation.
- Entering before price reaches the boundary.
- Chasing after the first bounce already moved far from the edge.
Execution checklist, entry, stop, target, size, and contingency plan
- 1) Choose the entry method.
- Conservative: wait for a close back inside the range, then enter on a small pullback.
- Aggressive: enter on the first clear rejection wick at the zone, only if spreads stay stable.
- 2) Place the stop where the range is proven wrong.
- Put the stop beyond the zone plus a volatility buffer. Use a fraction of ATR on your execution time frame.
- Do not put the stop inside the zone. You invite stop runs.
- 3) Set targets before you enter.
- Target 1: midline for partial profit or to reduce risk.
- Target 2: opposite boundary, but do not demand the exact edge. Exit before the zone where reactions start.
- Skip trades that cannot reach at least 1.5R to 2R based on realistic targets.
- 4) Size the position by risk, not by feeling.
- Risk a fixed percent per trade. Many traders use 0.25% to 1%.
- Calculate size from stop distance in pips and your risk amount.
- If spread is large relative to stop size, reduce size or skip the trade.
- 5) Define your management rules.
- Move stop to break-even only after price proves the bounce, for example after Target 1 hits or after a structure high or low forms away from the boundary.
- Avoid tight trailing stops in ranges. You will get chopped out.
- 6) Contingency plan for breakouts.
- If price closes beyond your invalidation point, exit. Do not average down.
- Do not flip direction immediately. Wait for a break and retest or a new structure to form.
- If volatility spikes around news, step aside. Your edge fades fast.
| Item | Rule |
|---|---|
| Trade location | Only at support or resistance zones. |
| News filter | No new entries 30 to 60 minutes around high-impact releases. |
| Stop | Beyond boundary plus ATR buffer, invalidation defined in advance. |
| Target | Midline first, opposite boundary second, aim for 1.5R to 2R minimum. |
| Risk | Fixed percent per trade, size from stop distance. |
| Max damage | Daily loss limit and max trades per pair, stop when hit. |
Post-trade review, grading the setup and updating the playbook
- Log the trade the same day. Capture chart screenshots at entry and exit. Write the reason for entry in one sentence.
- Grade it with a simple rubric.
- A: Took the trade at the edge, followed rules, clean range, correct sizing.
- B: Followed rules but range quality was lower, or entry was late.
- C: Broke a rule, traded mid-range, ignored news, or changed targets mid-trade.
- F: Moved stop away, averaged down, revenge traded, or exceeded daily loss limit.
- Track a few metrics.
- Win rate by setup type.
- Average R per trade and per day.
- Profit factor for A trades only, then for all trades.
- Largest adverse excursion versus your stop buffer.
- Update your playbook weekly.
- Keep what works in A trades.
- Remove rules that you do not follow.
- Add one improvement at a time, for example a stricter news window or a larger minimum range size.
Worked Examples: How a Forex Range Trade Plays Out
Example 1: Clean support bounce with partial take-profit at mid-range
Pair and context: EUR/USD, London session. Price has respected a 40 pip box for two days.
Range: Support 1.0800, resistance 1.0840, mid-range 1.0820.
- Entry: Buy 1.0806 after a 15 minute close back above 1.0805.
- Stop: 1.0793, 13 pips risk. Stop sits below support plus buffer.
- TP1: 1.0820, take 50 percent off at mid-range. +14 pips on half size.
- TP2: 1.0838, take the rest near resistance. +32 pips on half size.
Outcome: Price tags mid-range within 40 minutes, you bank TP1. Price chops for an hour, then pushes to 1.0838 and fills TP2.
Trade math in R: Risk is 13 pips. TP1 is +14 pips on half size, so +0.54R. TP2 is +32 pips on half size, so +1.23R. Total +1.77R.
What made it safe: You got paid at mid-range, so you reduced exposure before the hardest part of the range. You did not hold full size into resistance.
Example 2: Resistance fade that fails and how the stop saved the account
Pair and context: GBP/USD, New York morning. A 55 pip range has held three times, but highs are getting tighter.
Range: Support 1.2610, resistance 1.2665, mid-range 1.2638.
- Entry: Sell 1.2660 after price rejects 1.2665 and closes back below 1.2660 on the 5 minute.
- Stop: 1.2680, 20 pips risk. Stop sits above the range high plus buffer.
- TP plan: TP1 1.2638, TP2 1.2615.
What happens: Price drops 12 pips, then snaps higher. A news headline hits, spread widens, price rips through 1.2665 and keeps going. Your stop fills at 1.2680.
Outcome: -1R. One trade, controlled damage.
What saved you: You used a hard stop outside the box. You did not average up. You did not move the stop because price "should" stay in the range.
Practical rule: If the stop sits inside the range, you will get churned. Keep your invalidation outside the level.
Example 3: False breakout reversal (stop run) and retest entry
Pair and context: USD/JPY, Asia session. Clear range, then a quick spike above resistance during thin liquidity.
Range: Support 147.20, resistance 147.70, mid-range 147.45.
- Step 1: Price breaks to 147.82, then closes back below 147.70 on the 15 minute.
- Entry: Sell 147.66 on the retest of 147.70 from below. You wait for the retest, you do not chase the first drop.
- Stop: 147.86, 20 pips risk. Stop sits above the stop run high plus buffer.
- TP1: 147.45, scale 50 percent. +21 pips on half size.
- TP2: 147.24, exit near support. +42 pips on half size.
Outcome: Price retests, fails, then slides back into the box. TP1 hits first. Later, support prints and TP2 fills.
Trade math in R: TP1 gives +0.53R. TP2 gives +1.05R. Total +1.58R.
Key insight: The retest filters bad breaks. It also gives you a clean stop location above the spike.
Helpful tool: If you use RSI, treat it as a filter, not an entry signal. Keep it simple, see how to use RSI the right way.
Example 4: Range-to-trend transition and how to adapt or stand aside
Pair and context: AUD/USD, pre and post data release. A stable range breaks, then holds outside the range. Conditions change.
Old range: Support 0.6520, resistance 0.6560, mid-range 0.6540.
- Before news: You skip new entries inside 15 minutes of the release. No fade trades.
- Break: Price closes above 0.6560 on the 30 minute and does not snap back.
- Confirmation: Next pullback holds 0.6560 as support and prints higher lows.
Adapt option: Stop treating 0.6560 as resistance. Your range rules no longer apply. If you trade trends, you can switch to a pullback buy with a stop below 0.6560 plus buffer, and target the next structure level.
Stand aside option: If you only trade ranges, you stop trading this pair until it builds a new box. You avoid the worst time for range systems, the first leg of a new trend.
Rule to write down: Two closes outside the range plus a successful retest means the range is likely over. Stop fading it.
Common Mistakes and How to Avoid Them
Trading a “range” that is really a pullback in a strong trend
A real range has two-sided trade. A pullback has one-sided intent.
- Mistake: You keep fading highs in an uptrend or buying lows in a downtrend because the last 20 to 50 pips look “boxed.”
- Cost: Your win rate looks fine until the trend leg resumes, then you give back weeks of gains in a few trades.
- Fix: Check higher time frame structure before you label anything a range. If price makes higher highs and higher lows above the box, treat the box as a pause, not a range.
- Rule: In a strong trend, only take the trade that aligns with it. You buy support in an uptrend, you sell resistance in a downtrend.
- Tool: Use a simple trend filter like a moving average slope so you stop fading the dominant direction. See moving average setups.
Ignoring breakout pressure
Ranges often warn you before they break. You need to read the pressure.
- Mistake: You treat every touch of support and resistance the same, even when the swings tighten and the bounces weaken.
- Cost: You enter late in the range cycle and become liquidity for the breakout.
- Watch:
- Tightening swings: Lower highs pushing into resistance, higher lows pushing into support. The box compresses.
- Volatility clue: Expansions in range size near one boundary, then quick snaps back. This often precedes a real break.
- Failed bounces: Price tags a boundary, then cannot reach the opposite side. That is pressure.
- Close location: More closes near one edge means control shifts.
- Fix: Reduce size or stop taking fades when bounces weaken. Require better confirmation, like a clear rejection and close back inside.
- Hard stop rule: Two closes outside the range plus a successful retest means the range is likely over. Stop fading it.
Overtrading boundaries
Range trading tempts you to click too often. Spreads and small losses stack fast.
- Mistake: You take every touch, you re-enter right after a stop out, you add “one more” trade to get it back.
- Cost: Death by a thousand cuts. You turn a valid edge into churn.
- Fix:
- Limit attempts: Max 1 to 2 trades per boundary per session. After that, you stand aside.
- Trade only clean touches: Skip mid-range noise. Skip messy, overlapping candles at the level.
- Require room: If the distance to target is small versus spread and stop size, you pass.
- Write a reset rule: After a loss, you wait for a new level touch and a fresh rejection. No instant re-entry.
Using stops that are too tight for forex noise and spread
Forex moves in bursts. Your stop must survive normal noise.
- Mistake: You place stops right on the line, or a few pips behind it, then you get clipped and price returns.
- Cost: You lose on good ideas. Your data becomes useless because execution fails.
- Fix:
- Use a buffer: Place your stop beyond the level plus spread and normal wick size for that pair and session.
- Anchor to structure: Put the stop past the swing high or swing low that defines the boundary, not the boundary itself.
- Match stop to range: If your stop is 10 pips but the range swings 40 to 80 pips, you trade too tight.
- Plan it first: Define stop and target before entry. Use a consistent method. See how to set stop loss and take profit.
Holding fades through major news releases
News can erase range logic in seconds. Slippage turns small risk into large loss.
- Mistake: You fade a boundary and hold through CPI, NFP, rate decisions, or a central bank press conference.
- Cost: Spread spikes, stop fills worse than planned, and a clean range becomes a trend leg.
- Fix:
- Time filter: No new range fades 30 to 60 minutes before high-impact releases on that currency.
- Position rule: If you hold a trade, reduce risk or exit before the event. Do not “hope” the range survives.
- Rebuild the box: After news, wait for price to form a new range and print clean closes. Then trade again.
Pros, Cons, and Who Range Trading Fits Best
Advantages
- Frequent opportunities. Ranges can give you multiple touches per session. You get more valid setups without chasing price.
- Clear invalidation. Your trade idea breaks at a specific level. If price closes outside the box, you exit. You do not negotiate with the chart.
- Structured decisions. You can plan entries at support or resistance, place stops beyond the range, and set targets before you click buy or sell.
- Simple execution. You trade the same two levels until price proves the range is gone.
Disadvantages
- Breakout risk. Ranges end. A clean box can fail fast and run stops. Your defense is position size, hard stops, and a close-based invalidation rule.
- Choppy fills near the edges. Price can spike through support or resistance and snap back. If your stop sits too tight, you get clipped.
- Lower R:R on many setups. If you enter late in the range, your stop still needs room, but your target shrinks. Many range trades work best with modest targets and high discipline.
- Overtrading risk. More touches can tempt you into taking every signal. Limit your trades per level and per session. If you struggle with this, read how to avoid overtrading in Forex.
Who range trading fits best
- Discretionary price action traders. You can judge range quality. You skip messy boxes. You wait for clean closes and clear rejections.
- Rules-based systematic traders. You like repeatable triggers. You can code or checklist entries at defined levels, fixed invalidation, and time filters around news.
- Traders who follow rules under stress. Range trading punishes hope. You must exit when the range breaks.
Timeframes and lifestyle fit
You get the cleanest decision-making when your range boundaries align across at least two timeframes, like H1 and M15, or D1 and H4.
Choosing pairs
- Prioritize liquidity. Trade major pairs first. They usually give tighter spreads and cleaner level reactions.
- Respect spread. Wide spreads distort range edges. They also force wider stops and smaller size. If spread takes a big share of the box height, skip the setup.
- Match the pair to the box size. You want enough daily movement to travel from one side of the range to the other. If the pair barely moves, your targets become too small.
- Watch typical session behavior. Some pairs range well during quiet hours, then break during the active session. Build your plan around the session that fits the pair.
- Be careful with thin or headline-driven pairs. They can gap and spike through levels. Your stops and fills get worse.
Safety and Compliance Notes (E-E-A-T Enhancements)
Leverage risk, small mistakes scale fast
Forex leverage turns small pricing moves into large account swings.
If you risk 1 percent per trade, a few losses stay manageable. If you risk 5 percent, a short losing streak can cut your account in half.
Range trades often use tight stops near support or resistance. Tight stops magnify execution problems. Slippage, spread widening, and stop runs can turn a planned small loss into a larger one.
Cap your leverage. Size every trade from your stop distance, not from how confident you feel.
Backtesting and forward-testing, demo first, then small live
Test your rules on the same pair, same session, and same time frame you plan to trade.
- Backtest: Record at least 50 to 100 trades. Track win rate, average win, average loss, and maximum drawdown.
- Include costs: Subtract spread and typical slippage. Add swaps if you hold overnight.
- Forward-test on demo: Trade the rules in real time for 2 to 4 weeks. Confirm you can execute entries and exits without hesitation.
- Go live small: Start with the minimum size your broker allows. Increase only after consistent results.
Keep a simple journal. Log setup, entry, stop, target, spread at entry, and outcome. Fix one issue at a time.
Broker, spread, execution quality, swaps, and trading costs
Your edge in a range can be small. Trading costs can erase it.
- Spread and commissions: Compare the typical spread during your trading session, not the advertised minimum.
- Spread widening: Expect wider spreads during rollovers, news, and thin liquidity. Avoid placing limit entries right before these periods.
- Execution: Check fill quality on stops and limits. Poor execution shows up as frequent negative slippage.
- Swaps: Range trades that hold overnight pay or earn swap. One-sided swap costs can turn a breakeven system negative.
- Margin rules: Know your stop-out level and margin call policy. A spike can force-liquidate you even if your idea was correct.
Risk disclaimer and responsible trading mindset
Forex trading involves significant risk. You can lose more than your deposit if you trade leveraged products, depending on your broker and account protections.
Trade a plan. Define your maximum daily loss and stop trading when you hit it.
Do not treat range trading as a constant signal machine. Stand aside during major news and during clear breakout conditions.
If you use hedges, learn the real costs and margin impact first. See hedging in forex.
Frequently Asked Questions
What is a range trading strategy in forex?
You trade between clear support and resistance. You buy near support and sell near resistance. You target the middle or the opposite edge. You cut losses fast if price breaks and holds beyond the range.
Which time frames work best for range trading?
Start with H1 to D1 for range structure. Use M5 to M15 for entries if you scalp. Higher time frames give cleaner levels. Lower time frames give more trades, more noise, and more false breaks.
How do you confirm a valid range?
Mark at least two clean touches at support and resistance. Check that the swing highs and lows stay inside the same band. Avoid ranges with large single-candle spikes. Check ATR to see if the range has enough room after spread.
How do you draw support and resistance for range trades?
Draw zones, not thin lines. Use recent swing highs and lows. Add the wick area where price rejected. Keep levels simple. If you need many lines, you do not have a range, you have chop.
Where do you place the stop loss in a range trade?
Put it beyond the zone, past the wick extremes. Add a small buffer for spread and normal volatility. If your stop sits inside the range, you will get stopped on noise. Size your position so one stop stays within your risk limit.
What is a safe take profit for range trading?
Use two targets. First target near the mid-range to reduce risk. Second target near the opposite boundary. Avoid placing take profit exactly on the level. Leave space so you can get filled before other orders cluster.
How do you avoid false breakouts?
Wait for a close outside the range on your trading time frame. Then wait for a retest that holds. Skip trades when candles expand fast and volume spikes around news. Reduce size when volatility rises.
Is range trading mean reversion?
Often, yes. You bet price returns toward the middle of the range after it hits an edge. You still need a clear invalidation point. If price starts printing higher highs or lower lows, treat it as a transition, not a range.
Which indicators help with range trading?
Keep it minimal. ATR helps judge room and stop distance. RSI or Stochastic can help time entries at the edges, but do not use them alone. Price structure and levels decide the trade.
What currency pairs are best for range trading?
Pick pairs with tight spreads and steady liquidity, like EUR/USD and USD/JPY. Check average spread versus your target. Avoid pairs that jump on thin liquidity. Also check correlation so you do not stack the same risk twice.
Should you trade ranges during major news?
No. News can break levels in seconds, then reverse. Spreads can widen and stops can slip. Stand aside before high-impact releases and during the first volatility wave. Trade again after price forms a new structure.
How much risk should you use per range trade?
Keep it small and fixed. Many traders use 0.25 to 1 percent per trade. Range trading can deliver clusters of losses during breakout phases. A low, consistent risk keeps you in the game when conditions change.
How do you place a range trade step by step?
Mark the range and zones. Define entry trigger at the edge. Place stop beyond the zone. Set targets at mid-range and the opposite edge. Calculate size from your stop distance. Follow your order steps in how to place a forex trade.
Conclusion
Range trading works when price respects support and resistance. It fails when price starts a breakout cycle. Your job is to trade the former and survive the latter.
- Trade the edges. Use the zone, not a single line. Wait for your trigger.
- Place stops where your idea breaks. Beyond the zone, not inside it.
- Take profit in stages. Scale at mid-range. Finish at the opposite edge.
- Keep risk fixed. Use the same percent risk per trade across pairs and sessions.
- Stand down fast. After two clean breakout closes beyond the range, stop fading the edge and reassess.
Final tip. Write these rules into your checklist and follow them trade by trade. Use a simple forex trading plan so your entries, stops, and position size stay consistent when the range turns into a trend.
-
Stop Loss vs Take Profit: Differences, Examples & Best Practices
7 months ago -
Forex Trading Psychology Tips: How to Stay Disciplined and Consistent
7 months ago -
How to Set Stop Loss and Take Profit (Step-by-Step)
7 months ago -
Forex Order Types Explained: Market vs Limit vs Stop Orders
7 months ago -
Understanding Forex Candlestick Charts (Beginner Guide)
7 months ago
-
- Higher-timeframe bias, map the range inside the larger structure
- ADX guidelines for range conditions, and why ADX alone fails
- ATR and realized volatility, spot compression versus expansion
- Moving average slope and spacing, a fast trend-versus-range filter
- Session behavior, London and New York can break the “quiet” Asian range
-
- Zone-based levels, why rectangles beat single lines in forex
- Minimum touches, spacing, and symmetry, a checklist for range quality
- Wick rejections and failed auctions, reading acceptance vs. rejection
- Confluence factors, round numbers, prior day high/low, weekly levels, VWAP
- Avoiding “level clutter”, selecting the 2 to 4 levels that matter
-
- Pre-market routine, news scan, calendar red flags, and do-not-trade windows
- Marking the range, boundaries, midline, and invalidation point
- Defining your A+ setup criteria and acceptable confirmation signals
- Execution checklist, entry, stop, target, size, and contingency plan
- Post-trade review, grading the setup and updating the playbook
-
- What is a range trading strategy in forex?
- Which time frames work best for range trading?
- How do you confirm a valid range?
- How do you draw support and resistance for range trades?
- Where do you place the stop loss in a range trade?
- What is a safe take profit for range trading?
- How do you avoid false breakouts?
- Is range trading mean reversion?
- Which indicators help with range trading?
- What currency pairs are best for range trading?
- Should you trade ranges during major news?
- How much risk should you use per range trade?
- How do you place a range trade step by step?
-
-
- Higher-timeframe bias, map the range inside the larger structure
- ADX guidelines for range conditions, and why ADX alone fails
- ATR and realized volatility, spot compression versus expansion
- Moving average slope and spacing, a fast trend-versus-range filter
- Session behavior, London and New York can break the “quiet” Asian range
-
- Zone-based levels, why rectangles beat single lines in forex
- Minimum touches, spacing, and symmetry, a checklist for range quality
- Wick rejections and failed auctions, reading acceptance vs. rejection
- Confluence factors, round numbers, prior day high/low, weekly levels, VWAP
- Avoiding “level clutter”, selecting the 2 to 4 levels that matter
-
- Pre-market routine, news scan, calendar red flags, and do-not-trade windows
- Marking the range, boundaries, midline, and invalidation point
- Defining your A+ setup criteria and acceptable confirmation signals
- Execution checklist, entry, stop, target, size, and contingency plan
- Post-trade review, grading the setup and updating the playbook
-
- What is a range trading strategy in forex?
- Which time frames work best for range trading?
- How do you confirm a valid range?
- How do you draw support and resistance for range trades?
- Where do you place the stop loss in a range trade?
- What is a safe take profit for range trading?
- How do you avoid false breakouts?
- Is range trading mean reversion?
- Which indicators help with range trading?
- What currency pairs are best for range trading?
- Should you trade ranges during major news?
- How much risk should you use per range trade?
- How do you place a range trade step by step?
-
-
How to Place a Forex Trade Step by Step (Your First Trade Explained)
5 months ago -
Forex Trading vs Crypto Trading: Which Market Is Better for Beginners?
5 months ago -
Forex Lot Size Calculator: How to Use It to Size Trades Correctly
7 months ago -
How to Calculate Position Size in Forex (Position Sizing Formula + Examples)
7 months ago -
Forex Leverage Explained: How It Works, Pros, Cons & Examples
7 months ago
-
Forex Trading Platforms Comparison: MetaTrader vs cTrader vs TradingView
7 months ago -
Stop Loss vs Take Profit: Differences, Examples & Best Practices
7 months ago -
Is Forex Trading Legal in the United States? Rules, Regulators & What to Know
7 months ago -
Forex Leverage Explained: How It Works, Pros, Cons & Examples
7 months ago -
Forex Market Hours & Trading Sessions Explained (Best Times to Trade)
7 months ago