RSI Indicator in Forex: Best Settings, Signals & Simple Strategies

RSI helps you spot momentum shifts in forex fast. It measures recent gains versus recent losses and prints a line from 0 to 100. You use it to time entries, exits, and filters, if you read it in context.
This guide shows you the RSI settings that matter, the signals traders use, and simple strategies you can test. You will learn the default 14-period setup and when to switch to faster or slower periods. You will learn how to read overbought and oversold levels, centerline crosses, and divergence. You will also learn clear rules for trend filtering, stop placement, and avoiding weak signals in ranges.
If RSI pushes you into too many trades, read our guide on how to avoid overtrading in forex.
In het kort:
- Start with RSI 14, it fits most forex pairs and timeframes.
- Use faster periods like 7 to 9 for more signals, expect more noise.
- Use slower periods like 21 to 28 to cut signals, expect later entries.
- Treat 70 and 30 as alerts, not automatic buy or sell triggers.
- In trends, use a trend filter and favor pullbacks, not tops and bottoms.
- Use the 50 centerline to confirm bias, above 50 supports longs, below 50 supports shorts.
- Use divergence as a warning, then wait for price confirmation before you act.
- Place stops beyond structure, then size the position so the stop makes sense.
- Skip range chop, avoid rapid flip signals around 50.
- Test your rules on your pair and timeframe, track win rate, average win, average loss, and maximum drawdown.
What the RSI indicator is (and what it is not)
Momentum vs price, what RSI actually measures
RSI is a momentum oscillator. It measures how fast your price has moved over a lookback period.
It does not measure value. It does not tell you where price must go next. It does not predict reversals by itself.
RSI compares average gains to average losses. It then converts that ratio into a 0 to 100 reading.
- High RSI means recent up moves have been stronger than recent down moves.
- Low RSI means recent down moves have been stronger than recent up moves.
- 50 acts as a momentum midpoint. Above 50 supports bullish pressure, below 50 supports bearish pressure.
RSI reacts to price, it does not lead it. Treat it as a filter and a timing aid, not a trigger.
When RSI is most useful in Forex
RSI works best when your pair moves cleanly and liquidity stays steady. It struggles when price chops and spreads widen.
- Liquid pairs like EURUSD, GBPUSD, USDJPY, and AUDUSD tend to give cleaner momentum swings.
- Trending conditions let you use RSI for trend bias. Use above 50 to support longs, below 50 to support shorts.
- Pullbacks in trends often show RSI dips and recoveries. That gives you a simple way to time continuation, after price confirms.
- Choppy sessions create fast flips around 50. You get more false signals and more whipsaws.
- News spikes can pin RSI at extremes while price keeps running. Momentum can stay extreme longer than you can stay comfortable.
Common myths, overbought means sell, oversold means buy
Overbought and oversold describe momentum, not an automatic turning point.
- Myth: RSI overbought means you should sell. Reality: in strong uptrends RSI can hold above 70 for long stretches while price keeps rising.
- Myth: RSI oversold means you should buy. Reality: in strong downtrends RSI can hold below 30 while price keeps falling.
- Myth: one RSI level works everywhere. Reality: pairs and timeframes behave differently, your levels need testing.
Use extremes as a condition, not a trade. Combine them with structure, trend context, and price confirmation. If you do not test, you guess. Use a simple process to validate your RSI rules in your own data, see how to backtest a Forex strategy.
How RSI is calculated and how to read it correctly
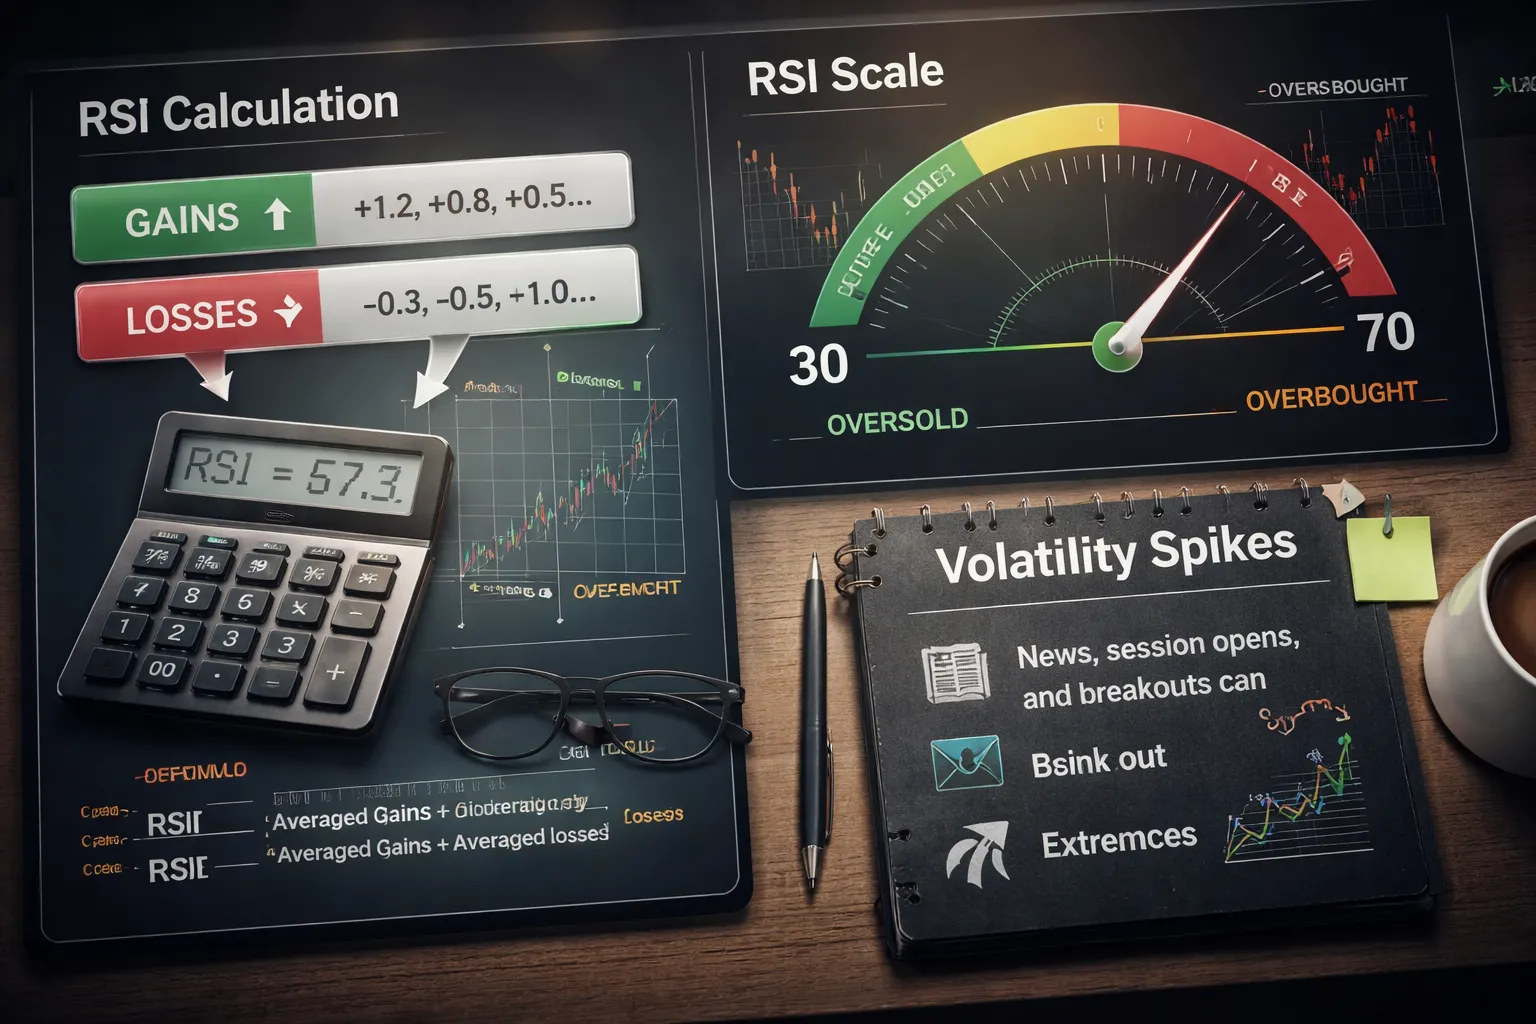
RSI formula in plain English
RSI measures the balance between recent up closes and down closes.
It uses two parts, average gain and average loss, over a set lookback, often 14 candles.
- Step 1. For each candle, calculate the change from the prior close.
- Step 2. If the change is up, that amount counts as a gain. If it is down, the absolute value counts as a loss.
- Step 3. Average the gains and average the losses over your lookback period.
- Step 4. Compare them using RS, which is average gain divided by average loss.
- Step 5. Convert RS into RSI on a 0 to 100 scale.
The math looks like this.
- RS = Average Gain / Average Loss
- RSI = 100 - (100 / (1 + RS))
Practical read. If recent gains outweigh losses, RSI rises. If losses outweigh gains, RSI falls. If losses go near zero, RSI can spike fast.
How to read the 0 to 100 scale, and why 50 matters
RSI moves between 0 and 100. Extremes show one sided momentum. The middle shows balance.
- Above 70 means gains dominate. Price often pushes in one direction.
- Below 30 means losses dominate. Selling pressure stays in control.
- 50 is the line that matters for trend context.
RSI at 50 means average gains and losses match. Above 50, bulls control the recent closes. Below 50, bears control them.
Use 50 as a filter.
- In an uptrend, you want RSI to hold above 50 most of the time. Pullbacks often stall in the 40 to 50 zone.
- In a downtrend, you want RSI to hold below 50 most of the time. Bounces often fail in the 50 to 60 zone.
Do not treat 70 and 30 as automatic reversal levels. Treat them as conditions. You still need price to confirm near a level traders respect, like a swing high, swing low, or a clear zone. Use your support and resistance work for that.
What changes when volatility spikes
RSI reacts to the size and speed of candle closes. Volatility spikes change the game.
- News releases. One large candle can push RSI to an extreme fast. That extreme often stays pinned while price trends. Fading it early gets you run over.
- Session opens. London and New York opens can expand range. RSI can flip across 50 in minutes. A single cross has low value without structure.
- Breakouts. When price breaks a range, RSI can sit above 70 or below 30 for long periods. This is momentum, not a reversal signal.
Adjust how you read RSI during high volatility.
- Give extremes less weight. Focus more on the 50 line and prior swing points.
- Wait for the spike to settle. Look for a base, a retest, or a clear rejection before you act.
- Track your results by regime. Test your RSI rules in normal weeks and in news heavy weeks. Keep what holds up.
RSI Indicator Forex settings: best periods and levels by trading style
Default RSI 14, why it became the standard and when it’s enough
RSI 14 became the default because it balances speed and stability on most timeframes. It reacts fast enough to track momentum shifts, but it filters some noise. It also became common because many traders use it, so levels like 70 and 30 often line up with how others manage risk.
Use RSI 14 when you want a clean baseline. It works best when you trade liquid majors, you use H1 to D1, and you already filter trades with structure like swing highs and lows.
RSI 14 is enough if you can explain your entry without changing settings. If you keep tuning the period to fit the last chart, you will overfit.
RSI 9 vs RSI 21, speed vs reliability trade-off
RSI 9 reacts faster. You get more signals. You also get more whipsaws. It fits fast markets and short holding times where you accept more noise.
RSI 21 reacts slower. You get fewer signals. You get cleaner signals near real turning points. It fits higher timeframes and trend filtering where you want fewer, higher quality triggers.
- Pick RSI 9 if you scalp, you trade breakouts, or you need early momentum confirmation.
- Pick RSI 14 if you day trade and want a neutral default.
- Pick RSI 21 if you swing trade and you want to ignore small pullbacks.
Scalping settings (M1 to M15), practical ranges for period and thresholds
On M1 to M15, RSI hits extremes often. Standard 70 and 30 can fire too much. You need tighter rules and faster periods.
- Period, 7 to 10 is the practical range.
- Levels in ranges, start with 80 and 20 to reduce fake reversals.
- Levels in strong trends, use 60 and 40 as a trend filter, then trade in the trend direction.
For scalps, treat RSI as timing, not as a reason to fade the move. Use price structure for the actual level. If you need structure help, use support and resistance to anchor entries.
Day trading settings (M15 to H1), balancing signal frequency and false positives
M15 to H1 gives the best balance for RSI. Noise drops, but you still get enough setups each week.
- Period, 10 to 14.
- Mean reversion days, 70 and 30 works, but demand a clear rejection and a break of a minor swing.
- Trend days, 60 and 40 works better as a bias filter. Longs above 50, shorts below 50.
If you see many losing reversal trades, stop using 70 and 30 as entries. Use them as alerts, then wait for price to confirm.
Swing trading settings (H4 to D1), reducing noise and focusing on major moves
H4 to D1 rewards patience. RSI becomes more reliable because each bar contains more information. You can slow the indicator down and focus on fewer signals.
- Period, 14 to 21.
- Levels, 70 and 30 for classic overbought and oversold, or 60 and 40 to stay aligned with trend momentum.
On swing timeframes, the 50 line matters more than extremes. A strong market often holds above 40 in uptrends and below 60 in downtrends.
Custom thresholds (80/20, 70/30, 60/40), how to choose based on regime
Pick levels based on what the market keeps doing, not on what you want it to do.
- 80 and 20, use in high volatility or very choppy sessions. It cuts down on signals and forces stronger extremes.
- 70 and 30, use in normal volatility when price respects clear ranges and swings.
- 60 and 40, use in trends. It keeps you from shorting strong uptrends just because RSI hit 70.
Match thresholds to the week. In news heavy weeks, extremes can stay pinned. In calm weeks, 70 and 30 can mark useful turning zones.
Pair-specific considerations (major pairs vs JPY crosses vs gold-linked pairs)
Different instruments produce different RSI behavior because they trend and spike differently.
- Major pairs, EURUSD, GBPUSD, USDCHF. Start with RSI 14 and 70 and 30 on M15 to H1. Adjust thresholds before you adjust period.
- JPY crosses, GBPJPY, EURJPY. Expect sharper swings and more overshoots. Start with RSI 9 to 14 and consider 80 and 20 on lower timeframes.
- Gold and gold-linked moves, XAUUSD and pairs that react to commodity risk. Expect fast spikes and deep pullbacks. Use 80 and 20 for reversal attempts, or use 60 and 40 to trade with momentum and avoid fading strength.
Do not assume one setting fits all charts. Test per instrument. Keep the same rules for at least 50 to 100 trades before you judge performance.
A quick settings decision tree to pick a starting configuration
- Step 1, choose your timeframe. M1 to M15, start RSI 7 to 10. M15 to H1, start RSI 10 to 14. H4 to D1, start RSI 14 to 21.
- Step 2, define your regime. If price trends and pullbacks stay shallow, use 60 and 40. If price ranges and snaps back, use 70 and 30. If price spikes and whipsaws, use 80 and 20.
- Step 3, pick one adjustment only. First adjust levels. Only adjust the period if levels do not fix the problem.
- Step 4, set a simple RSI rule. Trend filter, RSI above 50 for longs, below 50 for shorts. Entry timing, use a rejection at your level plus a break of a nearby swing.
- Step 5, backtest the baseline. Log wins, losses, and market conditions. Then change one variable at a time.
| Trading style | Timeframe | Starting period | Starting levels | Main use |
|---|---|---|---|---|
| Scalping | M1 to M15 | 7 to 10 | 80/20 or 60/40 | Timing and momentum filter |
| Day trading | M15 to H1 | 10 to 14 | 70/30 or 60/40 | Balance signals and noise |
| Swing trading | H4 to D1 | 14 to 21 | 70/30 or 60/40 | Major turns and trend bias |
The RSI signals that matter most in Forex
Overbought and oversold are conditions, not entries
RSI overbought and oversold works best as a context filter.
- Overbought means price pushed hard up. It does not mean price must drop.
- Oversold means price pushed hard down. It does not mean price must bounce.
- In strong trends, RSI can stay above 70 or below 30 for long stretches. If you fade that too early, you fight momentum.
- Use overbought and oversold to prepare a plan. Then wait for a trigger, like a break of structure, a close back below 70, or a failure swing.
The 50 centerline cross is your momentum check
The RSI 50 level acts like a simple momentum switch.
- Above 50, bulls control momentum. You favor longs and buy pullbacks.
- Below 50, bears control momentum. You favor shorts and sell rallies.
- A clean centerline cross works best after a consolidation or a pullback. It often fails in choppy ranges.
- Combine it with price structure. Higher highs and higher lows plus RSI holding above 50 supports continuation.
Range shifts in trends, use 40 to 80 and 20 to 60 behavior
In trends, RSI often trades in a higher or lower band. This matters more than 70 and 30.
- Uptrend range shift, RSI tends to hold 40 to 80. Pullbacks often stall near 40 to 50 and then rotate up.
- Downtrend range shift, RSI tends to hold 20 to 60. Bounces often fail near 50 to 60 and then roll over.
- If an uptrend starts printing RSI lows under 40 often, trend strength fades. If a downtrend starts holding above 60 often, selling pressure fades.
- Use these bands to time pullback entries with the trend, not against it.
RSI divergence, what it signals and what it does not
Divergence points to momentum loss. It does not guarantee a reversal. Treat it as an early warning.
- Bullish divergence, price makes a lower low, RSI makes a higher low. This suggests selling pressure weakens.
- Bearish divergence, price makes a higher high, RSI makes a lower high. This suggests buying pressure weakens.
- Hidden bullish divergence, price makes a higher low, RSI makes a lower low. This often supports trend continuation in uptrends.
- Hidden bearish divergence, price makes a lower high, RSI makes a higher high. This often supports trend continuation in downtrends.
- Demand confirmation from price. Use a break of the most recent swing, a close back across 50, or a failure swing.
Failure swings, a reversal signal many traders miss
Failure swings use RSI alone, but they work best when price also starts to turn.
- Bullish failure swing: RSI drops below 30, rebounds, pulls back but holds above 30, then breaks the prior RSI peak.
- Bearish failure swing: RSI pushes above 70, drops, rebounds but stays below 70, then breaks the prior RSI low.
- You get a clear trigger point, the break of the prior RSI swing. This reduces guesswork versus trading the first touch of 70 or 30.
- Use it near major support and resistance zones for better odds. For clean levels, see this support and resistance range trading guide.
Multiple timeframe RSI alignment for higher-quality signals
Alignment reduces false signals. You trade with the bigger pressure.
- Pick a higher timeframe for bias, then a lower timeframe for timing.
- Example workflow: H4 RSI above 50 for long bias, then M15 RSI pulls back to 40 to 50 and turns up.
- Avoid taking a lower timeframe overbought short if the higher timeframe RSI holds above 50 and trends in the 40 to 80 band.
- Best setups show the same story across timeframes, trend bias on higher timeframe, trigger on lower timeframe.
Simple RSI strategies (rules, entries, exits, and examples)
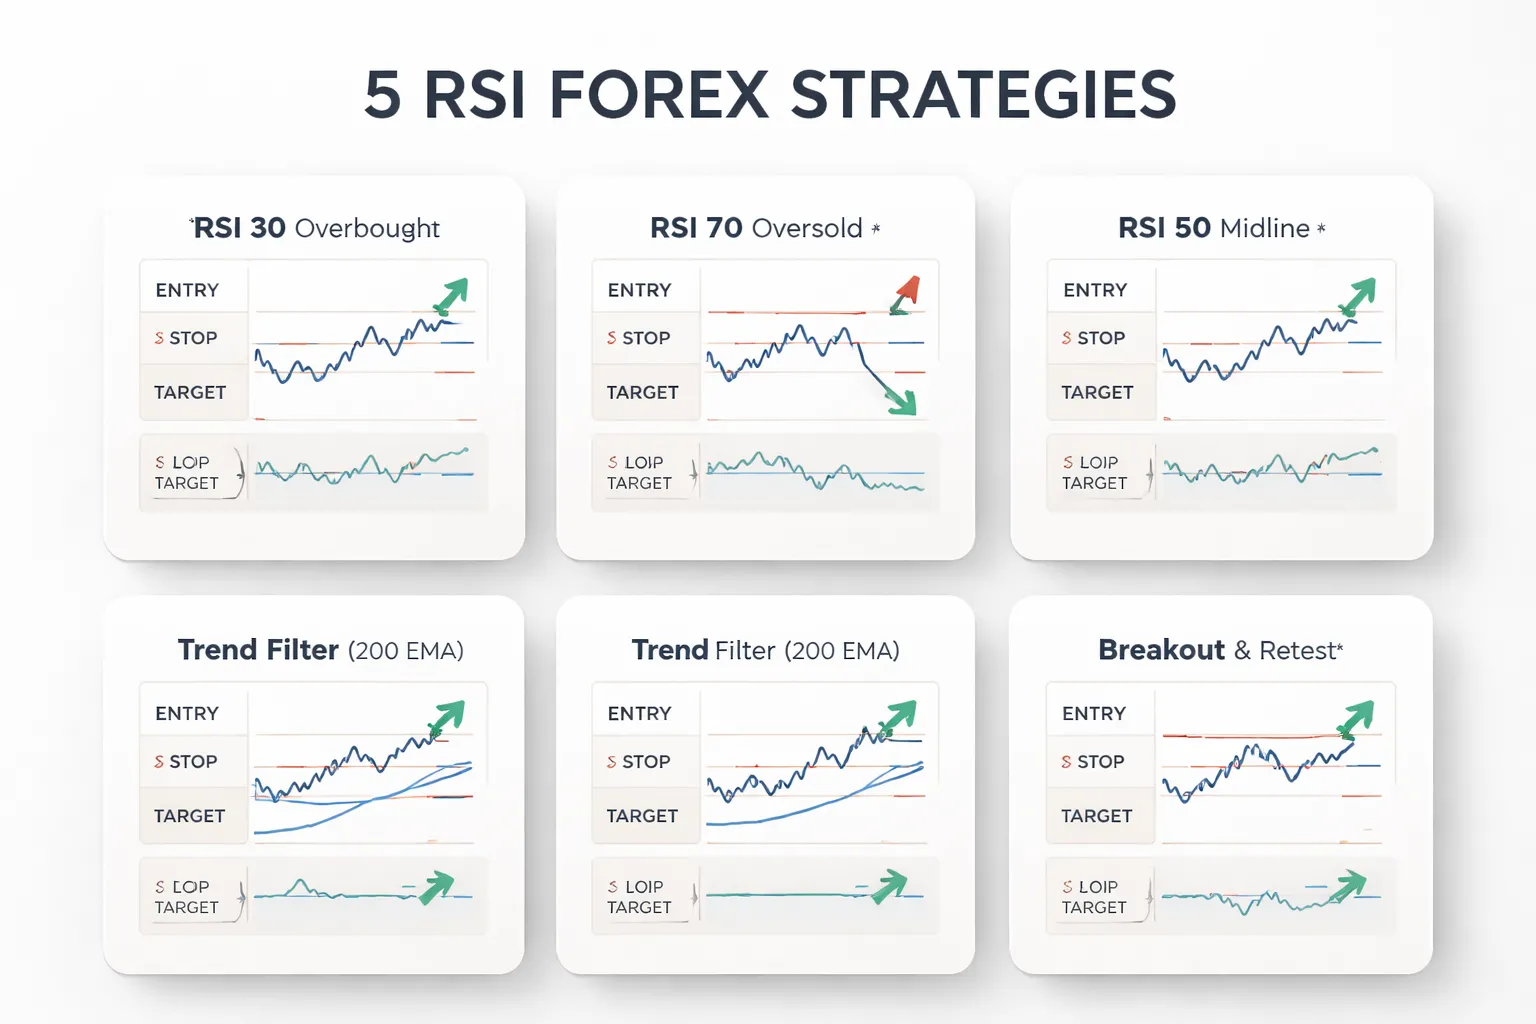
Strategy 1: Trend-following pullbacks using RSI and a moving average filter
You trade with the trend. You use RSI for pullback timing.
- Market filter: Price above the 200 EMA for longs. Price below the 200 EMA for shorts.
- RSI settings: 14-period, levels 40, 50, 60.
- Long rules: Price above 200 EMA. RSI pulls back into 40 to 50. RSI turns up and closes back above 50.
- Short rules: Price below 200 EMA. RSI rallies into 50 to 60. RSI turns down and closes back below 50.
- Entry: Enter on the next candle after the RSI close back through 50, or on a break of the pullback candle high for longs, low for shorts.
- Stop: Beyond the pullback swing low for longs, swing high for shorts.
- Exit: Take profit at prior structure high or low. Or scale at 1R and trail under higher lows for longs, above lower highs for shorts.
Example: EURUSD uptrend. Price holds above 200 EMA on H1. RSI drops to 45, then prints 52 on the next close. You enter long on the next candle. Stop goes below the pullback low. Target the last H1 swing high. If price breaks that high, trail the stop under the next higher low.
Strategy 2: Range trading with RSI plus support and resistance confirmation
You only range trade inside clear boundaries. You avoid ranges during strong trends.
- Range definition: At least two touches at the top and bottom. Clean mid-range chop.
- RSI settings: 14-period, levels 30 and 70.
- Long rules: Price taps range support. RSI goes below 30, then closes back above 30. Price holds support on the close.
- Short rules: Price taps range resistance. RSI goes above 70, then closes back below 70. Price holds resistance on the close.
- Entry: Enter on the close back inside the RSI level, or on a retest of support or resistance with a rejection candle.
- Stop: A few pips beyond the range boundary, past the rejection swing.
- Exit: Primary target is the range midpoint. Final target is the opposite side of the range. Exit early if RSI stalls near 50 and price fails to move away from your entry.
Example: GBPUSD trades a 60-pip box on M30. Price hits range support. RSI prints 27, then closes at 33. You enter long. Stop goes under the support low. Take partial at the midline. Take the rest near range resistance, or when RSI reaches 65 to 70 and price hits the top boundary.
Strategy 3: Divergence strategy with a confirmation trigger (break of structure)
Divergence alone is not an entry. You wait for price to confirm.
- Setup: Regular bullish divergence. Price makes a lower low. RSI makes a higher low. Regular bearish divergence is the reverse.
- Context filter: Use it at prior support or resistance, or after an extended push with clear momentum loss.
- Confirmation trigger: Break of structure. For bullish, price breaks the most recent lower high. For bearish, price breaks the most recent higher low.
- Entry: Enter on the structure break close, or on a retest of the broken level.
- Stop: Beyond the divergence swing low for bullish, swing high for bearish.
- Exit: First target at the next obvious structure level. Second target at the opposite side of the current leg, or use a trail once RSI holds above 50 for bullish, below 50 for bearish.
Example: USDJPY sells off on H1. Price makes a fresh low. RSI fails to make a new low. You mark the last lower high. Price breaks and closes above it. You enter on the next pullback into that level. Stop goes below the low. Target the next resistance zone. If RSI holds above 50 during the rally, you trail under new swing lows.
Strategy 4: RSI centerline continuation entries after breakout retests
You trade breakouts with a retest. RSI 50 acts as your momentum line.
- Setup: Price breaks above resistance for longs, below support for shorts. You wait for a retest of the breakout level.
- RSI rule: For longs, RSI stays above 50 during the retest, or dips slightly below 50 and quickly reclaims it on a close. For shorts, RSI stays below 50, or pops slightly above and then closes back below.
- Entry: Enter when price rejects the retest level and RSI closes back in your direction relative to 50.
- Stop: Below the retest low for longs, above the retest high for shorts.
- Exit: Target measured move to the next structure zone. Or take 1R and trail using swing points.
Example: AUDUSD breaks above a daily resistance. On H4, price retests the level and prints a higher low. RSI holds 52 to 58 during the pullback and closes 55 on the rejection candle. You enter long. Stop goes under the retest low. Target the next daily resistance. If price runs, trail under each H4 higher low.
Strategy 5: Failure-swing reversal setup for clean, rule-based entries
This is a classic RSI pattern. It gives you a clear trigger without guessing tops or bottoms.
- Bullish failure swing: RSI drops below 30. RSI rallies above 30. RSI pulls back but holds above 30. RSI breaks above the prior RSI swing high.
- Bearish failure swing: RSI rises above 70. RSI drops below 70. RSI bounces but holds below 70. RSI breaks below the prior RSI swing low.
- Entry: Enter when RSI breaks the prior RSI swing point and price breaks the matching minor structure level.
- Stop: Beyond the price swing that formed the pattern. Do not place the stop based on RSI levels.
- Exit: Target the next support or resistance zone. Consider taking partial at 1R, then trail behind structure.
Example: NZDUSD drops into a weekly support. RSI goes to 26, then recovers to 34. RSI pulls back to 32, then pushes above the prior RSI swing high. Price also breaks above the last minor lower high. You enter long. Stop goes below the support low. Target the next H4 resistance zone.
Example trade plan template (entry trigger, invalidation, target logic)
Risk management for RSI-based Forex trading
Where to place stops, structure-based vs ATR-based
Your stop must sit where your RSI idea breaks. Put it in the market, not in your head.
- Structure-based stop: Place the stop beyond the swing that defines your setup. For longs, below the last higher low. For shorts, above the last lower high. Add a small buffer so normal spread and noise do not tag you out.
- ATR-based stop: Use ATR to match current volatility. A common range is 1.0 to 1.5 ATR from entry, placed beyond the nearest invalidation point. If ATR expands, your stop must widen or you skip the trade.
Pick one method per strategy and keep it consistent. Structure stops fit clean trends. ATR stops fit sessions with changing volatility.
Position sizing and risk per trade to survive drawdowns
RSI systems hit losing streaks, especially with faster settings. Your risk per trade decides if you survive them.
- Risk a fixed percent per trade. Use 0.25 to 1.00 percent as a practical band for most retail accounts.
- Size from the stop distance, not from confidence. Wider stop means smaller position.
- Plan for drawdowns. If you risk 1 percent, a 10-loss streak cuts you about 10 percent before compounding effects and spread. If you risk 0.5 percent, the same streak cuts you about 5 percent.
Use a hard rule for daily risk. Example, stop trading for the day after 2R of losses. This blocks revenge trading after RSI whipsaws.
Setting take-profit targets, R-multiples, nearby liquidity, and partial exits
Set targets before you enter. RSI signals work best when your exit logic stays simple.
- R-multiple baseline: Take first profit at 1R. If your stop is 25 pips, your first target is 25 pips.
- Liquidity targets: Aim the runner at obvious pools. Prior swing high or low. Session high or low. Round numbers. Untested daily levels.
- Partial exits: Scale out once. Example, close 50 percent at 1R, then trail the rest only after price breaks structure in your favor.
Do not set targets inside nearby support or resistance. If price must punch through a level to pay you, lower size or skip the trade. If you need a structure filter, use simple chart levels and patterns, see chart patterns.
How to avoid overtrading when using faster RSI settings
Fast RSI settings create more signals. Most are noise. You need limits that cut decisions.
- Trade only at planned times. Example, London open to London mid, or New York first 2 hours. Skip the rest.
- Cap trades per pair per day. Example, max 1 to 2 trades per pair.
- Require one higher timeframe filter. Example, only take longs if the higher timeframe RSI holds above 50 and price makes higher lows.
- Ban trades near RSI 50 in tight ranges. If RSI flips across 50 every few candles, you are in chop.
- Log signals you skip. This builds proof that doing less improves results.
Overtrading is a risk problem. Treat it like leverage. Set limits, then enforce them.
How to combine RSI with other tools (without overcomplicating)
Price action confirmation: levels, candles, and market structure
Use RSI to spot momentum. Use price to confirm direction.
- Start with a level. Mark the last swing high and swing low. Mark obvious daily or 4H support and resistance.
- Wait for structure. For longs, you want a higher low and a break above the prior minor high. For shorts, you want a lower high and a break below the prior minor low.
- Use simple candle rules. Take the trade after a clear rejection at your level. Examples, a pin bar with a close back inside the range, or an engulfing close through the prior candle.
- Use RSI as the timing trigger. For longs, prefer RSI holding above 50 and turning up from 40 to 50. For shorts, prefer RSI holding below 50 and turning down from 60 to 50.
Skip signals where RSI diverges but price sits in the middle of a range. Divergence works best near a level, after a run, and into liquidity.
Trend filters: moving averages and higher-high, higher-low logic
One trend filter is enough. Pick one and keep it fixed.
- 200 EMA bias filter. Only buy if price stays above the 200 EMA. Only sell if price stays below the 200 EMA.
- Market structure bias filter. Only buy if your chart prints higher highs and higher lows. Only sell if it prints lower highs and lower lows.
- RSI regime filter. In uptrends, RSI often holds above 40 and peaks above 60. In downtrends, RSI often holds below 60 and dips below 40. Trade in the direction of that behavior.
If the filter disagrees with your RSI entry signal, you pass. This single rule removes most low quality trades.
Volatility filters: ATR and session timing to reduce noise
RSI fails more in low range conditions. Add one volatility filter to cut chop.
- ATR floor. Check ATR(14). If ATR sits near its recent lows, spreads and noise matter more. Trade less. Aim for setups with enough room to your target and stop.
- ATR based stop sanity check. If your planned stop is smaller than current ATR, random price swings can tag you out. If your stop is several ATRs wide, your risk to reward often breaks.
- Session filter. Focus on London and New York for most major pairs. Avoid thin hours unless you trade ranges on purpose.
- News filter. Do not take fresh RSI signals minutes before high impact releases. Volatility can break any oscillator logic.
RSI plus MACD or Stochastic: when confluence helps and when it’s redundant
Two oscillators often tell you the same thing. Add a second indicator only if it answers a different question.
- Use MACD to confirm trend and momentum shifts. Example, you buy when RSI reclaims 50 and MACD histogram flips positive, or MACD line crosses above signal in the direction of your higher timeframe bias.
- Skip MACD if you already use a moving average filter. You will stack similar momentum logic and reduce trades without improving quality.
- Use Stochastic for range entries. In a defined range, Stochastic can time turns near support and resistance. Combine it with RSI only if you keep strict location rules at the range edges.
- Skip Stochastic in strong trends. It will stay overbought or oversold and push you into early exits or countertrend trades.
If you want MACD confirmation, keep it simple and use one rule. For deeper MACD settings and signals, see this MACD indicator guide.
Support and resistance mapping: using RSI to time entries at pre-planned zones
Map zones first. Use RSI second. This keeps you out of random signals.
- Step 1, mark zones. Use prior day high and low, Asia range high and low, and the last clear swing points.
- Step 2, define the setup. You only trade when price hits your zone and prints your structure or candle confirmation.
- Step 3, use RSI to time. In an uptrend, you want RSI to hold above 40, then turn up. In a downtrend, you want RSI to hold below 60, then turn down.
- Step 4, manage the trade with location. Put your stop beyond the zone and the swing. Place targets at the next mapped level, not at an RSI number.
This workflow keeps RSI as a trigger, not a decision maker. It reduces indicators, reduces trades, and improves discipline.
Backtesting and optimizing RSI settings responsibly
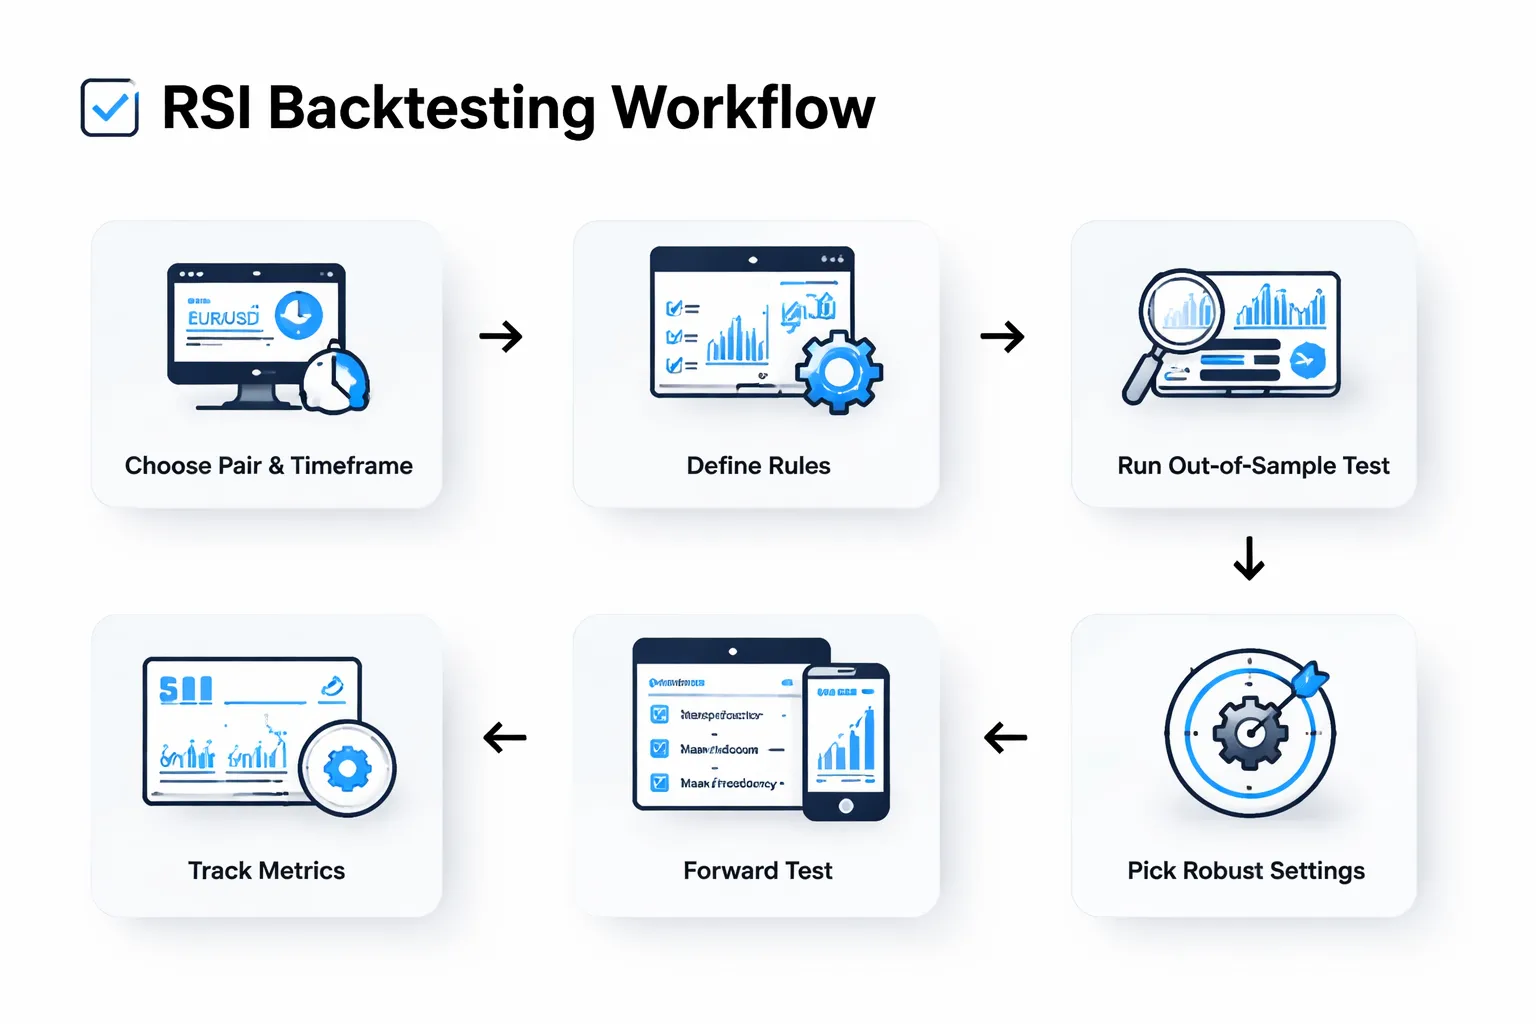
What to test first, timeframe, pair, session, and rules
Start with one setup. One market. One timeframe. One risk model. Change one variable at a time.
- Timeframe: Pick the chart you will trade live. Do not mix M15 signals with H4 stops unless your rules say so.
- Pair selection: Test one major first. Add pairs later. Many pairs move together, so your “diversification” can be fake.
- Session filter: Decide if you trade London, New York, Asia, or all day. Volatility changes signal quality and stop size.
- Strategy rules: Write rules you can code or follow without debate. Define trend filter, entry trigger, stop placement, target logic, and time stop.
- RSI settings to test: Test length and trigger levels. Examples: 14 vs 9 vs 21, and 40 to 60 vs 30 to 70. Keep the rest fixed.
Lock your location logic first. RSI should not decide structure. Price does. If your entries come from support and resistance, keep that framework stable. Use RSI as the timing tool, not the map. If you need a clean structure process, read this support and resistance trading guide.
Avoiding curve fitting, out-of-sample and forward testing
RSI is easy to over-optimize. You can “find” settings that win on old data and fail next week.
- In-sample test: Use the first chunk of data to build and tune. Example: 2018 to 2022.
- Out-of-sample test: Validate on unseen data. Example: 2023 to 2024. Do not change rules after you see results.
- Walk-forward approach: Tune on a window, then test the next window, repeat. This shows if your edge survives regime shifts.
- Forward test: Run it live in demo or micro size for 20 to 50 trades. Track slippage and spread at your broker.
- Limit settings: Test a small grid. Example: RSI length 7, 9, 14, 21. Levels 30 to 70 and 40 to 60. Too many combinations creates false “best” results.
Optimize for robustness, not perfection. You want similar performance across nearby settings, pairs, and sample periods. If one exact setting wins and everything else fails, you found noise.
Key metrics to track
Track metrics that match survival, not ego. A high win rate can still lose money.
- Win rate: Percent of winning trades. Useful, but incomplete.
- Average win and average loss: Your payoff ratio. This often matters more than win rate.
- Expectancy: Average outcome per trade. Use R-multiples. Example: +0.20R per trade.
- Max drawdown: Largest peak-to-trough decline in R or percent. This tells you if you can stick with the system.
- Trade frequency: Trades per week or month. Too few trades gives weak stats. Too many trades can hide execution problems.
- Time in trade: Average bars held. Helps you match the system to your schedule.
- Cost sensitivity: Re-run results with higher spread and slippage. RSI systems that trade often can die from costs.
Simple RSI backtest checklist for consistent evaluation
- Define the market: Pair, timeframe, and session hours.
- Define the trend filter: Example: price above a 200 EMA, or higher highs and higher lows on your structure rules.
- Define the RSI trigger: Length and levels. Example: RSI(14) holds above 40 then crosses back above 50.
- Define the entry: Exact candle condition. Example: enter on close back above the level, or on the next bar open.
- Define the stop: Beyond the swing and zone. Fixed rule, no exceptions.
- Define the target: Next mapped level, or a fixed R multiple. Write it down.
- Define position size: Fixed risk per trade, same across all tests.
- Define invalidation: Time stop, opposite signal, or structure break.
- Log every trade: Entry, exit, R, spread, screenshot, and notes on rule compliance.
- Run in-sample, then out-of-sample: No rule changes between them.
- Forward test: Minimum 20 to 50 trades before you trust the setting.
- Choose the setting that holds up: Stable results, acceptable drawdown, and manageable trade count.
Advantages, disadvantages, and common mistakes with RSI in Forex
Strengths: clarity, versatility, and momentum insight
- Clear signals. RSI gives simple reference points. 30, 50, and 70, or your tuned levels. You can define rules without guesswork.
- Momentum filter. RSI shows speed. Rising RSI supports long bias. Falling RSI supports short bias. This helps you avoid fading strong moves too early.
- Works across timeframes. You can apply the same logic on M15, H1, H4, or D1. You only adjust the settings and the expected holding time.
- Multiple use cases. You can trade mean reversion in ranges, trend continuation with the 50-line, and momentum shifts with divergences.
- Easy to combine with structure. RSI gets better when you tie it to levels and swings. Use support and resistance for location, then use RSI for timing.
Limitations: trend persistence and false signals in strong moves
- Overbought and oversold can stay pinned. In strong trends, RSI can hold above 70 or below 30 for long periods. If you keep fading it, you stack losses.
- False reversals in high momentum. RSI can drop from 80 to 70 and price can keep running. You get an early exit or an early short.
- Range bias. RSI works best in sideways markets. In trends, it needs a trend filter or different levels, like 40 to 80 in uptrends and 20 to 60 in downtrends.
- Divergence is not a timing tool by itself. Divergence can persist through multiple pushes. If you trade it without structure and confirmation, you enter too early.
- Settings change the story. RSI 7 reacts fast and whipsaws. RSI 21 reacts slow and misses turns. You must match it to your timeframe and holding period.
Mistakes to avoid
- Ignoring regime. Do not use the same trigger in a clean trend and a chop zone. Define trend first, then pick RSI rules that fit.
- Trading every touch. A single print at 70 or 30 is not a setup. Require a close back inside the level, a swing break, or a retest.
- Using RSI as a standalone entry. You need location. If you buy oversold in the middle of nowhere, spreads and noise eat you.
- Forcing divergence trades. Mark divergence, then wait for price to break structure or reclaim a key level. If it never confirms, you skip it.
- Moving levels to fit the last chart. This turns into curve fitting. Lock your rules, test them, then change one variable at a time.
- Skipping volatility checks. When ATR expands and candles stretch, RSI swings faster. Your usual thresholds fire more often and quality drops.
When to pause RSI trading
- High-impact news windows. CPI, NFP, rate decisions, central bank pressers. Spreads widen, slippage rises, and RSI signals lose meaning.
- Abnormal volatility. Large gaps, oversized candles, or sudden ATR spikes. Wait for spreads to normalize and price to start printing cleaner swings.
- Thin liquidity periods. Rollover and some holiday sessions. RSI can whipsaw from small orders and random spikes.
FAQ
What is the best RSI setting for Forex?
Start with RSI 14. It fits most pairs and timeframes. Use RSI 9 for faster signals on lower timeframes, expect more noise. Use RSI 21 for smoother signals on higher timeframes, expect fewer trades. Keep settings stable and optimize your rules, not the number.
Which RSI levels work best in trending markets?
Use 40 to 80 in uptrends and 20 to 60 in downtrends. Treat 50 as your trend filter. In strong trends, 30 and 70 can fail often. Trade pullbacks toward the midline instead of fading every extreme.
How do you confirm an RSI signal?
Confirm with price structure. Look for a clear swing low or swing high, then a break of the prior minor level. Add one more filter, trend direction or a key support and resistance zone. Skip signals that form inside tight ranges.
What is RSI divergence and does it work in Forex?
Divergence means price makes a new high or low and RSI does not. It works best at major levels and after extended moves. Treat it as an early warning, not an entry by itself. Wait for structure to break before you trade.
Is RSI better for scalping or swing trading?
It fits both. For scalping, use RSI 7 to 9 and stricter filters because noise is high. For swing trading, use RSI 14 to 21 and focus on trend pullbacks and divergence at daily or 4H levels. Your timeframe drives your expectations.
What is the best timeframe for RSI in Forex?
Use H1, H4, or D1 for cleaner signals. M5 and M15 produce more false extremes because spreads and micro volatility matter more. If you trade low timeframes, pair RSI with structure and session rules, then cut size.
Should you use RSI with other indicators?
Yes, but limit it. Combine RSI with one tool that solves a different problem. Use a trend filter like a moving average, or volatility bands. Too many indicators repeat the same information. Keep your checklist short and testable.
What are the most common RSI mistakes?
- Shorting every RSI 70 and buying every RSI 30 in strong trends.
- Ignoring spread and slippage during news spikes.
- Trading signals inside choppy ranges without structure.
- Changing RSI settings after a losing streak.
- Using divergence as an entry without confirmation.
How do you set stops and targets with RSI strategies?
Place stops beyond the swing that invalidates your setup, not at an RSI number. Use structure highs and lows. For targets, use the next key level, recent range boundaries, or a fixed R multiple. Do not hold just because RSI has not crossed back.
Does RSI work on all currency pairs?
It works better on liquid majors and active crosses. Exotic pairs add spread, gaps, and irregular swings. That distorts RSI and increases whipsaws. If you trade exotics, use higher timeframes, wider stops, and fewer trades. Expect worse fills.
How do you use RSI with chart patterns?
Use RSI as a filter, not the trigger. Trade the pattern break and use RSI to avoid weak setups, like a breakout with RSI stuck below 50. Keep patterns simple and rule based. See this guide on forex chart patterns.
Conclusion
RSI works when you treat it as a context tool. It measures momentum. It does not predict reversals.
Start with RSI 14. Use 50 to define bias. Use 30 and 70 as stretch zones. In trends, focus on 40 to 60 pullbacks and 50 line breaks. In ranges, focus on 30 to 70 fades. Always confirm with price structure, not RSI alone.
- Trend filter: Longs only above 50. Shorts only below 50.
- Entry trigger: Use your price signal first. Use RSI to pass or skip the trade.
- Exit plan: Scale out into prior highs and lows. Do not wait for RSI to hit 70 or 30.
- Risk control: Fixed risk per trade, hard stop, and a max daily loss. RSI cannot save bad sizing.
Final tip. Pick one timeframe, one RSI setting, and one rule set. Log 50 trades. Keep the rules. Change only one variable at a time. Use demo replays and a routine until your results stabilize.
-
Stop Loss vs Take Profit: Differences, Examples & Best Practices
6 months ago -
Forex Trading Psychology Tips: How to Stay Disciplined and Consistent
6 months ago -
Forex Order Types Explained: Market vs Limit vs Stop Orders
6 months ago -
How to Set Stop Loss and Take Profit (Step-by-Step)
6 months ago -
How to Start Forex Trading Step by Step (Beginner Roadmap)
6 months ago
-
- Default RSI 14, why it became the standard and when it’s enough
- RSI 9 vs RSI 21, speed vs reliability trade-off
- Scalping settings (M1 to M15), practical ranges for period and thresholds
- Day trading settings (M15 to H1), balancing signal frequency and false positives
- Swing trading settings (H4 to D1), reducing noise and focusing on major moves
- Custom thresholds (80/20, 70/30, 60/40), how to choose based on regime
- Pair-specific considerations (major pairs vs JPY crosses vs gold-linked pairs)
- A quick settings decision tree to pick a starting configuration
-
- Overbought and oversold are conditions, not entries
- The 50 centerline cross is your momentum check
- Range shifts in trends, use 40 to 80 and 20 to 60 behavior
- RSI divergence, what it signals and what it does not
- Failure swings, a reversal signal many traders miss
- Multiple timeframe RSI alignment for higher-quality signals
-
- Strategy 1: Trend-following pullbacks using RSI and a moving average filter
- Strategy 2: Range trading with RSI plus support and resistance confirmation
- Strategy 3: Divergence strategy with a confirmation trigger (break of structure)
- Strategy 4: RSI centerline continuation entries after breakout retests
- Strategy 5: Failure-swing reversal setup for clean, rule-based entries
- Example trade plan template (entry trigger, invalidation, target logic)
-
- Price action confirmation: levels, candles, and market structure
- Trend filters: moving averages and higher-high, higher-low logic
- Volatility filters: ATR and session timing to reduce noise
- RSI plus MACD or Stochastic: when confluence helps and when it’s redundant
- Support and resistance mapping: using RSI to time entries at pre-planned zones
-
- What is the best RSI setting for Forex?
- Which RSI levels work best in trending markets?
- How do you confirm an RSI signal?
- What is RSI divergence and does it work in Forex?
- Is RSI better for scalping or swing trading?
- What is the best timeframe for RSI in Forex?
- Should you use RSI with other indicators?
- What are the most common RSI mistakes?
- How do you set stops and targets with RSI strategies?
- Does RSI work on all currency pairs?
- How do you use RSI with chart patterns?
-
-
- Default RSI 14, why it became the standard and when it’s enough
- RSI 9 vs RSI 21, speed vs reliability trade-off
- Scalping settings (M1 to M15), practical ranges for period and thresholds
- Day trading settings (M15 to H1), balancing signal frequency and false positives
- Swing trading settings (H4 to D1), reducing noise and focusing on major moves
- Custom thresholds (80/20, 70/30, 60/40), how to choose based on regime
- Pair-specific considerations (major pairs vs JPY crosses vs gold-linked pairs)
- A quick settings decision tree to pick a starting configuration
-
- Overbought and oversold are conditions, not entries
- The 50 centerline cross is your momentum check
- Range shifts in trends, use 40 to 80 and 20 to 60 behavior
- RSI divergence, what it signals and what it does not
- Failure swings, a reversal signal many traders miss
- Multiple timeframe RSI alignment for higher-quality signals
-
- Strategy 1: Trend-following pullbacks using RSI and a moving average filter
- Strategy 2: Range trading with RSI plus support and resistance confirmation
- Strategy 3: Divergence strategy with a confirmation trigger (break of structure)
- Strategy 4: RSI centerline continuation entries after breakout retests
- Strategy 5: Failure-swing reversal setup for clean, rule-based entries
- Example trade plan template (entry trigger, invalidation, target logic)
-
- Price action confirmation: levels, candles, and market structure
- Trend filters: moving averages and higher-high, higher-low logic
- Volatility filters: ATR and session timing to reduce noise
- RSI plus MACD or Stochastic: when confluence helps and when it’s redundant
- Support and resistance mapping: using RSI to time entries at pre-planned zones
-
- What is the best RSI setting for Forex?
- Which RSI levels work best in trending markets?
- How do you confirm an RSI signal?
- What is RSI divergence and does it work in Forex?
- Is RSI better for scalping or swing trading?
- What is the best timeframe for RSI in Forex?
- Should you use RSI with other indicators?
- What are the most common RSI mistakes?
- How do you set stops and targets with RSI strategies?
- Does RSI work on all currency pairs?
- How do you use RSI with chart patterns?
-
-
How to Place a Forex Trade Step by Step (Your First Trade Explained)
4 months ago -
Forex Trading vs Crypto Trading: Which Market Is Better for Beginners?
4 months ago -
Forex Lot Size Calculator: How to Use It to Size Trades Correctly
5 months ago -
How to Calculate Position Size in Forex (Position Sizing Formula + Examples)
5 months ago -
Forex Leverage Explained: How It Works, Pros, Cons & Examples
5 months ago
-
Forex Trading Platforms Comparison: MetaTrader vs cTrader vs TradingView
6 months ago -
Is Forex Trading Legal in the United States? Rules, Regulators & What to Know
6 months ago -
Stop Loss vs Take Profit: Differences, Examples & Best Practices
6 months ago -
Forex Market Hours & Trading Sessions Explained (Best Times to Trade)
6 months ago -
Forex Leverage Explained: How It Works, Pros, Cons & Examples
5 months ago