What Moves EUR/USD? The Key Drivers Every Trader Should Know

EUR/USD is the most traded currency pair. It reacts fast to new information. If you trade it, you need to know what drives the euro against the US dollar.
This guide breaks the move into clear inputs you can track in real time. You will learn how Fed and ECB rate paths shift yield spreads, how key data releases reprice growth and inflation, and how risk sentiment changes dollar demand. You will also learn why capital flows, trade balances, and political shocks can override a clean data story.
Expect practical drivers, what to watch, and why it matters for your next trade. For a deeper look at inflation as a catalyst, see how CPI moves currency markets.
Key Takeaways
- In het kort: EUR/USD tracks the ECB versus Fed policy gap, then reprices fast on data that changes rate expectations.
- In het kort: Watch yield spreads first. 2-year and 10-year US versus German yields often lead the move.
- In het kort: CPI, jobs, and PMI prints matter when they shift the next rate path, not just when they beat or miss.
- In het kort: Risk sentiment can override data. Risk-off usually supports the dollar, risk-on can lift the euro.
- In het kort: Capital flows and hedging flows can push price even with a clean macro story.
- In het kort: Political shocks and fiscal headlines can reprice EUR risk fast. Treat them as volatility events.
- In het kort: Your best prep is a short watchlist. Central bank speakers, top-tier data, and bond yields.
Track three things before you trade. The expected ECB path, the expected Fed path, and the spread between them. Use market pricing, not headlines. Check OIS pricing, short-end yields, and the next major release on the calendar. If you trade around the Fed decision window, use this guide on FOMC volatility and how to prepare.
EUR/USD 101: What the pair represents and why it moves so much
Base vs quote currency, and how to read the price
EUR/USD quotes how many US dollars you pay for 1 euro.
EUR is the base currency. It comes first. It is the unit you buy or sell.
USD is the quote currency. It comes second. It is the price you pay.
If EUR/USD rises, the euro strengthens versus the dollar. One euro buys more dollars.
If EUR/USD falls, the dollar strengthens versus the euro. One euro buys fewer dollars.
- Example: 1.0800 to 1.0900 is a 100 pip rise. EUR up, USD down.
- Example: 1.0900 to 1.0750 is a 150 pip drop. EUR down, USD up.
Why EUR/USD trades more than any other FX pair
EUR/USD sits at the center of global FX flow. It reacts fast because the market around it runs deep.
- Liquidity. Banks, funds, corporates, and central banks trade it all day. Large orders clear with less slippage.
- Tight spreads. Competition between market makers keeps costs low, especially in London and New York hours.
- Deep derivatives markets. Futures, swaps, and options let traders hedge and express views. Option strikes and expiries can pin price near key levels.
- Macro benchmarking. Many USD and EUR exposures get hedged through this pair, even when the underlying risk sits elsewhere.
What “strength” means in EUR/USD
Strength is relative. You trade the gap between the Eurozone story and the US story.
- Relative growth. Faster expected growth usually supports the currency through capital inflows and higher expected returns.
- Relative inflation. Inflation shifts rate expectations. Sticky inflation can lift a currency if it forces the central bank to stay restrictive.
- Relative yields. Short-end yield spreads often lead. Watch 2-year and the front-end OIS path. When the US front-end reprices higher than the Eurozone, EUR/USD tends to drift lower.
You do not need to predict the economy. You need to track how expectations change, and which side reprices more.
Time horizons that matter, and what moves the pair in each
| Horizon | Main driver | What you should watch |
|---|---|---|
| Intraday | Data surprises and rate pricing shifts | Calendar risk, OIS changes, 2-year yields, option expiries, liquidity windows |
| Swing (days to weeks) | Rate differential trend and positioning | Central bank guidance, inflation and labor data, risk sentiment, CFTC positioning, seasonal flows |
| Macro (months) | Policy cycles and growth divergence | ECB vs Fed path, recession risk, fiscal stance, energy terms of trade, balance of payments trends |
Match your trade to the horizon. If you trade intraday, a single release can dominate the move. If you trade macro, daily noise matters less than the path of yields and policy.
For US labor shocks that regularly move EUR/USD, use this NFP trading guide.
The core engine: interest rates, yield differentials, and rate expectations
Policy rates vs market rates, why 2-year yields often matter more than the headline decision
EUR/USD trades the path of rates, not the press release.
The Fed and the ECB can deliver a hike or cut that everyone expects. The pair may barely move. Then the 2-year yield moves 10 to 20 basis points on the statement, the press conference, or the data. EUR/USD follows that move.
Watch the front end of the curve. The US 2-year and Germany 2-year (or Eurozone 2-year OIS) track expected policy over the next 6 to 8 quarters. That is the window FX cares about most.
- Day trade: focus on the change in 2-year yields from pre event to post event. That delta often explains the move better than the rate decision.
- Swing trade: focus on the trend in the 2-year spread. A steady widening in favor of the US usually supports USD. A steady narrowing often supports EUR.
- Macro position: watch the whole policy cycle. The first cut matters most when the market did not price it.
Interest rate differentials and the EUR/USD carry trade in practice
Carry is simple. You prefer the currency with the higher short dated yield, if you expect the spot rate to stay stable or move in your favor.
In EUR/USD, the key input is the short rate spread. Traders often proxy it with the 2-year US minus 2-year Germany yield, or with OIS implied rates.
- When the US short rate sits well above the Eurozone, USD carry looks attractive. That can keep dips in USD supported, especially in calm markets.
- When the spread compresses, the carry tailwind fades. EUR/USD can grind higher even without strong Eurozone growth, because the penalty for holding EUR shrinks.
- Carry works best when volatility stays low. When volatility spikes, funding and hedging costs rise, and traders cut carry exposure fast.
Practical habit. Track the spread and a volatility gauge at the same time. A wide spread with rising volatility often signals unstable carry, not a clean trend.
Forward guidance, dot plots, and ECB communication, how expectations get repriced
Central banks move FX when they change expectations. You see it in rates futures first, then in yields, then in EUR/USD.
- Fed dot plot: dots shift the market’s estimate of the terminal rate and the timing of cuts. EUR/USD reacts when dots force a repricing of the front end.
- Fed reaction function: changes in language on inflation, labor slack, and financial conditions can matter more than the hike or cut.
- ECB communication: the ECB often signals through wording on “restrictive” and through emphasis on wages and core services inflation. That shifts the expected cut path.
Your workflow. Compare what the market priced the day before, versus what the meeting implies after. Use fed funds futures, ESTR futures, and the 2-year yield move as the scorecard.
If you want a tighter playbook for Fed days, use this guide to FOMC volatility.
Real yields and inflation expectations, when nominal rates mislead
Nominal yields can rise for two reasons. Markets expect tighter policy, or markets expect higher inflation. Those two drivers do not have the same FX impact.
Real yields strip out expected inflation. When real yields rise in the US relative to the Eurozone, USD often strengthens because the return after inflation improves.
- Nominal up, inflation expectations up: USD support can be weak. The market reads it as inflation risk, not real return.
- Nominal up, real up: USD support tends to be stronger. The move usually reflects tighter expected policy or stronger real growth.
- Nominal down, real steady: EUR/USD can still fall if the Eurozone real yield drops more than the US real yield.
Practical check. Track US 10-year TIPS real yield versus a Eurozone real yield proxy. If spot moves against the nominal story, real yields often explain why.
Quantitative tightening and easing and balance-sheet policy as a hidden driver
Rate decisions set the price of money. Balance sheet policy changes the quantity of money and the liquidity backdrop.
QT can tighten financial conditions even if policy rates stay flat. QE can loosen conditions even if policy rates look high. EUR/USD reacts when these policies shift the supply and demand for duration and the availability of USD funding.
- Fed QT: faster runoff can push term premia higher and drain reserves. That can support USD through tighter conditions and higher real yields.
- ECB balance sheet moves: changes to reinvestments and the pace of runoff can shift Eurozone term premia and peripheral spreads, which feeds into EUR risk premium.
- Cross currency basis: stress in USD funding can strengthen USD even without new hikes. Funding spreads can matter more than spot data for a stretch.
What to monitor. Monthly balance sheet updates, runoff caps, and term premium sensitive moves in the 5 to 10-year sector. When spot diverges from the 2-year spread, balance sheet and term premia often sit behind the move.
Economic data that consistently moves EUR/USD (and how to read it)
Inflation releases, CPI and HICP
Inflation prints move EUR/USD when they change rate expectations. Focus on the parts that central banks can influence. Ignore one-off noise.
- US CPI vs Eurozone HICP: US CPI tends to hit the dollar fast. Eurozone HICP matters most when it shifts the ECB path.
- Core vs headline: Headline jumps on energy and food. Core drives policy. If core surprises, EUR/USD usually reacts more and holds the move longer.
- Services inflation: Sticky services often signals wage pressure. Sticky prints push “higher for longer” pricing and can lift USD or EUR depending on where the surprise lands.
- Supercore style focus: Traders watch CPI services ex shelter at times, and similar measures in Europe. These series aim to strip out the slow housing component and track underlying demand.
- Second-round effects: Energy spikes matter when they feed wages and services prices. You see it in negotiated wages, services inflation, and inflation expectations. That is when a “temporary” shock becomes a policy problem.
How to read the release. Compare the m/m core number to recent trend, then check the biggest category drivers. If the surprise comes from broad categories, markets treat it as persistent. If it comes from one line item, the reaction can fade.
For more detail on the link between prices and FX, see inflation and exchange rates.
Labor market prints, NFP, unemployment, wages, participation
Labor data moves EUR/USD because the Fed and ECB react to demand pressure. The US labor report can override everything for a day.
- US Non-Farm Payrolls: Strong payrolls usually lift US yields and USD. Weak payrolls usually do the opposite. The first move often follows rate markets within seconds.
- Unemployment rate: Watch the direction and the reason. A higher jobless rate from layoffs reads bearish for USD. A higher jobless rate from rising participation can soften the signal.
- Wages: Average hourly earnings and other wage series can matter more than payroll count when inflation sits above target. Hot wages can lift USD even if jobs growth cools.
- Participation: Rising participation increases labor supply. That can reduce wage pressure and cap USD strength even with solid headline jobs.
- Revisions: Big downward revisions can negate a strong headline. Many traders treat revisions as the real story.
How to read it. Start with the market’s policy lens. If inflation sits high, wages matter more. If growth fears rise, unemployment and revisions matter more. Then look at the bond move. EUR/USD usually follows the 2-year yield reaction.
Growth indicators, GDP, PMIs and ISM, retail sales, industrial production
Growth data moves EUR/USD when it changes relative growth and relative rates. Surveys often hit faster than hard data.
- PMIs and ISM: These drive the cycle narrative. A sharp drop below 50 can push rate cuts into the curve and weaken that currency. Watch services PMIs for demand and employment components for labor spillover.
- GDP: Markets care about the composition. Consumption and private investment matter more than inventory swings. One “beat” from inventories often fades.
- Retail sales: Strong sales support growth and rates, but check the control group and price effects. Nominal sales can rise from inflation, not volume.
- Industrial production: More important for the Eurozone cycle than for the US. Weak Eurozone IP can pressure EUR if it signals broader demand damage.
How to read it. Focus on what shifts the next central bank meeting, not what explains last quarter. If yields do not confirm the data, the FX move often fails.
Central bank reaction function mapping
EUR/USD reacts most when data changes how the Fed and ECB will behave. Map each bank to its “must watch” inputs.
- When inflation runs hot: inflation and wages dominate both banks.
- When recession risk rises: labor deterioration and PMIs can dominate, even if inflation stays above target.
- When funding stress hits: financial conditions can override data for stretches, especially for USD.
Your job is to link each release to the next expected move in rates. If the data does not change that path, the spot move often retraces.
Surprises vs levels, consensus, revisions, and what is “priced”
Markets move on surprises, not the level. You trade the gap between expectation and reality.
- Use consensus: Compare the actual print to median forecasts. A small miss can still move EUR/USD if positioning leans the wrong way.
- Check dispersion: Wide forecast ranges reduce shock value. Tight ranges increase it. Tight ranges plus a miss can produce outsized moves.
- Track revisions: Revisions change the trend. A beat with negative back revisions often trades like a miss.
- Separate one-off from broad: Broad based surprises shift policy pricing. One category surprises often fade.
- Confirm with rates: If the 2-year spread does not move with the data, EUR/USD follow-through usually fails.
Read the immediate reaction in the front end of the curve first. Then compare the move to what was already priced in for the next meeting and the next three months. That is where durable EUR/USD moves start.
Risk sentiment and global macro: when USD behaves like a safe haven
Risk-on vs risk-off regimes and the dollar’s funding and safe-haven role
EUR/USD does not trade rates in a vacuum. It trades risk regimes.
In risk-on markets, investors add leverage and buy higher beta assets. That flow often weakens USD and supports EUR/USD, even if rates do not move much.
In risk-off markets, investors cut leverage and hoard liquidity. USD tends to strengthen because the global system funds in dollars. You see this most when funding stress rises and dollar liquidity tightens.
Do not assume USD always acts as a safe haven. It acts like a safe haven when markets need dollars. That usually shows up first in short-term funding and credit stress, not in headlines.
Equities, credit spreads, and volatility indices as FX inputs
Use a small dashboard. It keeps you from trading EUR/USD on vibes.
- Equities, S&P 500 and Euro Stoxx 50. Falling equities often align with a stronger USD. Watch the first hour of the US cash session for regime confirmation.
- Credit spreads, US investment grade and high yield option-adjusted spreads. Wider spreads signal tighter financial conditions and de-risking. That often supports USD and pressures EUR/USD.
- Volatility, VIX and FX vol. A VIX spike often triggers systematic selling and margin pressure. That can create fast USD demand and abrupt EUR/USD drops.
Cross-check with rates. If equities sell off but the front end spread does not move, you may still get a USD bid from risk and funding, not from policy repricing.
Energy and commodity shocks: why they often matter more for EUR than USD
Energy shocks hit Europe’s terms of trade harder. The euro area is a larger net energy importer than the US. When energy prices jump, Europe’s import bill rises and growth expectations often fall.
That mix can hurt EUR through three channels.
- Growth, higher input costs squeeze activity and margins.
- Inflation, headline CPI rises but real income falls. That can force tough ECB trade-offs.
- External balance, the current account can deteriorate if the price shock persists.
Watch Brent crude and European natural gas, then map them to European industrials and Eurozone inflation expectations. If energy spikes while European risk assets lag US risk assets, EUR/USD often trades lower even without a big US rate move.
Geopolitical risk and flight-to-quality flows
Geopolitical shocks often trigger a fast quality bid. The first response is usually de-risking, not a careful growth forecast.
- USD benefits when investors want liquidity and collateral, especially US Treasuries.
- EUR can lag when the shock sits closer to Europe’s geography, trade routes, or energy supply.
Track the sequencing. If headlines hit and you see equities down, credit spreads wider, and volatility up, EUR/USD can drop before yields react. That is a risk premium move, not a rates move.
Recession scares and “dash for cash” dynamics
In sharp downturn scares, correlations tighten. Investors sell what they can, not what they want. That creates a dash for cash.
USD tends to rise because global funding demand spikes. This can overpower rate differentials for days.
- Signal, equities fall hard, credit spreads gap wider, VIX jumps, and USD strengthens across pairs.
- Tell, EUR/USD drops while US yields also fall. That combination points to safety and liquidity demand, not hawkish repricing.
- Confirmation, look for stress gauges such as cross-currency basis and short-term funding rates to worsen. That is when USD strength becomes sticky.
If you trade this regime, size down. Moves can be fast and mean reversion can be violent once liquidity returns.
For a parallel example of how risk regimes can dominate rates, see what moves USD/JPY.
Politics and policy shocks in the Eurozone and the United States
Eurozone fragmentation risk, peripheral spreads, fiscal rules, and political uncertainty
Europe trades like a single currency, but it funds like many countries. When markets doubt fiscal cohesion, EUR/USD reacts through credit spreads and bank funding.
- Watch Italy and the periphery. Track the BTP-Bund 10Y spread, Spain-Germany spreads, and CDS. A widening BTP-Bund spread often pressures the euro, even if ECB rates do not change.
- Know the mechanism. Wider peripheral spreads tighten financial conditions in weaker members. That drags on growth, raises redenomination risk pricing at the margin, and pulls capital toward safer assets.
- Fiscal rules matter when enforcement looks real. EU fiscal framework headlines move EUR when they change expected deficits and bond supply. Markets care more when the Commission signals action, or when a government signals it will ignore rules.
- ECB backstops change the tail risk. Fragmentation tools reduce panic, but they do not erase spread risk. If spreads widen while ECB communication turns conditional or legal constraints rise, EUR downside can extend.
- Confirmation. Look for EUR bank stress, lower bank equity, weaker peripheral auction metrics, and wider EUR cross-currency basis. That mix makes euro selling stickier.
US fiscal policy, debt-ceiling episodes, and Treasury supply effects
US fiscal shocks hit EUR/USD through real yields, USD liquidity, and risk sentiment. The key is Treasury supply and who must absorb it.
- Deficit headlines move the curve. Bigger expected deficits can lift term premium and real yields. Higher US real yields often support USD and weigh on EUR/USD.
- Coupon supply can dominate data. Heavy Treasury auction calendars, weak bid-to-cover, and rising auction tails can push yields higher without any macro surprise. That tends to favor USD.
- Debt-ceiling episodes are about liquidity. Pre-resolution, bill shortages can distort front-end rates. Post-resolution, TGA rebuilding drains liquidity as the Treasury issues bills. That can tighten financial conditions and support USD even if growth data stays steady.
- What to track. Treasury quarterly refunding announcements, auction results, TGA levels, bill yields versus OIS, and money market fund flows into bills and RRP.
Trade policy and tariffs, growth and inflation mix, and FX transmission
Tariffs change both growth and inflation. EUR/USD moves based on which side dominates and how central banks react.
- Tariffs usually lift near-term inflation. That can push yields up, but it can also hurt demand. The USD reaction depends on whether markets price tighter policy or weaker growth.
- Europe is sensitive to global trade volume. If tariffs hit global manufacturing and exports, EUR can suffer through weaker Eurozone growth expectations.
- Transmission check. Watch inflation breakevens, real yields, and relative PMIs. If US real yields rise while Eurozone PMIs fall, EUR/USD often trends lower.
- Second-order effects matter. Retaliation risk and supply-chain reshoring can shift capex and FDI. Those flows can create medium-term support for the destination currency.
Elections and referendum risk, when markets care and when they don’t
Markets care when politics changes policy paths, not when it changes personalities.
- Markets price elections when they affect fiscal math. Focus on spending promises, tax plans, pension changes, and compliance with EU fiscal rules.
- They also care when governance looks unstable. Fragile coalitions, snap elections, and referendums with unclear implementation raise risk premia. That often shows up first in peripheral spreads, then in EUR/USD.
- They care less when institutions constrain outcomes. If checks and balances limit policy shifts, implied volatility often falls quickly after the vote.
- Practical setup. Use options markets as your early warning. Watch EUR/USD risk reversals, short-dated implied vol around event dates, and Italy spread volatility. If vol rises but spreads do not move, FX may mean revert fast after the event.
Regulatory and policy surprises that change capital allocation
Some shocks move EUR/USD by changing where capital must go, not by changing growth forecasts.
- Bank regulation. Changes to capital requirements, bank resolution rules, or deposit guarantees can shift bank funding costs and cross-border lending. That can pressure EUR if it tightens credit creation in the Eurozone.
- Pension and insurance rules. Asset allocation constraints can redirect large flows between domestic bonds, US credit, and FX-hedged assets. Watch for headline risk around solvency frameworks.
- Sanctions and payment rails. Restrictions can force trade invoicing changes and reserve management shifts. Effects show up in commodity pricing, current account expectations, and USD funding demand.
- Confirmation. Track cross-border portfolio flow data, hedging costs through FX swap points, and changes in reserve manager behavior when disclosed. For the broader framework, see fundamental analysis in forex.
Trade balance, capital flows, and the balance-of-payments reality
Current account vs capital account, the long-run anchor vs short-run noise
EUR/USD clears through the balance of payments. The current account reflects trade in goods and services, plus income flows. The capital and financial accounts reflect cross-border investing and funding. In the long run, sustained current account surpluses support a currency. In the short run, capital flows can dominate and move spot fast.
Use a simple checklist. If the euro area runs a large surplus but EUR/USD still drops, you are likely watching capital leaving, hedging demand rising, or USD funding stress. If the US runs a large deficit but USD strengthens, you are likely watching strong inflows into US assets or a global risk-off bid for dollars.
- Track monthly: Euro area and US current account balance, trade balance, and primary income.
- Track weekly: US TIC data for foreign purchases, and euro area portfolio flow releases when available.
- Track daily: FX swap basis, cross-currency basis, and front-end rate differentials as flow proxies.
Foreign portfolio flows into bonds and equities, yield-chasing vs risk-hedging
Bonds move EUR/USD through yield and hedging. When US yields rise versus euro yields, global investors often add US Treasuries. That supports USD. But your key variable is the hedge. When FX hedging costs rise, foreign demand can slow even if yields look attractive.
Equity flows behave differently. In risk-on regimes, investors buy US equities and accept currency exposure. USD can weaken if investors hedge less and US investors buy foreign equities. In risk-off, investors cut equity risk and buy USD cash and Treasuries. USD often gains.
- Watch: US Treasury term premium, 2 year and 10 year spreads, and euro area core yields.
- Confirm: FX hedge-implied yield pickup, via EURUSD cross-currency basis and swap points.
- Flow signal: US TIC net purchases, and positioning data for crowded USD longs.
FDI and corporate flows, mergers, buybacks, and repatriation impacts
FDI and corporate treasury flows hit the tape as large, price-insensitive transactions. A US buyer acquiring a euro area firm can create EUR demand. A euro area buyer acquiring a US firm can create USD demand. The spot impact depends on deal size, execution window, and hedge ratio.
Buybacks and repatriation matter when policy or tax changes shift corporate cash behavior. If US multinationals bring foreign cash home and convert to USD, USD can strengthen. If euro area firms raise USD debt and swap back into EUR, you can see steady EUR demand in the swap market and in forwards.
- Track: announced M&A size and currency, expected close dates, and whether financing uses local or foreign funding.
- Confirm: dealer commentary on corporate execution, and changes in short-dated forward points.
- Calendar: earnings seasons, dividend windows, and large coupon dates for bond markets.
Energy import bills and terms-of-trade effects on the euro
The euro area remains sensitive to imported energy prices. When oil and gas prices rise, the euro area import bill increases. That can shrink the trade surplus or widen the deficit. It also shifts growth and inflation expectations, which feeds back into ECB pricing.
Your job is to separate price effects from volume effects. A spike in energy prices can hit the trade balance even if export volumes hold. A fall in energy prices can improve the trade balance and relieve inflation pressure. That can still weaken EUR if it pushes rate cuts closer.
- Watch: Brent, TTF gas, and EUR-denominated energy prices.
- Confirm: euro area trade balance ex-energy, and import price indices.
- Rate link: market-implied ECB path after energy-driven inflation surprises.
Why “twin deficits” narratives can matter for USD sentiment
Traders talk about the US current account deficit and the fiscal deficit as “twin deficits.” The story matters when investors start to doubt the US ability to fund both without higher yields or a weaker dollar. The effect rarely shows up as a clean linear model. It shows up as a change in risk premium.
When the market focuses on deficits, you often see three channels. Higher Treasury supply can push term premium up. A weaker USD can become a consensus hedge. Foreign demand can turn more price-sensitive, especially when hedging costs stay high.
- Watch: US deficit projections, Treasury auction tails, and bid-to-cover ratios.
- Confirm: term premium measures, long-end real yields, and USD performance versus other reserve currencies.
- Use your calendar: track releases and auction schedules with the forex economic calendar.
| Driver | Typical EUR/USD bias | Best confirmation |
|---|---|---|
| Euro area current account surplus widens | EUR supportive over time | Trade balance ex-energy, income balance trend |
| US yields rise and hedging costs stay low | USD supportive | TIC inflows, EURUSD basis, swap points |
| Risk-off shock, de-risking | USD supportive | Equity drawdowns, funding spreads, USD liquidity metrics |
| Energy prices spike | Often EUR negative | Import prices, trade balance deterioration, ECB repricing |
| Twin deficits narrative intensifies | Can turn USD negative if funding premium rises | Auction demand, term premium, foreign participation |
Market microstructure: positioning, liquidity, and why price can move without news
Market microstructure: positioning, liquidity, and why price can move without news
EUR/USD can move hard with no headline. Flow and liquidity can matter more than macro for hours or days. You need to track who is positioned, where liquidity sits, and which levels trigger forced trading.
CFTC positioning, dealer flow, and sentiment indicators traders actually track
CFTC data tells you how leveraged funds and asset managers sit in EUR futures. It does not time intraday moves. It helps you judge squeeze risk and asymmetry.
- CFTC net positioning (IMM EUR futures). Watch extremes versus the last 1 to 3 years. Crowded long EUR raises downside squeeze risk. Crowded short raises upside squeeze risk.
- Changes in positioning. A fast shift matters more than the level. Rapid covering can drive multi day trends even if the macro story stays flat.
- FX options risk reversals. 1 week and 1 month EUR/USD risk reversals show which side pays for protection. A sharp flip often signals stress and one way flow.
- Implied volatility. Rising vol with flat spot can mean hedging demand. Falling vol with rising spot often signals carry or grind flow.
- Dealer color and real money flow. You will not get a clean public tape in spot FX. You can still infer flow from price action around fixes, session opens, and repeated defense of levels.
- Cross checks. EUR crosses and DXY help. If EUR/USD rises but EUR/JPY and EUR/GBP do not, USD weakness drives the move. If EUR crosses rise together, EUR demand drives it.
Stop runs, option barriers, and gamma effects around big strikes
Stops and options can create forced buying or selling. That flow can move price with no news.
- Stop runs. Stops cluster above recent highs and below recent lows. When price breaks a visible level, liquidity thins and stop execution can extend the move.
- Option barriers. Large strikes near round numbers can attract price. Barrier related hedging can defend a level, then fail fast once the level breaks.
- Gamma effects. Near big strikes, dealers hedge. In high gamma, hedging can dampen moves and create mean reversion. In low gamma, hedging can amplify trends and extend breakouts.
- Expiration timing. New York cut expiries can pin price near a strike, then release it after the cut when hedges unwind.
Liquidity pockets: session overlaps, holidays, and end-of-month moves
Liquidity varies by hour and by calendar. Thin liquidity makes small orders move price more.
- London open. Fast repricing and stop runs are common. Europe sets the tone for the day.
- London and New York overlap. Peak liquidity. Breakouts that hold here carry more weight.
- New York afternoon. Liquidity fades. Late moves often reverse if they lack follow through.
- Holidays. One side closed means wider spreads and jumpy price. Avoid reading too much into clean technical breaks during thin conditions.
- End of month and quarter rebalancing. Real money hedging and benchmark flows can dominate fundamentals for a session. Watch the last two business days and the London 4pm fix window.
Algorithmic trading and headline speed: why first moves can reverse
Algorithms react to keywords and rate pricing. They move EUR/USD before humans confirm the details.
- First move risk. The first spike often reflects positioning and stop placement, not the full information set.
- Rates lead, FX follows. Watch front end rate futures and OIS pricing. If EUR/USD moves but rate pricing does not confirm, you often get a reversal.
- Calendar sensitivity. CPI, jobs, and central bank events produce the fastest microstructure moves. Use a tight plan around releases. If you need a framework, use an economic calendar workflow.
Order flow vs fundamentals: separating transient moves from regime shifts
You need a filter. Flow can push price, but fundamentals decide whether the move sticks.
| Signal | More likely transient flow | More likely regime shift |
|---|---|---|
| Rate pricing | Spot moves, OIS and front end yields barely move | Spot and OIS reprice together across several maturities |
| Follow through | Breakout fades during London NY overlap | Breakout holds during overlap, closes near extremes |
| Volatility | Vol spikes then mean reverts fast | Vol reprices higher and stays bid, skew shifts |
| Cross market confirmation | No confirmation in EUR crosses or rates | EUR crosses, bunds, treasuries, and credit confirm |
| Positioning | Move aligns with a squeeze from crowded positioning | Move persists after positioning normalizes |
Use microstructure to time entries and manage risk. Use rates, inflation, and growth to decide direction for the next week to quarter. When both align, EUR/USD trends. When they diverge, you get chop and reversals.
Correlation map: key assets and spreads to watch alongside EUR/USD
US Germany yield spread, your main rates compass
Start with the US minus Germany yield spread. It is the cleanest macro driver for EUR/USD over weeks to quarters. Track 2Y and 10Y. They tell you different things.
- 2Y spread (UST 2Y minus Schatz 2Y). This is the policy path. It reacts to CPI surprises, labor data, and central bank guidance. A widening US advantage usually leans EUR/USD lower. A narrowing spread usually leans EUR/USD higher.
- 10Y spread (UST 10Y minus Bund 10Y). This is growth, term premium, and fiscal risk. It matters more when inflation uncertainty rises or when issuance ramps. It can drive multi week trend moves even when the 2Y stalls.
- Curve mix. If the 2Y spread moves and the 10Y does not, you are in a front end story. Expect faster FX reactions and more reversal risk after key data. If both move together, trends last longer.
| What you watch | Typical EUR/USD read | What it signals |
|---|---|---|
| US-DE 2Y spread widens | EUR/USD down bias | Fed path reprices more hawkish than ECB |
| US-DE 2Y spread narrows | EUR/USD up bias | Fed cuts priced in, ECB steadier |
| US-DE 10Y spread widens with 2Y flat | Choppy, headline driven | Term premium, supply, risk swings |
| 2Y and 10Y spreads move same way | Cleaner trend | Rates and macro align |
DXY and the dollar complex, separate USD beta from EUR idiosyncratic
Keep DXY on your screen. It helps you label the move. If EUR/USD falls while DXY rises, you likely trade broad USD strength. If EUR/USD moves without DXY confirmation, the driver often sits in Europe.
- EUR/USD down, DXY up. USD bid, usually rates or risk stress. Look for confirmation in US yields and funding gauges.
- EUR/USD up, DXY down. USD offered, often easing financial conditions or softer US data.
- EUR/USD up while DXY flat or up. Euro specific support. Check Bund yields versus Treasuries, EU risk headlines, and energy.
USD funding markets and cross currency basis, the stress channel
Funding stress can move EUR/USD fast. It can also override fair value for days. Watch the price of dollars, not the narrative.
- FRA OIS and SOFR based spreads. When they widen, dollar funding gets tighter. That usually supports USD and weighs on EUR/USD.
- Cross currency basis basics. The EUR/USD basis reflects the extra cost to swap EUR into USD funding. A more negative basis usually means higher USD scarcity. That tends to coincide with USD strength and EUR/USD downside pressure.
- How to use it. If EUR/USD sells off but basis and credit stay calm, the move looks more like rates repricing. If EUR/USD sells off with basis moving more negative, treat it as stress. Cut size and respect gaps.
EUR crosses as confirmation tools, find the true driver
Use EUR/JPY and EUR/GBP to confirm whether the euro drives the move or the dollar does.
- EUR/USD up with EUR/JPY up. Euro strength and risk on often overlap. The move can extend if rates also agree.
- EUR/USD down with EUR/JPY down. Risk off plus weaker euro tends to accelerate downside.
- EUR/USD up while EUR/JPY down. USD weakness leads, not euro strength. Expect more two way price action if US data flips.
- EUR/GBP as ECB versus BoE read. If EUR/USD rises but EUR/GBP falls, the euro leg looks weak. Treat the EUR/USD rally as USD driven and more fragile.
- JPY link. When rates volatility spikes, EUR/JPY can move more than EUR/USD. Keep an eye on the same drivers that move USD/JPY. Use this as a reference point via USD/JPY drivers and rate differentials.
Stocks and rates, the risk channel that turns FX into a beta trade
Equities matter when the market trades macro as risk on or risk off. Watch S&P 500 and Euro Stoxx 50 alongside yields.
- Risk on. S&P 500 up with stable or falling US yields often weakens USD and lifts EUR/USD.
- Risk off. Equities down with falling yields can still support USD if funding tightens. Confirm with basis and credit spreads.
- Relative equity strength. Euro Stoxx 50 outperforming the S&P 500 can support EUR via flows. Underperformance can weigh even if DXY stays flat.
- Rates plus stocks alignment. If yields and equities both point to tighter conditions, EUR/USD trends lower more cleanly. If they conflict, expect chop.
Energy benchmarks, the euro terms of trade lever
Europe imports energy. Energy shocks can hit growth expectations and the trade balance. That feeds into the euro.
- TTF natural gas. It matters most for the euro zone growth impulse. Spikes in TTF often pressure EUR, especially if they lift recession risk.
- Brent crude. Brent matters through inflation and global risk. Rising Brent can support USD if it pushes US yields higher, while still hurting EUR via import costs.
- How to trade the signal. If EUR/USD drops during a TTF spike while US-DE spreads stay stable, treat it as euro specific weakness. If energy rises and US yields jump, expect a broader USD move.
Quick correlation checklist, what to compare before you size up
- Direction call for the next week to quarter: US-DE 2Y and 10Y spreads first.
- USD beta check: DXY next.
- Stress filter: FRA OIS, SOFR spreads, and EUR/USD cross currency basis.
- Euro confirmation: EUR/JPY and EUR/GBP.
- Risk overlay: S&P 500, Euro Stoxx 50, and real yields.
- Euro sensitivity: TTF and Brent, especially during supply headlines.
When does EUR/USD move the most? Volatility patterns and trading sessions
Where EUR/USD volume concentrates, London, New York, and the overlap
EUR/USD trades 24 hours, but it does not trade the same all day. Volatility tracks liquidity. Liquidity tracks London and New York.
- Asia hours, liquidity is thinner for EUR/USD. Moves can drift, then jump on headlines.
- London open, Europe cash markets come in. Banks reset books. Spreads tighten. Trend days often start here.
- New York morning, US data hits and US real money flows show up. Direction can extend or reverse.
- London-New York overlap, this is the main event. You get the most two-way flow and the cleanest execution.
- Late New York, liquidity fades. Stop runs and outsized candles happen more often on less volume.
| Window (approx, UTC) | What tends to drive EUR/USD | What you watch |
|---|---|---|
| 06:00 to 09:00 | London open repricing | Bund moves, European data, EUR rates, headlines |
| 12:30 to 16:00 | US data and New York positioning | US yields, DXY, risk assets, US data surprises |
| 13:00 to 16:00 | Overlap liquidity peak | Follow-through after data, large options, flow-driven breaks |
| 16:00 to 17:00 | Fixing and rebalancing | London 4pm fix, equity close flow, month-end effects |
Typical volatility by day of week and around major releases
EUR/USD does not distribute volatility evenly across the week. You see more movement when traders reset exposure and when the calendar forces repricing.
- Monday, slower start is common. Liquidity builds into London and New York. Breakouts often fail unless a weekend headline drives them.
- Tuesday to Thursday, most consistent range and trend days. This is where key US and Eurozone releases cluster.
- Friday, two regimes. If it is NFP week, volatility spikes in New York morning. If it is not, liquidity can fade early as desks cut risk.
Plan your risk around the release windows that repeatedly move EUR/USD.
- Eurozone CPI and flash PMIs, London morning repricing, fast initial move, then mean reversion if the rates market does not confirm.
- US CPI and PCE, New York morning impulse, then continuation if US real yields move. Whipsaws rise when positioning crowds one side.
- US payrolls, wide first minute range is common. The second move often matters more than the first spike.
If you want the inflation framework behind the moves, read how CPI moves FX.
Month-end and quarter-end, rebalancing and the London 4pm fix
Month-end and quarter-end create flow that ignores your macro view. Asset managers rebalance hedges and equity exposure. This flow often hits into the fix.
- London 4pm fix, a high-volume execution window. You can get sharp, one-way moves that fade after the fix prints.
- Equity-driven hedging, strong US equity month can create USD selling into month-end. A weak month can flip the flow.
- Quarter-end balance sheet effects, funding stress and hedging demand can distort EUR/USD, even if rates stay steady.
On these days, size down into 15:30 to 16:15 UTC. Expect noise. Use wider stops or do not trade the fix window.
Event risk windows, ECB, FOMC, NFP, and inflation weeks
Central bank days change the market microstructure. Liquidity pulls back before the decision. Volatility clusters in short bursts.
- ECB rate decision and press conference, the first move often follows the statement. The larger move often comes during Q&A when guidance shifts.
- FOMC decision and press conference, watch the dot plot when it is released. Watch the front end of the US curve. EUR/USD follows US real yields fast.
- NFP Friday, expect a spike, a reversal, then a trend. Do not assume the first candle is direction.
- Inflation weeks, US CPI plus follow-on speakers can keep EUR/USD reactive for days. Your edges shrink if you chase every headline.
On event days, you trade structure, not conviction. Define your level, define your invalidation, then execute.
Why quiet sessions still break out, thin liquidity catalysts
Low volume does not mean low risk. It means fewer orders. That makes price more sensitive to small shocks.
- Headlines, geopolitics, energy supply, and policy leaks can gap EUR/USD when Asia liquidity is thin.
- Options, large expiries and barrier defense can pin price, then release it in a sudden break once the level fails.
- Stops, thin books make stop runs easier. A small push can trigger a cascade.
- Cross-asset jolts, a sharp move in US yields or equities can spill into EUR/USD even when FX flow is quiet.
Your rule for thin sessions, trade smaller, demand stronger levels, and do not widen risk after the move starts.
A practical framework to forecast and react to EUR/USD drivers
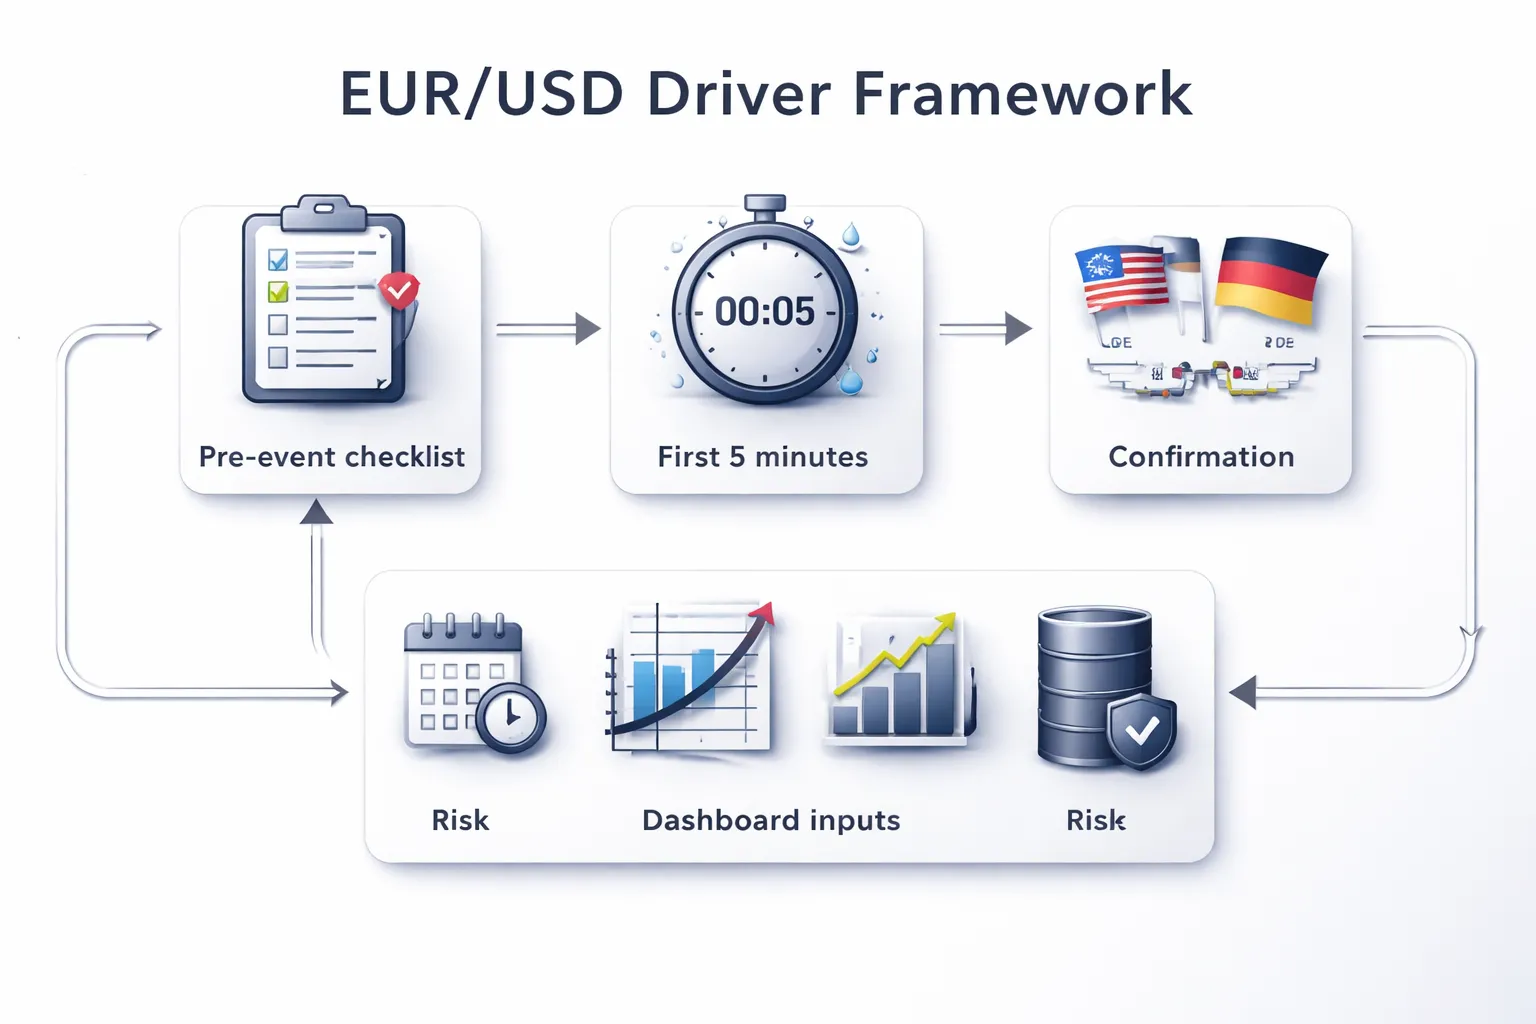
Pre-event checklist, expectations, positioning, levels, scenario planning
- Define the market expectation. Write the consensus for the release, the recent trend, and the key “whisper” risk. Track what the front end has priced, not what the headlines say.
- Map the rate-path implication. Translate the event into the next 1 to 3 policy meetings. Use OIS, Fed funds futures, and Euribor futures moves to judge if the surprise matters.
- Check positioning and skew. Look for one-sided risk. Use CFTC for medium-term crowding, and FX options risk reversals for near-term bias.
- Mark levels that matter. Note prior day high and low, weekly open, month-to-date high and low, and the nearest big figure. Add known option strikes if you have them.
- Plan three scenarios. Base case, upside surprise, downside surprise. For each, define: your trigger, your invalidation level, and your max size.
- Set rules before the number. Decide if you trade the first move, fade it, or wait. Do not decide after the spike.
Interpreting the first 5 minutes vs the next 24 hours, confirmation signals
- First 5 minutes are about surprise and stops. You often see a liquidity vacuum. Spread widens, price gaps, and stops fire. Do not treat that as trend proof.
- Confirmation comes from rates. If EUR/USD moves but US 2-year yields and EUR front-end pricing do not follow, the move often fades.
- Watch the second push. A real repricing tends to extend after the first pullback. A stop run often fails fast at a known level.
- Measure acceptance. If price holds above the pre-event level for 30 to 60 minutes and retests succeed, the market accepts the new price.
- Next 24 hours are about narrative alignment. Look for follow-through in the daily close, rate spreads, and cross-asset confirmation.
Building a driver dashboard, calendar, yields, risk, energy, spreads
Build a small dashboard you can check in under two minutes. Keep it consistent.
- Event calendar. High-impact US data, Eurozone data, ECB and Fed speakers, auctions, and key political dates. Add local holidays and thin-session warnings.
- Rates. US 2-year and 10-year yields, Germany 2-year and 10-year yields, and the US-DE 2-year spread. Front-end spreads matter most for EUR/USD direction.
- Rate expectations. Fed funds futures and Euribor futures. Track the change in implied cuts or hikes, not the level alone.
- Risk. S&P 500 futures, VIX, and credit stress proxies. EUR/USD can trade as a risk barometer when rates are stable.
- Dollar broad. DXY and a major peer like USD/JPY. If DXY and USD/JPY confirm, EUR/USD moves tend to last longer.
- Energy. Brent and European gas benchmarks. Energy shocks can change the Eurozone growth and inflation path, and hit the euro through terms of trade.
- Spreads. BTP-Bund spread and France-Germany spread as stress gauges. Widening often pressures EUR in risk-off episodes.
If you need a base process to tie drivers together, use fundamental analysis in forex as your checklist, then add the rate spread and options layer.
Common mistakes, headlines vs rate-path implications
- You trade the headline, not the rate path. A strong print that does not shift the next meetings pricing often gives a short-lived spike.
- You ignore revisions and composition. Markets price what changes policy. Core inflation, wages, and services often matter more than the top-line number.
- You miss the “already priced” problem. If positioning and options imply a big move, a small beat can still sell off.
- You anchor to one driver. On many days, EUR/USD is a spread trade. On others, it is a risk trade. Your job is to identify which regime you are in.
- You chase after liquidity returns. The cleanest entry often comes on the retest, not the first candle.
Risk management basics for EUR/USD, sizing, stops, event hedging
- Size to volatility. Use a fixed risk per trade. Reduce size on major releases and thin sessions. If your stop needs to be wider, your size must be smaller.
- Place stops where your idea breaks. Put the stop beyond a level that invalidates the scenario, not at a round number that attracts flows.
- Do not widen after entry. If you get the direction wrong on the repricing, exit. You can re-enter after confirmation.
- Separate event risk from trade risk. If you must hold through a binary event, cut size or hedge with options. Do not pretend it is a normal setup.
- Use time stops. If the post-event move does not follow through within your expected window, flatten or reduce.
| Situation | What to watch | Practical action |
|---|---|---|
| Big US data surprise | US 2-year yield move, Fed funds repricing | Wait for the first pullback, trade only if rates confirm |
| ECB speaker or meeting day | Bund front end, Euribor repricing, peripherals spread | Fade small spikes that lack spread confirmation |
| Risk-off impulse | Equity futures, VIX, credit, USD/JPY | Trade smaller, demand clean breaks of major levels |
| Energy shock | Brent, EU gas, inflation expectations | Focus on multi-day follow-through, avoid scalping noise |
Common myths about what moves EUR/USD (and what to focus on instead)
Myth: “Higher rates always strengthen a currency”
Rates matter, but the reason behind the move matters more.
- Growth expectations can flip the signal. If markets hike the ECB path because inflation looks sticky while growth looks weak, EUR can fall anyway. Traders price future growth, not just today’s yield.
- Risk sentiment can dominate. In risk-off, USD often wins even if EUR rates rise. You will see EUR/USD ignore “hawkish” headlines when equities, credit, and USD/JPY all point to stress.
- Watch relative pricing, not absolute levels. Focus on the change in the ECB path versus the Fed path. Use front-end rates and swap spreads to confirm. If EUR front-end reprices but US front-end reprices more, EUR/USD can still drop.
What to focus on instead. The rate differential change, the growth read-through, and whether risk markets confirm the move.
Myth: “News equals direction”
Headlines create movement, but direction comes from the gap between expectations and reality.
- Priced-in beats the headline. If everyone expects a hot CPI print, a “hot” number can still sell EUR if it fails to beat the whisper or if the details look softer.
- Surprise is what moves price. Track consensus, market-implied pricing, and positioning. A small data miss can move more than a big beat when the market leans the wrong way.
- Revisions matter. EUR/USD often reacts to revisions and subcomponents, not the top-line. Jobs, wages, and hours can override the headline payroll number.
What to focus on instead. The expected number, the likely “whisper” range, the distribution of outcomes, and whether rates and spreads confirm. For a clean example of surprise versus noise, use this NFP trading guide as a template for building your event plan.
Myth: “Technical analysis doesn’t matter in macro FX”
Macro explains why. Levels explain where flows hit.
- Real money and hedging flows cluster at levels. Month-end rebalancing, hedges, and option strikes tend to sit around round numbers, prior highs and lows, and major moving averages.
- Options can pin spot. Large expiries near spot can dampen moves until the cut, then release them after. You will see “good news” fail when spot sits on a heavy strike.
- Stops create acceleration. When macro aligns with a break of a major level, EUR/USD can trend fast. When macro does not align, breaks often fade.
What to focus on instead. Combine macro triggers with level confirmation. Demand that rates, spreads, or risk proxies agree before you chase a breakout.
Myth: “The ECB only reacts to Eurozone data”
The ECB sets policy in a global system. Global conditions shape the Eurozone outlook.
- US financial conditions spill over. Higher US yields can tighten global funding and risk appetite. That can hit Eurozone growth and push the ECB reaction function even if local data looks fine.
- Energy and FX feed inflation. Energy prices and EUR moves change the inflation path through import costs. The ECB watches these channels because they change forecasts.
- Peripheral spreads constrain policy. If Italian spreads widen, financial conditions tighten inside the Eurozone. That can matter as much as a single CPI print.
What to focus on instead. Track global rates, global risk, and European financial conditions. If Bund front-end pricing, peripherals, and global risk all move together, EUR/USD usually follows with cleaner follow-through.
FAQ
What is the single biggest driver of EUR/USD?
Rate differentials, especially the US and German front end. Watch 2-year yields and OIS pricing. If the market reprices the Fed faster than the ECB, EUR/USD usually moves with it.
Which data releases move EUR/USD the most?
US CPI, US jobs, and Eurozone inflation. Focus on the surprise versus consensus and the rate path it implies. Use an economic calendar to track timing and expectations.
How does risk sentiment affect EUR/USD?
EUR/USD often trades like a global risk barometer. Risk-off flows can support the dollar and pressure EUR. Track equities, credit spreads, and the VIX. If risk and US yields rise together, EUR/USD often drops harder.
Why do ECB and Fed communications move the pair?
Guidance shifts the expected policy path. Markets trade the next 6 to 8 quarters, not the current rate. Watch changes in wording on inflation, labor, and financial conditions, then check if front-end pricing confirms the message.
Do peripheral spreads matter for EUR/USD?
Yes. Wider Italian or Spanish spreads tighten Eurozone financial conditions. That can drag on growth and cap ECB flexibility. When spreads widen and Bund yields fall, EUR/USD often struggles even if Eurozone data looks fine.
What hours does EUR/USD move the most?
London and the London to New York overlap. The biggest moves often hit around key data prints, then again during US cash equity open. Liquidity drops after New York afternoon, follow-through gets weaker.
How can you separate signal from noise?
Start with three checks. US and German front-end rates. Global risk tone. Eurozone financial conditions, including peripherals. If all three point the same way, moves tend to extend. If they diverge, expect chop and mean reversion.
Does the trade balance drive EUR/USD day to day?
Rarely. Flows matter more during stress or when energy prices swing. For daily trading, rates and risk dominate. Use trade and current account data as a medium-term backdrop, not a trigger.
What is a practical pre-data checklist?
- Know consensus, range, and prior.
- Check what rates already price in.
- Define levels and invalidation before the print.
- Watch the first 5 minutes, then the 30-minute follow-through.
Conclusion
Conclusion
EUR/USD moves on two forces first, rate expectations and global risk. Your job is to track what the market prices, then trade the gap between pricing and new information.
Keep your process tight. Start with Fed and ECB pricing in OIS and futures. Map the next two to three top-tier releases that can change that pricing. Use positioning and flows as context, not as a signal.
- Before the week starts: Write your base case for Fed minus ECB, then list the data that can break it.
- Before each release: Log consensus, whisper, and prior. Mark the level where your idea fails.
- After the release: Watch the first 5 minutes for direction, then the 30-minute window for follow-through. If rates do not confirm, cut it.
- Each day: Note whether equities and credit trade risk-on or risk-off, then align your EUR/USD bias with that regime.
If you want fewer surprises, build your week from the economic calendar, then tie every trade to one driver you can measure, rates, risk, or a specific data shock.
-
How Interest Rates Affect Currency Pairs (With Real Examples)
7 months ago -
Fundamental Analysis in Forex Explained (What Actually Moves Prices)
7 months ago -
What Moves EUR/USD? The Biggest Drivers You Should Watch
7 months ago -
Inflation and Exchange Rates Explained (Why Currencies Rise or Fall)
7 months ago -
How to Trade Forex News (NFP, CPI, FOMC) Without Getting Wrecked
7 months ago
-
- Policy rates vs market rates, why 2-year yields often matter more than the headline decision
- Interest rate differentials and the EUR/USD carry trade in practice
- Forward guidance, dot plots, and ECB communication, how expectations get repriced
- Real yields and inflation expectations, when nominal rates mislead
- Quantitative tightening and easing and balance-sheet policy as a hidden driver
-
- Eurozone fragmentation risk, peripheral spreads, fiscal rules, and political uncertainty
- US fiscal policy, debt-ceiling episodes, and Treasury supply effects
- Trade policy and tariffs, growth and inflation mix, and FX transmission
- Elections and referendum risk, when markets care and when they don’t
- Regulatory and policy surprises that change capital allocation
-
- Current account vs capital account, the long-run anchor vs short-run noise
- Foreign portfolio flows into bonds and equities, yield-chasing vs risk-hedging
- FDI and corporate flows, mergers, buybacks, and repatriation impacts
- Energy import bills and terms-of-trade effects on the euro
- Why “twin deficits” narratives can matter for USD sentiment
-
- Market microstructure: positioning, liquidity, and why price can move without news
- CFTC positioning, dealer flow, and sentiment indicators traders actually track
- Stop runs, option barriers, and gamma effects around big strikes
- Liquidity pockets: session overlaps, holidays, and end-of-month moves
- Algorithmic trading and headline speed: why first moves can reverse
- Order flow vs fundamentals: separating transient moves from regime shifts
-
- US Germany yield spread, your main rates compass
- DXY and the dollar complex, separate USD beta from EUR idiosyncratic
- USD funding markets and cross currency basis, the stress channel
- EUR crosses as confirmation tools, find the true driver
- Stocks and rates, the risk channel that turns FX into a beta trade
- Energy benchmarks, the euro terms of trade lever
- Quick correlation checklist, what to compare before you size up
-
- Where EUR/USD volume concentrates, London, New York, and the overlap
- Typical volatility by day of week and around major releases
- Month-end and quarter-end, rebalancing and the London 4pm fix
- Event risk windows, ECB, FOMC, NFP, and inflation weeks
- Why quiet sessions still break out, thin liquidity catalysts
-
- Pre-event checklist, expectations, positioning, levels, scenario planning
- Interpreting the first 5 minutes vs the next 24 hours, confirmation signals
- Building a driver dashboard, calendar, yields, risk, energy, spreads
- Common mistakes, headlines vs rate-path implications
- Risk management basics for EUR/USD, sizing, stops, event hedging
-
- What is the single biggest driver of EUR/USD?
- Which data releases move EUR/USD the most?
- How does risk sentiment affect EUR/USD?
- Why do ECB and Fed communications move the pair?
- Do peripheral spreads matter for EUR/USD?
- What hours does EUR/USD move the most?
- How can you separate signal from noise?
- Does the trade balance drive EUR/USD day to day?
- What is a practical pre-data checklist?
-
- Policy rates vs market rates, why 2-year yields often matter more than the headline decision
- Interest rate differentials and the EUR/USD carry trade in practice
- Forward guidance, dot plots, and ECB communication, how expectations get repriced
- Real yields and inflation expectations, when nominal rates mislead
- Quantitative tightening and easing and balance-sheet policy as a hidden driver
-
- Eurozone fragmentation risk, peripheral spreads, fiscal rules, and political uncertainty
- US fiscal policy, debt-ceiling episodes, and Treasury supply effects
- Trade policy and tariffs, growth and inflation mix, and FX transmission
- Elections and referendum risk, when markets care and when they don’t
- Regulatory and policy surprises that change capital allocation
-
- Current account vs capital account, the long-run anchor vs short-run noise
- Foreign portfolio flows into bonds and equities, yield-chasing vs risk-hedging
- FDI and corporate flows, mergers, buybacks, and repatriation impacts
- Energy import bills and terms-of-trade effects on the euro
- Why “twin deficits” narratives can matter for USD sentiment
-
- Market microstructure: positioning, liquidity, and why price can move without news
- CFTC positioning, dealer flow, and sentiment indicators traders actually track
- Stop runs, option barriers, and gamma effects around big strikes
- Liquidity pockets: session overlaps, holidays, and end-of-month moves
- Algorithmic trading and headline speed: why first moves can reverse
- Order flow vs fundamentals: separating transient moves from regime shifts
-
- US Germany yield spread, your main rates compass
- DXY and the dollar complex, separate USD beta from EUR idiosyncratic
- USD funding markets and cross currency basis, the stress channel
- EUR crosses as confirmation tools, find the true driver
- Stocks and rates, the risk channel that turns FX into a beta trade
- Energy benchmarks, the euro terms of trade lever
- Quick correlation checklist, what to compare before you size up
-
- Where EUR/USD volume concentrates, London, New York, and the overlap
- Typical volatility by day of week and around major releases
- Month-end and quarter-end, rebalancing and the London 4pm fix
- Event risk windows, ECB, FOMC, NFP, and inflation weeks
- Why quiet sessions still break out, thin liquidity catalysts
-
- Pre-event checklist, expectations, positioning, levels, scenario planning
- Interpreting the first 5 minutes vs the next 24 hours, confirmation signals
- Building a driver dashboard, calendar, yields, risk, energy, spreads
- Common mistakes, headlines vs rate-path implications
- Risk management basics for EUR/USD, sizing, stops, event hedging
-
- What is the single biggest driver of EUR/USD?
- Which data releases move EUR/USD the most?
- How does risk sentiment affect EUR/USD?
- Why do ECB and Fed communications move the pair?
- Do peripheral spreads matter for EUR/USD?
- What hours does EUR/USD move the most?
- How can you separate signal from noise?
- Does the trade balance drive EUR/USD day to day?
- What is a practical pre-data checklist?
-
How to Place a Forex Trade Step by Step (Your First Trade Explained)
4 months ago -
Forex Trading vs Crypto Trading: Which Market Is Better for Beginners?
4 months ago -
Forex Lot Size Calculator: How to Use It to Size Trades Correctly
6 months ago -
How to Calculate Position Size in Forex (Position Sizing Formula + Examples)
6 months ago -
Forex Leverage Explained: How It Works, Pros, Cons & Examples
6 months ago
-
Forex Trading Platforms Comparison: MetaTrader vs cTrader vs TradingView
7 months ago -
Stop Loss vs Take Profit: Differences, Examples & Best Practices
7 months ago -
Is Forex Trading Legal in the United States? Rules, Regulators & What to Know
7 months ago -
Forex Market Hours & Trading Sessions Explained (Best Times to Trade)
7 months ago -
Forex Leverage Explained: How It Works, Pros, Cons & Examples
6 months ago