Forex Correlation Explained (Positive vs Negative + Why It Matters)

Forex pairs move together more often than you think. That link is correlation. It can amplify your risk, or cancel it out.
Correlation measures how two currency pairs move over a set period. A positive correlation means both pairs tend to move in the same direction. A negative correlation means they tend to move in opposite directions. The strength sits on a scale from -1.00 to +1.00.
In this guide, you will learn how to read correlation values, how they change by timeframe, and how to use them to avoid hidden overexposure. You will also see common positively and negatively correlated pairs, plus simple ways to apply correlation to position sizing and portfolio control.
Key Takeaways
- In het kort: Correlation tells you how two pairs move together. It ranges from -1.00 to +1.00.
- In het kort: Positive correlation means pairs often move in the same direction. Negative correlation means they often move in opposite directions.
- In het kort: Correlation changes by timeframe. Check it on the same timeframe you trade.
- In het kort: Two “different” trades can be the same risk. High positive correlation can double your exposure.
- In het kort: Negative correlation can reduce net exposure, but it does not cancel risk in fast moves or during news.
- In het kort: Use correlation to size positions. If two trades overlap, cut size so your total risk stays within your plan.
- In het kort: Track correlation in your watchlist. Recheck when volatility shifts or when a new macro driver takes over.
- In het kort: Treat correlation as a risk tool, not a signal. Your edge must come from your strategy, not the coefficient.
Use correlation to spot hidden overexposure before you enter. Focus on pairs with shared drivers, especially USD legs and risk-on, risk-off flows. Confirm the correlation value on your trading timeframe and over a recent lookback that matches current volatility.
Build your risk plan around total portfolio exposure, not single trades. Combine correlation checks with hard limits on open risk, daily loss, and maximum USD exposure. Apply the same discipline you use for stops and position sizing.
For a practical list of common relationships and how traders apply them, see correlated forex pairs.
What is correlation in forex (and why traders track it)
Plain-English definition
Correlation in forex measures how two instruments move together over a set period. You usually track it with a correlation coefficient from -1 to +1.
- +1.00, they move the same way almost all the time.
- 0.00, their moves have no reliable relationship.
- -1.00, they move in opposite directions most of the time.
Traders measure correlation on returns, not raw prices. Returns are the percent change per bar, like each hour or each day. This avoids false signals from different price scales.
Quick examples traders see often
EUR/USD vs GBP/USD often shows positive correlation. Both pairs share USD as the quote currency. Broad USD strength can push both down. Broad USD weakness can push both up.
EUR/USD vs USD/CHF often shows negative correlation. The USD sits on opposite sides. When USD strengthens, EUR/USD tends to fall while USD/CHF tends to rise.
These are tendencies, not rules. Correlation changes with the timeframe and the market regime.
Why traders track correlation
- Control hidden risk. Two trades can act like one bigger trade. If you go long EUR/USD and long GBP/USD, you often increase the same USD-short exposure.
- Avoid double counting your thesis. If your idea is “USD will fall,” stacking highly correlated pairs can turn one view into oversized risk.
- Choose cleaner setups. When two pairs tell the same story, you can pick the one with tighter spreads, better liquidity, or clearer structure.
- Plan hedges with realism. A hedge only helps if the relationship holds in your timeframe. A weak or unstable correlation can fail when you need it.
- Adjust position sizing. You can scale down each position when correlation is high so total portfolio risk stays inside your limits.
How correlation changes real trading decisions
- Position sizing. Treat two highly correlated positions as one combined bet. Cut size, or take only one trade.
- Hedging. If you hedge, match the hedge to the same timeframe you trade. A daily hedge can fail for an intraday strategy.
- Pair selection. If EUR/USD and GBP/USD both trigger, you can take the cleaner chart and skip the other to reduce overlap.
- Stop placement and risk limits. Correlation does not replace stops. You still need defined exits and hard risk caps, see how to place a stop loss.
Key terms you need
- Instrument. The market you trade, like EUR/USD, GBP/USD, USD/CHF.
- Return. The percent change per bar. Correlation uses returns to compare moves consistently.
- Timeframe. The bar size you measure and trade, like 15-minute, 1-hour, daily.
- Rolling window. The lookback length used to calculate correlation, like the last 20 days. A short window reacts faster but flips more. A long window smooths noise but can lag.
- Regime. The current market environment, like risk-on, risk-off, central bank driven, range bound. Regimes change correlations.
| Coefficient | What it means | What you do |
|---|---|---|
| +0.70 to +1.00 | Strong positive link | Assume overlap, reduce combined size, avoid stacking similar trades |
| +0.30 to +0.69 | Moderate positive link | Expect partial overlap, size with caution |
| -0.29 to +0.29 | Weak or no link | Treat as mostly independent, still check event risk |
| -0.30 to -0.69 | Moderate negative link | Hedge potential exists, confirm stability in your window |
| -0.70 to -1.00 | Strong negative link | Useful for hedges, but watch for breakdown during shocks |
Positive vs negative forex correlation: what each one means
How to interpret same-direction co-movement in practice
Positive correlation means two pairs tend to move in the same direction in your chosen window.
- If you buy both, you stack exposure. Your risk rises even if each position size looks small.
- If you buy one and sell the other, you create a partial hedge. It can cut net movement, but it can also add spread and swap costs.
- Strong positive readings often come from a shared base or quote currency, or from the same risk theme. Example, USD weakness can lift both EUR/USD and GBP/USD.
- Trade it like one idea. Keep total risk across both positions within your plan. Use a single max loss number across the cluster, not per trade.
How to interpret opposite-direction co-movement in practice
Negative correlation means two pairs tend to move in opposite directions in your chosen window.
- If you buy one and buy the other, you may offset part of your exposure. That can smooth equity swings.
- If you buy one and sell the other, you amplify exposure. Your P and L can swing harder during trends.
- Strong negative readings often show up when USD sits on opposite sides of both pairs. Example, EUR/USD and USD/CHF often move against each other because USD flips from quote to base.
- Hedges still fail. Correlation can weaken fast during shocks, spreads widen, and execution gets worse. Size your hedge as a risk tool, not as a profit engine.
What “near zero” correlation indicates and when it’s useful
Near zero correlation means the pairs do not show a stable link in that window. They may still move together on major news.
- Use it for diversification. It helps when you want multiple trades without piling into one macro bet.
- Near zero does not mean safe. A single event can drive both pairs if it hits USD, global risk, or rates.
- It works best when drivers differ. Example, one pair reacts to oil, another reacts to European rate expectations.
- Keep your normal limits anyway. Correlation does not replace risk management in forex.
Why correlations can flip sign during major macro shifts
Correlation is not a fixed rule. It changes when the market changes what it cares about.
- Policy shifts. Rate paths can diverge fast. A central bank pivot can turn a tight link into a loose one.
- Risk regime changes. In risk-off, flows cluster into safe havens. In risk-on, carry and growth trades return. Pair behavior can reverse.
- Shock events. War, banking stress, surprise inflation, or a liquidity squeeze can force one-way positioning. Old relationships break.
- Different horizons. A pair can show positive correlation on a 1 week lookback and negative on a 6 month lookback. Always match the window to your holding time.
- Positioning and flows. Crowded trades unwind together. That can temporarily push correlations toward +1 or -1, then fade.
| Correlation type | What it means | What it means for your trades |
|---|---|---|
| Positive | Pairs tend to move the same way | Two positions can act like one larger position |
| Negative | Pairs tend to move opposite ways | Can hedge or can amplify, depends on direction |
| Near zero | No stable link in the window | Better diversification, still watch shared news risk |
Correlation coefficient explained (from -1 to +1)
Correlation coefficient explained (from -1 to +1)
The correlation coefficient puts a number on how two instruments move together in a set time window. It ranges from -1.00 to +1.00. The sign tells you direction. The size tells you strength.
Reading the scale: strong, moderate, weak
Use the coefficient to estimate how much two positions can overlap in risk. Treat these as practical bands, not hard rules.
| Coefficient (r) | What it suggests | What to do with it |
|---|---|---|
| +0.80 to +1.00 | Strong positive link | Assume risk stacks. Size positions like one larger trade. |
| +0.40 to +0.79 | Moderate positive link | Expect partial overlap. Reduce combined exposure if both depend on the same theme. |
| -0.39 to +0.39 | Weak or unstable link | Diversification can improve, but shared news can still hit both. |
| -0.40 to -0.79 | Moderate negative link | Can hedge, but only if your directions line up. Check net USD exposure. |
| -0.80 to -1.00 | Strong negative link | One position can offset the other. Do not assume a perfect hedge, correlations shift. |
Correlation of price vs correlation of returns
Most professional stats use returns, not raw price.
- Price correlation can mislead because price levels trend over time and sit on different scales.
- Return correlation compares percentage change over each period. It matches how P&L forms.
- When you check correlation in a platform, look for options like percentage change, log returns, or change instead of “price.”
- If your goal is risk control, returns correlation fits better with position sizing and stop placement.
Pearson vs Spearman correlation
Most correlation tools use Pearson. It measures linear relationships in returns.
- Pearson works well when the link stays roughly linear and outliers do not dominate the sample.
- Spearman uses ranks. It can help when the relationship stays consistent in direction but not in size.
- Spearman can handle non linear monotonic links better. It can also reduce the impact of extreme spikes.
- If your chart shows “they usually move the same way, but sometimes one jumps harder,” Spearman can give a clearer read.
Rolling correlation and why one number misleads
Correlation changes. A single reading can hide regime shifts.
- Use rolling correlation, like 20, 60, and 120 trading days. Compare the results.
- Watch for sign flips, from positive to negative. That often breaks hedges and doubles risk.
- Do not trust high correlation during calm periods. News can reset it fast, especially around central banks and CPI.
- If rolling values spread wide, treat correlation as unstable. Rely more on direct price structure, like key highs and lows and trendlines, than on the coefficient.
How to calculate forex correlation (simple and practical)
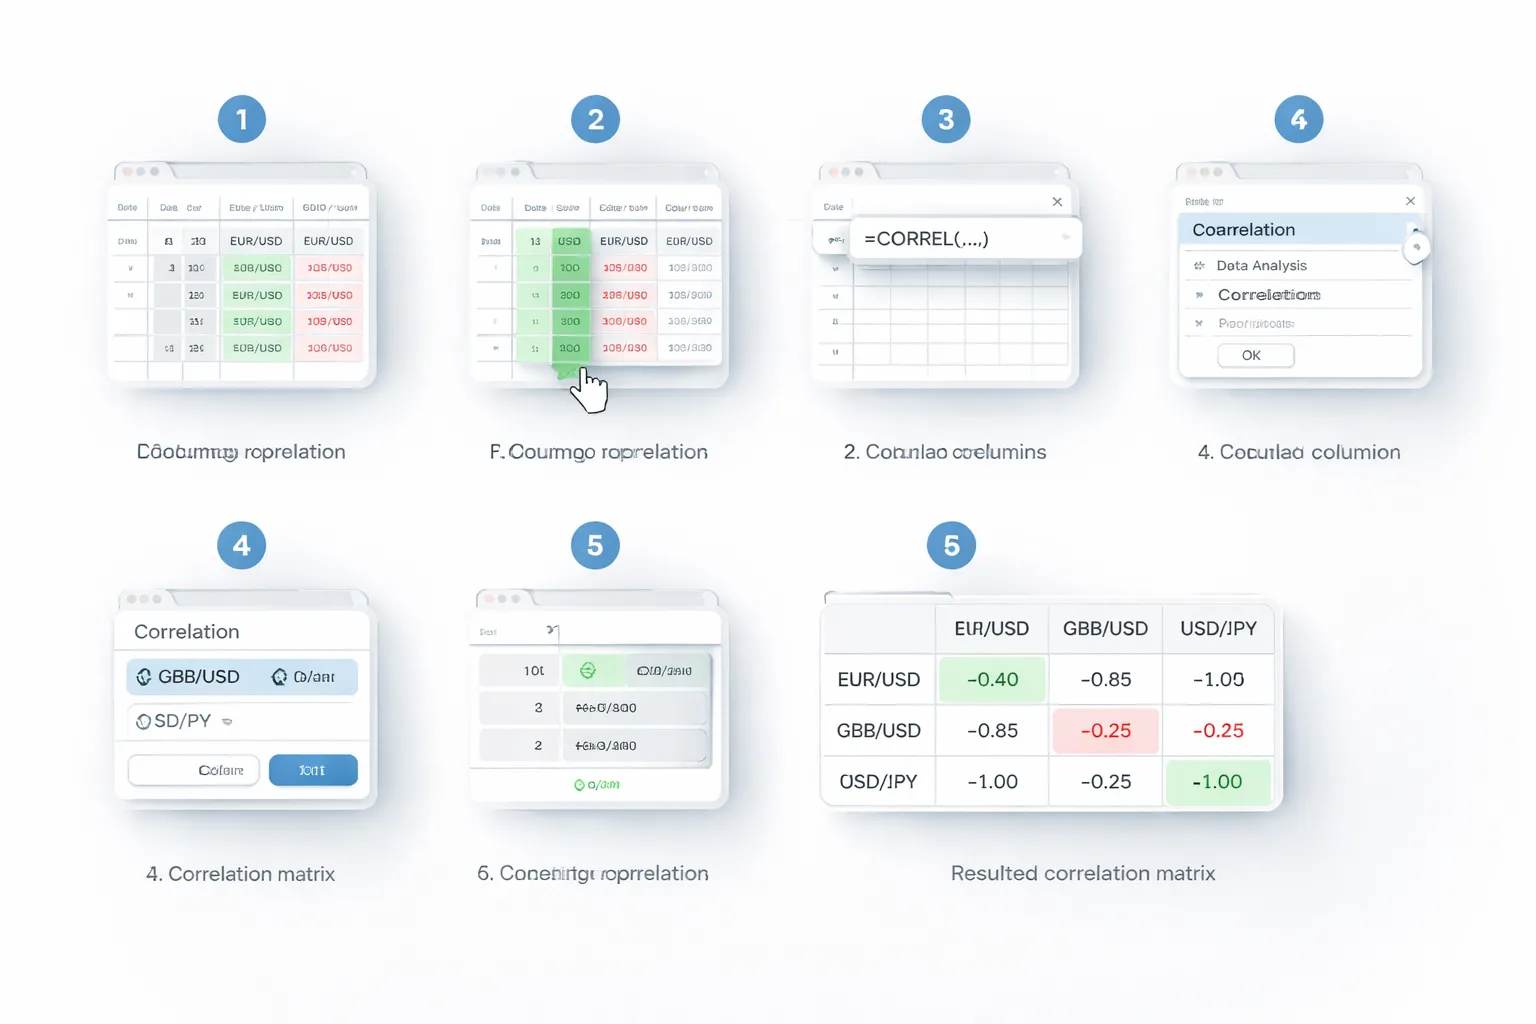
Step by step, calculate correlation with returns
Use returns, not raw prices. Prices drift. Returns compare like with like.
- 1) Pick two pairs. Example, EUR/USD and GBP/USD.
- 2) Export the same time window. Same timeframe, same start and end. Use close prices.
- 3) Convert prices to returns. In a spreadsheet, use log returns or simple returns.
- Simple return: r(t) = (Close(t) / Close(t-1)) - 1
- Log return: r(t) = LN(Close(t) / Close(t-1))
- 4) Align timestamps. Each row must represent the same candle close for both pairs.
- 5) Run correlation on the return columns. Spreadsheet formula, CORREL(rangeA, rangeB).
- 6) Use rolling correlation. Compute CORREL on a moving window, like the last 50 bars, then slide forward one bar.
Interpretation stays simple. +1 moves together. -1 moves opposite. Near 0 moves independent.
Choose lookback length and timeframe
Your lookback must match your holding time. Mismatch creates false confidence.
- Intraday trades: Use 5 minute to 1 hour candles. Start with 50 to 200 bars. Recheck around session opens and major releases.
- Swing trades: Use 4H or Daily. Start with 60 to 180 bars. This catches regime changes without reacting to every spike.
- Position trades: Use Daily or Weekly. Start with 1 to 3 years of data. Expect slower shifts, but larger breaks around policy cycles.
Short windows react fast, but flip often. Long windows look stable, but they can hide fresh divergence. Track both, one fast and one slow.
Handle data issues, gaps, outliers, and news spikes
- Session gaps and missing bars: If one series has a missing candle, drop that timestamp from both. Do not forward fill returns. It distorts correlation.
- Different broker feeds: Export both pairs from the same source when you can. Small quote differences matter on low timeframes.
- Outliers: One large candle can dominate a small sample. Use a longer window, or winsorize returns, cap extreme values at a percentile like the 1st and 99th.
- News spikes: Mark CPI, NFP, central bank decisions. Recalculate with and without those bars. If correlation collapses without them, your hedge depends on rare events.
If correlation looks good only outside news, treat it as conditional. Size positions like the relationship can break.
Read and build a correlation matrix
A matrix helps you see clusters and hidden duplicates fast.
- 1) List instruments on both axes. Same order for rows and columns.
- 2) Use the same return series settings. Same timeframe and lookback for all pairs.
- 3) Fill each cell with CORREL(returnsA, returnsB). Diagonal values equal 1.
- 4) Scan for groups. Values above +0.70 often act like the same trade. Values below -0.70 often offset.
- 5) Watch sign changes. A pair that swings from positive to negative creates unstable exposure.
| EUR/USD | GBP/USD | USD/CHF | |
|---|---|---|---|
| EUR/USD | 1.00 | 0.85 | -0.80 |
| GBP/USD | 0.85 | 1.00 | -0.75 |
| USD/CHF | -0.80 | -0.75 | 1.00 |
Use the matrix for exposure control. If you see several strong positives, you hold one bet in multiple wrappers. Keep your risk limits tight, use risk management rules, and treat correlation as a tool, not a guarantee.
Why forex correlations happen: the real drivers
Shared quote currency exposure and USD dominance
Most major pairs price against USD. That creates built-in overlap.
If USD strengthens, EUR/USD and GBP/USD often fall together. You see positive correlation because USD sits on the same side, as the quote currency.
When USD appears on opposite sides, correlation often flips. EUR/USD can rise while USD/CHF falls. That tends to produce negative correlation.
- Shared USD quote, pairs often move in the same direction.
- USD on opposite sides, pairs often move in different directions.
- USD headlines drive short-term alignment, CPI, jobs, Fed speakers, risk shocks.
Interest rate differentials and central bank policy expectations
Rates move currencies. Spreads move pairs.
When traders price a more hawkish Fed, USD demand rises. Pairs with USD as quote often drop together. When traders price a more dovish Fed, the opposite happens.
Crosses also track rate spreads. AUD/JPY often tracks the gap between Australia yields and Japan yields. A widening spread can push the pair up. A narrowing spread can push it down.
- Watch expectations, not just today’s rate. OIS pricing, futures, and guidance matter.
- Compare reaction across pairs after a central bank event. Tight clustering signals rate-driven correlation.
- Correlation can break if one central bank surprises and the other does not.
Risk-on, risk-off flows and safe-haven behavior
Sentiment creates grouping.
In risk-on periods, high-beta currencies often rise together. AUD and NZD tend to gain. JPY and CHF often lag.
In risk-off periods, funding unwinds and defensive demand picks up. JPY and CHF often strengthen. AUD/JPY and NZD/JPY can fall in tandem. That increases positive correlation between those two crosses.
- Risk gauges can help, equity index futures, VIX, credit spreads.
- Safe-haven flows can dominate fundamentals during stress.
- Session timing matters. Asia often drives JPY moves. Europe can drive CHF and EUR moves.
Trade balances and macro linkages (Europe, UK, and regional spillovers)
Economic ties create shared shocks.
Eurozone news often hits EUR pairs first, then spills into GBP through trade and growth expectations. That can tighten EUR/USD and GBP/USD correlation during Europe-driven weeks.
Commodity exporters show similar linkages. Oil can matter for CAD. Iron ore and China data can matter for AUD. When the same macro input moves both currencies, correlations rise.
- Map the driver to the currency, energy for CAD, China demand for AUD, Euro growth for EUR.
- Expect higher correlation during region-specific data clusters, PMI weeks, GDP releases, energy shocks.
- Expect lower correlation when idiosyncratic domestic politics dominate one currency.
Liquidity and positioning: how crowded trades raise co-movement
Flows can overpower logic. Especially when positioning gets crowded.
When funds hold the same USD long across multiple pairs, a stop-out can trigger broad USD selling. That makes several pairs move together, fast.
Liquidity gaps amplify this. Thin markets push correlated moves harder because orders hit multiple pairs at once.
- Crowded trades raise correlation during exits.
- Volatility spikes often increase correlation across USD pairs.
- Use a momentum check to confirm when pairs start moving as a group, a simple tool like MACD can help you spot synchronized swings.
Using correlation in trading: confirmation, diversification, and hedging
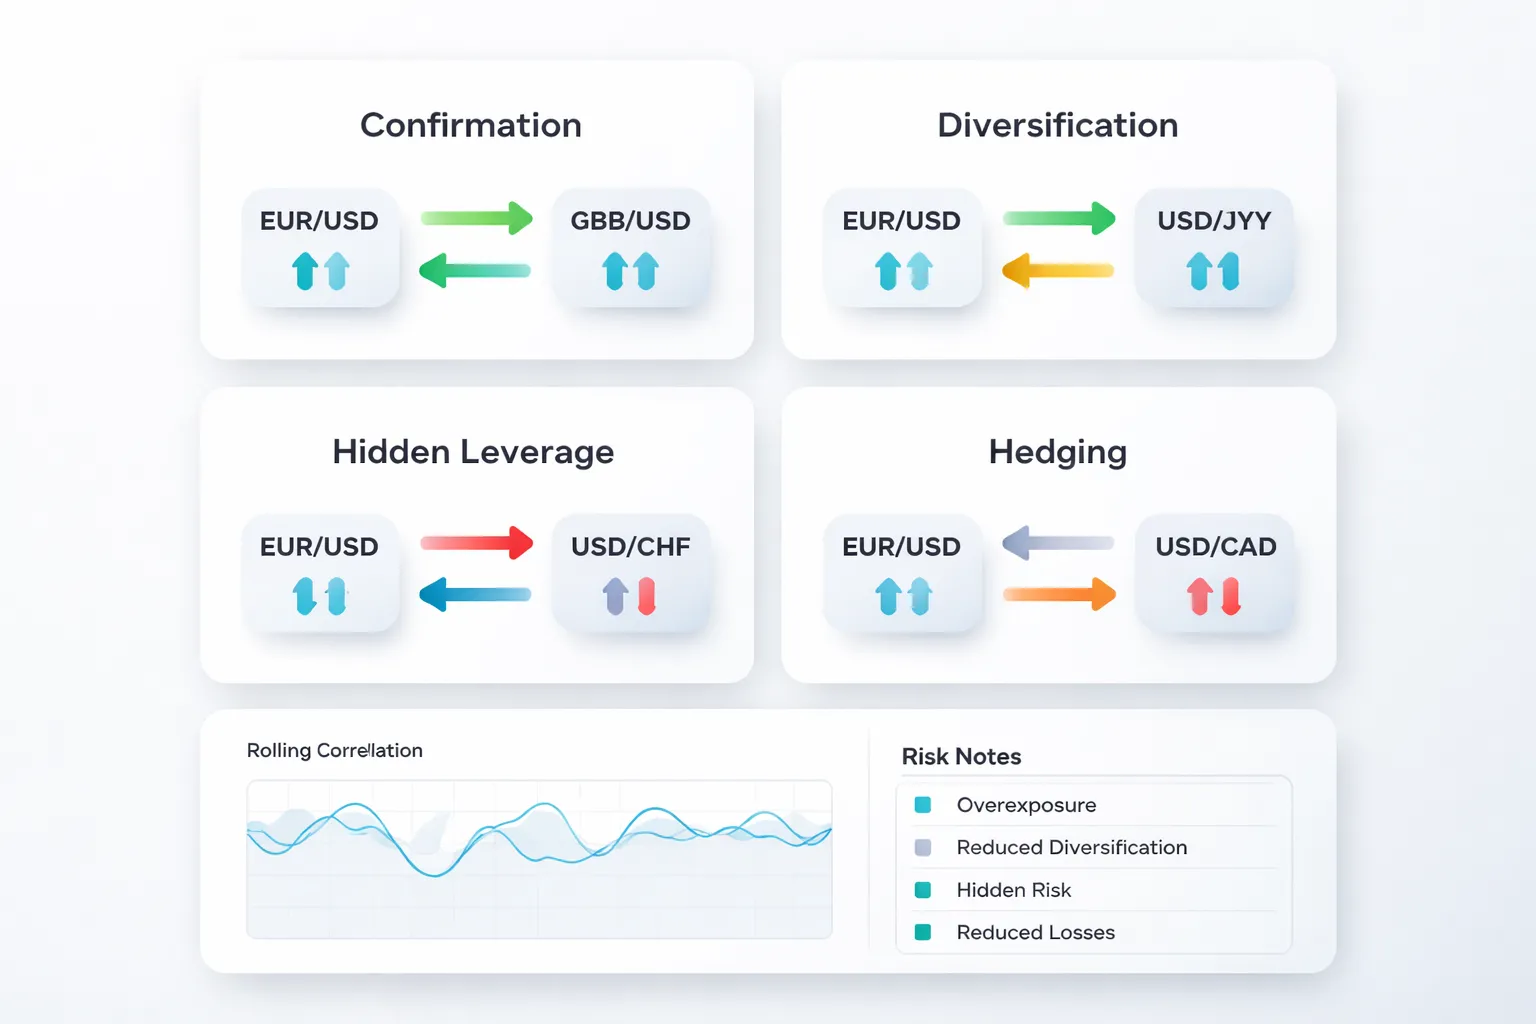
Trade confirmation without overconfidence
Correlation helps you confirm a move, but it does not validate your entry by itself. Use it as a filter, not a trigger.
Use a simple confluence framework.
- Step 1, define the driver. Identify the shared currency and the current catalyst. Example: broad USD strength after a data release.
- Step 2, check correlation on your timeframe. Use rolling correlation for the last 20 to 60 periods on the chart you trade. Do not rely on a long term number if you trade intraday.
- Step 3, demand alignment in direction. If you buy EUR/USD, you expect GBP/USD to often rise too when correlation is strongly positive. You also expect USD/CHF to often fall when correlation is strongly negative.
- Step 4, validate structure. Confirm that the second pair also breaks a key level, holds a pullback, or clears a trendline. If structure conflicts, treat the first signal as weaker. Use your own level rules, or review how to draw trendlines if you need a clean process.
- Step 5, size for failure. Correlation can flip during news, London open, and US open. Plan for decoupling.
Strong correlation plus aligned structure equals higher quality confluence. Strong correlation plus mixed structure equals noise. Weak correlation equals no confirmation.
Diversifying a portfolio of pairs
Many traders stack “different” pairs that behave like one trade. You reduce risk when you diversify by drivers, not by ticker symbols.
- Spread exposure across base currencies. Avoid loading up on EUR and GBP in the same direction at the same time.
- Mix regimes. Pair a trend trade with a range trade only if the drivers differ.
- Use correlation bands. Treat |r| above 0.70 as tightly linked, 0.40 to 0.70 as moderate, below 0.40 as weak, on your trading timeframe.
Diversification works best when your open trades do not share the same risk event. If one calendar item can hit all positions, you are not diversified.
Avoiding hidden leverage
Hidden leverage happens when multiple positions share the same currency driver. Your account sees separate trades. The market sees one bet with larger size.
Common examples.
- Long EUR/USD and long GBP/USD. You hold two USD short trades with high positive correlation in many regimes.
- Long AUD/USD and long NZD/USD. You stack similar risk on USD and risk sentiment.
- Short EUR/USD and short USD/CHF. You double down on USD strength if both legs align with USD moves.
Control it with a portfolio rule.
- Cap currency exposure. Set a max total risk per currency, like 1R to 2R across all open trades tied to USD.
- Adjust position size by correlation. If you add a second trade with |r| above 0.70 to an existing position, cut its risk, or skip it.
- Expect joint stop outs. Correlated pairs can hit stops within minutes of each other in fast markets. Place orders with intent and know how each order type behaves in volatility.
Hedging concepts, partial hedge vs over-hedge
Hedging aims to reduce your net exposure to a currency move. Correlation tells you whether the hedge will likely track the risk you want to offset.
Two practical hedge types.
- Partial hedge. You offset only part of the risk. Example: you hold long EUR/USD and you short GBP/USD with smaller size to cut some USD exposure. You keep room to profit if EUR outperforms GBP.
- Full hedge. You try to neutralize the driver almost entirely. This often turns your position into a spread trade that depends on relative strength between the two pairs.
Hedging backfires when you over-hedge.
- You pay more spread and swaps. Two positions cost more than one.
- Correlation breaks. The pairs decouple around pair specific news, central bank speakers, or different session liquidity. Your hedge stops hedging.
- You cancel your edge. You remove the directional thesis but keep execution risk. You end up with a random outcome.
Use hedges with a clear reason and a time limit. If you hedge to avoid making a decision, close or reduce the original trade instead.
| Goal | How correlation helps | What to watch |
|---|---|---|
| Confirmation | Checks if related pairs move with your thesis | Correlation changes on your timeframe, structure mismatch |
| Diversification | Shows when “different” pairs share one driver | Stacked USD risk across multiple trades |
| Risk control | Reveals hidden leverage from correlated positions | Multiple stops likely to trigger together |
| Hedging | Improves hedge selection and sizing | Decoupling, cost drag, over-hedge |
Correlation vs causation: limitations and common mistakes
Why correlation breaks during news, crises, and regime changes
Correlation describes past co-movement. It does not explain the driver. When the driver changes, the relationship can flip fast.
- Scheduled news. CPI, NFP, rate decisions. Spreads widen. Liquidity thins. The first move can be order flow, not macro. Pairs can spike together, then diverge.
- Risk shocks. Crisis days push traders into the same safe havens. Correlations compress toward 1 across many USD and JPY pairs. Your “diversified” basket turns into one trade.
- Regime shifts. A central bank changes guidance. A country exits yield control. A recession starts. Old relationships die. Your correlation table still shows the old world.
- Policy divergence. One bank turns hawkish while another pauses. Two pairs that moved together under “USD strength” start to split because rates, not USD, leads the move.
Practical rule. Recalculate correlation after major policy events. Treat the week around big releases as a separate regime for sizing.
Spurious correlation and overfitting: the lookback trap
You can always find a lookback window that “proves” your idea. That is selection bias.
- Short windows lie. A 20 day sample can show 0.90 correlation by chance. One trend phase can dominate the math.
- Long windows lag. A 2 year sample blends multiple regimes. It hides current conditions.
- Changing the window to fit the story turns correlation into a curve fitting tool. It feels precise. It fails live.
- Common mistake. You compute correlation on returns, then trade based on price levels. Levels can drift together while returns do not.
Use a fixed process. Pick two or three standard lookbacks, such as 20, 60, 120 trading days. Do not optimize them after you see the result. If the sign or strength changes across windows, assume the edge is weak.
Ignoring volatility: high correlation doesn’t mean equal risk
Correlation measures direction. It does not measure size. Two pairs can move together, but one can swing twice as far.
- Example problem. You buy two highly correlated pairs with equal lot size. The higher volatility pair drives most of your P and L. Your “two positions” become one oversized position.
- Another problem. A low volatility pair can show stable correlation. During a volatility spike it breaks first because its range expands and slippage increases.
Size with volatility, then check correlation. Use ATR for stop distance and position sizing so your risk stays comparable across pairs. See ATR-based stop loss and volatility sizing.
Assuming inverse pairs are a perfect hedge (they rarely are)
Negative correlation does not create a clean hedge. It creates a tendency, with gaps.
- Hedge ratio is not 1:1. Different volatilities mean equal lots do not offset.
- Correlations drift. EUR/USD vs USD/CHF can move from strongly negative to weakly negative, or even positive, during CHF-specific or EUR-specific events.
- Carry and funding effects. Overnight swaps differ. A “hedge” can bleed even if price stays flat.
- Execution costs. Two spreads, two sets of slippage, two chances for gaps. Costs reduce hedge quality.
Hedge with math, not hope. Estimate a hedge ratio using recent volatility, then stress test it in a news week. If your plan depends on a perfect offset, your plan breaks.
Forex correlation beyond currencies: commodities, indices, and bonds
CAD and crude oil: when the link strengthens or weakens
CAD often tracks oil because energy exports drive Canada’s trade flows and income. Watch USD/CAD against WTI crude, not Brent, since North America pricing matters more.
- Correlation tends to strengthen when oil moves on supply shocks, OPEC headlines, inventory surprises, or pipeline disruptions. These events hit Canada’s terms of trade fast.
- Correlation often weakens when USD dominates. Examples include Fed repricing, broad dollar squeezes, or risk-off moves where USD demand overpowers commodity logic.
- Correlation can flip short term when oil rises on inflation fears. Higher oil can lift inflation expectations and push yields up, which can support USD and offset CAD strength.
- Domestic rate expectations matter. If the Bank of Canada shifts guidance, USD/CAD can move with yield spreads even if oil stays trending.
Practical check. If WTI breaks out but USD/CAD does not follow, treat CAD as the lagging leg. Do not force the trade. Wait for price to confirm around key levels, then align entries with your normal support and resistance process.
AUD and commodities, including gold: what to watch in China-driven cycles
AUD reacts to global growth pricing. China demand drives key Australian exports like iron ore and coal. That link filters into AUD/USD and AUD/JPY more than into crosses driven by Europe.
- Track China impulse. Watch China credit growth signals, property headlines, and large stimulus announcements. AUD often moves when markets reprice Chinese demand, not when data prints confirm it.
- Watch iron ore and copper. These can lead AUD in early cycle turns. If metals roll over while AUD holds, you face a higher reversal risk.
- Gold is mixed for AUD. Australia produces gold, but AUD also trades like a risk proxy. In sharp risk-off, gold can rise while AUD falls. That can break the “AUD and gold” narrative.
- Rate differentials still win. If the Fed or RBA reprices hard, AUD can decouple from commodities for weeks. Yield spreads can override trade flow logic.
Practical check. Separate the story into two buckets. Growth commodities like iron ore and copper support AUD when risk appetite holds. Defensive flows can push gold up while AUD drops. Trade the bucket that matches the tape.
JPY and risk sentiment: equity indices and yield moves
JPY often strengthens when investors cut risk and unwind carry trades. This shows up most clearly in crosses like USD/JPY and AUD/JPY.
- Equity indices. When major indices sell off fast, JPY can rally as carry positions unwind. Slow equity drift matters less than sharp downside.
- US yields. USD/JPY often tracks US rate expectations. Rising US yields can lift USD/JPY even if risk mood looks shaky.
- Japan yields and policy. BoJ shifts, inflation prints, and bond market operations can move JPY without help from equities. That can break your normal risk template.
Practical check. If equities drop but USD/JPY does not, look at US yields. If yields rise, they can absorb the risk-off effect. If yields fall and JPY still fails to strengthen, the market may focus on Japan policy risk instead.
Why cross-asset correlation helps with macro context and timing
Cross-asset correlation helps you avoid trading in isolation. It gives you a fast read on what drives the move, and whether your FX signal has support.
- Confirm the driver. If CAD moves, check WTI. If AUD moves, check growth commodities and China risk cues. If JPY moves, check equities and yields.
- Spot crowded trades. When FX, equities, and yields all move together, positioning can get one-sided. Expect sharper reversals around major data and central bank events.
- Time entries better. Use cross-asset confirmation to filter breakouts. If the related asset fails to confirm, reduce size or wait for a cleaner level.
- Stress test your hedge. If your hedge relies on oil, indices, or bonds to behave, assume it will break during news weeks. Plan exits and max loss first.
Keep it simple. Use correlation as a filter, not a signal by itself. You still need price structure and levels. If you want a clean framework for that, use support and resistance to define invalidation and entries.
Tools to monitor correlation (and how to use them responsibly)
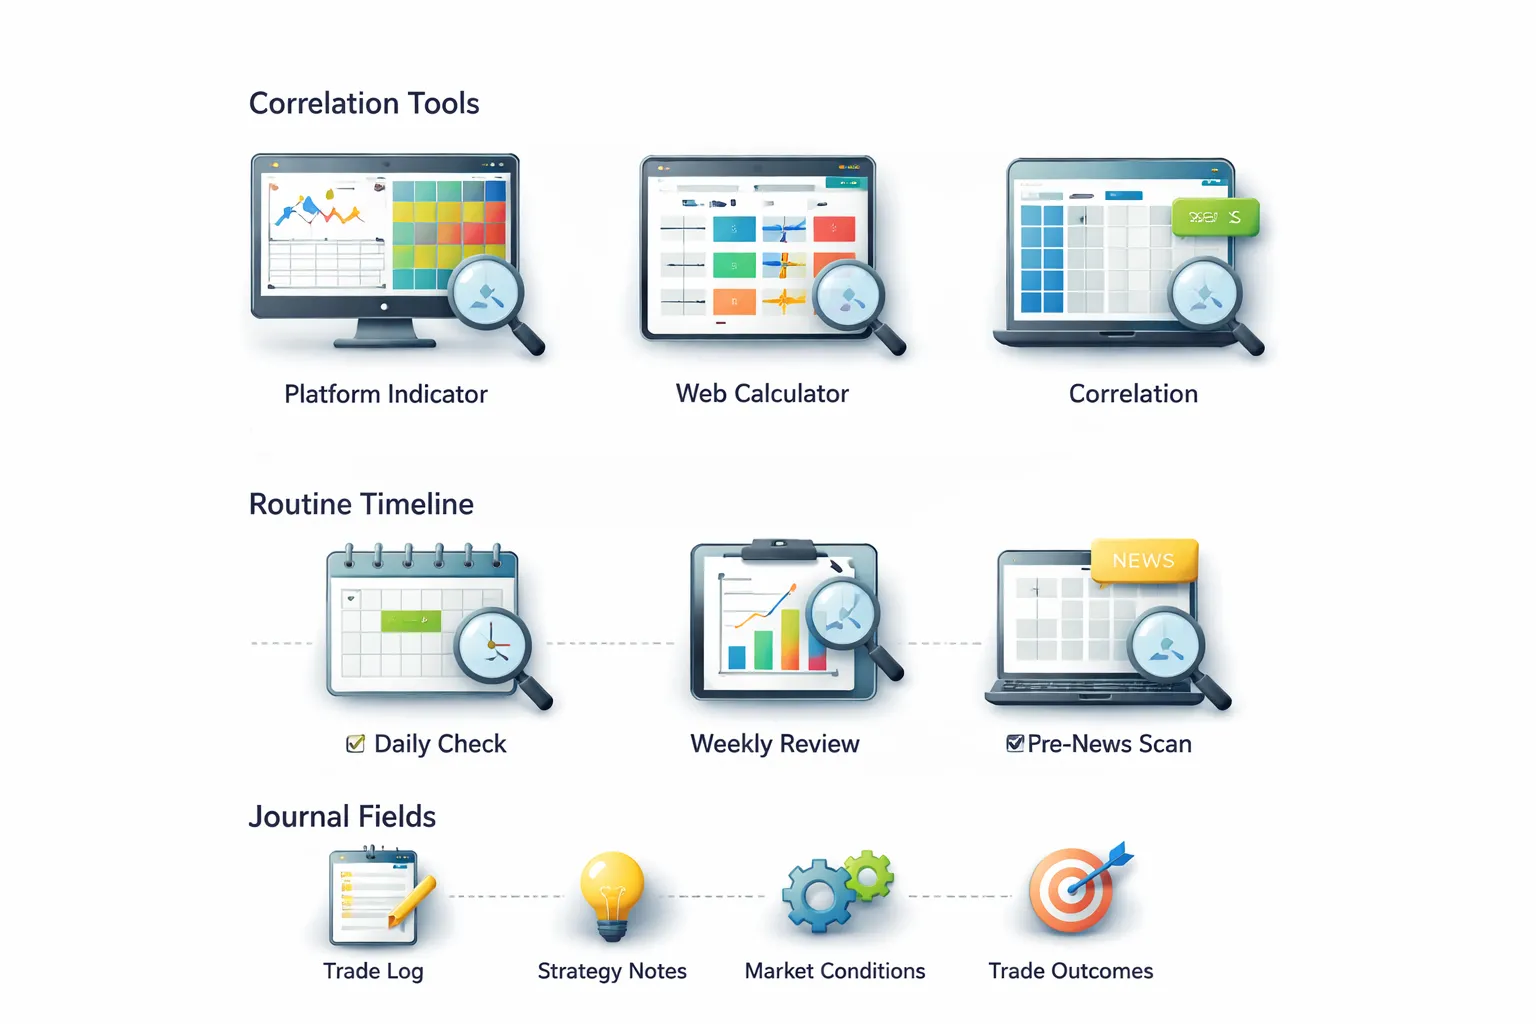
Trading platform indicators vs web calculators vs spreadsheets
You have three ways to track correlation. Each has a place. Each has traps.
- Platform indicators. Fast and chart-based. Good for a quick read before you add exposure. Weak point, many indicators hide the lookback period, time frame, and update logic. You can get a clean number that does not match your holding period.
- Web calculators. Simple and consistent. Good for screening pairs and confirming your platform read. Weak point, many tools use daily closes only. If you trade intraday, daily data can lag your risk.
- Spreadsheets. Most control. Best for serious tracking and for building rules. Weak point, easy to make errors with data alignment, missing candles, or mixing time zones.
Match the tool to your trade. If you hold for hours, use H1 or H4 data. If you hold for days, use daily data. Keep the lookback consistent, like 20, 60, and 120 periods. Do not switch settings after a loss to justify a new idea.
Setting alerts for correlation changes and correlation “breaks”
Correlation shifts. It can flip during risk events, central bank weeks, or regime changes. You need alerts for change, not for comfort.
- Define your baseline. Pick one lookback that matches your holding period, like 60 bars on H4 for swing trades.
- Set a “break” threshold. Track the rolling correlation. Flag it when it moves from strong to weak, like from above 0.70 to below 0.40, or from below minus 0.70 to above minus 0.40.
- Set a “flip” threshold. Flag it when the sign changes and stays changed for a full session or a full daily close.
- Link alerts to action. Reduce size, avoid adding the second position, or tighten your total portfolio risk. Do not auto-enter trades off correlation alone.
If you can only set price alerts, you can still monitor correlation responsibly. Build a watchlist of pairs you often combine. When one pair hits a major level or breaks structure, re-check correlation before you add exposure elsewhere.
Building a simple routine: daily check, weekly review, pre-news scan
Use a routine so you do not check correlation only when you want permission to trade.
- Daily check. Before you place trades, review your open positions. Group them by base currency and quote currency. Check correlation for any pairs that share the same drivers. If your exposure clusters, cut size or skip the extra trade.
- Weekly review. Update a small table of your most used pair combinations. Record correlation on your main time frame and on one higher time frame. You want stability across both. If they diverge, treat the hedge or “diversification” claim as weak.
- Pre-news scan. Before high impact releases and central bank events, assume correlation can break. Plan for it. Cap your total risk. Avoid stacking trades that depend on the same theme. If you use volatility tools to size stops and targets, keep them simple, like a basic Bollinger Bands approach, then re-check correlation after the event.
What to document in a trading journal to improve decision quality
Correlation helps only if you track how it behaved around your trades.
- Pairs involved. List every position that shares USD, JPY, EUR, GBP, or a risk proxy pair you watch.
- Time frame and lookback. Example, H4, 60 bars. Keep it consistent.
- Correlation at entry. Record the number and the direction, positive or negative.
- Your intent. Diversification, hedge, or separate idea. Write one sentence.
- Total exposure. Note your combined risk in R or percent, not just per trade.
- What happened. Did correlation hold, weaken, break, or flip during the trade. Tie it to the event, like CPI, FOMC, or a risk-off session.
- Decision outcome. Did correlation reduce drawdown, or did it concentrate it. Write the adjustment you will use next time, like smaller size on the second position, or no stacking during news weeks.
Over time, you will see patterns. Some pair combinations behave well in calm markets and fail in event weeks. Use that data to set rules on when you allow stacked exposure and when you ban it.
FAQ
What does forex correlation mean?
Forex correlation measures how two pairs move together. A value near +1 means they often move in the same direction. A value near -1 means they often move in opposite directions. A value near 0 means no reliable relationship.
What is a correlation coefficient?
It is a number from -1 to +1 based on past price returns. +1 equals perfect positive movement. -1 equals perfect negative movement. 0 equals no consistent link. It does not predict the future, it describes the past.
What counts as strong correlation?
Use simple thresholds. Strong positive, +0.70 to +1.00. Strong negative, -0.70 to -1.00. Moderate, 0.40 to 0.69 in either direction. Weak, below 0.40. Treat anything below 0.40 as noise.
Why does correlation matter for risk?
Correlation controls your real exposure. Two trades in highly correlated pairs can act like one larger trade. That increases drawdown and can break your risk limits. Negative correlation can reduce net exposure, but it can also fail fast in news spikes.
Can I use correlation for hedging?
Yes, but keep it strict. A hedge only works if the negative correlation holds during the move you fear. In event weeks, correlations can flip. Size the hedge smaller than the main trade. Track results, then decide if it helped.
Do correlations stay stable?
No. They change with regimes. Risk on and risk off shifts, central bank cycles, and major data weeks can break old relationships. Recheck correlation on a fixed schedule, like weekly. Keep a log of when it failed and why.
What timeframes should I use to check correlation?
Match your trade horizon. Day traders can check 20 to 60 trading days of data. Swing traders can check 90 to 180 days. Use returns, not raw price. Validate on at least two windows to avoid one off readings.
What is “stacking” correlated trades?
Stacking means opening multiple positions that share the same driver. Example, long EUR/USD and long GBP/USD. If correlation is high, you doubled your USD short exposure. If you stack, cut size on the second trade or cap total risk.
Which pairs often show strong positive or negative correlation?
Common examples. EUR/USD and GBP/USD often show positive correlation. EUR/USD and USD/CHF often show negative correlation. USD/CAD can track oil at times. Treat these as tendencies, not rules. Always check current data before acting.
How do I apply correlation in a trading plan?
Set a rule. If correlation is above +0.70, treat both trades as one risk bucket. If it is below -0.70, allow smaller hedge style sizing only. Log the correlation, your sizing decision, and the outcome. Refine rules after 30 trades.
Does correlation help with entries?
It helps with confirmation, not timing. Use it to avoid taking two similar trades at once. Use your normal entry method for timing. If you need a clean entry framework, use candlestick patterns with strict risk limits.
Conclusion
Conclusion
Correlation is a position management tool. Use it to control hidden exposure. Do not use it to force extra trades.
Track correlation the same way you track risk. Check it before you open a second trade. Treat high positive correlation as one trade. Treat strong negative correlation as a hedge, but size it small.
- Set a rule: If correlation is above +0.70, cut total risk across both positions. If it is below -0.70, allow smaller hedge sizing only.
- Standardize your check: Use the same lookback window and timeframe every time.
- Log the result: Record correlation, sizing decision, and outcome. Update rules after 30 trades.
- Keep timing separate: Use your entry method for timing. Use correlation for confirmation and exposure control.
Final tip. Build your correlation check into your pre-trade checklist, right next to your stop placement. If you need help tightening risk rules, use this guide on how to place a stop loss.
-
Stop Loss vs Take Profit: Differences, Examples & Best Practices
5 months ago -
Forex Trading Psychology Tips: How to Stay Disciplined and Consistent
5 months ago -
Forex Order Types Explained: Market vs Limit vs Stop Orders
5 months ago -
How to Set Stop Loss and Take Profit (Step-by-Step)
5 months ago -
How to Start Forex Trading Step by Step (Beginner Roadmap)
5 months ago
-
-
- What does forex correlation mean?
- What is a correlation coefficient?
- What counts as strong correlation?
- Why does correlation matter for risk?
- Can I use correlation for hedging?
- Do correlations stay stable?
- What timeframes should I use to check correlation?
- What is “stacking” correlated trades?
- Which pairs often show strong positive or negative correlation?
- How do I apply correlation in a trading plan?
- Does correlation help with entries?
-
-
- What does forex correlation mean?
- What is a correlation coefficient?
- What counts as strong correlation?
- Why does correlation matter for risk?
- Can I use correlation for hedging?
- Do correlations stay stable?
- What timeframes should I use to check correlation?
- What is “stacking” correlated trades?
- Which pairs often show strong positive or negative correlation?
- How do I apply correlation in a trading plan?
- Does correlation help with entries?
-
How to Place a Forex Trade Step by Step (Your First Trade Explained)
3 months ago -
Forex Trading vs Crypto Trading: Which Market Is Better for Beginners?
3 months ago -
Forex Lot Size Calculator: How to Use It to Size Trades Correctly
5 months ago -
How to Calculate Position Size in Forex (Position Sizing Formula + Examples)
5 months ago -
Forex Leverage Explained: How It Works, Pros, Cons & Examples
5 months ago
-
Forex Trading Platforms Comparison: MetaTrader vs cTrader vs TradingView
5 months ago -
Is Forex Trading Legal in the United States? Rules, Regulators & What to Know
5 months ago -
Stop Loss vs Take Profit: Differences, Examples & Best Practices
5 months ago -
Forex Market Hours & Trading Sessions Explained (Best Times to Trade)
5 months ago -
Forex Leverage Explained: How It Works, Pros, Cons & Examples
5 months ago