Bollinger Bands Forex Strategy (Beginner Setups That Make Sense)

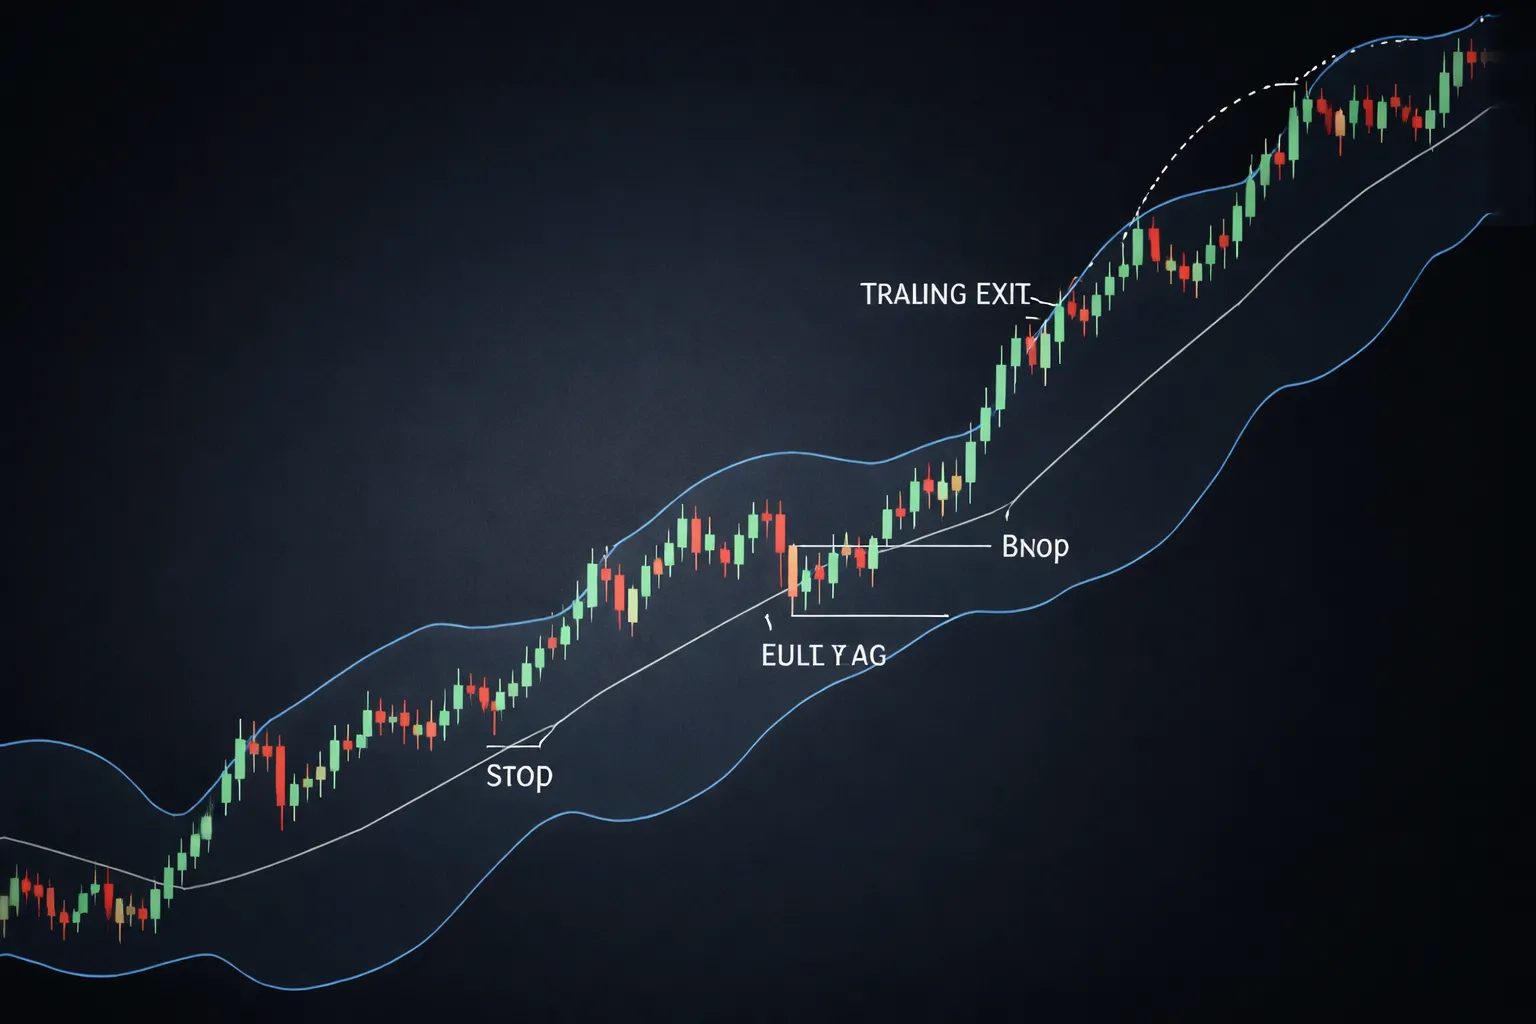
Bollinger Bands give you a simple read on price and volatility. You get three lines, a moving average in the middle, plus an upper and lower band that expand and contract with volatility.
This guide shows beginner forex setups that you can test and execute. You will learn how to trade two core situations, band walks in trends, squeezes and breakouts, plus basic mean reversion at clear support and resistance. You will also learn where Bollinger Bands fail, what filters to use, and how to set stops and targets that match current volatility.
You will avoid common traps like fading strong trends and taking too many low quality signals. If overtrading is already an issue, read how to avoid overtrading.
Key Takeaways
Key Takeaways
- In het kort: Use Bollinger Bands to measure volatility, not to predict direction.
- In het kort: Trade band walks with the trend, do not fade them.
- In het kort: Trade squeezes as breakout setups, then wait for confirmation.
- In het kort: Use mean reversion only at clear support and resistance, in a range.
- In het kort: Set stops and targets from current volatility, not fixed pips.
- In het kort: Add a filter, reduce low quality signals, and avoid overtrading.
- Bollinger Bands expand and contract with volatility. Your job is to match your trade type to the market state.
- In trends, price can hug the upper or lower band for long periods. Treat this as strength, not a reversal signal.
- In ranges, the middle band often acts like a reset point. Take reversals only when structure supports it.
- A squeeze signals low volatility. You need a clean break and follow through before you commit size.
- Use a simple filter to avoid random touches. Examples include market structure, higher time frame bias, or RSI. See RSI settings and signals.
- Place stops where your setup is invalid, then check if the distance fits your risk. Let targets reflect the same volatility regime.
- Skip trades when bands stay flat, price chops around the middle band, or spreads and news make execution unstable.
What a Bollinger Bands Forex Strategy Is (and What It Isn’t)
Why bands are a volatility tool, not a predictor
Bollinger Bands measure volatility. They do not forecast direction.
The bands widen when recent price swings grow. They contract when swings shrink. That is the core signal.
A “Bollinger Bands Forex strategy” uses this volatility context to time entries and manage risk. You use the bands to see when price moves from normal to stretched, or from quiet to active.
The bands do not tell you that price must reverse. They do not tell you that a breakout will hold. They only show how far price sits from its recent average, relative to recent volatility.
The three lines explained, middle band, upper band, lower band
- Middle band: A moving average. It acts as a baseline for “typical” price in the last N periods. Many traders treat it as a trend filter. Price holding above it often signals bullish conditions. Price holding below it often signals bearish conditions.
- Upper band: Middle band plus a volatility buffer. Price reaching it means price sits high versus its recent average. In trends, price can ride this band for long periods.
- Lower band: Middle band minus a volatility buffer. Price reaching it means price sits low versus its recent average. In downtrends, price can ride this band.
The default settings are usually a 20-period moving average with bands set at 2 standard deviations. You can change them, but do not expect a “best” setting to fix weak trade selection.
Common beginner misconception, “price touched the band so it must reverse”
A band touch is not a reversal signal. It is a location signal.
Band touches happen in two very different regimes.
- Range conditions: Touches can fade, but you still need a filter. You want clear structure, rejection, and room back toward the middle band.
- Trend conditions: Touches often mean strength, not exhaustion. Price can keep pushing in the same direction, and the bands can keep expanding.
If you short every upper band touch or buy every lower band touch, you will fight trends and get stopped in expansion phases.
Use the band touch as a trigger to check context. Then use your entry type to control slippage and invalidation. See market vs limit vs stop orders.
Bollinger Bands Settings for Forex Beginners
Default Bollinger Bands Parameters (20, 2) and When They Are Good Enough
Start with the standard settings, 20-period moving average and 2 standard deviations.
They work because they match how many traders and platforms display the indicator. That makes them a clean baseline for testing.
- Use 20, 2 when you trade liquid pairs like EURUSD, GBPUSD, USDJPY.
- Use 20, 2 when your setup depends on structure, trend, and clean swings, not on micro-precision.
- Use 20, 2 when you want consistency across pairs and timeframes.
Change settings only after you log a sample of trades. If you cannot show better results in a simple backtest, keep 20, 2.
Adjusting Settings by Timeframe (M15 vs H1 vs H4 vs Daily)
Your timeframe changes the noise level. Lower timeframes whip more. Higher timeframes smooth more.
Make one change at a time. Keep your moving average period stable first, then adjust band width.
- M15, more noise. Consider a wider band, 20, 2.2 to 20, 2.5. It reduces false touches.
- H1, balanced. 20, 2 stays a strong default. Use it unless data proves otherwise.
- H4, cleaner swings. 20, 2 works. If you trade pullbacks inside trends, test 20, 1.8 to make pulls show up earlier.
- Daily, fewer signals. Keep 20, 2 for trend context. If signals feel too rare, test 20, 1.8, but expect more touches.
Avoid extreme periods like 10 or 50 unless you have a specific rule tied to them. You will curve-fit fast.
If your goal is trend entries, keep the settings stable and focus on execution rules, such as pullback entries instead of chasing breaks. See pullback entries in trends.
Volatility Tuning With ATR (Avoid Overfitting)
Bollinger Bands already react to volatility, but pair volatility still changes your signal quality.
Use ATR as a filter, not as a reason to constantly change Bollinger settings.
- Step 1, pick a baseline. Use 20, 2 on your main timeframe.
- Step 2, add ATR(14) in pips.
- Step 3, define a “tradable volatility” range for your pair and timeframe. Example, ignore signals when ATR is below your minimum because moves lack follow-through.
- Step 4, if ATR spikes far above normal, widen bands slightly instead of changing periods. Example, move from 2.0 to 2.3 for that pair, then keep it fixed.
Use ATR to decide when to trade, not to rewrite your indicator every week.
| Problem you see | What to do | What to avoid |
|---|---|---|
| Too many band touches on M15 | Keep period at 20, increase deviation to 2.2 to 2.5 | Dropping period to 10 to force more signals |
| Too few setups on Daily | Keep 20, 2, expand watchlist, or test 1.8 with strict confirmation | Switching periods per pair until the chart “looks right” |
| Breakouts fail during low volatility | Use an ATR minimum filter, skip dull sessions | Constantly narrowing bands to “catch” moves |
| Stop-outs during volatility spikes | Use an ATR maximum filter or widen deviation slightly and reduce size | Changing both period and deviation at the same time |
How to Read Bollinger Bands in Real Market Conditions
Band width and volatility regimes (quiet vs active sessions)
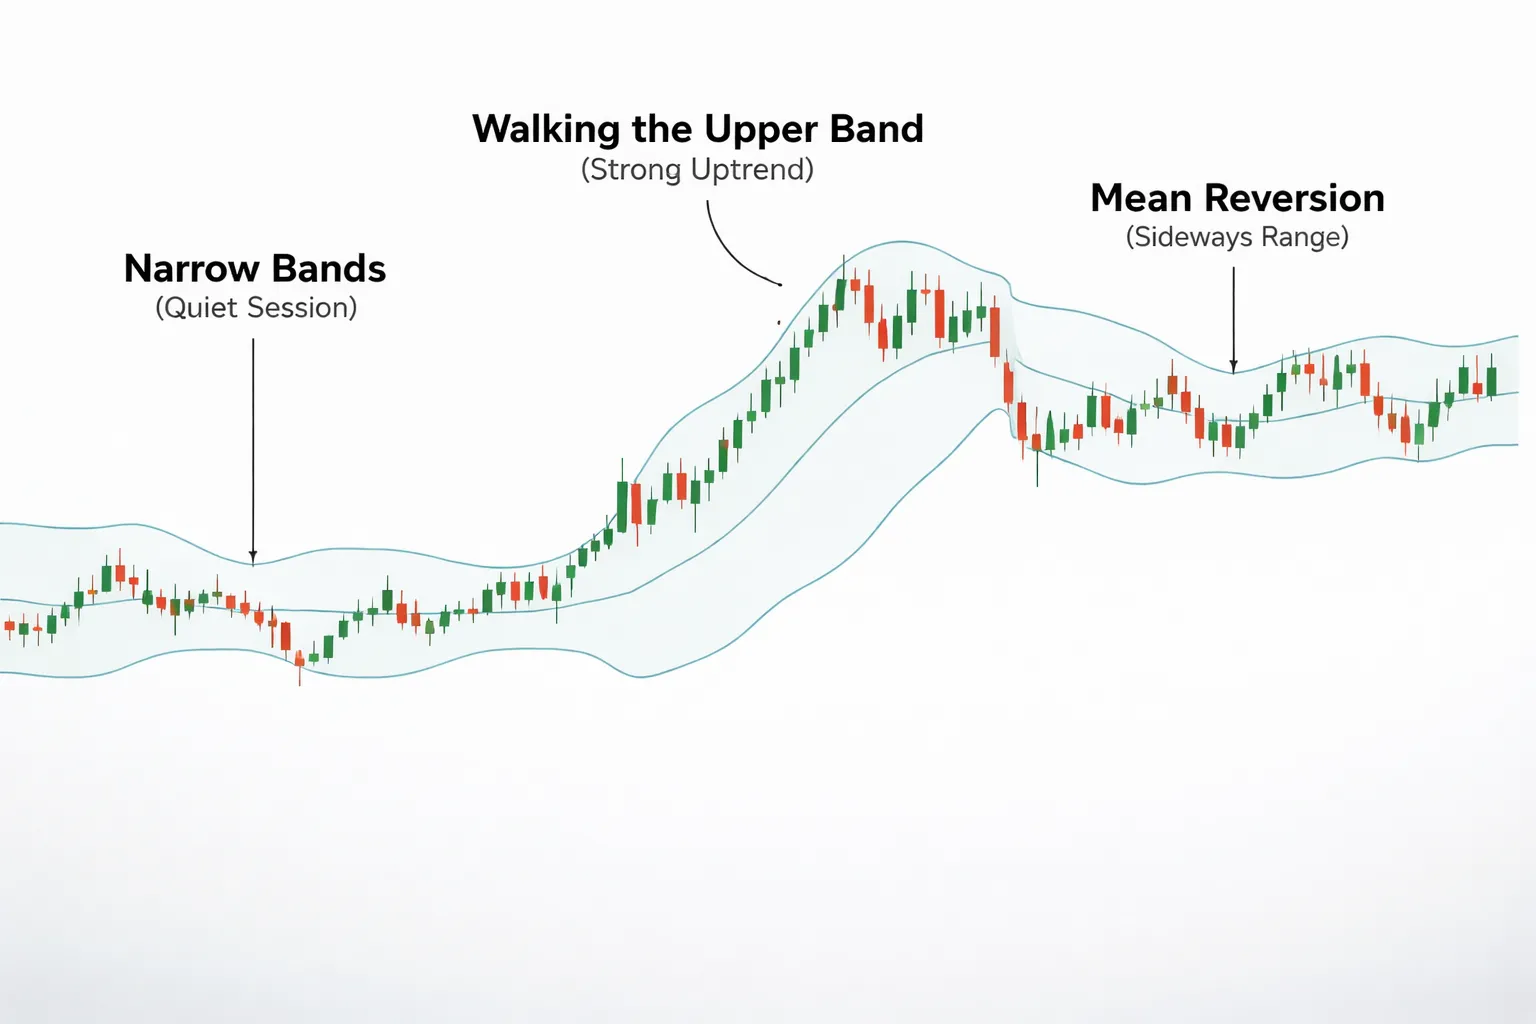
Bollinger Bands expand and contract with volatility. Your first read is simple. Wide bands mean an active market. Narrow bands mean a quiet market.
- Quiet regime: Bands stay tight, price drifts, and breakouts fail more often. You will see more small candles and more overlap around the middle band.
- Active regime: Bands open up, candles get larger, and follow-through improves. You will see cleaner pushes to an outer band and less time spent at the middle band.
Do not treat every squeeze as a trade. In real sessions, tight bands can last for hours. You need a volatility filter so you skip dead periods and avoid forcing entries.
- If your ATR is below your minimum threshold, treat band touches as noise, or do nothing.
- If your ATR spikes above your maximum threshold, reduce size, widen stops, or stand aside until price stops whipping across the middle band.
Read the bands in context of the session. London and New York overlap often brings band expansion. Late session and pre-news lulls often compress bands.
Walking the bands: what strong trends look like
In a strong trend, price can “walk” the outer band. This is not an automatic reversal signal. It is often trend confirmation.
- In an uptrend, closes cluster near the upper band. Pullbacks stall near the middle band.
- In a downtrend, closes cluster near the lower band. Pullbacks stall near the middle band.
Your key read is where price closes. A trend walk shows repeated closes in the trend direction. A weak push shows wicks through the band but closes back inside.
- Strong trend behavior: higher lows in an uptrend, lower highs in a downtrend, and shallow retracements to the middle band.
- Trend fatigue: price hits the outer band but fails to close near it, then starts closing on the other side of the middle band.
Use band walks to avoid fading strength. If you keep selling the upper band during an uptrend walk, you will take repeated small losses. Wait for a change in closing behavior first.
Mean reversion behavior in ranges: returning to the middle band
In a range, the middle band matters more than the outer bands. Price tends to swing from one side of the bands back toward the middle band, then toward the other side.
- Outer band touches act as stretch points, not trend signals.
- The middle band acts as the balance point. Price often returns there after an extension.
Read the range by how price behaves at the middle band.
- Clean range: price crosses the middle band, stalls, and rolls back. You get full swings between bands more often.
- Messy range: price chops around the middle band with many crosses. Signals degrade. Reduce trading or tighten rules.
Confirm that you are in a range before you lean on mean reversion rules. If the middle band starts to slope and price holds one side of it, the market may be transitioning into a trend. Log these regime shifts in your testing so you know what your setup does in each condition. Use a simple workflow from how to backtest a forex strategy and tag trades as trend walk, range swing, or volatility spike.
Market Type First: A Simple Filter to Avoid Bad Trades
Range checklist, trade mean reversion only when the market earns it
Bollinger Band reversals work best in ranges. Your job is to filter for a real range, not random noise.
- Flat structure. The middle band stays close to flat for most of the last 20 to 50 candles. You do not see a steady slope.
- Repeated swings. Price prints at least two clear swings at the top area and two at the bottom area. Similar levels, similar reactions.
- Mid-band acts like a magnet. After tagging an outer band, price returns to the middle band within a few candles. It does this more than once.
- Closes cross the middle band. You see frequent closes on both sides of the middle band. No side stays “in control” for long.
If you cannot point to the swing highs and lows on the chart, you do not have a range. You have chop.
Trend checklist, stop fading bands when price starts to walk them
Most bad Bollinger Band trades come from fading a trend. Use simple structure rules. They beat “feel.”
- Higher highs and higher lows. Uptrend. Or lower highs and lower lows in a downtrend. Mark the last three swings. If they step in one direction, respect it.
- Sustained closes near one band. Price closes near the upper band in an uptrend, or near the lower band in a downtrend, for several candles in a row. This is a band walk.
- Middle band holds as support or resistance. In an uptrend, pullbacks stall around the middle band and push back up. In a downtrend, bounces fail at the middle band and roll over.
In these conditions, do not use “touch the band” as a sell or buy signal. Treat it as strength. If you want a simple trend filter, pair bands with a basic moving average rule from a moving average strategy.
When to stand aside, the compression trap
Some charts offer no edge. Stand aside when you see compression with no structure.
- Bands squeeze and price sticks to the middle band. Many small candles, little follow-through, constant whipsaw around the mean.
- No clean swings. Highs and lows overlap. You cannot mark levels that price respects.
- Mixed closes. Price flips above and below the middle band every few candles, without reaching either outer band with intent.
Compression can lead to a breakout, but it can also chop you up first. If you cannot label the regime as range swing or trend walk, do nothing. Wait for structure, then apply your Bollinger rules.
Beginner Setup #1: Range Reversion (Band-to-Middle Strategy)
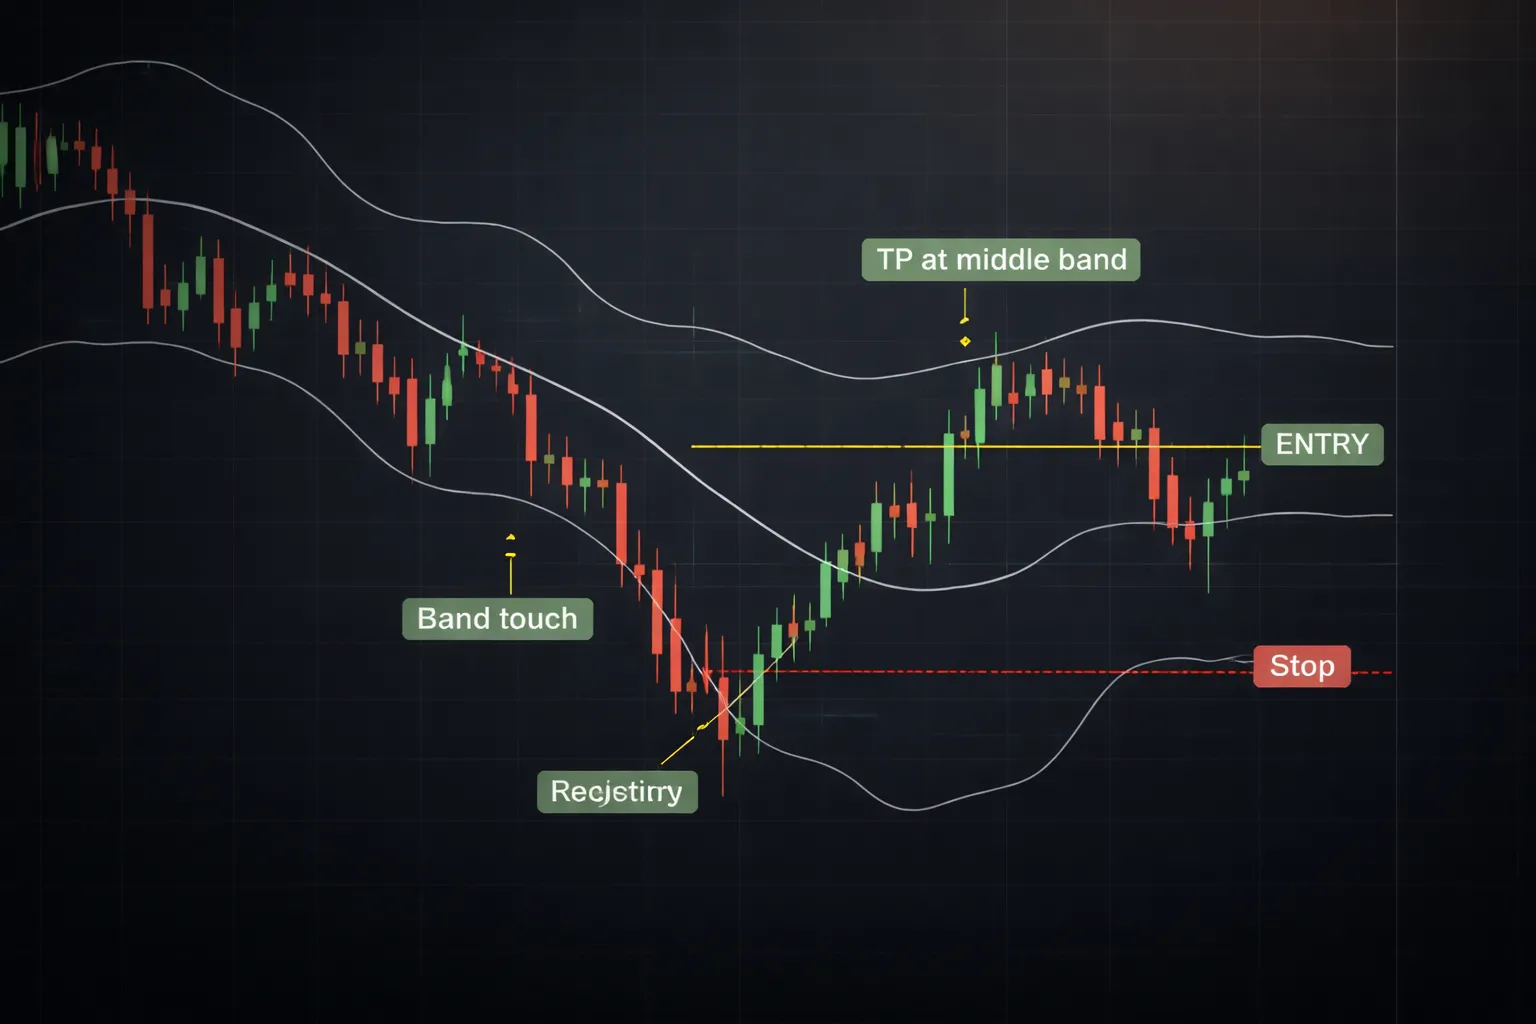
Beginner Setup #1: Range Reversion (Band-to-Middle Strategy)
You use this setup in a clear range. Price swings from one side to the other. The middle band acts like the magnet. Your base trade targets a move from an outer band back to the middle band.
Market filter: Trade it only when the bands look flat and price respects recent swing highs and swing lows. Skip it when price starts riding one band with clean momentum candles.
Entry trigger
- Conservative entry (recommended): Wait for price to touch or slightly pierce an outer band, then print a rejection candle back inside the bands. Enter on the next candle break of the rejection candle’s high for a long, or low for a short.
- Aggressive entry: Place a limit order near the outer band after the touch. You accept more stop-outs. Use it only when the range has held for many swings and spreads are tight.
- Clean touch rules: Prefer a touch after a push away from the middle band. Avoid a touch that comes after several small candles crawling along the band.
Confirmation ideas
- RSI(14) divergence: For longs, price makes a lower low into the lower band while RSI makes a higher low. For shorts, price makes a higher high into the upper band while RSI makes a lower high. Treat it as a filter, not a signal by itself.
- Swing structure: You want evidence the swing is stalling. Look for a failed break of the prior swing low for longs, or prior swing high for shorts. A simple double-tap at the range edge works.
- Session context: Range reversion works best when liquidity is steady and price oscillates. Be careful around major news and the first minutes of a new session open, when ranges can break.
Stop-loss placement
- Put your stop beyond the swing that formed at the band. For a long, below the rejection low. For a short, above the rejection high.
- Add a buffer to account for spread and noise. A simple rule is 1 to 2 spreads beyond the swing, or a small fraction of recent candle range.
- If your stop must sit far outside the band to avoid the swing, skip the trade. The range is not clean.
Take-profit options
- Primary target: The middle band. This is the core of the setup. It gives you fast, repeatable exits.
- Extended target: The opposite outer band, but only if price reaches the middle band with strength and does not stall.
- Scale out: Take partial profit at the middle band, then trail the rest toward the opposite band using recent swing points or a tighter stop above or below the middle band after a close through it.
Invalidation signals
- Strong close outside the band: A wide candle closes outside the outer band and the next candle follows through in the same direction. Treat the range as broken.
- Band walk begins: Price keeps closing near one outer band for multiple candles. The middle band stops pulling price back.
- Middle band fails: After entry, price cannot reclaim the middle band area and keeps printing lower highs on a long, or higher lows on a short.
Practice this setup in a controlled way before risking size. Use replays and a routine so you collect samples in the same conditions, see what fails, and tighten your rules. Read how to practice forex trading effectively.
Beginner Setup #2: The Bollinger Squeeze Breakout (Volatility Expansion)
Beginner Setup #2: The Bollinger Squeeze Breakout (Volatility Expansion)
The squeeze setup trades expansion after a low-volatility phase. Your edge comes from being selective. Most “breakouts” fail when volatility never contracted first.
How to identify a squeeze objectively (band width compression + ATR contraction)
You need two conditions. Band width tightens. ATR falls. If you skip the ATR check, you will chase normal range noise.
- Bollinger Band width compression: Track band width as (Upper Band minus Lower Band). Mark a squeeze when width drops below its recent baseline, like the lowest 20-bar width.
- ATR contraction: Use ATR(14). Mark contraction when ATR is below its 20-bar average, or when ATR prints a 20-bar low.
- Structure context: Prefer a squeeze that forms under a clear resistance level or above a clear support level. You want a defined range to break.
| Filter | Objective rule (example) | What it prevents |
|---|---|---|
| Band width | Width is the lowest of last 20 bars | Trading “breakouts” in normal volatility |
| ATR | ATR(14) below its 20-bar average | Entering when range is already expanding |
| Range clarity | At least 2 touches on both sides of the squeeze range | Random chop with no clean invalidation |
Breakout confirmation: close outside the band + retest + structure break
Trade confirmation, not the first spike. Use a three-step trigger so you stop buying wicks.
- Step 1, close outside the band: Wait for a full candle close above the upper band for longs, or below the lower band for shorts.
- Step 2, retest: Price returns to the breakout area. You want it to hold. Your simple rule, no close back inside the squeeze range.
- Step 3, structure break: Enter on a break of the retest candle high for longs, or the retest candle low for shorts. This confirms follow-through.
Execution tip. Use stop orders for the structure break entry so you do not chase mid-candle. If you need a refresher, read forex order types.
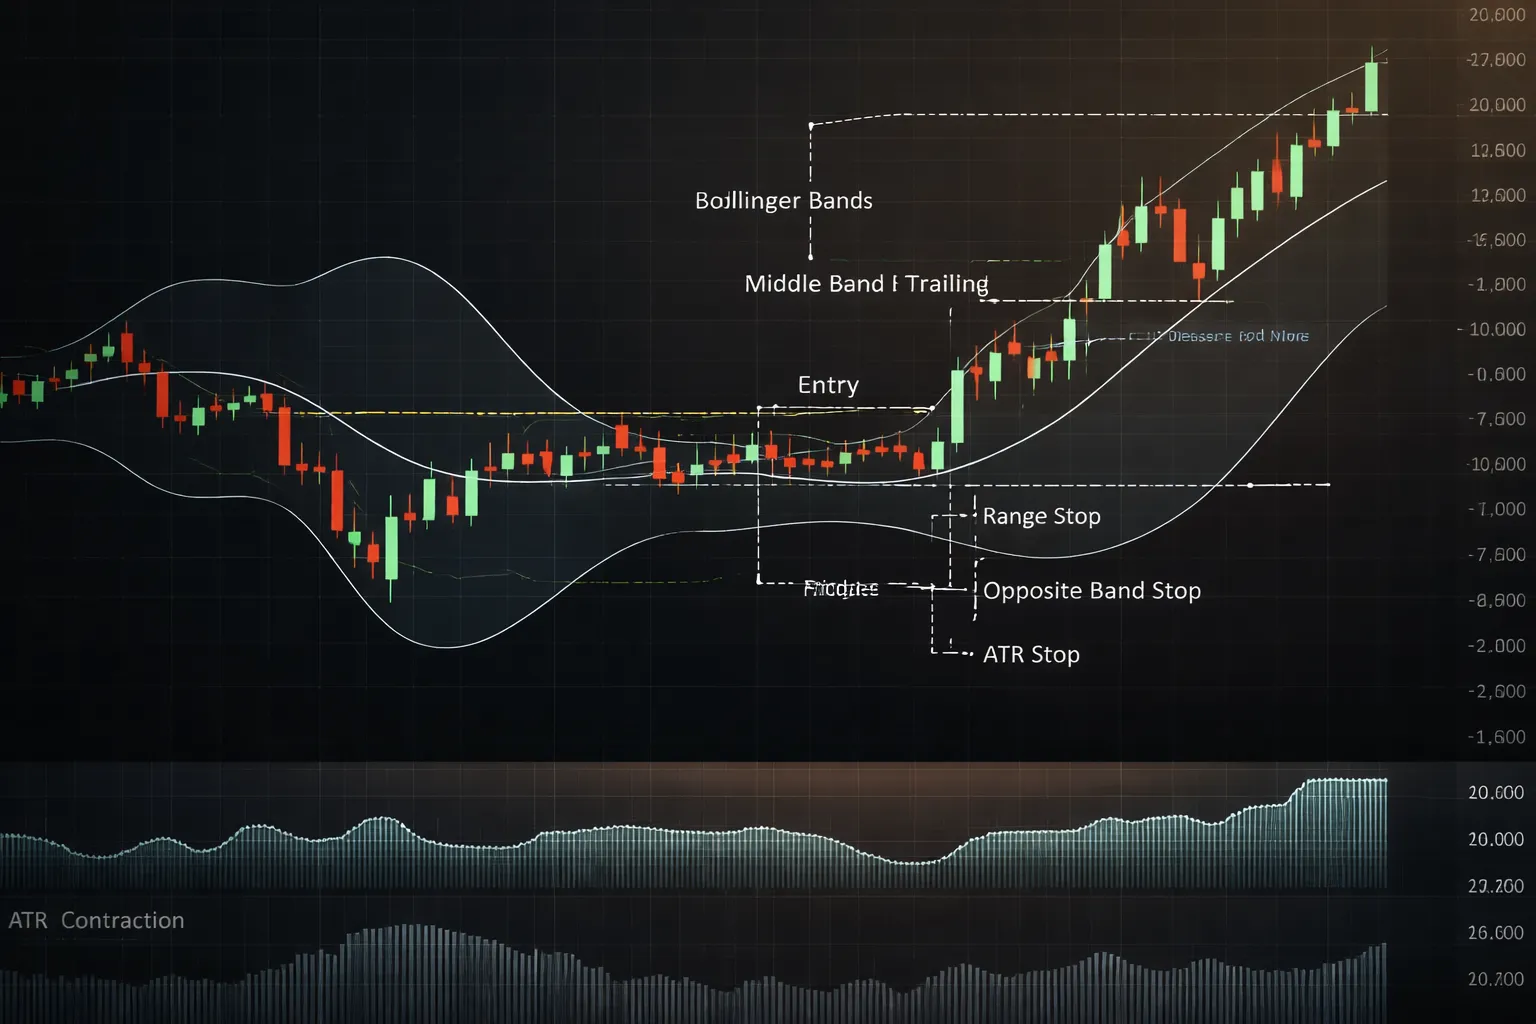
Stop placement choices: squeeze range, opposite band, or ATR-based
Your stop must sit where your setup is invalid. Pick one method and test it. Do not mix rules trade to trade.
- Squeeze range stop: Place the stop beyond the opposite side of the squeeze range plus a buffer. Long trade, stop below the squeeze low. Short trade, stop above the squeeze high. This fits the idea that the range should not re-capture price.
- Opposite band stop: Place the stop beyond the opposite Bollinger Band. This usually gives a wider stop. It can reduce stop-outs, but it lowers position size.
- ATR stop: Place the stop at Entry minus 1.5x ATR(14) for longs, or Entry plus 1.5x ATR(14) for shorts. This adapts to the pair’s current movement.
Define your buffer. Example, 0.1x ATR beyond the level. Keep it consistent so your backtest means something.
Profit management: measured move, trailing stop using the middle band, partials
You need a plan for expansion days and for fake expansion days. Use simple, mechanical exits.
- Measured move target: Measure the squeeze range height. Project that distance from the breakout point. Take full profit there, or take partials.
- Middle band trail: After price moves in your favor, trail your stop on a close basis using the middle band. Long trade, exit if price closes below the middle band. Short trade, exit if price closes above it.
- Partial exits: Take 50 percent at 1R. Move stop to breakeven only after the market proves itself, like a higher low for longs, lower high for shorts.
Keep your risk rules clean. If you struggle to balance exits, read stop loss vs take profit.
False breakout defenses: time-of-day filter, news awareness, multi-timeframe bias
Squeezes attract traps. You can cut many losers before you enter.
- Time-of-day filter: Trade squeezes that break during active sessions. For most pairs, prioritize London open through early New York. Avoid late-session breakouts where liquidity thins.
- News awareness: Do not take new squeeze entries right before high-impact releases. Spreads widen. Slippage spikes. Let the event pass, then trade the post-news retest if structure still holds.
- Multi-timeframe bias: Align direction with the higher timeframe. Example, if the 4H trend is up and price sits above the 4H middle band, favor long squeezes on 15M to 1H. Skip counter-trend breaks unless you have a clear reversal structure.
One more filter that helps. If the breakout runs straight into a nearby higher timeframe level, expect a stall. Either reduce size, take quicker partials, or pass.
Beginner Setup #3: Trend Continuation Using Band Walks
Spotting continuation: the band walk
A band walk is a trend that keeps leaning on one Bollinger Band. In an uptrend, price keeps closing near the upper band. In a downtrend, it keeps closing near the lower band.
- Consecutive closes near one band. Look for 3 to 5 closes that stay in the outer third of the bands, near the same side.
- Middle band slope supports the move. The middle band should slope up for longs, down for shorts. Flat middle band means chop risk.
- Pullbacks stay shallow. Pullbacks often pause at the middle band or the 20 SMA zone, then price pushes back to the walking band.
- Band expansion helps. Bands widening while price hugs one band signals trend strength. Tight bands during a walk can still work, but expect more whipsaws.
Entry ideas: simple continuation triggers
You want entries that keep you aligned with the walk. You do not want to fade the outer band. In trends, price can ride the band longer than you expect.
- Pullback to the middle band. Wait for a pullback toward the middle band. Enter when you get a candle close back in the trend direction, with the middle band still sloping the right way.
- Bull or bear flag break. During a walk, price often forms a small flag. Mark the flag high and low. Enter on a close beyond the flag in the trend direction. Learn the clean versions in this guide on forex chart patterns.
- Candle close trigger near the walking band. If price pulls back only slightly and then prints a strong close back near the walking band, you can enter on that close. Skip weak closes that finish near the candle midpoint.
Stops and exits: mid-band trailing vs swing trailing
Keep risk tight and logic clear. Pick one trailing method and apply it the same way each trade.
- Initial stop. Put it beyond the most recent swing point that formed during the pullback. If you enter on a flag break, place the stop beyond the opposite side of the flag.
- Mid-band trailing logic. Stay in the trade while candles keep closing on your side of the middle band. Exit when you get a clean close across the middle band, then a failure to reclaim it on the next 1 to 3 candles.
- Swing-based trailing. Trail behind higher lows in an uptrend, or lower highs in a downtrend. Move the stop only after a new swing forms. This usually gives fewer exits, but larger givebacks.
- Profit taking. If price hits a nearby higher timeframe level, take partials into strength. Let the rest trail using your chosen method.
When the trend is likely ending: loss of adherence and momentum fade
Band walks end when price stops respecting the band and the structure changes.
- Loss of band adherence. Closes stop reaching the walking band. Price starts living around the middle band.
- Middle band flattens. The slope weakens, then goes flat. Continuation setups lose edge in this phase.
- More closes through the middle band. One cross can be noise. Repeated closes across the middle band signal a regime shift.
- Pushes lose range. Each impulse leg becomes smaller. You see more overlap and more wicks against the trend.
- Reversal structure appears. A lower high after an uptrend walk, or a higher low after a downtrend walk, often starts the transition.
Best Indicator Combinations (Minimalist, Not Messy)
Bollinger Bands + RSI, Separate Exhaustion From Strength
RSI helps you avoid the common mistake of selling every upper band touch, or buying every lower band touch. In trends, RSI can stay elevated or depressed for long periods. Your job is to tell trend strength from exhaustion.
- Trend strength filter: In an uptrend, treat RSI above 50 as bullish bias. In a downtrend, treat RSI below 50 as bearish bias. Use band touches in the direction of that bias.
- Exhaustion clue: Watch for a band touch plus RSI divergence. Price makes a higher high at the upper band but RSI makes a lower high. That flags weakening momentum. Do not short yet. Wait for a close back inside the band, then a failed retest.
- Range mode: When price chops around the middle band and RSI flips above and below 50, trade smaller or stand aside. Your edge drops.
If you want deeper RSI rules and common traps, read how to use RSI the right way.
Bollinger Bands + MACD, Confirm Momentum on Breakouts
MACD adds a simple check for breakout quality. You want expansion with real momentum, not a one bar poke outside the band.
- Breakout confirmation: Price closes outside the band and MACD histogram expands in the breakout direction. Avoid entries when the histogram shrinks during the break.
- Continuation entries: After a breakout, wait for a pullback toward the middle band. Enter on the first strong rejection back in the trend direction, with MACD still on the same side of its signal line.
- Failure signal: Price breaks out, then closes back inside the band while MACD flattens or crosses back. Treat that as a failed breakout. Reduce risk or exit.
For settings and signal examples, use this MACD indicator guide.
Bollinger Bands + ATR, Stops and Targets That Fit Volatility
ATR solves a basic problem. Bands change with volatility, but many traders keep fixed stops. ATR keeps your risk consistent across quiet and fast markets.
- Stop size: Place your stop at 1.0 to 1.5 ATR beyond the swing point that invalidates your setup. In a long, that is below the most recent higher low. In a short, above the most recent lower high.
- Volatility-aware targets: In trends, aim for 1.5 to 3.0 ATR from entry, or trail using the middle band. In ranges, aim smaller, often 1.0 to 1.5 ATR, since reversals happen sooner.
- Trade selection: Skip trades when ATR spikes after news. Your stop needs to widen, your size must shrink, and slippage risk rises.
Price Action Add-ons, Keep It Clean
Indicators work best when price structure supports the idea. Use two add-ons. Not five.
- Support and resistance zones: Mark the last two clear swing highs and lows. Give each level a zone, not a line. Favor band reversals that happen into a zone. Avoid taking reversals into empty space.
- Market structure: Trade with the last confirmed sequence. Higher highs and higher lows favor long band pullbacks. Lower highs and lower lows favor short band pullbacks. When structure breaks, treat band touches as lower quality until the new direction proves itself.
- Candlestick rejection: Use one clear signal, pin bar, strong engulfing, or a close back inside the band after a poke outside. Avoid mixed candles with long wicks on both sides. That often means chop.
| Combo | Use it for | Best market | Keep it simple rule |
|---|---|---|---|
| Bands + RSI | Filter trend strength vs exhaustion | Trends and ranges | Use RSI 50 as bias, fade only after close back inside band |
| Bands + MACD | Confirm breakout momentum | Breakouts and continuations | Trade breakouts only with expanding histogram |
| Bands + ATR | Set stops and targets to volatility | All regimes | Stop goes 1.0 to 1.5 ATR beyond invalidation swing |
| + Price action | Improve location and timing | All regimes | Use one zone, one structure read, one rejection candle |
Risk Management Rules That Make These Setups Work
Position sizing basics, fixed percent risk per trade
You make these setups work by controlling loss size first. Use a fixed percent risk per trade, then size your position from your stop distance.
- Pick a risk per trade. Start with 0.5% to 1.0% of account equity. Stay there until you prove consistency.
- Define your stop in pips. Your setup decides the stop, not your lot size.
- Convert risk to position size. Position size = (Account equity × Risk %) ÷ (Stop pips × Pip value).
Framework example: $10,000 account. Risk 1% = $100. Stop = 25 pips. If pip value is $10 per standard lot, risk per lot = 25 × $10 = $250. Position size = $100 ÷ $250 = 0.40 lots.
If your stop must be wider because ATR expands, your position size must shrink. Do not “keep the lots” and hope.
Stop-loss placement errors beginners make
- Tight stops inside noise. If you place the stop inside the Bollinger Band channel or inside the trigger candle range, normal fluctuation will take you out. Put the stop beyond the invalidation swing, then add a buffer.
- Ignoring spread and costs. Spreads widen at session opens, news, and low liquidity. A stop that sits 2 to 5 pips beyond a level can still get tagged. Add room for spread, especially on pairs with higher average spread.
- No buffer beyond structure. A clean invalidation point is not enough. Price often runs stops by a few pips before moving. Use a buffer, or use ATR.
- Moving stops away. If the setup is invalidated, exit. Do not “give it more room” after entry. That turns a planned loss into an account problem.
Practical rule: if you use Bands + ATR, place the stop 1.0 to 1.5 ATR beyond the invalidation swing. If you cannot afford that stop with your fixed percent risk, you skip the trade.
Reward-to-risk guidelines by setup type
Your targets should match the market regime. Do not force trend targets in a range, and do not scalp a breakout.
- Range trades (mean reversion at bands). Aim for 1.0R to 2.0R. First target can be the mid-band. Full target can be the opposite band or the next clear level. Take partials if price stalls near the mid-band.
- Breakouts (squeeze, expansion, MACD confirmation). Require at least 2.0R on the plan, ideally 2.5R to 3.0R. Breakouts fail often. The winners must pay for the losers. Use the prior range height as a reference, then check if that distance gives you 2R or more.
- Trends (band-walk, pullbacks to mid-band). Think in multiples, 2.0R to 5.0R. Use a trailing method that fits your approach, such as a swing low trail or an ATR trail. Do not cap a trend trade at 1R unless structure forces you out.
Keep your R math consistent. Track your average R by setup. Cut any setup that cannot produce a positive average after costs.
Daily loss limits and avoiding revenge trading after a squeeze fakeout
Squeeze breakouts produce clusters of losses. Your job is to stop the bleeding fast.
- Set a daily loss limit. Use 2R to 3R per day. If you risk 1R per trade, that is usually 2 to 3 losing trades. When you hit the limit, you stop trading.
- Set a max consecutive loss limit. Use 2 losses in a row per setup. After that, you pause that setup for the day.
- After a fakeout, enforce a cooldown. Wait for a full candle close back inside the bands, then wait for the next clean setup. Do not “win it back” on the next candle.
- Do not flip positions instantly. A stop-out does not validate the opposite trade. You need a new signal, with new invalidation, and the same fixed risk.
If you struggle with discipline, simplify your process. Follow a beginner roadmap like how to start forex trading step by step and treat risk rules as non-negotiable.
Practical Forex Considerations Competitors Often Miss
Session behavior: London and New York move bands, Asia compresses them
Bollinger Bands react to volatility. Your setup quality changes by session.
- Asia session: price often ranges, bands narrow, and mid-band mean reversion works more often. You get more “clean” touches and fewer follow-through candles. You also get more false breaks because liquidity stays thinner.
- London open: bands expand fast, and the first 60 to 120 minutes can push through the outer band and keep going. Many beginner short trades fail here because they treat an upper-band tag as an automatic reversal.
- London to New York overlap: the widest ranges hit here on many pairs. Bands stay wide. Breakout setups perform better than fade setups, but you must demand structure, a squeeze, and a clear trigger candle.
Do this. Trade mean reversion when bands stay tight and the market prints repeated rejections. Trade breakouts when bands expand after a squeeze and price holds outside the band for more than one candle.
News events: CPI and NFP can break every “rule”
High-impact news can turn a normal band touch into a runaway move. Your indicator does not fail. Your environment changes.
- Spreads widen before the release. A “touch” can be a spread spike, not real trading interest.
- Slippage jumps. Your stop can fill worse than planned, even with a correct direction call.
- Bands expand after the first impulse. Late entries chase volatility, then get snapped back.
What to do instead.
- Do not open a new trade 5 to 15 minutes before scheduled tier-1 releases on that currency.
- If you already hold a trade, reduce risk. Tighten size, not stops. A tight stop during news often guarantees a loss.
- Wait for the first spike and the first pullback. Then trade the post-news structure, not the headline candle.
- Plan the rule in writing so you do not improvise. Use a simple forex trading plan template and lock your news filter into it.
Pair personality: majors, crosses, and gold do not behave the same
Your Bollinger settings and expectations should match the instrument.
- Majors (EURUSD, GBPUSD, USDJPY): tighter spreads and cleaner fills. Band touches can work for beginners because costs stay lower. Breakouts often need a catalyst, usually session change or news.
- Crosses (GBPJPY, EURAUD, GBPNZD): larger average ranges and sharper spikes. Band breaks can run far. Mean reversion can still work, but you need wider stops and smaller size.
- Gold (XAUUSD): fast expansion and frequent stop runs. A single candle can travel the full band width. If you trade gold, reduce leverage and stop trading “touch entries”. Wait for a close and a retest.
Adjust by measuring. Track each pair’s average spread, typical stop size in pips, and average daily range. If your spread regularly exceeds 10 percent of your stop size, your edge shrinks fast.
Broker realities: spreads and slippage make “touch” entries look better than they are
Many examples online assume perfect fills at the band. Live trading does not work that way.
- Bid and ask matter: your chart often shows bid. Your buy fills at ask and your sell fills at bid. A band “touch” on the chart may never be tradable at your price.
- Spread expansion: spreads widen at session transitions, rollovers, and news. That can trigger entries and stops without real momentum.
- Slippage: market orders can fill worse during fast candles. Limit orders can miss fills and leave you chasing.
Fix your execution rules.
- Do not enter because price “touched” the band. Enter on a candle close condition, or a clear trigger pattern, then use the next candle to manage risk.
- Use alerts at the band, then decide at candle close. That reduces impulse trades.
- Backtest with realistic costs. Add average spread and a slippage buffer. If the strategy only works with zero costs, it does not work.
Backtesting and Building a Simple Trading Plan
What to Document in Your Backtest
If you do not log details, you will not know what you did right or wrong. Keep it simple. Keep it consistent.
- Screenshot at entry: show the full context, include the bands, the trigger candle, and your levels.
- Screenshot at exit: show where you got out and why.
- Market type label: trend, range, squeeze, news spike, low volatility, high volatility.
- Setup name: “Band pullback continuation” or “Band rejection mean reversion”. One trade, one setup.
- Entry reason: candle close rule and the exact trigger pattern you used.
- Stop reason: structural level, band-based rule, or ATR-based rule. Write the number of pips.
- Exit reason: target hit, opposite band touch and close, time stop, or invalidation.
- Filters used: session, higher timeframe bias, trendline, support and resistance, squeeze condition.
- Costs: spread added, slippage buffer added, and whether you assumed market or limit orders.
- Outcome: R multiple, pips, and whether you followed your rules.
- Notes: one sentence. Example, “Entered late, skipped first valid signal.”
If you use structure filters, learn to draw them the same way every time. Use a basic method like this trendline guide, then stick to it.
How Many Trades You Need, and Why Small Samples Lie
Ten trades can make any setup look good. Or terrible. That is noise.
- Minimum: 50 trades per setup. This gives you a first read on win rate and average R.
- Better: 100 trades per setup. This reduces the impact of one streak.
- Best for confidence: 200 trades per setup across different conditions.
Small samples lie because outcomes cluster. You can get 6 winners in a row in a mediocre system. You can also get stopped out five times before the setup starts paying. If you change rules after a small sample, you optimize for luck.
Track these three numbers from the start. They keep you honest.
- Win rate: percent of trades that win.
- Average win and average loss: in R, not pips.
- Expectancy: (win rate x avg win) minus (loss rate x avg loss).
Walk-Forward Validation Across Months and Volatility
Backtests fail when you fit rules to one market phase. Walk-forward testing stops that.
- Step 1, pick an in-sample window: test 3 to 6 months. Write rules. Do not adjust after you start the next step.
- Step 2, run out-of-sample: test the next 1 to 3 months with the same rules.
- Step 3, roll forward: move the window ahead and repeat. Keep logging results by block.
- Step 4, label volatility: mark each block as low, normal, or high volatility based on ATR or average daily range.
- Step 5, check stability: you want similar expectancy and drawdown behavior across blocks, not one “golden” month.
Keep your rules stable. If you change a rule, start a new test set. Treat it like a new strategy.
A One-Page Trading Plan Template for Each Setup
One setup, one page. If it does not fit on one page, you will not follow it.
| Setup Name | Band Pullback Continuation, or Band Rejection Mean Reversion |
| Market Condition | Trend or range. Define how you label it, then apply it the same way. |
| Timeframes | Example, bias on H1, entries on M15. Use one pair of timeframes. |
| Indicator Settings | Bollinger Bands 20, 2. Any added filter settings. |
| Entry Rules | Candle close trigger. Pattern definition. Exact location relative to bands and structure. |
| Stop-Loss Rules | Placed at invalidation. Fixed rule, example, below swing low plus buffer. State buffer. |
| Take-Profit Rules | Primary target in R or at mid-band or opposite band. Optional partials rule. |
| Trade Management | What you do on the next candle. When you move stop. When you do nothing. |
| Filters | Session filter, news filter, trend filter, volatility filter. Keep filters few. |
| Risk Rules | Risk per trade. Daily loss limit. Max open trades. |
| Costs Assumption | Average spread and slippage buffer used in testing. |
| Performance Targets | Minimum trades before judgment. Max drawdown you accept. Expectancy threshold. |
Print the page or pin it next to your chart. Then trade the plan. Do not trade your mood.
Pros, Cons, and Common Mistakes With Bollinger Bands in Forex
Advantages
- Clarity. You get three lines. Price relative to the middle band gives you a simple read, above for strength, below for weakness.
- Volatility awareness. Bands expand when volatility rises and contract when it falls. This helps you avoid forcing trades in dead hours.
- Adaptable to multiple styles. You can use the same tool for trend continuation, mean reversion, and breakout structure. Your rules decide the style, not the indicator.
Limitations
- Whipsaws in chop. In ranges, price can tag both bands and snap back fast. You take small losses over and over if you trade every touch.
- Parameter sensitivity. Period and deviation settings change signal frequency and stop distance. A 20,2 band behaves very different from 10,2 or 20,2.5.
- Lagging mean in trends. The middle band is a moving average. In strong trends, it trails price. “Back to the mean” can stay away longer than your account can handle.
Top beginner mistakes
- Trading every touch. A band touch is not a setup. In trends, the outer band can act like a rail. You short strength and buy weakness.
- Ignoring trend context. You fade upper-band touches in an uptrend and call it “overbought.” You miss that the market uses the band to trend.
- No filter for squeezes. You see narrow bands and guess breakout direction. You enter before the trigger and get chopped. Treat squeezes as “stand by,” not “go.”
How to simplify your Bollinger Bands plan
- Pick one setup. Example, trend pullback to the middle band only, or range fade at the outer band only. Do not mix both in the same week.
- Pick one timeframe. Build rules on one chart, then execute there. Most beginners do better with H1 or H4 because noise drops.
- Pick one execution trigger. Example, close back inside the bands after a touch, or break and retest of the middle band. Add one context check, such as a clean trendline, then stop. Use this guide if you need help with how to draw trendlines.
FAQ
What settings should you use for Bollinger Bands in forex?
Start with 20-period and 2 standard deviations. Use the close price. Do not optimize settings on a small sample. Change settings only if you also change timeframe and test at least 100 trades on that same chart.
Which timeframe works best for beginners?
Use H1 or H4. You get cleaner swings and fewer false touches than M5 or M15. Pick one timeframe and stick to it for a month. Track results, then adjust. Do not mix timeframes in the same week.
Do Bollinger Bands work in trending markets?
Yes, if you treat the bands as a trend tool. In strong trends, price can ride the outer band. Avoid fading every touch. Trade with the trend using pullbacks to the middle band and a clear structure break in your favor.
Are band touches a buy or sell signal?
No. A touch means volatility expanded, not that price must reverse. Use a trigger, like a close back inside the bands, or a break and retest of the middle band. Add one context filter, like trend direction or a key level.
How do you trade the Bollinger Band squeeze?
Mark the tightest band period, then draw a range around the price compression. Wait for a clean close outside the range, then a retest. Place the stop beyond the opposite side of the range. Skip squeezes inside choppy sessions.
Where should your stop loss go?
Place the stop where your setup fails, not at a fixed pip number. For mean reversion, the stop often goes beyond the recent swing. For trend pullbacks, it goes beyond the pullback low or high. Use this guide on stop loss and take profit.
Should you add RSI, MACD, or other indicators?
Keep it simple. Add one filter only if it solves one problem you see in your log. Example, use RSI to avoid taking mean reversion trades when momentum stays extreme. If it does not improve your win rate or drawdown, remove it.
What pairs work best with Bollinger Bands?
Trade liquid majors and main crosses. Spreads stay tighter and fills improve. Avoid thin pairs where spikes hit stops. Test one pair first. Many beginners do better with EURUSD or GBPUSD because data and behavior stay consistent.
How many trades do you need to know if the setup works?
Track at least 50 trades for a first read, 100 for a solid read. Record timeframe, session, trend state, entry trigger, stop size, and outcome. Judge results by expectancy and maximum drawdown, not by a short win streak.
What is the most common beginner mistake?
Switching rules after a few losses. Bands react to volatility, so your edge needs repetition. Use one setup, one timeframe, and fixed rules for one month. Improve only one variable at a time, then re-test with fresh trades.
Conclusion
Bollinger Bands do one job. They map volatility around a moving average. Your results come from the rules you wrap around the bands, and how well you repeat them.
- Pick one setup. Use either a squeeze breakout or a mean reversion entry at a clear level. Do not mix both in the same session.
- Define the market state first. Trend, range, or compression. Skip trades when you cannot label it fast.
- Use one entry trigger. Close outside the band, reclaim of the midline, or a clean break from the squeeze. One trigger, written down.
- Fix your risk. Use a stop that matches volatility, then size your position so each trade risks the same percent.
- Track expectancy. Log at least 30 trades, then review win rate, average win, average loss, and max drawdown.
Final tip. Build a one page checklist, then trade it for one month with no rule changes. If your edge is real, it shows up in the data. If it is not, you will see it fast. Tighten one variable, then re-test. Use risk to reward targets that fit your setup, not your mood.
-
Stop Loss vs Take Profit: Differences, Examples & Best Practices
5 months ago -
Forex Trading Psychology Tips: How to Stay Disciplined and Consistent
5 months ago -
Forex Order Types Explained: Market vs Limit vs Stop Orders
5 months ago -
How to Set Stop Loss and Take Profit (Step-by-Step)
5 months ago -
How to Start Forex Trading Step by Step (Beginner Roadmap)
5 months ago
-
- Beginner Setup #2: The Bollinger Squeeze Breakout (Volatility Expansion)
- How to identify a squeeze objectively (band width compression + ATR contraction)
- Breakout confirmation: close outside the band + retest + structure break
- Stop placement choices: squeeze range, opposite band, or ATR-based
- Profit management: measured move, trailing stop using the middle band, partials
- False breakout defenses: time-of-day filter, news awareness, multi-timeframe bias
-
- What settings should you use for Bollinger Bands in forex?
- Which timeframe works best for beginners?
- Do Bollinger Bands work in trending markets?
- Are band touches a buy or sell signal?
- How do you trade the Bollinger Band squeeze?
- Where should your stop loss go?
- Should you add RSI, MACD, or other indicators?
- What pairs work best with Bollinger Bands?
- How many trades do you need to know if the setup works?
- What is the most common beginner mistake?
-
-
How to Place a Forex Trade Step by Step (Your First Trade Explained)
3 months ago -
Forex Trading vs Crypto Trading: Which Market Is Better for Beginners?
3 months ago -
Forex Lot Size Calculator: How to Use It to Size Trades Correctly
5 months ago -
How to Calculate Position Size in Forex (Position Sizing Formula + Examples)
5 months ago -
Forex Leverage Explained: How It Works, Pros, Cons & Examples
5 months ago
-
Forex Trading Platforms Comparison: MetaTrader vs cTrader vs TradingView
5 months ago -
Is Forex Trading Legal in the United States? Rules, Regulators & What to Know
5 months ago -
Stop Loss vs Take Profit: Differences, Examples & Best Practices
5 months ago -
Forex Market Hours & Trading Sessions Explained (Best Times to Trade)
5 months ago -
Forex Leverage Explained: How It Works, Pros, Cons & Examples
5 months ago