Trend Lines & Channels in Forex: How to Draw Them and Trade Breaks
Trend lines and channels turn price swings into structure. You use them to define trend direction, map support and resistance, and plan trades around breaks. A trend line connects higher lows in an uptrend or lower highs in a downtrend. A channel adds a parallel line to frame price movement and highlight overbought and oversold zones.
You will learn how to draw clean lines that hold up under testing, how many touches you need before you trust a level, and how to avoid common drawing errors. You will also learn how to trade breakouts, when to wait for a retest, where to place stops, and how to set targets using simple rules and risk-reward ratio.
Key Takeaways
- In het kort: Draw trend lines using swing highs and lows, not random wicks.
- In het kort: Trust a level after at least three clean touches.
- In het kort: Build channels by copying the trend line, then anchoring it to the opposite swing.
- In het kort: Treat the channel top as potential overbought, the bottom as potential oversold.
- In het kort: Trade breaks with rules, enter on the break or on the retest, never on hope.
- In het kort: Place stops beyond structure, size your risk, and target with fixed R multiples.
Drawing rules that hold up
- Pick your timeframe first. Keep it consistent.
- Connect two swings to draft the line. Wait for the third touch to confirm it.
- Use the clearest pivots. Skip forced fits and shallow pullbacks.
- Limit adjustments. If you keep moving the line, it has no edge.
- Prefer bodies on higher timeframes. Let a single wick pierce slide if the close respects the line.
Channel rules you can repeat
- Draw the main trend line first.
- Copy it in parallel. Place the copy on the opposite swing extreme.
- Look for two-sided respect. You want price to react at both boundaries.
- Redraw when structure changes. A new swing sequence can invalidate the old channel.
Breakout and retest plan
- Define a break by the close, not the intrabar spike.
- Enter on the first close outside the line if momentum stays strong.
- Wait for a retest if the break looks thin, or if the level has many touches.
- Place your stop beyond the broken line and beyond the last swing. Avoid tight stops inside noise.
- Set targets with structure first, then confirm you get at least 2R. Skip trades that cannot pay.
Common mistakes to cut
- You draw through the middle of price. Use pivots.
- You count touches that do not react. A touch needs rejection or a clear pause.
- You trade every break. Filter for space to the next support or resistance.
- You ignore pair relationships. Check forex correlations before you commit risk.
What trend lines and channels mean in forex (and why traders use them)
Trend line basics: directional bias and dynamic support and resistance
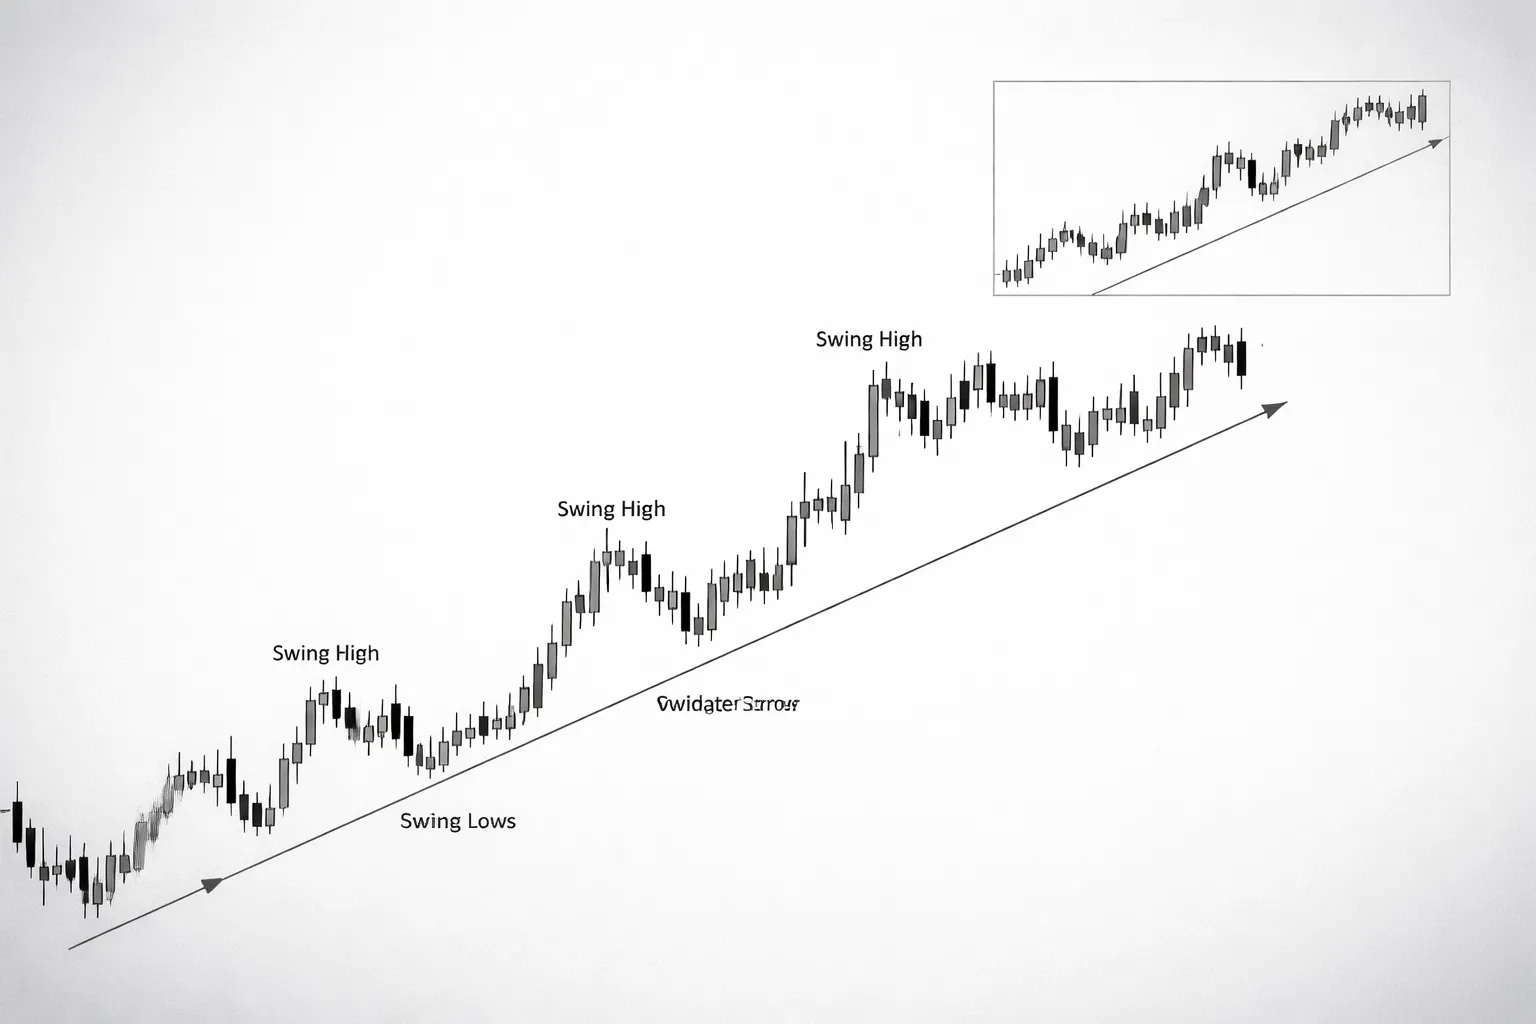
A trend line links swing lows in an uptrend or swing highs in a downtrend. It shows bias. It also gives you a moving support or resistance level.
In forex, support and resistance often shift with time and volatility. A trend line updates that reference point each new candle. You use it to judge if pullbacks stay healthy or start to fail.
- Uptrend line: rising line under price, buyers defend pullbacks.
- Downtrend line: falling line above price, sellers cap rallies.
- Slope matters: steep lines break more. Moderate slopes tend to hold longer.
Channel basics: the trend corridor and pullback rhythm
A channel is two parallel lines. One is your main trend line. The other is a copy placed on the opposite side of price to capture swings.
The channel defines a corridor. It shows the normal range of pullbacks and pushes. It also makes the market rhythm visible, bounce to midline, push to edge, repeat.
- Lower line in an uptrend: pullback zone and structure support.
- Upper line in an uptrend: extension zone where moves often pause or mean revert.
- Midline use: optional, helps manage trades when price respects the center.
When these tools work best: trends vs. chop
Trend lines and channels work best when price prints clean swings and respects prior pivots. You want expansion in one direction and pullbacks that stay contained.
They fail most in chop. Ranges produce false breaks, flat slopes, and constant overlap. If candles alternate direction and closes cluster, treat lines as weak.
- Better conditions: higher highs and higher lows, or lower highs and lower lows, with clear swing points.
- Worse conditions: sideways market, frequent wick-throughs, no follow-through after breaks.
- Quick filter: if your next support or resistance sits close, the break has no room to run.
Common use cases: entries, stops, targets, and management
You use trend lines and channels to define where you will act, where you will exit, and where the trade becomes invalid.
- Entries on bounces: buy near an uptrend line, sell near a downtrend line, only after rejection at a pivot.
- Entries on breaks: trade the break only when price can travel to the next level with space for at least 2R.
- Retest entries: after a break, wait for price to retest the line, then enter on failure to reclaim.
- Stops: place stops beyond the last swing point, not tight to the line. Lines get pierced.
- Targets: use the opposite channel boundary, prior swing levels, or major support and resistance. Use the same process you use to set take-profit levels.
- Management: trail behind new swing lows in an uptrend or swing highs in a downtrend, or reduce risk as price reaches the far side of the channel.
If you want a repeatable framework that ties structure, risk, and targets together, use a simple swing trading approach and plug trend lines and channels into it as your structure tool.
The anatomy of a high-quality trend line
Choosing swing points: meaningful highs and lows vs. noise
Start with clear swing highs and swing lows. Use points that stand out without zooming in.
- Use obvious pivots. A swing high should have lower highs on both sides. A swing low should have higher lows on both sides.
- Ignore single-bar spikes in the middle of a move. If the market did not react after the spike, it is usually noise.
- Prefer pivots that broke a prior swing. A higher low that led to a higher high matters more than a random dip.
- Check reactions. If price bounced, paused, or accelerated from the level, keep it. If price cut through it, drop it.
Number of touches and spacing: what makes a line more reliable
A trend line needs repetition. It also needs time between touches.
- Two touches draw the line. The third touch validates it. Treat anything under three as provisional.
- Space matters. If touches cluster within a few candles, the line has low value. You want swings separated by time and distance.
- Grade the touches. Clean bounces and strong follow-through add weight. Small hesitations do not.
- Limit forced fits. If you must keep adjusting the line to “catch” touches, you do not have a trend line. You have a guess.
Slope and angle: healthy trends vs. parabolic moves
Slope tells you how stable the trend is.
- Prefer moderate slopes. They tend to hold longer because pullbacks can reach the line without breaking structure.
- Be cautious with steep slopes. Parabolic moves often end with sharp breaks and deep pullbacks.
- Watch for acceleration. If each new swing makes the line steeper, the trend loses durability. Expect a break or a shift to a flatter line.
- Use the line as structure, not a miracle level. The steeper the line, the less margin you have for noise.
Wicks vs. bodies: what to anchor on for consistency
Pick one method and stick to it. Consistency matters more than being “right” on one chart.
- Use wicks when rejection drives the move. If turns happen off spikes and long tails, anchor to the extremes.
- Use bodies when closes control the trend. If the market respects closing levels and wicks are messy, anchor to candle bodies.
- Do not mix rules mid-line. Switching from wick to body to make a line work reduces its value.
- Allow small overshoots. Treat the line as a zone around the anchor, not a single-pixel barrier.
Timeframe alignment: use higher-timeframe structure to avoid weak lines
Draw from the top down. Let the higher timeframe set the rules.
- Start one or two timeframes higher. For a 15-minute trade, check 1-hour and 4-hour. For a 1-hour trade, check 4-hour and daily.
- Anchor to the higher-timeframe swings first. Then refine on your trading timeframe without changing the main slope.
- Avoid lines that only exist on the lower timeframe. If the higher timeframe ignores it, breaks will be noisy and frequent.
- Match the line to your execution plan. If you trade intraday, keep your rules aligned with your day trading forex strategy and use higher-timeframe lines as filters.
How to draw trend lines correctly (step-by-step)
Step 1: pick your market context and timeframe (top-down workflow)
Start with the highest timeframe you use for bias. For most traders, that is H4 or D1.
- Mark the last two clear swing highs and swing lows.
- Decide the state, uptrend, downtrend, or range.
- Choose your drawing timeframe, usually the same as your setup timeframe.
- Drop to your execution timeframe and keep the same slope. Do not redraw to “fit” noise.
If the swings do not stand out on the higher timeframe, you do not have a trend line worth trading yet.
Step 2: anchor the first two points and project forward
Use two swing points to create a valid line. Then extend it right.
- In an uptrend, connect two swing lows. Use the candle wicks, since they show rejection.
- In a downtrend, connect two swing highs. Use the candle wicks.
- Place the line so it touches both points without cutting through the candle bodies between them.
- Project the line forward into “empty space”. Your next decisions happen there.
A line that cuts through multiple bodies usually tracks chop, not trend.
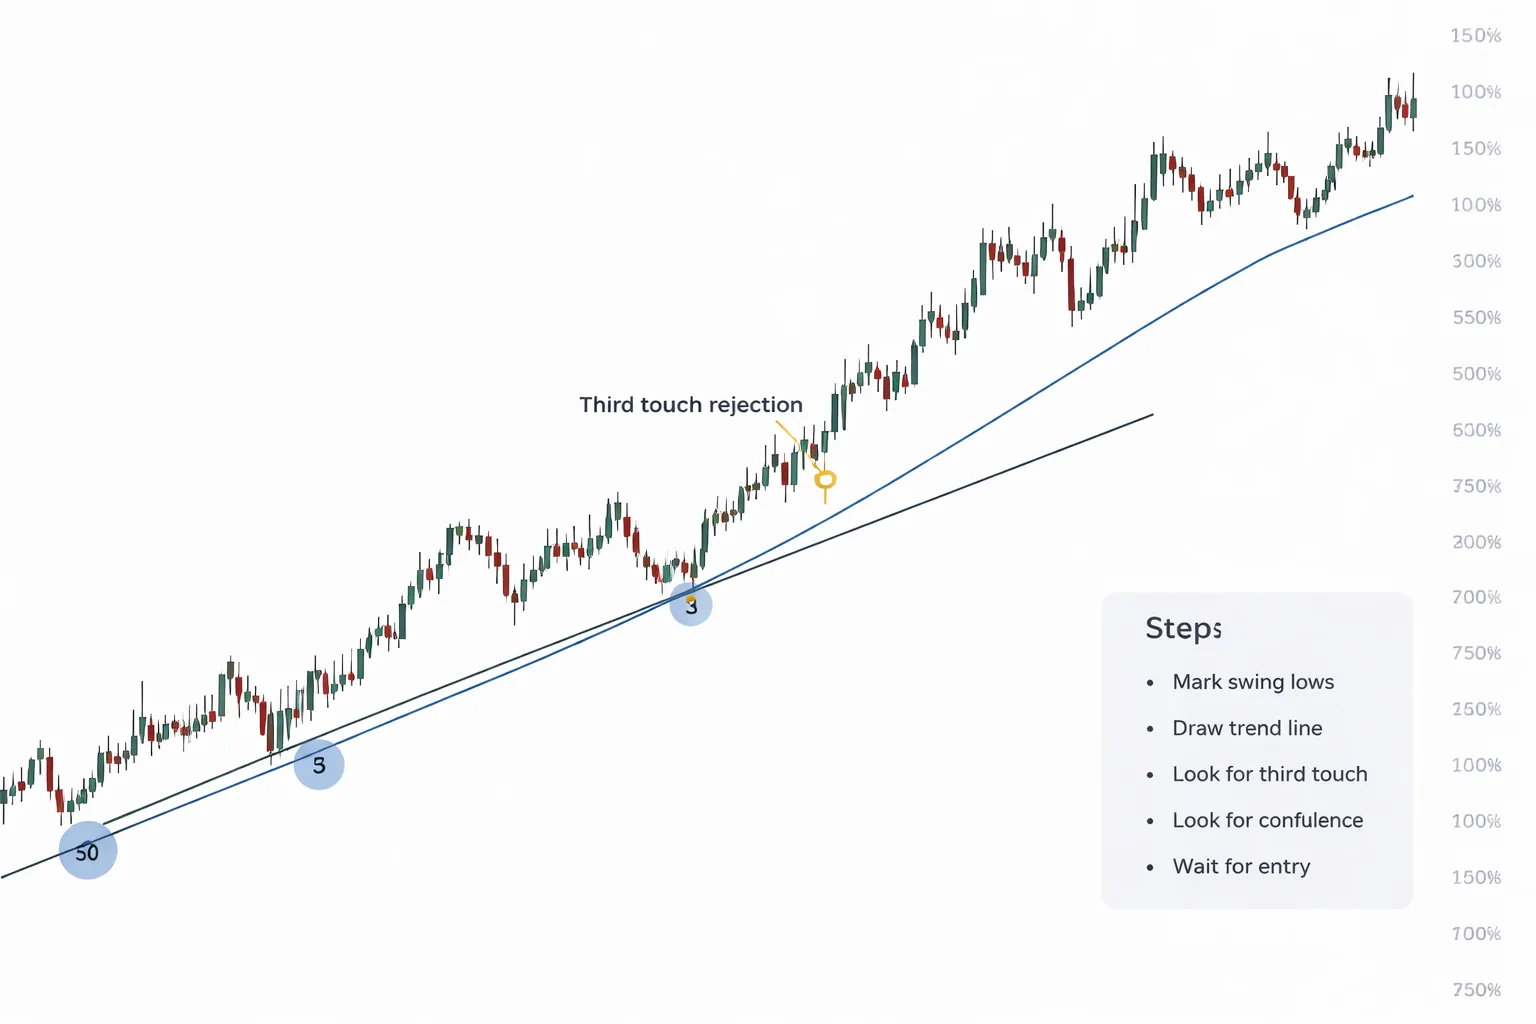
Step 3: refine with the third touch and reject forced fits
Two points draw a line. Three touches build confidence.
- Wait for price to react at the projected line a third time. Count it only if you see a clear rejection and follow-through.
- Do not move the line to “capture” an extra touch if it breaks the original slope.
- Do not accept micro touches caused by single spikes on a lower timeframe.
- If you need to keep adjusting the line, you do not have a stable trend line. Drop it.
Keep your rule simple. Either price respected the original line, or it did not.
Step 4: validate with confluence (horizontal levels, MAs, pivots)
Trend lines work best when they align with other decision points.
- Add a horizontal level at the same area, prior swing high or low, or a clean support or resistance zone.
- Check if a key moving average sits near the line, such as the 20, 50, or 200.
- Check daily pivots if you trade intraday. Confluence near S1, R1, and the pivot point matters.
- Use momentum as a filter if you need one. For example, confirm breaks with your RSI strategy rules.
If the line stands alone with no nearby structure, expect more false breaks.
Step 5: maintain a “single-source-of-truth” drawing rule set to stay objective
Write your drawing rules and follow them on every chart. This keeps your lines consistent across pairs and timeframes.
| Rule | Default |
|---|---|
| Timeframes | Bias on D1 or H4, draw on setup timeframe, execute on lower timeframe without changing slope. |
| Anchors | Use wick extremes at clear swing points, not random mid-leg candles. |
| Validity | Two touches to draw, third touch to trust. |
| Adjustment policy | No redrawing after the third touch. Only redraw if a new major swing forms on the higher timeframe. |
| Deal breakers | Line cuts through multiple candle bodies, relies on one spike, or only exists on the lower timeframe. |
When you keep one rule set, your trend line breaks become measurable. You stop “seeing” breaks that your rules would not allow.
Forex trend channels: building parallel structure around price
Classic (parallel) channel construction from a trend line and opposite swing
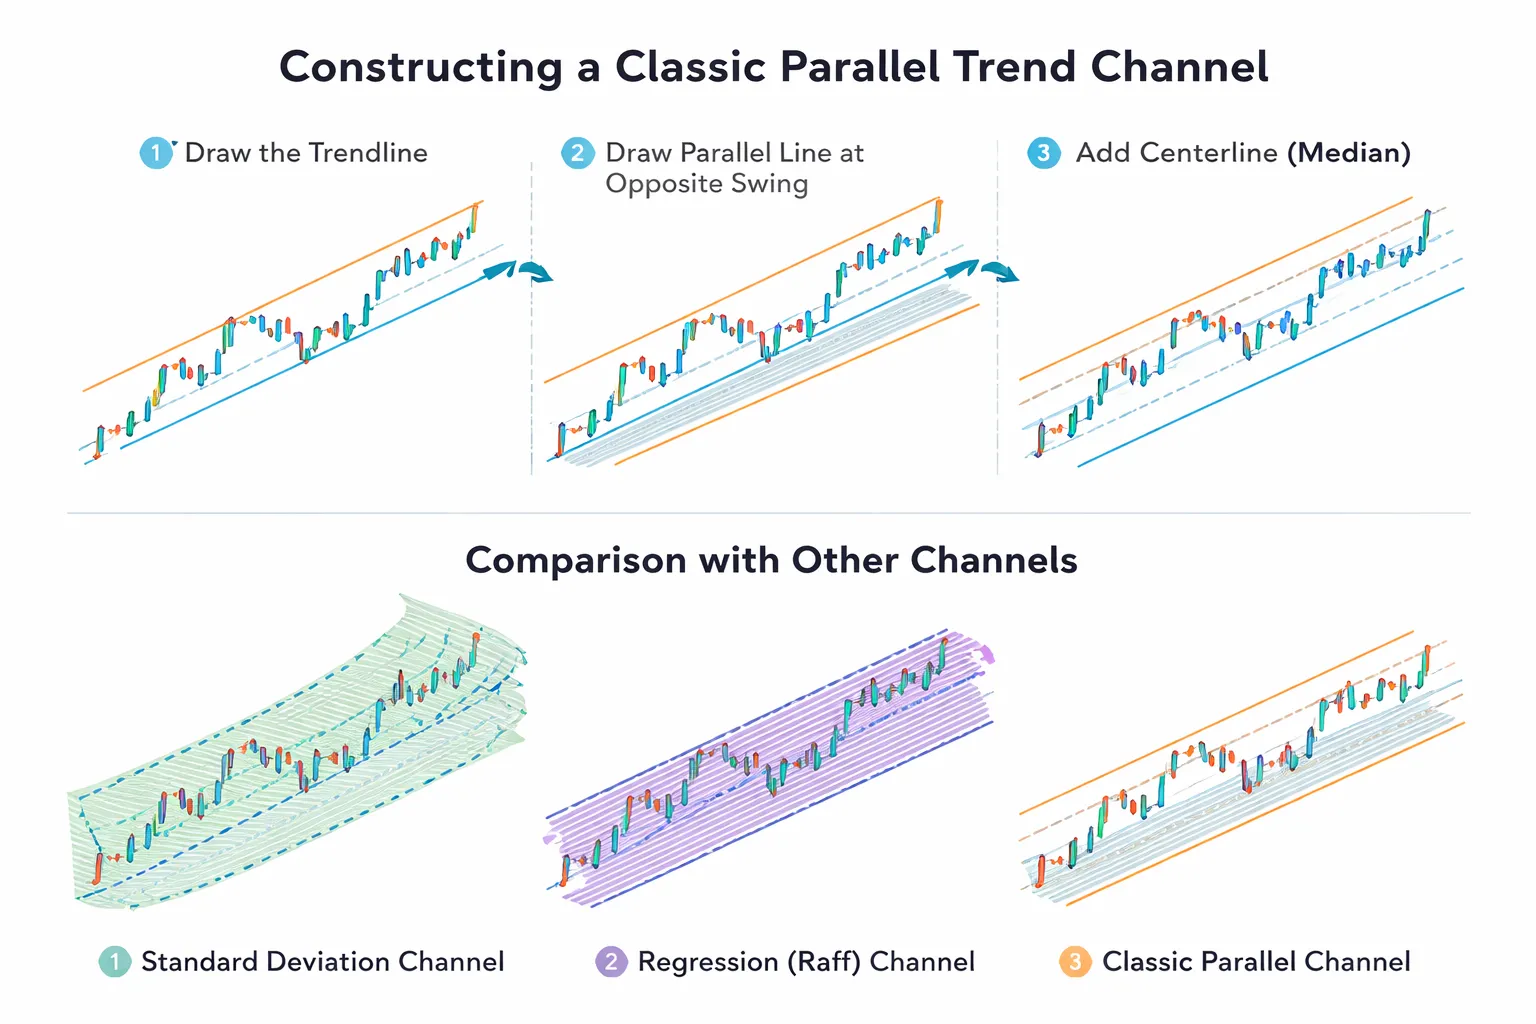
A trend channel is two parallel lines that frame your trend line. One line anchors the trend. The other line caps pullbacks or rallies.
- Draw your primary trend line first. Use your existing rules for swing selection.
- Find the first clear opposite swing after the second touch on the trend line. In an uptrend, use the first swing high. In a downtrend, use the first swing low.
- Copy the trend line. Keep the same slope. Slide the copy to hit that opposite swing.
- Now you have a channel. Price should respect both sides if the trend is clean.
Do not force the outer line to fit every wick. A channel works when it captures most swings with similar spacing, without cutting through clusters of candle bodies.
The three-touch channel method and why it filters randomness
Two touches build a line. Three touches validate structure. Apply the same idea to channels.
- Touch 1 and 2 define the trend line.
- Touch 3 validates the trend line. After this, you stop adjusting.
- Then you need confirmation on the parallel line. You want at least two reactions on the channel boundary.
- A strong channel shows alternating reactions, trend line, parallel line, trend line.
This filters randomness because many trends drift with uneven pullbacks. A real channel shows repeatable spacing. If price never reacts at the parallel line, you do not have a tradable channel. You have a trend line with noise.
Using median lines and centerlines to gauge trend strength
Add a centerline to measure balance inside the channel. It gives you a simple strength read.
- Place a line exactly halfway between the two channel boundaries.
- In a healthy trend, price often rotates around this line and uses it as a decision point.
- Frequent closes beyond the centerline toward the outer boundary show trend strength.
- Repeated failure to reach the outer boundary and constant flips around the centerline show weak momentum.
Use the centerline for trade management. If you enter on a channel bounce, the centerline can act as the first objective, then the far side of the channel. Align this with your stop loss and take profit rules so you do not invent targets mid-trade.
Standard deviation channels: capturing volatility around the trend
Parallel channels assume stable swing spacing. Volatility breaks that assumption. Standard deviation channels adapt the width to volatility.
- Pick a lookback that matches your trading horizon, such as 50 to 200 candles.
- Fit a baseline trend, then plot bands at fixed deviations from that baseline, often 1 and 2 standard deviations.
- Expect price to spend most time inside the 1 deviation band in normal conditions.
- Repeated tags of the 2 deviation band show expansion. A break beyond it shows extreme conditions.
Use them when your manual channel keeps failing because pullbacks expand and contract. Do not treat the band as support or resistance by default. Treat it as a volatility boundary. Breaks matter more when they hold for several closes, not when one wick pokes through.
Regression and Raff-style channels: data-driven alternatives and when to prefer them
Regression channels reduce subjectivity. They fit a best-line through price over a chosen window, then build bands around it.
- Linear regression channels use a best-fit line. The bands usually reflect deviations from that line.
- Raff channels draw a best-fit line, then set channel width by the maximum distance of price from the line in the window.
- Both methods update as the lookback window changes. Your settings control the result.
Prefer these tools when you trade systematic rules and you need repeatable lines across pairs and sessions. Use them when manual swing selection creates inconsistency. Avoid them when the market just made a fresh structural break and your lookback still contains the old trend. Shorten the window or step up to a higher timeframe.
Trading inside the channel: pullbacks, bounces, and continuation setups
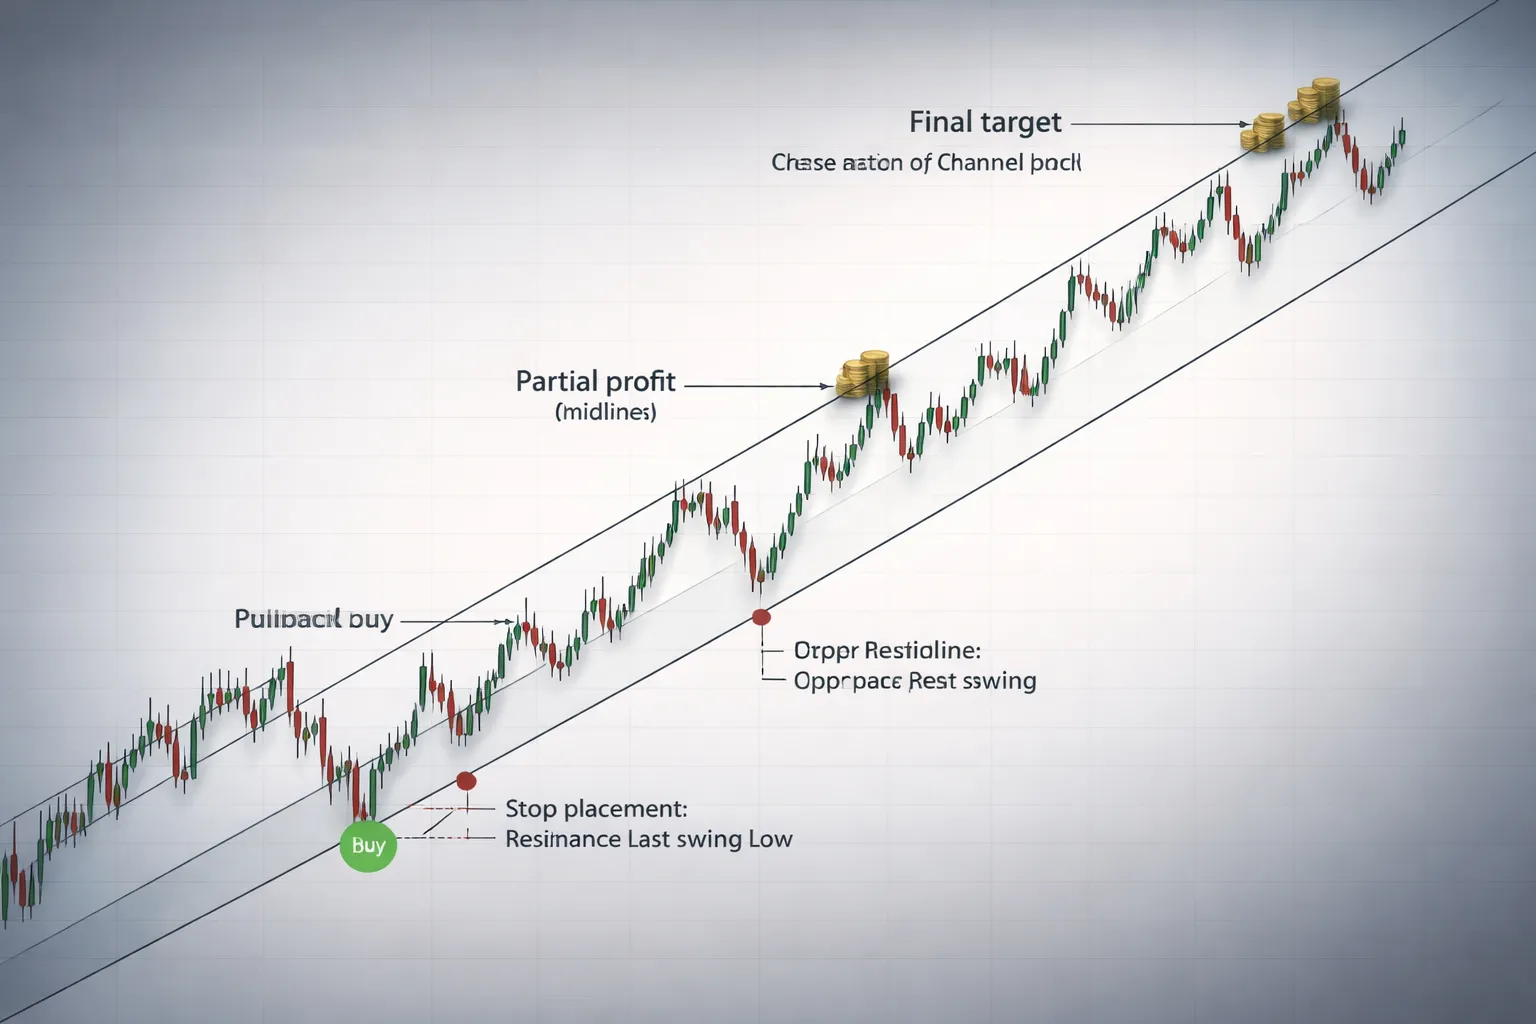
Trend continuation entries, buying dips and selling rallies with structure
Trade the channel when price respects both bands and the midline. Treat the channel as structure, not as a signal by itself.
- In an up channel, look to buy pullbacks into the lower band or the midline, after price makes a higher low.
- In a down channel, look to sell rallies into the upper band or the midline, after price makes a lower high.
- Use confluence, prior swing points, round numbers, session highs and lows, and the channel midline. More alignment means cleaner trades.
- Avoid first touch entries after a fast impulse. Let price print a swing and show rejection.
Candlestick and price action triggers near the boundaries
Use triggers that show rejection or a failed attempt to break the band. Keep them simple and repeatable.
- Pin bar rejection, long wick into the band, close back inside the channel. Take the trade on a break of the pin bar high or low, in the trend direction.
- Engulfing close, price pushes into the band, then an engulfing candle closes back inside. It often marks the end of the pullback.
- Micro-break and reclaim, price pokes outside the band, then closes back inside and holds. Treat the outside poke as a liquidity sweep, not a breakout.
- Two-step pullback, impulse, pullback, weak bounce, second pullback that fails to break the prior swing. Entry comes on the break of the lower timeframe trigger.
Do not take triggers when price closes outside the channel and holds there for two or more candles. That is channel failure until proven otherwise.
Stop placement logic, beyond structure, beyond the last swing, or ATR-based
Your stop must sit where the setup breaks. Place it beyond the level that defines your idea.
- Beyond the channel band, put the stop outside the boundary with a small buffer. Use this when the band acts as clear support or resistance.
- Beyond the last swing, place the stop beyond the pullback low in an up channel, or beyond the pullback high in a down channel. This fits swing based entries.
- ATR-based, set the stop at a fraction of ATR beyond the band or swing. This adjusts for volatility and prevents tight stops in fast sessions.
Keep the stop and target aligned with your stop loss and take profit plan. If the required stop is too wide for your rules, skip the trade.
Profit-taking inside the channel, opposite band targets, partials, and trailing
Match the exit to the channel you see. Wide channels allow holds. Tight channels require faster profit capture.
- Primary target, the opposite band. Buy near the lower band, target the upper band. Sell near the upper band, target the lower band.
- Conservative target, the midline. Use it when the trend looks tired or the channel slope flattens.
- Partials, take partial profit at the midline, then hold the rest for the far band. This lowers variance.
- Trailing, trail behind new swing lows in an up channel, or swing highs in a down channel. You stay in the move if the trend accelerates.
Managing strong trends, riding the boundary vs waiting for mean reversion
Strong trends change how price interacts with the channel. Price can walk the outer band and ignore the midline.
- When price rides the upper band in an uptrend, stop trying to short it. Wait for a pullback to the midline, then look for a continuation trigger.
- When price rides the lower band in a downtrend, stop trying to buy it. Wait for a rally to the midline, then sell the failure.
- Use time as a filter, if pullbacks stay shallow for several swings, treat the outer band as the trend path and trade with it.
- Switch modes after a clean break, if price closes outside the channel and retests the broken band from the other side, stop trading bounces. Prepare for a breakout or a new channel.
How to trade trend line and channel breaks without getting trapped
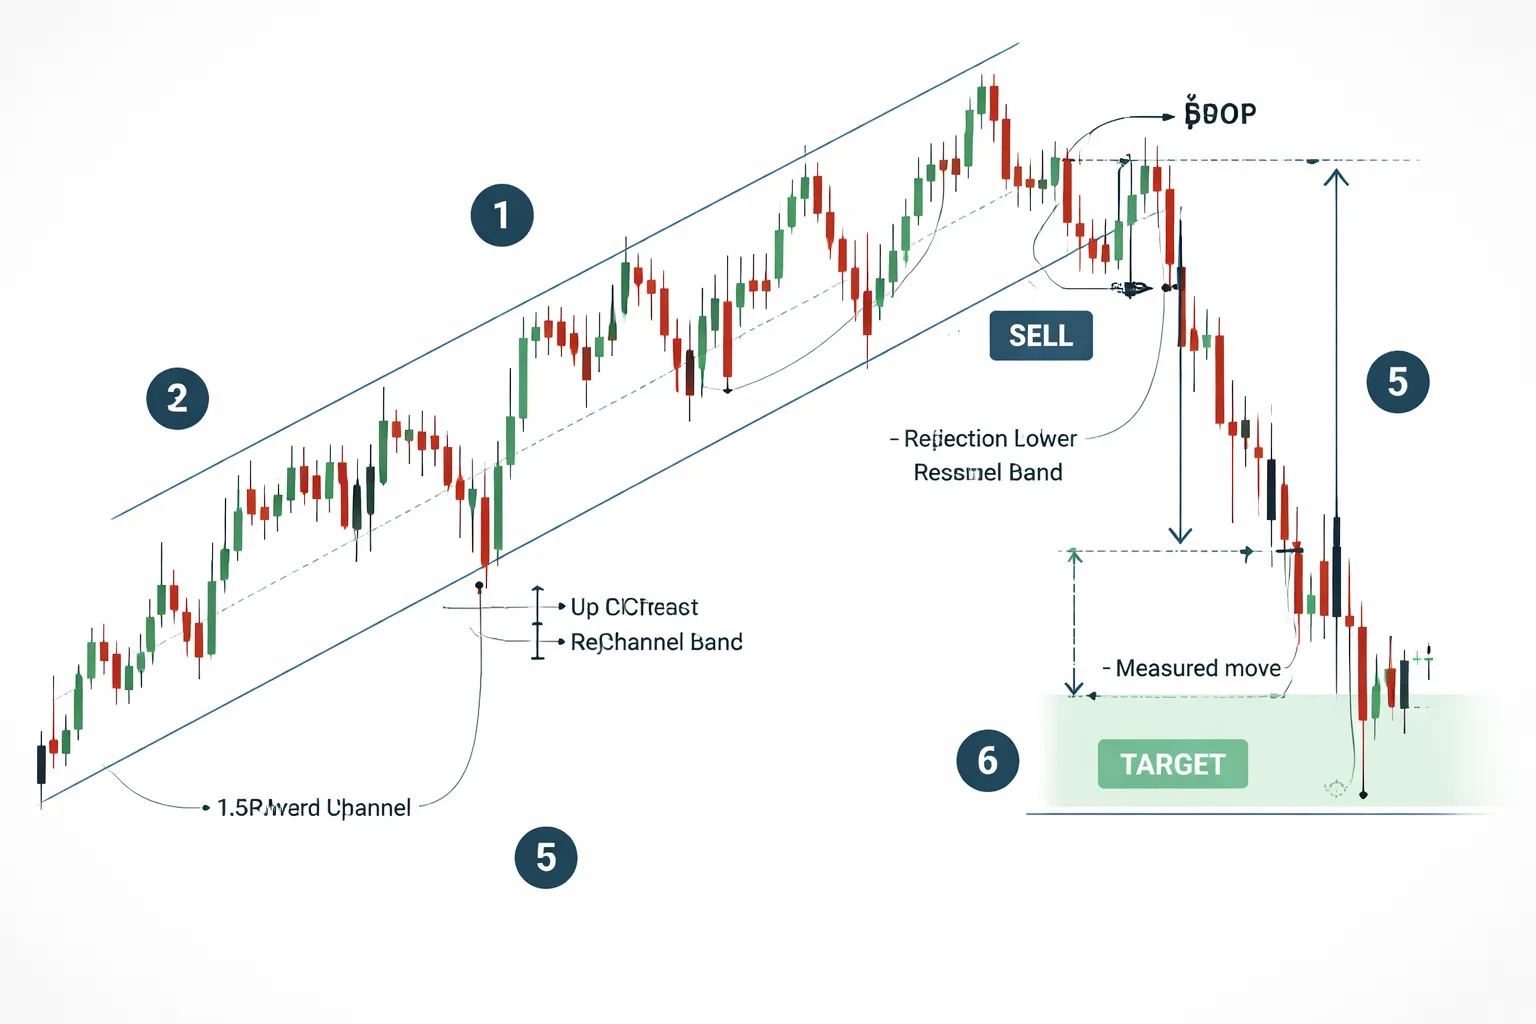
Defining a true break, close criteria, distance, and momentum
Trade breaks you can measure.
- Close rule: Use candle closes, not wicks. For a trend line break, require a full close beyond the line. For a channel break, require a close beyond the outer band.
- Distance rule: The close should clear the line by a meaningful amount. Use ATR as a yardstick. Aim for at least 0.2 to 0.5 ATR beyond the line, on the close. Smaller moves tend to snap back.
- Momentum rule: The break candle should expand range and travel. You want a larger body, less overlap with the prior candle, and follow-through on the next candle.
- Structure rule: A true break usually takes out the last minor swing inside the channel. If price breaks the line but leaves the internal swing intact, treat it as noise.
Break-and-retest entries, turning prior support into resistance
Chasing first breaks gets you trapped. Let the market confirm the flip.
- Mark the broken trend line or channel band.
- Wait for price to retest it from the other side.
- Enter on rejection, a close back in your direction, or a clear lower high or higher low at the retest.
- Place your stop beyond the retest swing, not tight to the line. Lines are zones in live trading.
- If price re-enters the channel and closes back inside, cancel the breakout bias. You just got a failed break.
Use clean candle signals at the retest. If you need a refresher on reading bodies and closes, review candlestick charts.
Filtering false breakouts, volatility regime, session timing, nearby liquidity
False breaks cluster around two conditions, low volatility and obvious liquidity.
- Volatility regime: In low ATR phases, price drifts and wicks through lines. Reduce breakout trades. Focus on bounces or wait for volatility expansion.
- Session timing: Trust breaks during active sessions. London open and the London to New York overlap produce cleaner follow-through. Be cautious during late New York and pre-Asia, when liquidity thins.
- Nearby liquidity: Look left. If the break runs straight into a prior swing high or low, a daily high or low, or a round number, expect a stall and possible snapback.
- News risk: If a major release hits soon, treat the first move as unstable. Wait for the post-news close and the retest.
Using multi-timeframe confirmation, break on one chart, validate on another
One chart gives the trigger. Another chart gives the context.
- If you trade off M15, validate on H1. If you trade off H1, validate on H4.
- Only take the break if the higher timeframe also shows a close beyond a matching level, or a clear structure shift, like a break of a prior swing.
- If the lower timeframe breaks but the higher timeframe still sits inside its channel, trade smaller or skip it. You are fighting the stronger structure.
- Use the higher timeframe to set the line and the lower timeframe to time the retest entry.
Measured-move and structure-based targets after the break
Set targets before you enter. Use two methods, then choose the more conservative.
- Channel width target: Measure the channel height, then project it from the breakout point. This gives a clean measured move.
- Structure target: Target the next obvious liquidity, prior swing high or low, weekly level, or unfilled range edge. Take partials into that area.
- Stop and target alignment: If your stop sits beyond the retest swing, your first target should sit far enough to justify the trade. If you cannot reach at least 1R before major structure, skip it.
- Trail with structure: After price prints a new swing in your favor, trail behind the last pullback swing, not behind the trend line.
Risk management for breakouts and channel trades
Invalidation first, define where the idea is wrong
Your stop goes where your breakout or channel thesis fails. Place it beyond the level that should hold if the setup is real.
- Breakout trade: Invalidation sits back inside the prior range. If price closes back inside and holds, the break failed.
- Break and retest: Invalidation sits beyond the retest swing. If price breaks the retest low in a bullish break, the retest failed.
- Channel bounce: Invalidation sits beyond the channel boundary and the last swing. If price pierces the boundary and keeps printing structure against you, the channel trade failed.
Do not set stops at round numbers because they feel safe. Anchor them to structure, then size the trade to fit your risk.
Position sizing, fixed fractional risk and pip value
Risk a fixed fraction of your account per trade. Keep it constant across pairs and timeframes. Most traders blow up from variable risk, not bad entries.
- Pick a risk per trade, for example 0.25% to 1%.
- Measure stop distance in pips from entry to invalidation.
- Compute position size from risk amount and pip value.
| Input | What you use |
| Account risk | Account equity x risk % |
| Stop size | Pips from entry to invalidation |
| Pip value | Depends on pair, quote currency, and lot size |
| Position size | Risk amount / (stop pips x pip value per unit) |
Watch pip value on JPY pairs and on accounts where your deposit currency differs from the quote currency. Your platform often shows pip value, use it. Do not guess.
R-multiples and expectancy, win rate is secondary to payoff
Track results in R. One R equals your initial risk. This keeps your stats clean across changing volatility.
- 1R loss: you hit the initial stop.
- +2R win: you made twice what you risked.
- Expectancy: (win rate x average win in R) minus (loss rate x average loss in R).
Breakouts often have lower win rates because they fail fast. They can still pay if your average winner is larger than your average loser. Channel trades often win more but can cap upside if you always exit at midline. Your job is to keep losses at 1R and let winners reach planned multiples when structure allows.
Avoiding re-drawing bias, keep rules consistent
Redrawing lines to fit price hides bad trades. It makes your stats useless.
- Lock the line once you take the trade. Only adjust if you had a written rule before entry.
- Define what validates a trend line or channel before you trade, for example two clean touches plus a third reaction.
- Use the same candle close rule for breaks, either candle close beyond the line, or an ATR based buffer. Do not switch mid trade.
- Journal screenshots at entry and at exit. This forces honesty and supports discipline. Use these habits alongside your trading discipline routines.
Common risk errors, what to stop doing
- Widening stops: You turn a planned 1R loss into a larger loss. If invalidation hit, exit. Re-enter only on a new setup.
- Chasing breaks: You buy the highest candle of the move and place a wide stop. Use a trigger you can repeat, either break and close, or break then retest.
- Over-leveraging: You stack risk across correlated pairs and call it diversification. Treat highly correlated trades as one idea and cap total open risk.
- Risking more after a win: You increase size because you feel in sync. Keep risk fixed. Let the edge play out over a large sample.
When you manage risk well, you can survive failed breaks and still compound on clean runs. That is the whole game.
Advanced techniques and confluence that improve accuracy
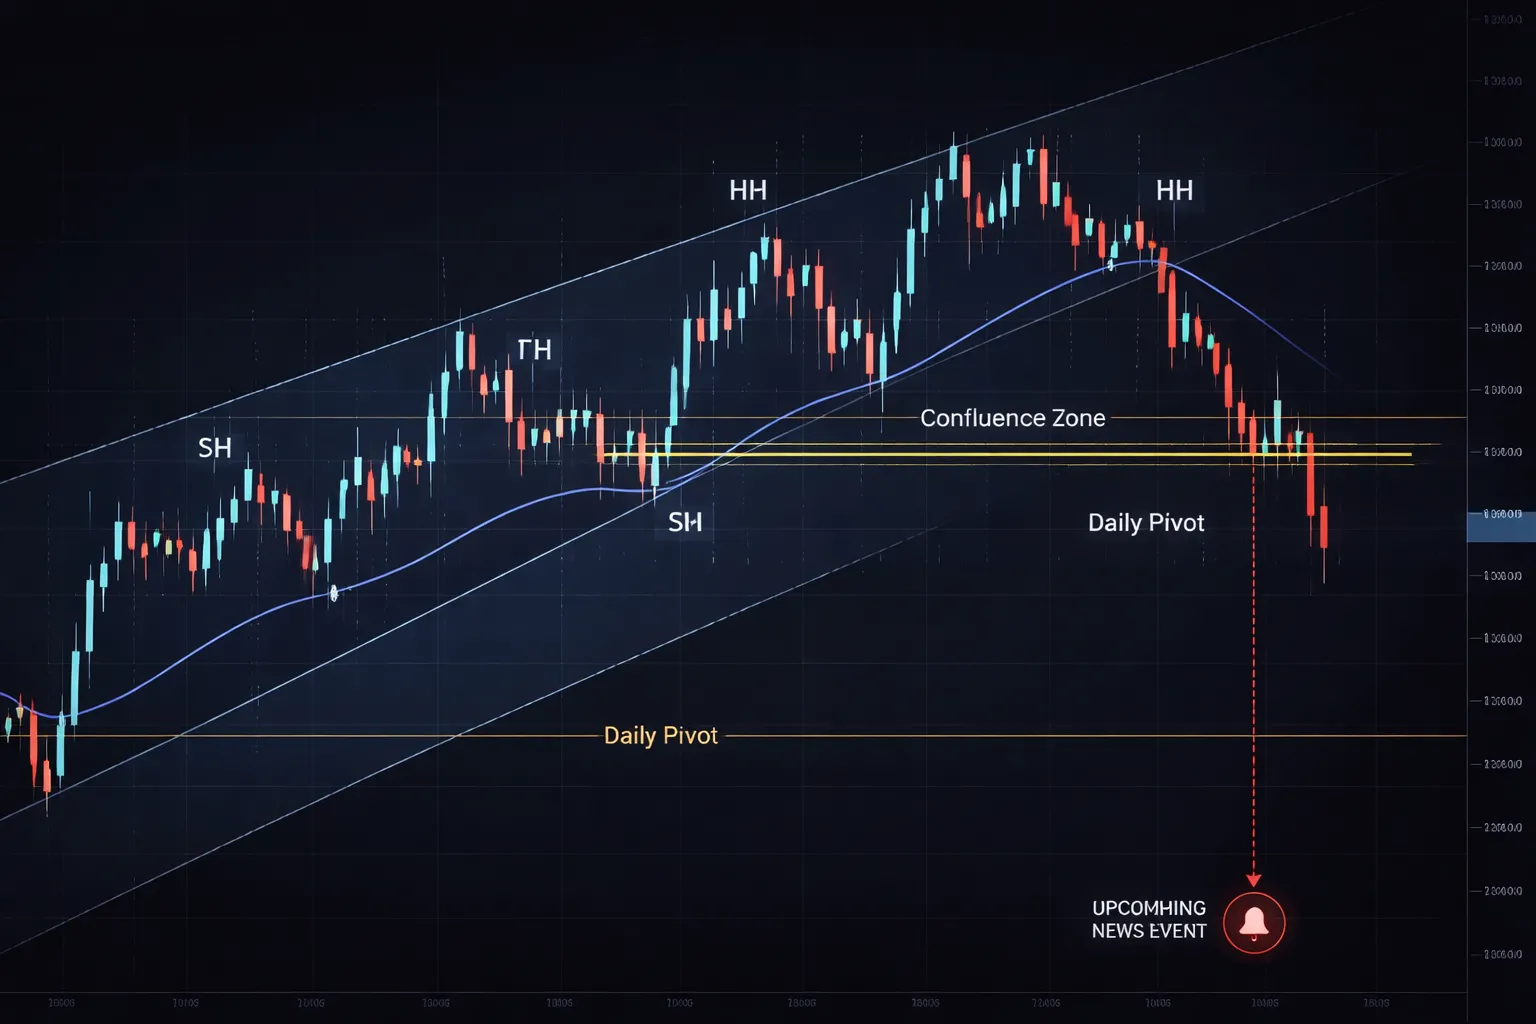
Combine channels with market structure
Your channel tells you slope and containment. Market structure tells you if the trend still exists.
- Uptrend validation: price prints higher highs and higher lows. Your channel break means less if structure still holds.
- Downtrend validation: price prints lower highs and lower lows. A downside break has more weight when the last swing low breaks clean.
- Structure shift trigger: treat the first close beyond the channel as a warning. Treat a break of the last swing low in an uptrend, or last swing high in a downtrend, as confirmation.
- Best break type: break plus retest. You want price to leave the channel, come back to the broken boundary, then reject it.
Fibonacci, pivots, and key highs and lows as validation layers
A channel break improves when it happens at a level that other traders watch.
- Key highs and lows: mark the most recent swing high and swing low on your trading timeframe. If the break also clears one of them, you have a real change in order flow.
- Round numbers: treat 00 and 50 levels as filters. Many false breaks stall there.
- Daily and weekly pivots: use them as decision points. Breaks that occur into a pivot often fade. Breaks that clear a pivot and hold tend to run.
- Fib confluence: measure the prior impulse leg. Watch 38.2, 50, 61.8 retracements. If your retest lands on a Fib level that matches the broken channel line, you get a cleaner location for entries and stops. Use one tool per leg and keep it consistent.
For Fib execution details, see Fibonacci retracement.
Moving averages and VWAP-style concepts for dynamic trend confirmation
Static lines give you structure. Dynamic levels give you trend pressure.
- Pick one or two moving averages: 20 and 50 EMA work for many swing traders. You want consistency, not perfection.
- Trend filter: in an uptrend, price holds above the 20 EMA most of the time and the 50 EMA slopes up. In a downtrend, price holds below and the 50 EMA slopes down.
- Break quality: a channel break has higher odds when price also crosses and holds beyond your key MA on the same timeframe.
- Retest alignment: best retests happen when the broken channel boundary and the MA cluster in the same zone. That compresses your invalidation point.
- VWAP-style anchor: spot the session anchor that matters, often the week open, month open, or the impulse swing that started the channel. If price breaks the channel but stays on the same side of that anchor level, you are often seeing noise. If price flips and holds, the break has more intent.
Momentum confirmation with RSI and MACD divergence
Use momentum tools to filter, not to predict.
- When divergence matters: late trend, stretched channel, multiple touches, and price makes a marginal new extreme while RSI or MACD fails to confirm. This often supports a break and retest that actually follows through.
- When it does not: early trend, strong expansion candles, or a clean structure trend with fresh HH and HL. Divergence can persist while price keeps grinding in the channel.
- How to apply it: require divergence only as an extra check. Do not trade a break just because you see it. Trade it when structure shifts and price accepts outside the channel.
- Simple rule: if momentum diverges but structure stays intact, you reduce size or wait for confirmation. If both align, you can be more aggressive on the retest entry.
Event risk in forex: news can invalidate technical breaks
Forex breaks fail most often around scheduled volatility.
- High impact releases: CPI, jobs data, central bank decisions, press conferences. These can punch through both sides of a channel in minutes.
- Pre-news breaks: treat them as low quality. Liquidity thins and spreads widen. A clean close outside the channel can still reverse fast.
- Post-news rule: wait for the first impulse, then the first pullback. Use the retest of the broken boundary to avoid chasing.
- Stop placement reality: widen stops into news or stay flat. Tight stops near the boundary often die to a spike, then price moves in your direction without you.
- Correlation risk: news hits the USD and you hold several USD pairs, your channel break trades become one macro bet.
Common mistakes when using trend lines and channels in forex (and how to fix them)
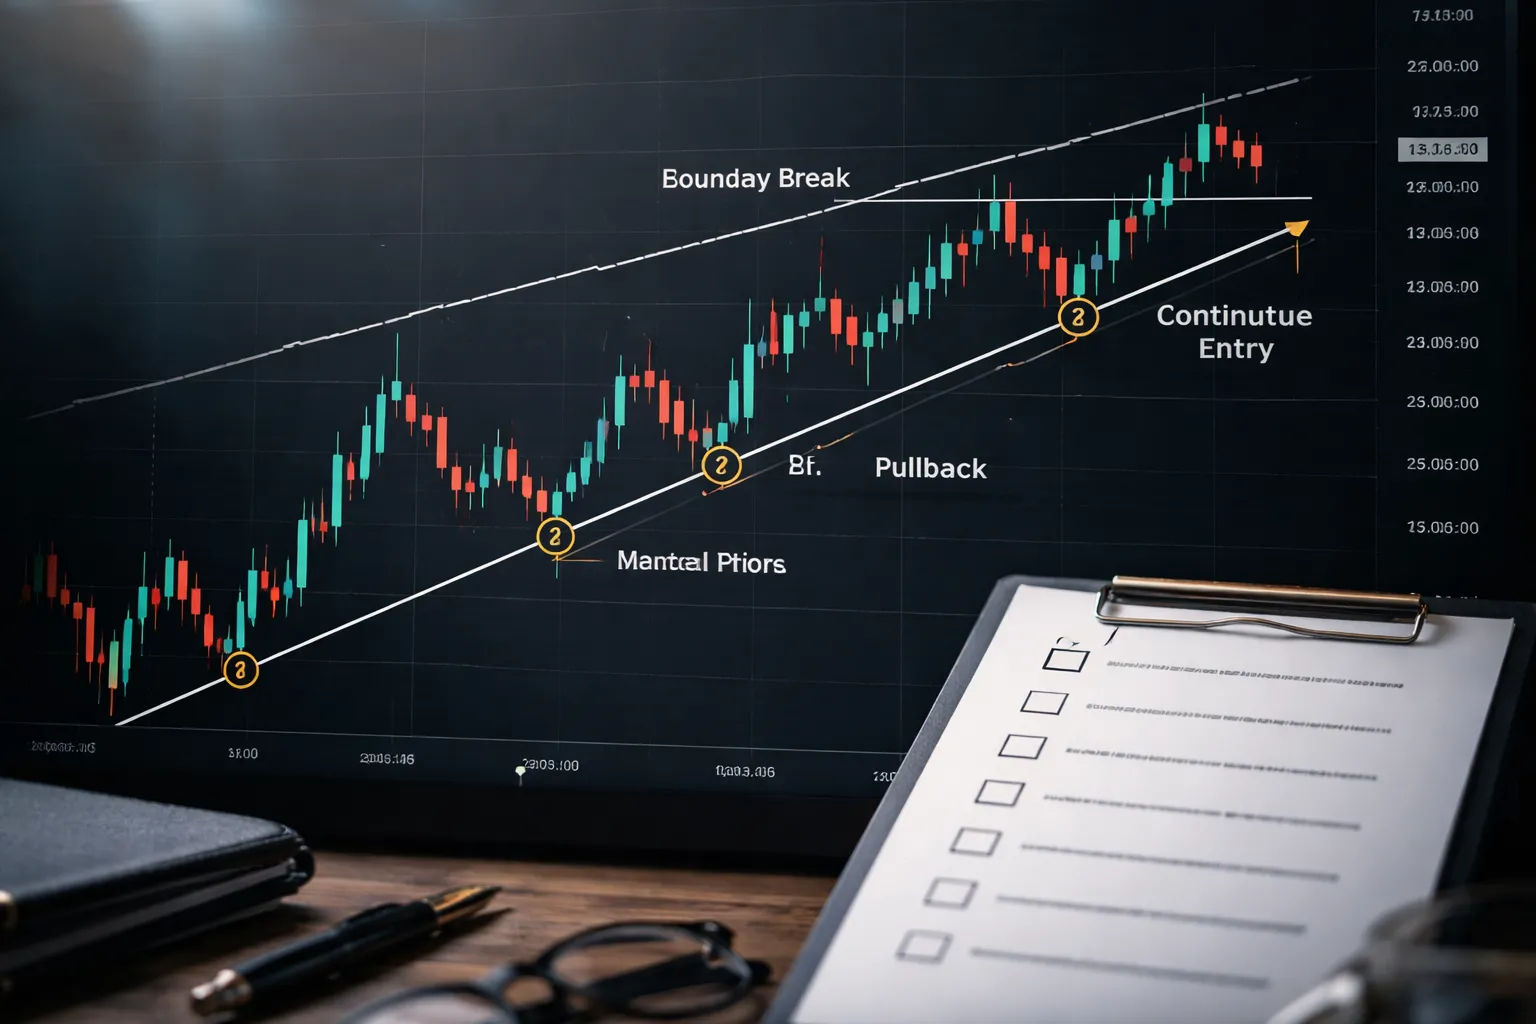
Overfitting lines to price
If your line needs constant edits, you drew an art project. Not tradable structure.
- Mistake: You connect every swing and force the line to “fit.” You end up with a line that explains the past and predicts nothing.
- Fix: Use the smallest number of anchor points. Start with two clean pivots. Add the third touch only as validation.
- Rule: One line, one job. It marks a boundary. It does not trace every wiggle.
- Quality check: If price respects the level with clear reactions and clean swings, keep it. If it cuts through with frequent overlap, delete it.
Ignoring the larger timeframe
Local lines fail when the higher timeframe pushes through them.
- Mistake: You trade a 5 minute channel break into a 4 hour trend line, weekly level, or daily range edge.
- Fix: Draw the higher timeframe boundary first. Then draw the local channel inside it.
- Rule: If your break setup points into higher timeframe support or resistance, reduce size, tighten targets, or skip the trade.
For a step-by-step approach, use multi-timeframe analysis to align trend, entry, and exit.
Treating every touch as a trade signal
A touch is information. It is not an entry.
- Mistake: You buy or sell on first contact. You ignore volatility, session timing, and the strength of the prior impulse.
- Fix: Add context and a trigger. Context comes from trend strength and location. The trigger comes from price action or a break and retest.
- Simple trigger set:
- Break of the boundary with a candle close outside.
- Pullback to the broken line.
- Rejection and continuation.
- Filter: Skip touches that happen right before high impact news. Spreads widen and spikes tag stops.
Using too many channels
More lines do not give you more edge. They give you more excuses.
- Mistake: You stack channels from different swings. You end up with five boundaries and no decision.
- Fix: Keep one primary trend line and one parallel channel line. Add a single horizontal level if it is obvious on the higher timeframe.
- Rule: If a line does not change your entry, stop, or target, remove it.
- Execution benefit: A clean chart makes it easier to wait for the break, then the retest, instead of chasing.
Not tracking outcomes
If you do not measure your results, you repeat the same mistakes.
- Mistake: You remember wins and forget losses. You change rules based on the last trade.
- Fix: Build a screenshot journal. Make it rule-based. Review it weekly.
- Date, pair, session.
- Timeframes used for the line and for the entry.
- Number of touches before the trade.
- Type of setup: touch, break, break and retest.
- Entry type, stop distance in pips, target, risk in R.
- News on the calendar, spread at entry.
- Result in R, screenshot before entry, screenshot at exit.
- Rule check: followed, bent, or broke.
- Review process: Tag each trade by setup. Calculate win rate, average R, and max drawdown per setup. Drop the lowest expectancy pattern. Keep the one you can execute without exceptions.
Practical examples and trade plans you can copy (templates)
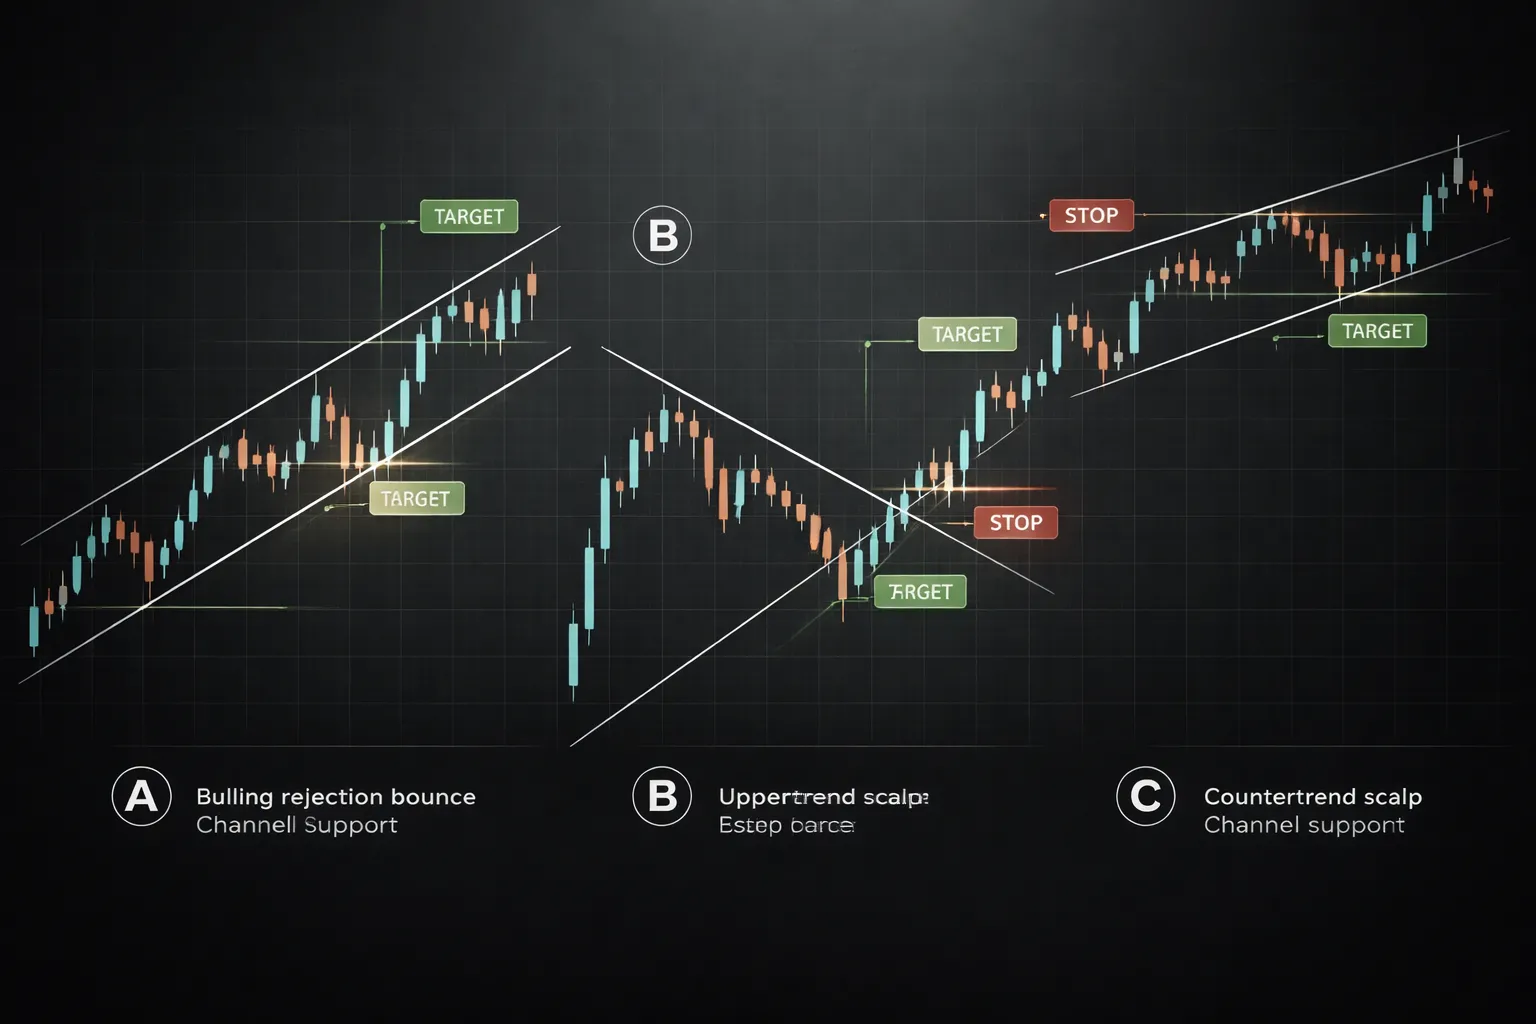
Template A: Trend continuation from channel support with a price-action trigger
Market: Trending market with a clean channel. You trade with the trend. You enter off channel support after a clear trigger candle.
- Timeframes: Draw channel on H4 or D1. Execute on H1 or H4.
- Tools: One trend line (main trend), one parallel line (channel), optional horizontal level at the last swing.
- Minimum structure: 2 touches to draw, 3rd touch to trade.
Entry trigger options (pick one and standardize):
- Rejection candle: Long lower wick at channel support, close back inside the channel.
- Engulfing: Bullish engulfing candle that closes above the prior candle high.
- Break of minor swing: Price taps support, then breaks above the last lower high on your execution timeframe.
Management rules: Move stop to break-even only after price closes beyond 1R, or after a clear higher low forms. Do not move it earlier.
Invalidation: Candle close below channel support on your channel timeframe, or a clean break and hold outside the channel.
Template B: Break-and-retest trade with structured stop and target planning
Market: Range break or channel break. You trade the first clean retest. You avoid chasing the initial spike.
- Timeframes: Identify the break level on H4 or D1. Execute on M15 to H1 depending on spread and volatility.
- Minimum structure: A level or trend line with at least 3 reactions. One clear close beyond it to confirm break.
Break rules:
- Wait for a candle close beyond the line, not just a wick.
- Measure the break candle. If it is 2x your recent average candle size, expect a deeper retest or chop.
- Skip if the break happens into a major higher timeframe level within your planned target distance.
Retest entry options (pick one):
- Limit entry: Place a limit at the broken line, with confirmation from a rejection wick.
- Trigger entry: Wait for retest, then enter on break of the retest candle high or low in the direction of the break.
Management rules: Take partial at 1R only if your data supports it. Otherwise hold to 2R. Trail behind higher lows or lower highs after price closes beyond 2R.
News filter: No entry within 15 minutes of high-impact news on the pair. If you swing trade, no new entries within 60 minutes.
Planning note: Keep your R math consistent. If you need a refresher, read risk-reward ratio basics.
Template C: Countertrend scalp at channel extreme (high risk, strict rules)
Market: Strong channel with repeated touches. You scalp the snap-back to the mean. You accept low win stability if you ignore the rules.
- Timeframes: Draw channel on H1 to H4. Execute on M5 to M15.
- When it works: Trend is slowing, upper wicks stack at resistance, or lower wicks stack at support. Volatility compresses.
- When to avoid: Fresh trend acceleration, news-driven impulse, or first touch of a new channel.
Entry trigger (required): Price hits channel extreme and prints a rejection candle that closes back inside the channel. No close inside, no trade.
Strict rules:
- One attempt per touch. If stopped, you do not re-enter at the same level.
- Max spread rule. Skip if spread is more than 10% of your stop size.
- Time stop. Exit if price does not move at least 0.5R in your favor within 3 to 6 candles.
Checklist: pre-trade validation for trend lines, channels, and breaks
- 1. Clean anchor points: You can mark the swing highs and lows without guessing.
- 2. Touch count: At least 2 touches to draw. Prefer 3+ reactions before you risk money.
- 3. Line quality: Price respects the line with bodies and repeated closes, not random wick stabs.
- 4. Angle check: If the line is too steep, it breaks often. If it is too flat, it is a range. Adjust expectations.
- 5. Space to target: You can map 2R before entry. If structure blocks the move, you pass.
- 6. Spread and session: Spread at entry fits your stop size. Liquidity is normal for your pair and session.
- 7. News risk: Check the calendar. You do not enter near high-impact events.
- 8. Trigger candle: You have your exact trigger. You do not invent one mid-trade.
- 9. Stop placement: Stop sits beyond structure. You add a buffer. You accept the loss size upfront.
- 10. One setup tag: You tag the trade as A, B, or C. If it does not fit, you skip it.
- 11. Screenshot rules: Capture chart before entry and at exit. Keep the same zoom.
- 12. Rule check: Followed, bent, or broke. If you broke it, you do not count it as a valid sample.
FAQ
What makes a trend line valid?
You need two clean swing points to draw it. You need a third touch to trust it. Use wick-to-wick or body-to-body and stay consistent. Skip lines that cut through many candles. One chart, one rule set.
How do you draw a channel?
Draw the main trend line first. Copy it. Slide the copy to the opposite swing extreme. Keep both lines parallel. Use the largest clean touches, not the most recent noise.
Which timeframe works best for trend lines and channels?
Start with H4 or D1 for structure. Refine entries on H1 or M15. Avoid building lines on very low timeframes. Spread and noise distort breaks.
Do you use wicks or candle bodies?
Pick one method and keep it. Wicks capture extremes and suit FX. Bodies filter spikes and suit news-heavy pairs. Do not mix methods on the same line.
How many touches do you need before you trade it?
Two points let you draw. Three touches make it tradable. If the third touch comes from one long spike, treat it as weak. You want repeatable reactions.
What counts as a real breakout?
Price closes beyond the line. The close matters more than the wick. You then wait for a retest and hold, or you trade the first pullback with smaller size. Avoid trading the first spike.
How do you place a stop on a breakout trade?
Put the stop beyond the structure that should not break. For breaks, that is beyond the retest swing. Add a buffer for spread and normal volatility. If the stop size breaks your risk limit, skip the trade.
How do you avoid false breakouts?
Trade breaks that align with higher timeframe direction. Require a close beyond the line. Prefer a retest and rejection. Avoid breaks into nearby support or resistance. Skip pre-news and high-spread sessions.
Do channels work in ranging markets?
They work better as range boundaries than as trend tools. Draw a horizontal range first. Then use a channel only if swings stay parallel. If slope changes every few swings, do not force a channel.
What is the easiest way to backtest trend line breaks?
Use replay mode. Mark the line before the break happens. Log entry, stop, target, and result. Tag the setup type. Keep screenshots at the same zoom. If you want a full routine, use this swing trading approach.
Conclusion
Conclusion
Trend lines and channels work when you draw them from clear swings and keep the rules tight. Use two clean touches to place the line. Wait for a third touch to confirm it. Do not redraw to fit noise.
Trade breaks with a plan. Define the break. Define the retest. Put your stop beyond the structure that should hold. Set targets from the next swing level and the channel width, if you used a channel.
- Draw: Use wick-to-wick for structure. Use close-to-close only if the market respects closes.
- Filter: Skip lines that need frequent edits. Skip channels that do not stay parallel.
- Execute: Prefer break plus retest. Avoid late entries after an extended move.
- Risk: Size small enough to survive a run of failed breaks. Cap risk per trade and keep it fixed.
- Review: Backtest in replay mode. Mark the line before the break. Log the result with the same zoom and screenshots.
Final tip. Track one metric for 50 trades, the follow-through after the break. Measure MFE and MAE from entry to the next structure. If follow-through stays low, tighten your break definition or require the retest. If follow-through stays high, keep the rules and scale with position size, not with looser entries.
If you want an extra confirmation layer, pair the break with momentum on a second signal. Use a simple MACD indicator setup and only take breaks that align with your rules.
-
Stop Loss vs Take Profit: Differences, Examples & Best Practices
7 months ago -
Forex Trading Psychology Tips: How to Stay Disciplined and Consistent
7 months ago -
How to Set Stop Loss and Take Profit (Step-by-Step)
7 months ago -
Forex Order Types Explained: Market vs Limit vs Stop Orders
7 months ago -
Understanding Forex Candlestick Charts (Beginner Guide)
7 months ago
-
- Step 1: pick your market context and timeframe (top-down workflow)
- Step 2: anchor the first two points and project forward
- Step 3: refine with the third touch and reject forced fits
- Step 4: validate with confluence (horizontal levels, MAs, pivots)
- Step 5: maintain a “single-source-of-truth” drawing rule set to stay objective
-
- Classic (parallel) channel construction from a trend line and opposite swing
- The three-touch channel method and why it filters randomness
- Using median lines and centerlines to gauge trend strength
- Standard deviation channels: capturing volatility around the trend
- Regression and Raff-style channels: data-driven alternatives and when to prefer them
-
- Trend continuation entries, buying dips and selling rallies with structure
- Candlestick and price action triggers near the boundaries
- Stop placement logic, beyond structure, beyond the last swing, or ATR-based
- Profit-taking inside the channel, opposite band targets, partials, and trailing
- Managing strong trends, riding the boundary vs waiting for mean reversion
-
- Defining a true break, close criteria, distance, and momentum
- Break-and-retest entries, turning prior support into resistance
- Filtering false breakouts, volatility regime, session timing, nearby liquidity
- Using multi-timeframe confirmation, break on one chart, validate on another
- Measured-move and structure-based targets after the break
-
- What makes a trend line valid?
- How do you draw a channel?
- Which timeframe works best for trend lines and channels?
- Do you use wicks or candle bodies?
- How many touches do you need before you trade it?
- What counts as a real breakout?
- How do you place a stop on a breakout trade?
- How do you avoid false breakouts?
- Do channels work in ranging markets?
- What is the easiest way to backtest trend line breaks?
-
- Step 1: pick your market context and timeframe (top-down workflow)
- Step 2: anchor the first two points and project forward
- Step 3: refine with the third touch and reject forced fits
- Step 4: validate with confluence (horizontal levels, MAs, pivots)
- Step 5: maintain a “single-source-of-truth” drawing rule set to stay objective
-
- Classic (parallel) channel construction from a trend line and opposite swing
- The three-touch channel method and why it filters randomness
- Using median lines and centerlines to gauge trend strength
- Standard deviation channels: capturing volatility around the trend
- Regression and Raff-style channels: data-driven alternatives and when to prefer them
-
- Trend continuation entries, buying dips and selling rallies with structure
- Candlestick and price action triggers near the boundaries
- Stop placement logic, beyond structure, beyond the last swing, or ATR-based
- Profit-taking inside the channel, opposite band targets, partials, and trailing
- Managing strong trends, riding the boundary vs waiting for mean reversion
-
- Defining a true break, close criteria, distance, and momentum
- Break-and-retest entries, turning prior support into resistance
- Filtering false breakouts, volatility regime, session timing, nearby liquidity
- Using multi-timeframe confirmation, break on one chart, validate on another
- Measured-move and structure-based targets after the break
-
- What makes a trend line valid?
- How do you draw a channel?
- Which timeframe works best for trend lines and channels?
- Do you use wicks or candle bodies?
- How many touches do you need before you trade it?
- What counts as a real breakout?
- How do you place a stop on a breakout trade?
- How do you avoid false breakouts?
- Do channels work in ranging markets?
- What is the easiest way to backtest trend line breaks?
-
How to Place a Forex Trade Step by Step (Your First Trade Explained)
5 months ago -
Forex Trading vs Crypto Trading: Which Market Is Better for Beginners?
5 months ago -
Forex Lot Size Calculator: How to Use It to Size Trades Correctly
7 months ago -
How to Calculate Position Size in Forex (Position Sizing Formula + Examples)
7 months ago -
Forex Leverage Explained: How It Works, Pros, Cons & Examples
7 months ago
-
Forex Trading Platforms Comparison: MetaTrader vs cTrader vs TradingView
7 months ago -
Stop Loss vs Take Profit: Differences, Examples & Best Practices
7 months ago -
Is Forex Trading Legal in the United States? Rules, Regulators & What to Know
7 months ago -
Forex Leverage Explained: How It Works, Pros, Cons & Examples
7 months ago -
Forex Market Hours & Trading Sessions Explained (Best Times to Trade)
7 months ago