Swing Trading Forex Strategy for Beginners (Simple, Repeatable Approach)

Swing trading lets you hold forex trades for days to weeks. You aim to capture the middle part of a move, not small intraday noise. You trade fewer setups, on higher timeframes, with clear rules.
In this guide, you will learn a simple, repeatable swing trading forex strategy built for beginners. You will learn which timeframes to use, how to spot the trend, where to enter on pullbacks, where to place stops, and how to set realistic targets. You will also learn basic position sizing so one trade cannot wreck your account.
You will leave with a checklist you can follow and a process you can test. If you need structure before you start, use this forex trading plan template.
Key Takeaways
- In het kort:
- Trade higher timeframes, start with H4 for setups and D1 for trend direction.
- Define the trend first, higher highs and higher lows for longs, lower highs and lower lows for shorts.
- Enter on pullbacks, not on impulse moves. Wait for price to return to a key level before you act.
- Place your stop where your idea fails, beyond the last swing point. Keep it fixed before you enter.
- Set targets with structure, aim for the next swing high or low. Do not guess.
- Use a minimum reward-to-risk of 1.5R to 2R. Skip trades that do not meet it.
- Risk 0.5 to 1.0 percent per trade. Position size comes from stop distance, not from hope.
- Limit open exposure, avoid stacking correlated pairs with the same USD risk.
- Follow one checklist, track results, then adjust one variable at a time.
- Keep your process simple, use a basic moving average strategy only as a trend filter, not as an entry signal.
What swing trading forex is (and why it suits beginners)
What swing trading forex is
Swing trading means you hold a forex trade for more than one session. You aim to capture a clear move inside a trend or a range. You do not try to catch every tick.
You plan the trade on higher timeframes, often the 4-hour and daily charts. You place a stop loss and a take profit, then you let price work. This fits a repeatable checklist.
Typical holding time
- Hold time: 1 to 10 trading days is common.
- Chart focus: 4H for setups, Daily for direction, 1H for cleaner entries if needed.
- Trade count: Fewer trades per week, more selectivity.
Session involvement and screen time
- You do not need to watch every candle.
- You can check charts 1 to 3 times per day, often at the close of a 4H candle, or once per day on the daily close.
- You can use alerts for key levels, then act only when price reaches them.
Realistic expectations
Swing trading rewards process, not intensity. You will have flat periods. You will take losses. Your edge comes from repeating the same setup with controlled risk.
- Expect streaks: losses can cluster, even with a good strategy.
- Expect missed moves: you will skip trades that do not fit your rules.
- Expect slow feedback: results take weeks of trades, not one day.
Focus on clean execution and stable risk. Learn how your stop and target work in real trades. If you need a refresher on risk mechanics, read stop loss vs take profit.
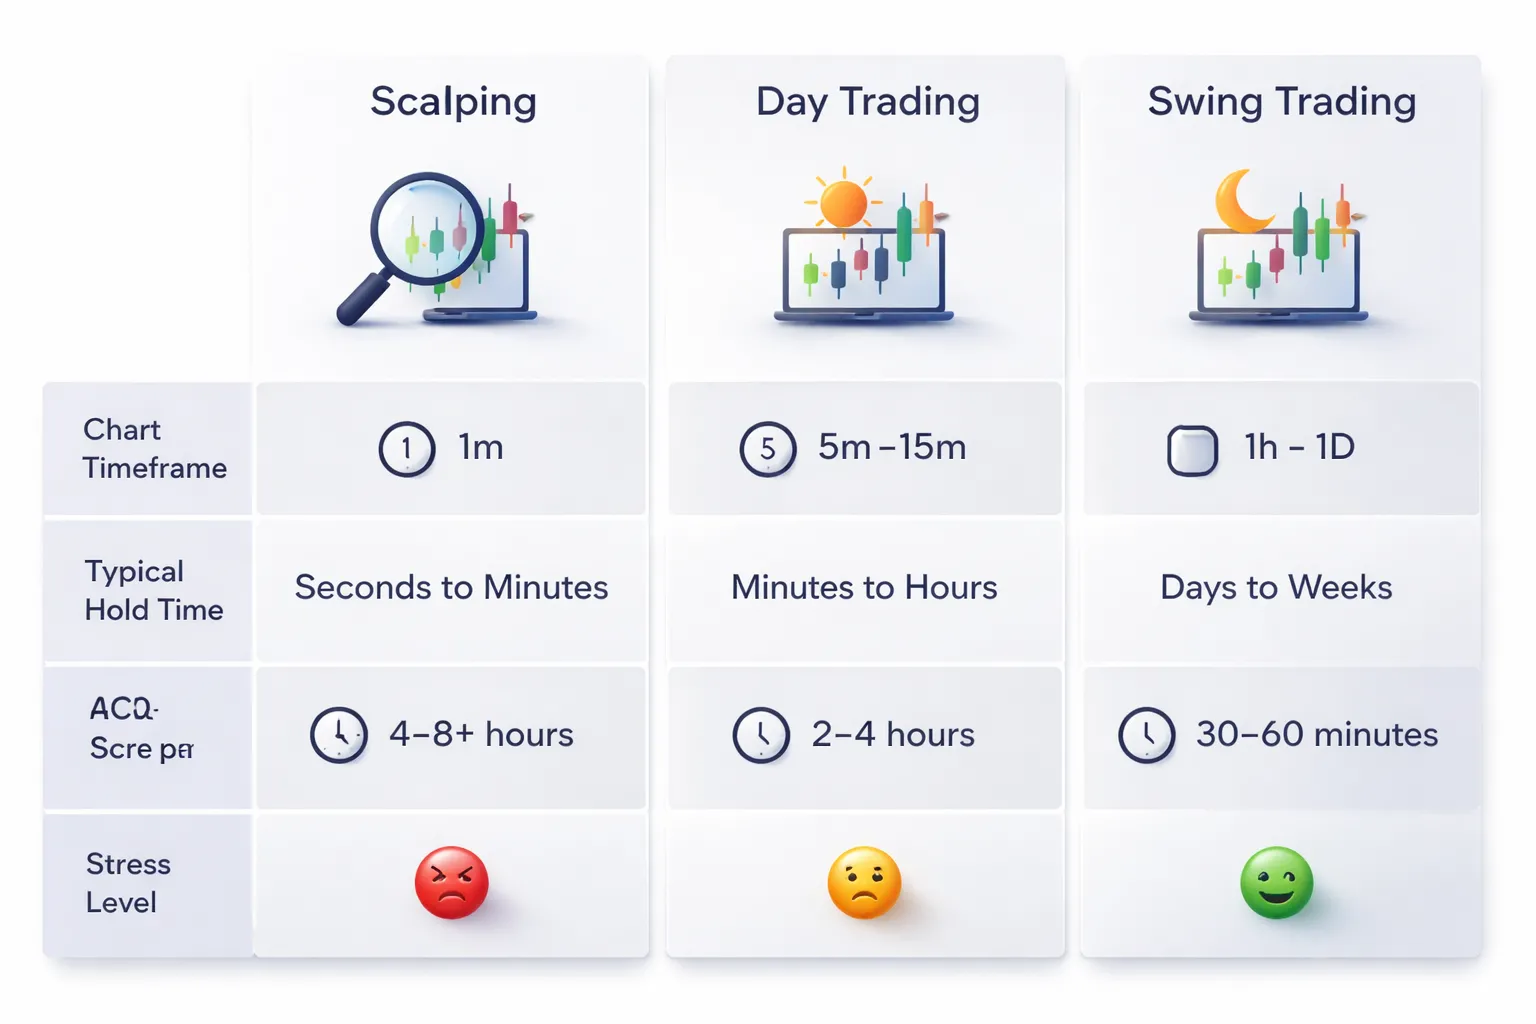
Swing trading vs day trading vs scalping
| Style | Typical timeframe | Hold time | Screen time | Stress level |
|---|---|---|---|---|
| Scalping | 1m to 5m | Seconds to minutes | High, constant | High |
| Day trading | 5m to 1H | Minutes to hours, flat by end of day | Medium to high | Medium to high |
| Swing trading | 4H to Daily | Days to weeks | Low to medium | Lower, but includes overnight risk |
Swing trading suits beginners because it gives you time. You can plan, place orders, and avoid rushed decisions that come from fast charts.
Best personality fit
- Patience: you wait for price to reach your level, then you act.
- Discipline: you follow one checklist and keep risk fixed.
- Comfort with overnight risk: you accept that price can gap or spike during news and session changes.
- Calm decision making: you handle slow trades without forcing new entries.
Common myths beginners should ignore
- More indicators equals better. Extra indicators often repeat the same data and add conflicts. Use one trend filter, then trade price levels.
- You need to trade every day. You get paid for quality setups, not activity.
- Tight stops always mean higher profit. Tight stops often mean more stop outs. Your stop must match the market structure, then your position size must adjust.
- Higher leverage means higher returns. Leverage increases the speed of mistakes. Keep risk per trade small and consistent.
- A perfect win rate is the goal. A solid plan can work with many losses if your winners stay larger than your losers.
Market basics you must understand before using any strategy
Pips, lots, leverage, margin, spreads, and swap
You must know how profits, losses, and costs get measured. If you do not, you will size trades wrong.
Pip means the standard price unit. Most pairs move in 0.0001. JPY pairs move in 0.01. Some brokers show fractional pips. Those are pipettes.
Lot means position size. It controls pip value.
- Standard lot, 100,000 units of the base currency.
- Mini lot, 10,000 units.
- Micro lot, 1,000 units.
Pip value changes by pair and account currency. As a rough reference, on EURUSD a 1.00 standard lot move of 1 pip is about $10. A 0.10 lot is about $1 per pip. A 0.01 lot is about $0.10 per pip.
Spread is the gap between bid and ask. You pay it when you enter. Wider spreads punish swing entries with tight stops. Spreads also widen at rollover and during news.
Leverage lets you control more notional value with less cash. It does not change the market. It changes how fast you can blow up.
Margin is the amount your broker locks to hold a trade. If your equity falls too far, you get margin calls or forced liquidation. This often happens when you stack trades in correlated pairs.
| Term | What it affects | What you should do |
|---|---|---|
| Lots | $ per pip | Set lot size from your stop distance and risk per trade. |
| Spread | Entry cost, stop out risk | Avoid entries during thin liquidity and major news windows. |
| Leverage | Margin used | Use low effective leverage, keep spare margin. |
| Margin | Ability to hold through swings | Plan for drawdown and correlation, do not run near max margin. |
| Swap, rollover | Overnight holding cost or credit | Check swap rates before holding multi day. |
Swap or rollover is the overnight financing adjustment. You pay or receive it each day you hold, usually applied at the broker rollover time. Wednesday often applies triple swap to cover the weekend. Swap can turn a good chart into a slow leak. Check it before you commit to a week long hold.
Forex sessions, liquidity, and when swings tend to form
Forex trades 24 hours, but it does not move the same all day. Liquidity changes by session. Liquidity drives spread and follow through.
- Asian session often brings slower moves in many pairs. Ranges form more often.
- London session brings the highest liquidity for many pairs. Breakouts and trend legs often start here.
- New York session continues the move or reverses it, especially around US data.
- London and New York overlap often produces the strongest moves and the cleanest momentum.
Many swing legs start from a compression phase, then expand when liquidity returns. You often see this after Asia, then London pushes price into a new leg. You do not need to trade every push. You need to recognize when the market has enough participation to sustain one.
Why some pairs trend better and others range more often
Pairs behave differently because their drivers differ.
- Clear trend candidates often include pairs with strong rate differentials, strong macro themes, or persistent risk sentiment flows.
- Range prone pairs often include pairs where central banks actively smooth volatility, or where the economies move in step.
- Crosses can trend hard, but spreads can run wider and moves can turn fast.
You should match your swing approach to the pair.
- If a pair trends well, you can prioritize pullbacks, add on continuation, and hold longer.
- If a pair ranges often, you need clearer levels, faster profit taking, and wider room for false breaks.
Also track correlation. EURUSD and GBPUSD often move together. AUDUSD and NZDUSD often move together. If you take multiple trades in the same direction across correlated pairs, you increase your real risk even if each trade looks small.
How news and economic calendars impact multi-day trades
News changes volatility. Volatility changes stop distance and position size. For swing trading, the calendar matters more than most beginners think.
Events that can reshape a multi day trade include central bank rate decisions, CPI, jobs data, GDP, and major speeches. These can cause spread widening, slippage, and fast reversals. Technical levels can fail in minutes.
Use a simple rule set.
- Check the calendar for your pair’s currencies before you enter.
- Avoid opening new swing positions right before top tier releases if your stop is tight.
- If you already hold a trade, decide before the event. Either reduce size, tighten exposure by taking partial profit, or accept the risk and keep your stop where the structure says it belongs.
- Expect follow through after the first spike. The first move can be a trap. The second move often sets the real direction.
If you trade breakouts, be extra strict around news. Breakouts during thin liquidity or pre news often fail. Use the calendar to filter, then use your chart rules. If you want a structured approach to breakouts, see breakout trading rules.
A simple, repeatable swing trading forex strategy for beginners (trend pullback approach)
Core idea, trade with the higher timeframe trend
You want one job per trade, catch the next leg of an existing trend. You do that by buying pullbacks in an uptrend and selling rallies in a downtrend. You avoid taking trades in the middle of ranges.
This approach stays simple because it uses three steps, bias, setup, entry. Each step has a clear chart and a clear rule.
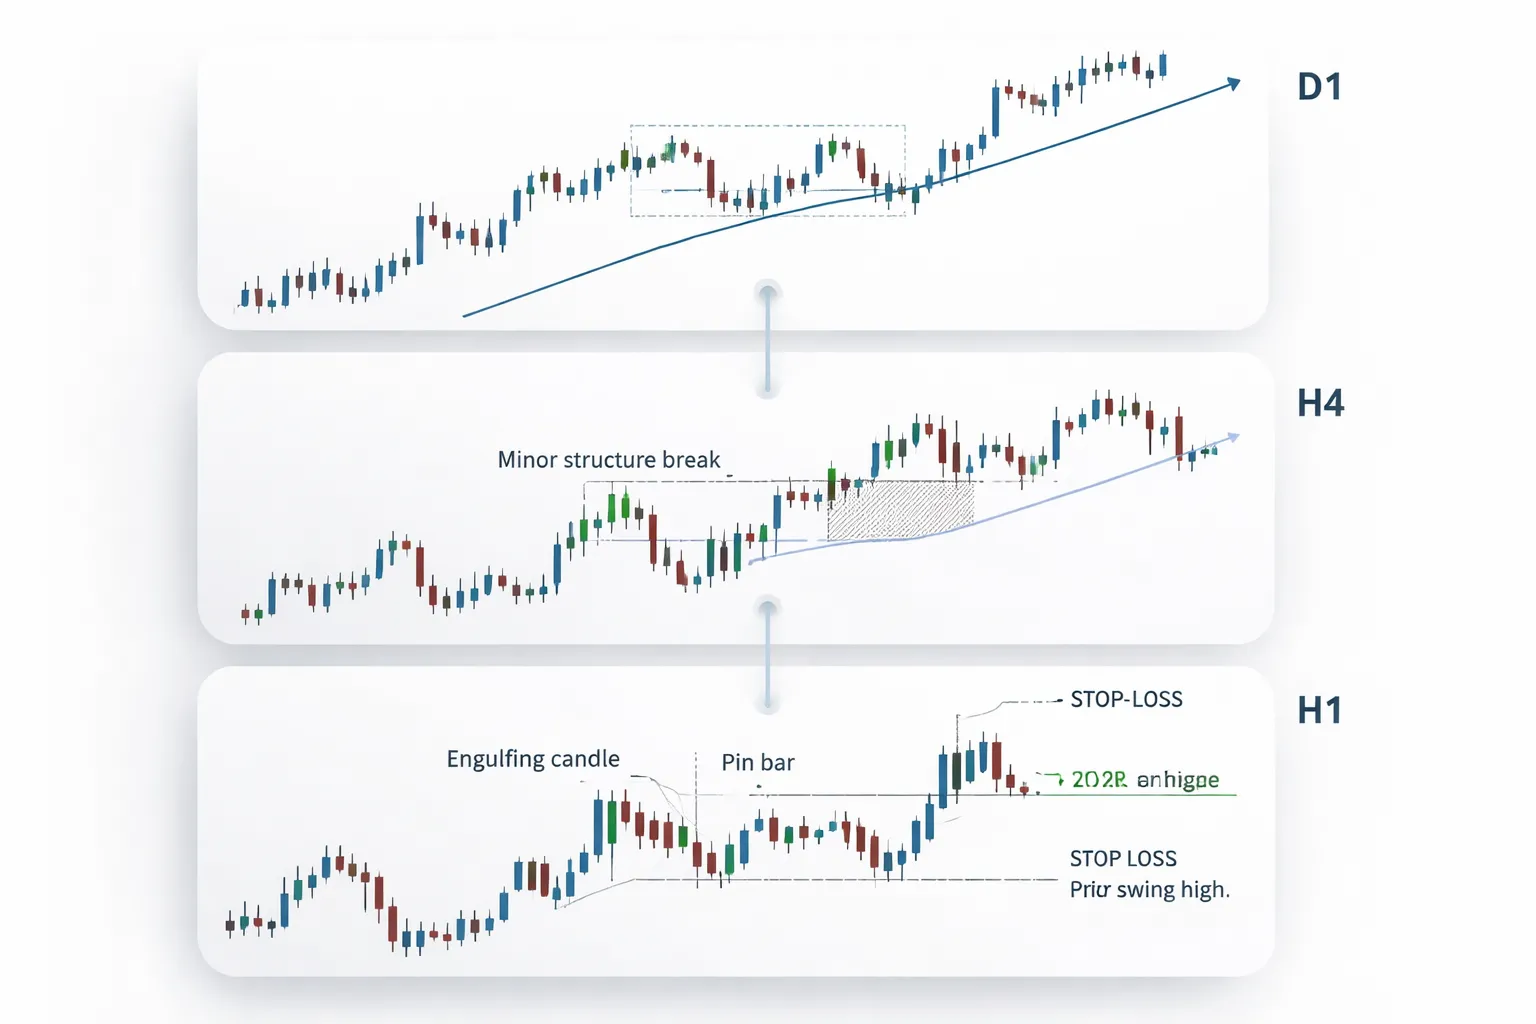
Timeframe stack for beginners
- D1 for bias: Decide if you only look for buys, only sells, or no trade.
- H4 for setup: Wait for price to pull back into a clear area, then stall.
- H1 for entry refinement: Use one trigger candle or a minor structure break to enter with a tight, logical stop.
This stack reduces noise. It also reduces overtrading because you will see fewer valid pullbacks than random signals.
Trend filter options you can apply fast
Pick one filter. Do not mix filters until you have data from at least 50 trades.
- Moving average filter: Use a 50 EMA and 200 EMA on D1. Uptrend if price holds above both and 50 EMA sits above 200 EMA. Downtrend if price holds below both and 50 EMA sits below 200 EMA.
- Market structure filter: Uptrend if D1 prints higher highs and higher lows. Downtrend if D1 prints lower highs and lower lows. If structure breaks, stand aside until it rebuilds.
Setup rules, what a pullback must look like
- Trade only in the D1 trend direction.
- On H4, wait for a pullback of at least 2 to 5 H4 candles. You want a real pause, not one small candle.
- Mark the last H4 swing level in the trend direction. In an uptrend, that is the last swing low that launched a push higher. In a downtrend, that is the last swing high that launched a push lower.
- Your pullback should reach that zone or get close, then slow down. If it slices through with large candles, skip it.
Entry trigger choices on H1
Use one trigger type. The goal is the same, evidence that the pullback ended and price turned back with the trend.
- Bullish or bearish engulfing: In an uptrend, a bullish engulfing candle that closes near its high at the pullback zone. In a downtrend, a bearish engulfing candle that closes near its low.
- Pin bar rejection: Long wick into the pullback zone, small body, close back in the trend direction.
- Break of minor structure: In an uptrend, price breaks above the most recent H1 lower high created during the pullback. In a downtrend, it breaks below the most recent H1 higher low.
Place the trade on candle close. Do not enter mid candle. It cuts false signals.
Stop-loss placement rules
Your stop must sit where your setup becomes invalid, not where it feels comfortable.
- Beyond the swing: For buys, place the stop a few pips beyond the H1 or H4 pullback swing low. For sells, a few pips beyond the pullback swing high. Use this when the swing is clean.
- ATR based buffer: Use ATR(14) on H1. Add 0.5 ATR beyond the swing point. This helps when pairs spike and wick levels before moving.
Risk a fixed percent per trade. Most beginners stay within 0.25 to 1.0 percent. Consistency matters more than size.
Take-profit methods that stay repeatable
- Fixed R-multiple: Target 2R as a default. If your stop is 40 pips, your target is 80 pips. Track your win rate and adjust later.
- Prior swing levels: Target the next H4 swing high in an uptrend, or the next H4 swing low in a downtrend. These levels often act as magnets.
- Partial profits: Take 50 percent off at 1R, move stop to breakeven, then aim the rest at 2R or the prior swing level. This reduces equity swings and keeps you in trend moves.
Rule set summary, checklist to stop overtrading
- D1 trend filter agrees, buys only or sells only.
- No major news in the next 60 minutes for the pair.
- H4 pullback has at least 2 to 5 candles and reaches your marked zone.
- H1 prints one clear trigger, engulfing, pin bar, or minor structure break.
- Stop goes beyond the pullback swing, or beyond swing plus 0.5 ATR(14) on H1.
- Target set before entry, 2R, prior swing, or partial plan.
- Position size set to fixed risk percent. No changes after entry.
- If any item fails, you skip the trade.
If you want to build confidence fast, run this exact checklist on a simulator and log results before you scale up. Use a structured practice routine from this demo and replay guide.
Step-by-step process: from chart scan to order placement
How to build a beginner-friendly watchlist
Keep your list small. You want clean price action, tight spreads, and consistent volume.
- Start with majors: EURUSD, GBPUSD, USDJPY, AUDUSD, USDCAD, USDCHF, NZDUSD.
- Add 2 to 4 liquid crosses: EURJPY, GBPJPY, EURGBP, AUDJPY.
- Avoid at first: exotic pairs, wide-spread pairs, pairs with frequent gaps on your broker.
- Cap the list: 8 to 12 pairs total. Fewer pairs, better execution.
Scan the same pairs every day. Repetition builds pattern recognition and reduces random trades.
Top-down analysis workflow in under 10 minutes per pair
Use a fixed sequence. Same steps, same order, every time.
- Step 1, Daily chart, 60 seconds: mark the last clear swing high and swing low. Note if price sits above, below, or inside that range.
- Step 2, H4 chart, 2 minutes: mark the nearest supply and demand zones. Use bodies plus wicks, then keep zones tight. One to two zones above, one to two below.
- Step 3, H1 chart, 2 minutes: confirm your execution area. Identify the current swing structure. Higher highs and higher lows means bullish. Lower lows and lower highs means bearish.
- Step 4, volatility check, 30 seconds: note ATR(14) on H1. You will use it for stop buffer and trade spacing.
- Step 5, decision, 30 seconds: trade only if you have room to target and a clear invalidation point.
Setting alerts and planning orders (market vs limit vs stop)
Alerts stop you from staring at charts. Orders stop you from hesitating.
- Alert type 1, zone approach: set an alert slightly before price hits your H4 zone. Example, 10 to 20 percent of the zone size in front.
- Alert type 2, structure break: set an alert at the level that confirms your entry trigger, such as a prior H1 swing high for longs or swing low for shorts.
Choose the simplest order type for your setup.
- Market order: use when your trigger needs confirmation, such as a close beyond a level, then you enter on the next candle. You accept some slippage.
- Limit order: use when you want a pullback entry into a zone. You must accept missed trades if price does not retest.
- Stop order: use when you want momentum continuation, such as a breakout above a swing high. You must control risk because breakouts can fail.
Plan your stop and target before you set any order. If you need help with placement rules, use this stop loss guide for beginners.
Example trade walkthrough: bias, zones, and R:R plan
This is a repeatable template. You can run it on any major pair.
- 1, Identify bias on Daily: price breaks and holds above the prior swing high. You set bullish bias. If price sits inside a tight range, you skip until it breaks.
- 2, Mark H4 zones: you draw the nearest demand zone under current price, based on the last strong push up. You also mark the next supply zone above as a likely target area.
- 3, Define your entry trigger on H1: you wait for price to tap the H4 demand zone, then form an H1 higher low. Your trigger is a break above the pullback swing high.
- 4, Plan the order: you place a buy stop a few pips above that H1 swing high. You place the stop below the demand zone, or beyond swing plus 0.5 ATR(14) on H1, based on your checklist rule.
- 5, Set the target: you set take profit at 2R, or just before the next H4 supply zone, whichever comes first.
- 6, Validate R:R: if the next resistance sits too close and you cannot reach at least 2R, you skip.
- 7, Size the position: you set lots so the stop equals your fixed account risk percent. Then you lock it in.
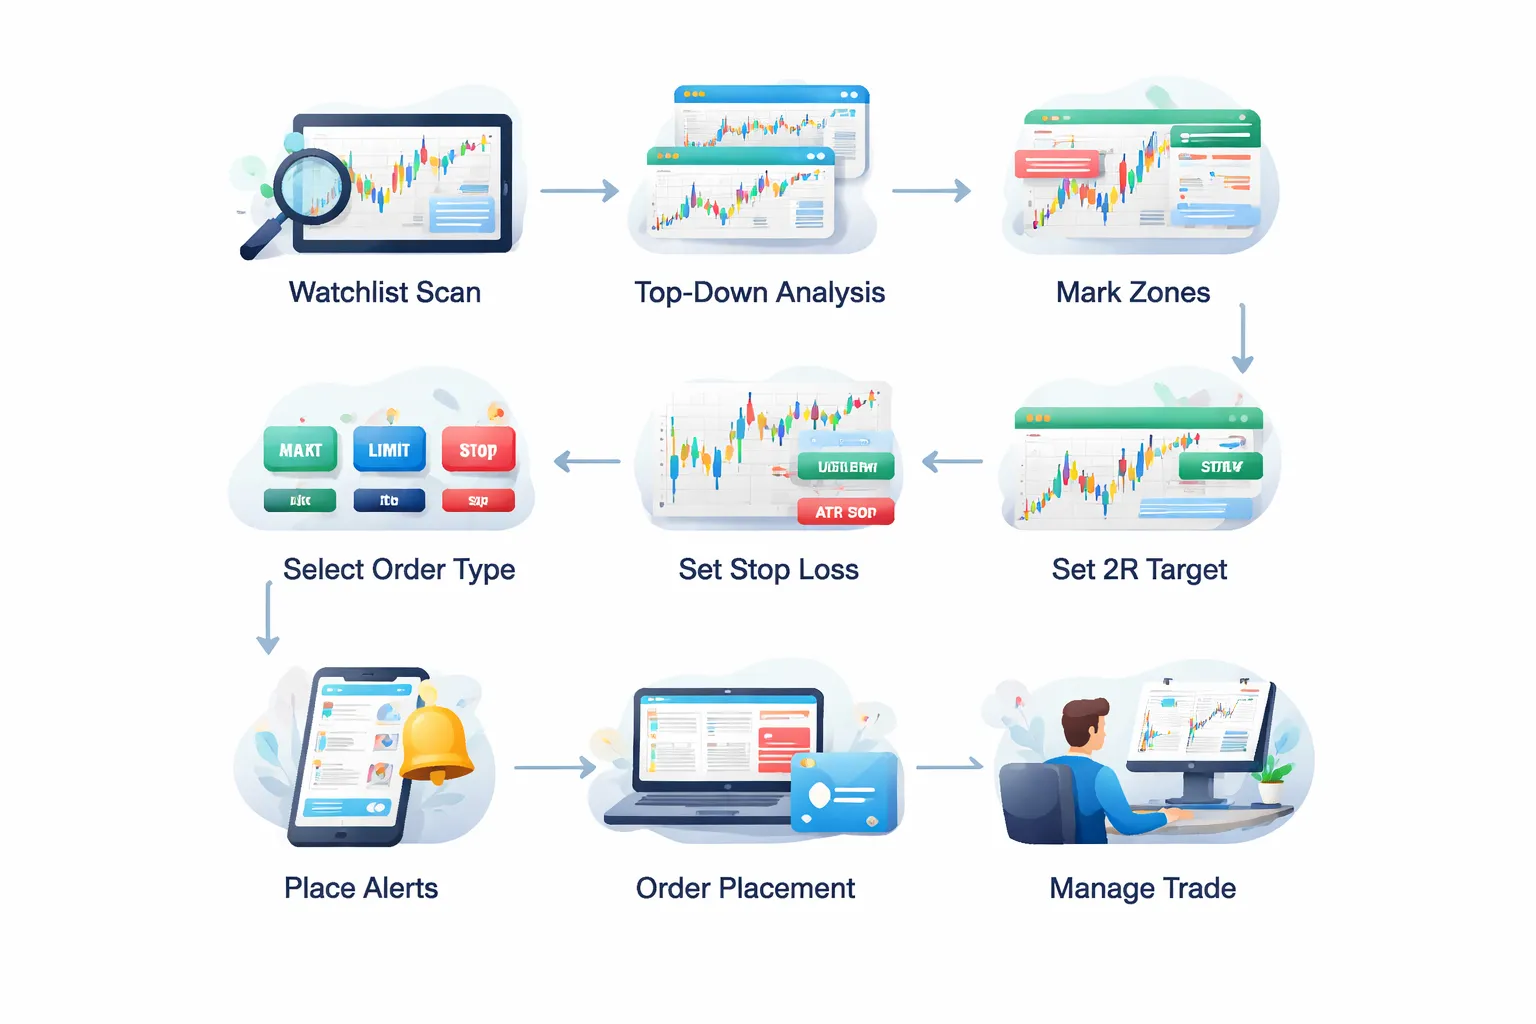
Step-by-step: from chart scan to order placement
- Step 1, run your scan: open your watchlist, check Daily and H4, and flag only pairs near a key zone.
- Step 2, pick the best 1 to 3 charts: choose the cleanest structure and the clearest space to target.
- Step 3, mark levels: draw the zone, the trigger level, the invalidation level, and the first trouble area.
- Step 4, calculate stop distance: use your rule, beyond swing, or beyond swing plus 0.5 ATR(14) on H1.
- Step 5, set the target: 2R, prior swing, or your partial plan, based on your checklist.
- Step 6, check constraints: spreads, upcoming high-impact news, and session timing. If execution looks messy, you skip.
- Step 7, choose order type: market for confirmation, limit for pullback, stop for momentum.
- Step 8, set alerts: one alert for zone touch, one alert for trigger break.
- Step 9, place the order: set entry, stop, and take profit in the ticket. Confirm risk percent. Then place.
- Step 10, log the plan: screenshot, write your bias, entry trigger, stop rule used, target method, and R multiple.
What to do after entry: manage without micromanaging
Your job after entry is simple. Protect the process, not your feelings.
- Do nothing until a decision point: your trade either hits stop, hits target, or reaches your preplanned management level.
- Do not move the stop wider: if the trade needs more room, it was the wrong trade or the wrong size.
- Manage at fixed checkpoints: for example, at 1R you can take partials, move stop to break even, or do nothing, but you pick one rule and stick to it.
- Trail only if your plan says so: trail behind new H1 swing lows in an uptrend, or swing highs in a downtrend. Keep the same buffer rule each time.
- Reduce chart time: check at candle close on your execution timeframe. No mid-candle decisions.
- Exit without debate: if price hits stop or target, you log it and move on. No re-entry unless your checklist resets.
Risk management that keeps beginners alive
Choosing a per-trade risk rule
Start with a fixed risk per trade. Use 0.5% to 1% of your account balance.
Pick one number and keep it. Your strategy needs consistent risk to produce consistent results.
- 0.5% risk gives you more room to learn and survive mistakes.
- 1% risk grows faster, but mistakes hurt more.
- Avoid jumping to 2% to “make it back”. That is how beginners blow up.
Position sizing formula, with a practical example
Your stop loss sets your position size. You do not guess lots first.
Position size formula: Position size (lots) = Risk amount / (Stop distance in pips x Pip value per lot).
Example:
- Account: $5,000
- Risk per trade: 1% = $50
- Stop loss: 40 pips
- Pip value: $10 per pip for 1.00 lot on most USD-quoted majors
Risk per 1.00 lot = 40 pips x $10 = $400.
Position size = $50 / $400 = 0.125 lots.
If your broker uses mini and micro lots, that is 0.12 lots or 0.13 lots, depending on what you can place. Round down if needed.
If your pair has a different pip value, calculate it before you trade. Do not assume.
Risk-to-reward targets and why 1:2 is not always better
Risk-to-reward is a tool, not a trophy.
1:2 means you aim to make 2R when you risk 1R. If you risk $50, you target $100.
But 1:2 fails if your target sits in a level price rarely reaches.
- Use structure first. Put targets near real swing points, supply, demand, and higher timeframe support or resistance.
- If the market’s average swing size does not support 2R, you will force trades and miss exits.
- A clean 1:1.2 taken often can beat a forced 1:2 taken rarely.
Set your target where price has a reason to pause. Then check the R multiple. Log it. Learn what your setup actually delivers.
Drawdown control, max daily and weekly limits
Per-trade risk is not enough. You also need a stop rule for bad streaks.
- Max daily loss: stop trading after -2R in one day.
- Max weekly loss: stop trading after -5R in one week.
- Cool-off rule: after you hit a limit, no new trades until the next session or next week.
This keeps you from revenge trading. It also keeps you from trading when your execution slips.
When you stop, you review only three things. Entry checklist, stop placement, and position size. You do not search for a new indicator.
Correlation risk, avoid stacking the same trade
Many forex pairs move together. If you stack them, you raise risk without noticing.
- If you go long EURUSD and long GBPUSD, you often place two USD-short trades.
- If you go long AUDUSD and long NZDUSD, you often double up on the same theme.
Simple rule: treat highly correlated positions as one risk bucket.
- Cap total risk across correlated trades at 1R to 2R combined.
- If you already have one clean setup open, skip the second unless it adds diversification.
Leverage guidelines, use it as a tool
Leverage does not control your risk. Position size does.
Use leverage only to place the correct position size with a proper stop. Do not use it to trade larger.
- Keep your per-trade risk fixed, even when spreads shrink and fills feel easy.
- Avoid running near your margin limits. Leave room for volatility and spread spikes.
- If you cannot place your planned stop and size without heavy leverage, the trade does not fit your account yet.
Risk management is your real edge at the start. It keeps you in the game long enough for skill to matter.
High-probability filters (optional) that add clarity without complexity
High-probability filters (optional) that add clarity without complexity
Filters should reduce bad trades, not create new rules to break. Use one or two. Keep them consistent. Track results.
Key levels that matter, weekly support and resistance and prior swing points
Start with the weekly chart. Mark the levels where price clearly reversed or stalled multiple times. Then drop to the daily chart and mark the last visible swing high and swing low that shaped the current move.
- Weekly levels: major turning points, multi-week highs and lows, clear consolidation ranges.
- Daily swing points: the last 2 to 4 obvious swing highs and lows. Ignore minor noise.
- Trade selection rule: favor setups that enter near a level and target the next level.
- Avoid: entries in the middle of a clean range with no nearby structure. Your stop and target will feel random.
Keep your chart clean. If you need more than a few lines, you are forcing it.
Confluence with Fibonacci retracements, when to use, when to ignore
Fibonacci works best as a location tool after a strong impulse move. It helps you define where a pullback may end. It does not predict direction.
- Use it when: price trends, then pulls back in steps. You can anchor a clear swing low to swing high, or swing high to swing low.
- Focus levels: 38.2, 50, 61.8. Treat them as zones, not exact prices.
- Best use: align a Fib zone with a weekly or daily swing level. If both point to the same area, you get a cleaner decision point.
- Ignore it when: the market chops, swings overlap, or you cannot pick a clear impulse leg. In chop, you can draw Fib anywhere and it will look “right”.
ATR for realistic stop and target placement in different volatility regimes
ATR tells you how much a pair tends to move per day. Use it to avoid stops that sit inside normal noise.
- Baseline: use the daily ATR(14) as your yardstick.
- Stop check: if your stop is much smaller than the daily ATR, you will get hit often even when you are “right”.
- Volatility regimes: when ATR expands, widen stops and reduce position size. When ATR contracts, stops can tighten, but keep risk fixed.
- Target check: if your target needs more than a few days of average range to reach, expect a slower trade or reduce expectations.
| ATR condition | What it means | What you do |
|---|---|---|
| ATR rising fast | More daily movement, more stop hunts | Wider stop, smaller size, fewer trades |
| ATR stable | Normal conditions | Keep your usual stop logic and targets |
| ATR falling | Compressed movement, slower follow-through | Tighter targets, be patient with entries |
Simple momentum confirmation, RSI zone logic, not overbought and oversold traps
Do not use RSI to fade trends. Use it to confirm direction and avoid weak pullbacks.
- Trend filter: in an uptrend, RSI should spend more time above 50. In a downtrend, RSI should spend more time below 50.
- Continuation logic: uptrend setups work better when RSI pulls back into the 40 to 50 area and turns up. Downtrend setups work better when RSI rallies into 50 to 60 and turns down.
- Weakness signal: if an uptrend cannot hold RSI above 40, treat it as fragile. If a downtrend cannot hold RSI below 60, treat it as fragile.
- Avoid: selling because RSI reads 70, or buying because RSI reads 30. Strong trends can stay there for days.
Trend continuation vs range conditions, how to detect chop early
Most beginner losses come from forcing trend setups inside ranges. You need a simple chop filter.
- Structure test: trends print higher highs and higher lows, or lower highs and lower lows. Chop prints overlapping swings.
- Level test: if price keeps rejecting the same two boundaries, you are in a range. Stop chasing breakouts until you get a clean close outside.
- ATR test: falling ATR plus overlapping swings often means chop. Expect false moves and smaller follow-through.
- RSI test: RSI stuck between 40 and 60 for long stretches signals range behavior.
- Action: trade smaller, take faster targets, or skip until structure clears.
If you want one simple stack, use weekly levels plus ATR. Add RSI only if it helps you say no more often. For risk rules, see risk management in forex for beginners.
Fundamental context for swing traders (without turning into a macro analyst)
Fundamental context for swing traders (without turning into a macro analyst)
You do not need a full macro view to swing trade forex. You need a small, repeatable checklist. Focus on the releases that move interest rate expectations. Track the next one to two events. Size down when uncertainty rises.
Which releases move forex most
- Rate decisions and central bank statements: They reprice the path of future rates. They can shift trends for weeks, not minutes.
- CPI and inflation prints: Inflation drives central bank behavior. A surprise CPI often moves the currency more than GDP.
- Jobs data: For the US, Non-Farm Payrolls and wages matter. For others, the top labor release and wage growth matter. Strong jobs can keep rates higher for longer.
- GDP: Usually second tier. It matters when it changes recession risk or confirms a slowdown that forces rate cuts.
| Release | Why it moves FX | Swing trader focus |
|---|---|---|
| Rate decision | Sets current policy, signals next moves | Direction bias, hold or reduce into it |
| Central bank guidance | Changes expected rate path | Watch wording, dots, press conference tone |
| CPI | Moves inflation expectations and policy odds | Compare actual vs forecast, note core and services |
| Jobs and wages | Supports or breaks the inflation story | Wages, unemployment rate, revisions |
| GDP | Shifts growth outlook | Only react if it changes policy expectations |
Central bank expectations and why rate differentials matter for swings
Forex trends often follow the gap between two countries’ expected rates. Traders call this the rate differential. When one central bank looks tighter than the other, money tends to lean toward that currency. That bias can last across multiple swings.
- What to track: the next central bank meeting date for both currencies, the market expectation for hikes or cuts, and any recent surprise in CPI or jobs.
- How to use it: if the differential widens in favor of your base currency, you can give trend trades more room. If it narrows, take profits faster and reduce add-ons.
- What breaks it: risk-off shocks can overpower rate logic for short periods. Treat those as volatility events, not a new model.
How to trade around news
Big releases can blow through stops. Spreads widen. Slippage rises. You need a rule, not a guess.
- Hold: hold only if your stop sits beyond the normal spike zone. Use ATR and structure. If your stop sits inside one ATR of price, you are exposed.
- Reduce size: cut risk before the event. Keep the trade idea, lower the damage if the first move runs against you.
- Hedge: avoid this as a beginner. It often turns one clean trade into two problems.
- Wait: the simplest option. Let the first reaction print. Trade the next pullback or the breakout retest when spreads normalize.
Keep a fixed rule for your calendar. Example: no new trades within 60 minutes of top tier news for either currency in the pair. For execution control, review forex order types.
Sentiment and positioning basics: COT reports and what they can and can’t do
COT reports show how large trader groups position in futures. Use them for context. Do not use them for timing.
- What COT can do: flag crowded trades, confirm a multi-week bias, warn you when a trend may lose fuel.
- What COT cannot do: predict turning points, give entries, explain intraday spikes. Data comes with a lag.
- Simple use rule: when positioning sits at an extreme and price hits a major weekly level, trade smaller and demand clearer confirmation.
Common beginner mistakes (and how to prevent them)
Moving stops impulsively and turning planned risk into random risk
Your stop-loss defines your risk. If you move it without a rule, you change the strategy mid-trade. You also break your stats. You cannot know if your edge works if every loss becomes a different size.
- Common mistake: You widen the stop to avoid a loss. One small planned loss turns into a large unplanned loss.
- Common mistake: You tighten the stop too early. Normal pullbacks stop you out, then price moves without you.
- Fix: Set the stop at entry based on market structure. Place it beyond the swing high or low that invalidates your idea.
- Fix: Decide your stop management before you enter. Use one rule and repeat it, for example, move stop to breakeven only after price closes beyond your first target level.
- Fix: Use hard stops. Do not manage stops from emotion. If you must adjust, do it at a scheduled time, like after the daily close.
Taking profits too early, handling fear and letting winners work
Beginners cut winners fast and keep losers open. That math fails over time. Swing trading needs a few larger winners to pay for many small losses.
- Common mistake: You take profit because you feel relief after a small move in your favor.
- Common mistake: You close because a single candle pulls back, even though your setup still holds.
- Fix: Define profit-taking rules. Use a minimum reward-to-risk, like 2R, or use the next weekly level as your target.
- Fix: Split exits. Take partial profit at 1R, then trail the rest using a swing low or a moving average you already tested.
- Fix: Track your expectancy in R, not dollars. If your plan targets 2R and you keep taking 0.5R, you remove the edge.
If you need help defining clear levels and invalidation points, review technical analysis basics before you add more tools.
Overtrading after wins or losses, creating a rule-based trade frequency
Overtrading usually comes from two triggers. A win makes you feel skilled. A loss makes you feel behind. Both push you to take lower-quality setups.
- Common mistake: You increase position size after a win. You treat one outcome as proof.
- Common mistake: You revenge trade after a loss. You enter fast to get back to breakeven.
- Fix: Set a hard weekly trade cap, for example, 3 to 5 trades per pair per week. Quality rises when quantity drops.
- Fix: Use a checklist. If one key condition fails, you do not trade.
- Fix: Add a cool-off rule. After two losses in a row, stop trading that pair until the next day or next session.
- Fix: Keep size constant for a sample, like 20 trades. Do not change size based on recent results.
Ignoring swap, rollover, and trading costs on multi-day holds
Swing trades carry costs. Spreads hit you on entry and exit. Swap hits you each day you hold. On some pairs, swap can flip a good setup into a weak trade.
- Common mistake: You hold a position for weeks without checking the daily swap rate.
- Common mistake: You trade exotic pairs with wide spreads and high financing costs, then wonder why performance lags.
- Fix: Check the broker’s swap for long and short before you enter. Treat it as part of your risk.
- Fix: Avoid holding large positions through rollover if swap is strongly negative and your edge is small.
- Fix: Prefer liquid majors for learning. Lower spreads reduce noise in your results.
- Fix: Log costs in your journal. Record spread, commissions, and total swap, then compare your net R.
| Cost | Where it hits | What to do |
|---|---|---|
| Spread | Entry and exit | Trade liquid pairs, avoid trading during low liquidity |
| Commission | Entry and exit | Include it in your R calculations |
| Swap | Daily rollover | Check long and short rates, plan hold time |
| Slippage | Fast moves, news | Use limit orders when possible, reduce size near high-impact events |
Strategy hopping, how long to test before changing anything
When you switch strategies fast, you never learn one. You also mistake normal drawdowns for failure. Most simple swing systems produce losses in clusters.
- Common mistake: You change rules after two or three losses. You keep searching for a system with no losing streaks.
- Common mistake: You add indicators each week. Your chart becomes a new strategy each month.
- Fix: Commit to one setup and one risk model for a defined sample.
- Fix: Backtest at least 100 trades if possible. If you cannot, forward test 30 to 50 trades with small size before you judge anything.
- Fix: Change one variable at a time. Keep a version log so you can compare results.
- Fix: Judge the process. Track rule adherence. A strategy cannot work if you do not execute it the same way.
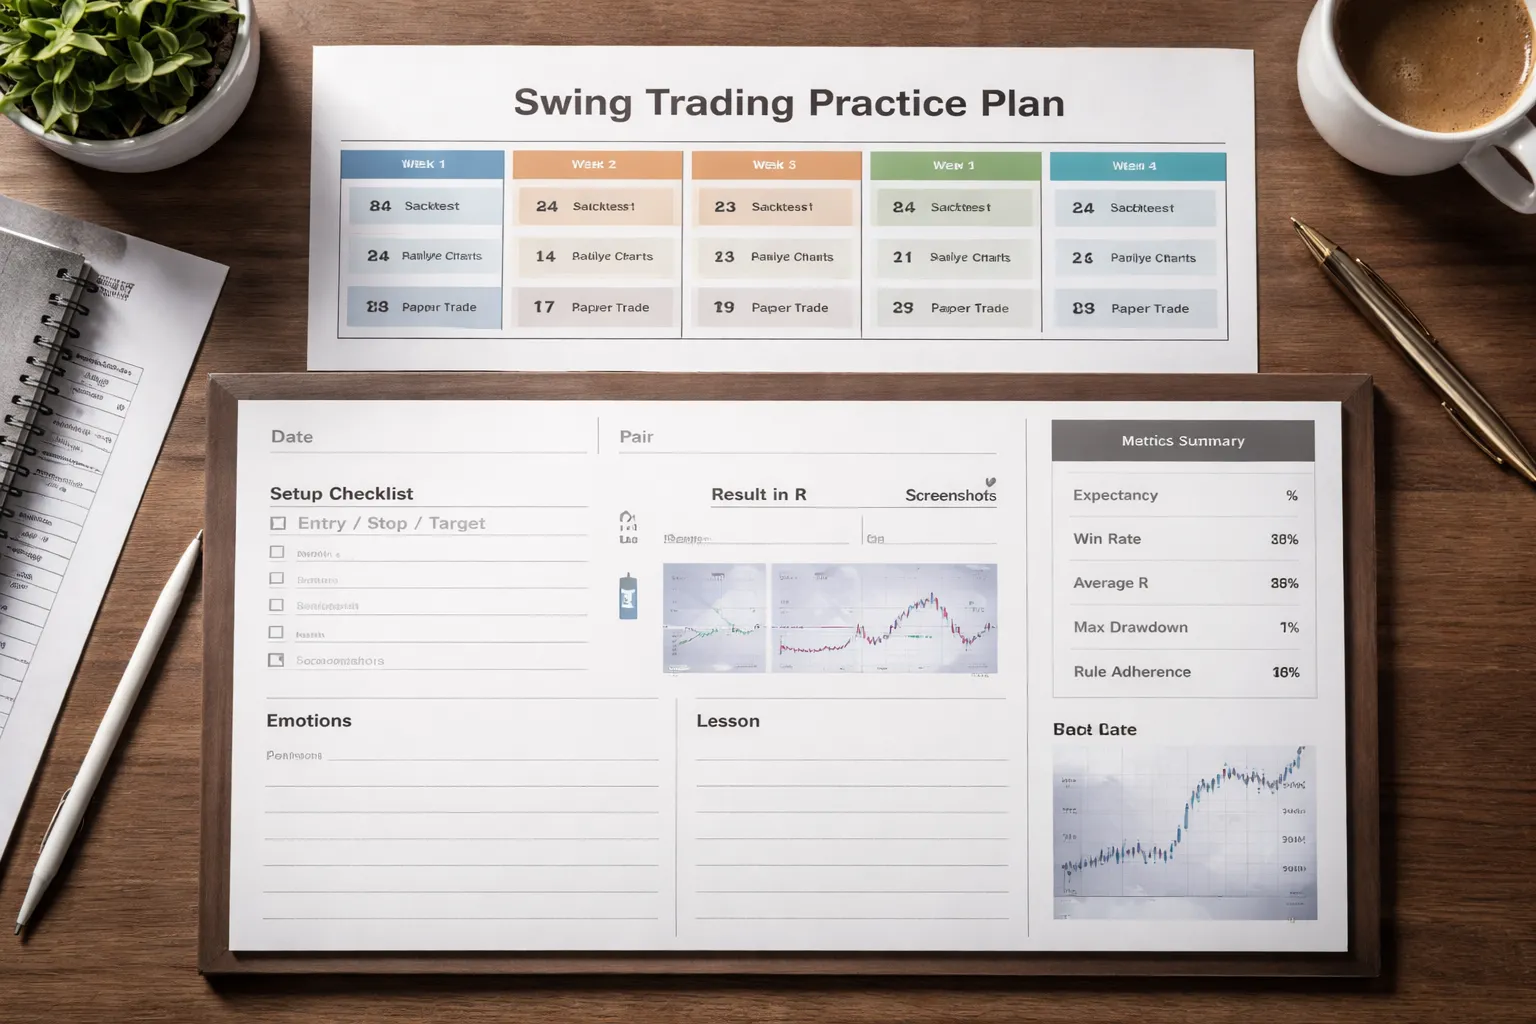
Backtesting, journaling, and a 30-day practice plan
How to backtest manually on TradingView (Bar Replay)
Manual backtesting forces discipline. You see what you would have seen in real time.
- Pick one pair and one timeframe. Start with 4H or Daily. Use the same session and the same candle close rules every time.
- Limit your data. Load enough history for 6 to 24 months. Do not zoom out to the point where candles compress and levels blur.
- Clean your chart. Remove indicators you do not use in the rules. Keep the chart readable.
- Use Bar Replay. Start at an older date. Hit Play. Pause only when your setup conditions appear.
- Mark the setup before price moves. Draw your entry, stop, and target based on your rules. Do this on the signal candle close, not after the next candle prints.
- Record the trade. Log entry price, stop distance, position direction, and the reason it qualifies. Then let price play forward until stop or target hits, or until your exit rule triggers.
- Do not “optimize” mid-run. If you see a rule flaw, note it. Finish the sample. Test changes in a new version.
- Control for spread. Add a small buffer to entries and stops to reflect real fills. Use a fixed assumption per pair so your results stay comparable.
- Stay consistent with levels. If your strategy uses support and resistance, mark them the same way each test. Use one method, not a new method per chart. If you need a refresher, read support and resistance in forex.
Keep your test conditions stable. Same broker feed if possible. Same chart type. Same time zone. Consistency beats precision.
Metrics that matter (and how to calculate them)
Track a few numbers. Ignore the rest.
- R per trade. R equals your risk. If you risk 50 pips and make 100 pips, you made +2R. If you lose, you lost -1R.
- Win rate. Wins divided by total trades. A 40 percent win rate can work if average win is larger than average loss.
- Average R. Mean of all trade outcomes in R. This is your raw edge per trade.
- Expectancy. Expectancy equals (win rate x average win in R) minus (loss rate x average loss in R). Use R values, not dollars.
- Max drawdown in R. The largest peak to trough drop in your running equity curve, measured in R. This tells you what losing streaks can feel like.
- Sample size. Aim for 100 trades. If you cannot, do 30 to 50 forward-tested trades with small size, then decide next steps.
| Metric | Target for a “testable” edge | Red flag |
|---|---|---|
| Expectancy (R) | > 0.20R per trade | Negative after 50 to 100 trades |
| Max drawdown | Within what you can execute through | So large you abandon rules mid-streak |
| Average win vs average loss | Average win > average loss | Wins rely on luck spikes |
| Rule adherence | > 90 percent | Frequent “close enough” entries |
Expectancy tells you if the setup can pay you. Drawdown tells you if you can survive it. Rule adherence tells you if the results are even valid.
Build a trading journal template you will use
Your journal should take less than five minutes per trade. If it takes longer, you will quit.
- Trade ID. Date, pair, timeframe, long or short.
- Screenshot at entry. Mark entry, stop, target. Save the chart with the same zoom each time.
- Setup checklist. List your rules. Use yes or no for each. No “sort of”.
- Numbers. Entry, stop, target, risk in pips, planned R, result in R.
- Execution notes. Did you enter on time. Did you move the stop. Did you take profit early.
- Emotions (one line). Calm, rushed, bored, afraid, overconfident. Keep it short.
- Lesson (one line). One fix for next time. If no fix, write “followed plan”.
- Screenshot at exit. Show the outcome and where you exited.
| Field | What to write |
|---|---|
| Rules met | Yes or no per rule |
| Planned trade | Entry, stop, target, planned R |
| Actual result | R outcome, exit reason |
| Mistake tag | FOMO, late entry, early exit, moved stop |
Review the journal weekly. Sort by mistake tag. Fix the top one mistake first.
A simple 4-week beginner plan (30 days)
Trade one setup. One pair group. One risk model. Build repetition.
- Week 1, rules and reps. Write your rules in checklist form. Backtest 25 trades in Bar Replay. Journal every trade. Do not change rules.
- Week 2, finish the first sample. Backtest another 25 to 50 trades. Start tracking expectancy and max drawdown in R. Mark every rule breach.
- Week 3, demo forward test. Demo trade 10 to 15 signals in real time. Use the same checklist. Place orders only at your defined time, like candle close. Review after each trade.
- Week 4, tighten execution. Demo trade 10 to 15 more signals. Focus on clean entries and exits. End the week with a full review and a version decision.
Review cadence:
- Daily. One minute plan. Five minute post trade log.
- Weekly. Count trades, expectancy, max drawdown, rule adherence. Pick one execution fix.
- Day 30 checkpoint. Decide to repeat the same plan, adjust one variable, or stop trading the setup.
When to go live (minimum criteria and risk ramp-up)
Go live only when your process is stable. Your goal is consistency, not a big month.
- Minimum consistency criteria.
- At least 30 to 50 demo trades on the same rules.
- Expectancy above 0R, with most weeks profitable or close to flat.
- Rule adherence above 90 percent for the last 20 trades.
- You can name your top two mistakes and show they are shrinking.
- Risk ramp-up approach.
- Start live at 0.25R risk relative to your planned full risk. Keep it for 20 trades.
- If you keep rule adherence above 90 percent and drawdown stays inside your test range, increase to 0.50R for the next 20 trades.
- Move to full risk only after another 20 trades with the same discipline.
- If you break rules, cut risk in half for the next 10 trades and rebuild.
Do not scale risk because you feel confident. Scale only after clean execution across a meaningful sample.
Tools and platform setup for beginner swing traders
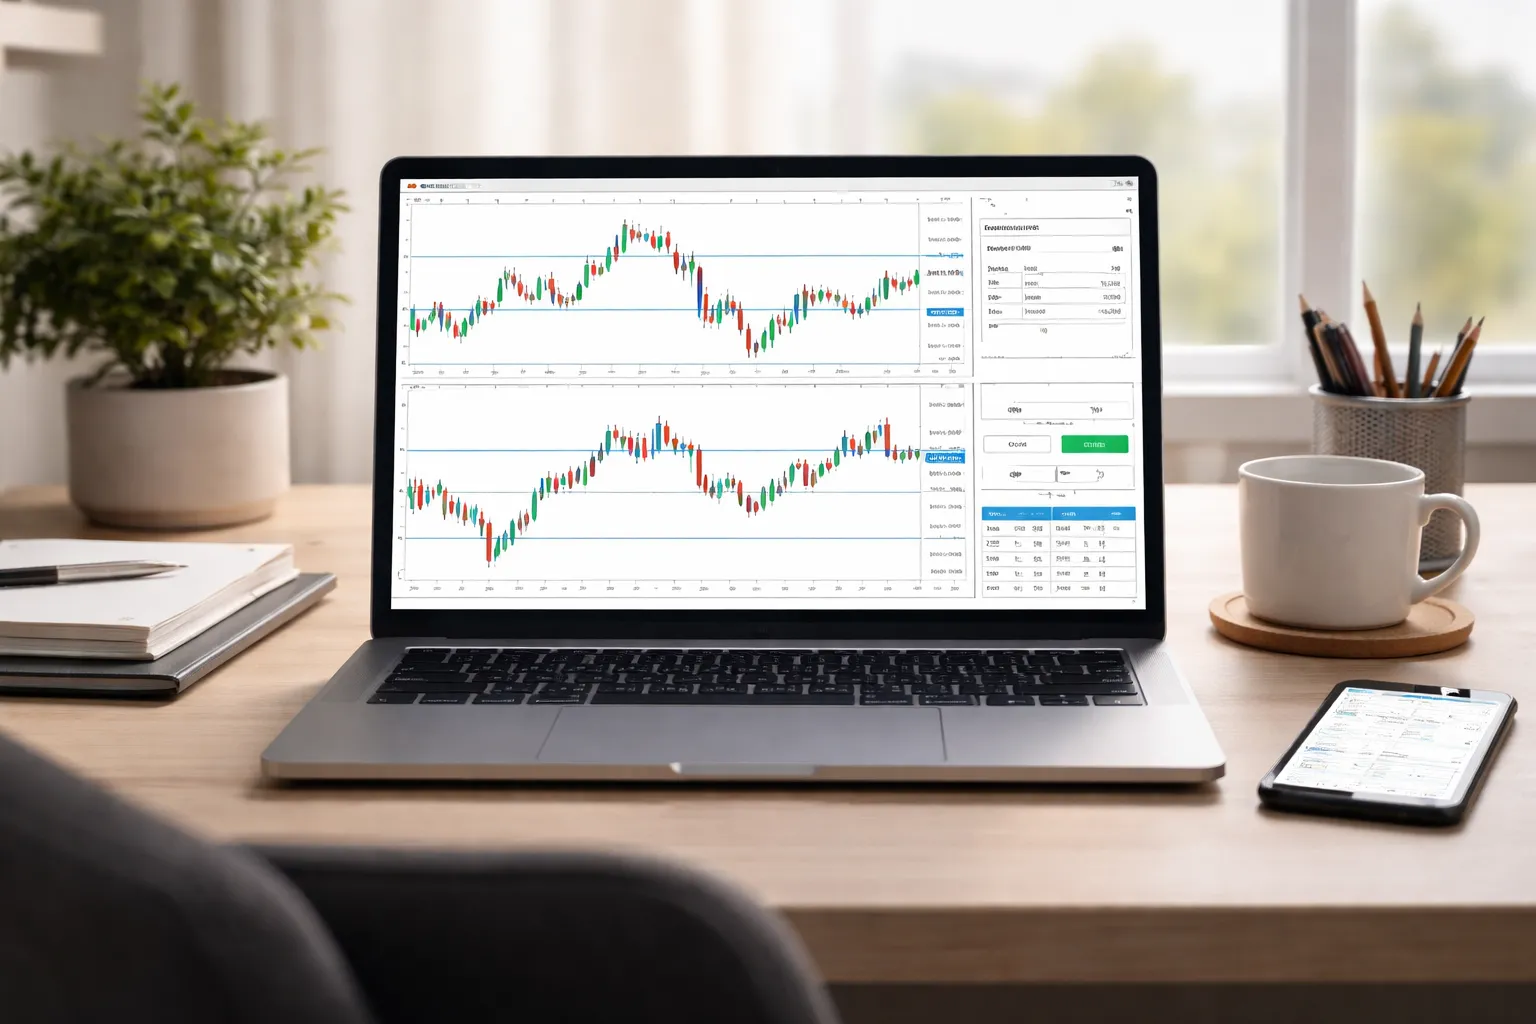
Charting essentials: layouts, templates, and alert systems
Use one clean workspace. Remove distractions. Your chart should show price, your levels, and your risk.
- Timeframes: Use D1 for direction, H4 for setup, H1 for execution. Do not jump lower unless your plan requires it.
- One layout per pair: Same indicators, same colors, same zoom level. Consistency cuts bad decisions.
- Templates: Save a template with your defaults. Example: candles, one moving average if you use it, ATR if you use it, and support and resistance lines.
- Fixed chart routine: Mark weekly highs and lows. Mark the last clear swing high and swing low. Draw one trendline if it adds clarity. Use a step-by-step trendline process from this trendline guide.
- Session filters: For swing trades, you do not need to watch all day. Check charts once or twice daily at the same time.
- Alerts: Set alerts at entry zones, invalidation levels, and first target. Use price alerts, not indicator alerts. Add a note in the alert text with your planned action.
- News overlay: Add an economic calendar and flag high impact events for your pairs. Avoid placing new trades right before major releases if your backtest did not include that risk.
Broker considerations: regulation, spreads, swaps, execution, and negative balance protection
Your broker affects cost and risk. Pick based on rules, not marketing.
- Regulation: Use a broker regulated in a top tier jurisdiction where you live or where your account sits. Verify the license number on the regulator site.
- Spreads: Compare typical spreads during your trading hours, not the minimum spread shown in ads. Track EURUSD, GBPUSD, and one cross you trade.
- Commissions: If you use raw spread accounts, add commissions into your cost check. A tight spread with high commission can cost more than a wider spread.
- Swaps: Swing trading holds overnight. Swaps matter. Check long and short swap rates for each pair. Avoid holding positions with consistently large negative swaps unless your edge covers it.
- Execution: Look for stable fills and low slippage around liquid times. Test with small size first. Keep a log of requested price versus filled price.
- Order handling: Confirm the broker supports stop orders, limit orders, and OCO if available. Confirm minimum stop distance rules so your planned stop can actually be placed.
- Negative balance protection: Prefer it. It reduces tail risk from gaps and extreme volatility.
- Funding and withdrawals: Choose simple rails you trust. Slow withdrawals create forced decisions.
Order types and trade management features that reduce mistakes
Use order types that enforce your rules. Reduce manual clicks.
- Limit orders: Use for pullback entries at a level. You avoid chasing price.
- Stop orders: Use for breakout entries above a level or below a level. You avoid entering early.
- Stop loss attached at entry: Place your stop in the same ticket as your entry. Do not add it later.
- Take profit levels: Preload your first target and final target. If you scale out, define the exact percentages before you place the trade.
- OCO orders: If your platform supports OCO, use it for bracket setups. One side fills, the other cancels. You avoid double exposure.
- Good till canceled: Use GTC for swing entries that may take days. Add an expiry rule in your plan so stale orders do not trigger later.
- Partial close and stop to breakeven buttons: Use platform hotkeys only if you test them. Wrong hotkeys cause expensive mistakes.
- Trade comments: Add a short tag in every order. Example: “H4 pullback, D1 trend, 1R to target1.” It improves review quality.
Risk tools: position size calculators and trade trackers
Automate math. Track execution. You need both.
- Position size calculator: Use a tool that takes account size, risk percent, stop size in pips, and pair. It should output lots and cash risk. Save presets for 0.25R, 0.50R, and full R.
- Stop size input: Enter the stop based on your invalidation level, not based on what gives a bigger position size.
- Cost check: Record spread plus commission in pips for each trade. Add swap if you hold multiple nights. This shows if costs eat your edge.
- Trade tracker: Use a spreadsheet or journal that records date, pair, setup type, timeframe, entry, stop, target, R result, screenshots, and rule adherence.
- Execution metrics: Track percent of trades with a stop placed at entry, percent of trades with alerts set, and percent of trades that followed the planned management rules.
- Review cadence: Review after every 10 trades. Focus on one mistake to eliminate. Do not change the strategy every week.
Pros, cons, and who should choose a different approach
Advantages
- Time efficient. You make decisions on higher timeframes. You can plan trades in one focused session, then manage with alerts.
- Fewer trades. You avoid the constant churn of lower timeframe noise. You get fewer decisions, and fewer chances to break rules.
- Clear structure. You can define a repeatable checklist, trend filter, setup trigger, stop placement, and exit rules. That makes your journal data clean.
- Better signal to noise. Daily and 4H levels tend to matter more than 1 minute swings. Your setups usually look cleaner.
Disadvantages
- Overnight and weekend gaps. Price can gap past your stop. You can lose more than planned in fast markets or after news.
- Patience requirements. Trades can take days. You will watch open profit retrace. You must follow your management rules.
- Swap costs. Holding positions overnight can add cost, or add income. Know your broker swap rates before you scale size.
- News risk stays on your chart. You cannot avoid every data release if you hold for days. Your stop must account for normal volatility.
Best market conditions for this approach
- Trending regimes. Clear higher highs and higher lows, or lower highs and lower lows. Breakouts hold. Pullbacks respect structure.
- Clean ranges with clear edges. You can still swing trade if the range is stable and wide. You must reduce targets and take profits faster.
- Moderate volatility. Enough movement to reach targets, not so much that stops get hit on random spikes.
When to avoid swing trading
- Highly choppy periods. If the daily and 4H charts show overlapping candles and repeated fake breaks, your win rate often drops and your average R shrinks.
- When you cannot hold overnight. If you must be flat each day, you will cut winners early and distort your stats. Choose an intraday plan instead.
- When swap is a deal breaker. If your edge is small and swap is large, your expectancy can flip negative. Test it in your journal.
- When you keep changing rules. If you tweak entries weekly, you will never get stable data. Build discipline first, then optimize. Use a demo routine until execution stays consistent, see how to practice forex trading effectively.
FAQ
What timeframe should you use for swing trading forex?
Use H4 for entries and D1 for context. Check charts once or twice per day. Avoid M1 to M15 if you struggle with speed. Pick one schedule and stick to it for 30 trades before you judge results.
How many currency pairs should you trade as a beginner?
Start with 3 to 6 liquid pairs. EURUSD, GBPUSD, USDJPY, AUDUSD, USDCAD, USDCHF work well. Fewer pairs means fewer signals, but cleaner data and fewer mistakes.
What indicators do you need for this simple approach?
Keep it minimal. Use structure, one trend filter, and one trigger. A 50-period moving average works as a basic trend filter. Price action handles the rest. Too many indicators creates conflicting rules.
How much should you risk per trade?
Risk 0.25% to 1% per trade. Use a fixed percentage. Do not increase size to recover losses. Your edge shows over a sample, not on one setup.
Where should you place your stop loss?
Place the stop beyond the swing high or swing low that invalidates your setup. Then size your position to match your risk limit. Use one rule and apply it every time. See stop loss placement for examples.
What risk to reward ratio should you target?
Start with 1R to 2R as a base plan. If your win rate is low, you need higher R. If your win rate is high, you can use lower R. Track both metrics in your journal.
How long will you hold swing trades?
Most swing trades last 2 to 10 trading days. Some last longer in strong trends. Exit on your target, a stop, or a clear invalidation. Do not hold through major news if you cannot handle gaps.
How do you handle news events and central bank days?
Know the calendar for your pairs. Avoid new entries right before high-impact releases. If you already hold a trade, reduce risk or move to break even only if your rules allow it. Do not improvise mid-trade.
Does swap matter for swing trading?
Yes. Swap can turn a small edge into a losing system. Check the swap rate before you hold overnight. Record swap cost in your journal. If swap is large, switch pairs or shorten holding time.
How do you know if your strategy works?
Track at least 30 to 50 trades with fixed rules. Log entry, stop, target, R result, screenshots, and notes. Review weekly. If you keep changing rules, you cannot trust the data.
What is the most common beginner mistake in swing trading?
Rule switching. You change entries, stops, or targets after a few losses. That prevents stable statistics and builds bad habits. Use a demo routine until execution stays consistent, then scale slowly.
Conclusion
Conclusion
Swing trading works when you keep the process simple and consistent. Trade one setup on higher timeframes. Risk a fixed amount per trade. Place your stop where your setup fails, not where it feels safe.
Your edge comes from repetition and tracking. Use the same entry, stop, and target rules for a full sample. Log every trade with R, screenshots, and notes. Review once per week. Change one variable at a time, only after you see a real pattern in the data.
Final tip. Keep position size constant until you hit two checkpoints, at least 30 trades, and positive expectancy in R. Then increase risk in small steps.
- One setup. One market list. One timeframe.
- One risk rule. Same percent or dollars every trade.
- One review cycle. Weekly, based on your journal.
If your stops feel random, use volatility instead of guesswork. Read the ATR indicator guide and build one stop rule you can repeat.
-
Stop Loss vs Take Profit: Differences, Examples & Best Practices
5 months ago -
Forex Trading Psychology Tips: How to Stay Disciplined and Consistent
5 months ago -
Forex Order Types Explained: Market vs Limit vs Stop Orders
5 months ago -
How to Set Stop Loss and Take Profit (Step-by-Step)
5 months ago -
How to Start Forex Trading Step by Step (Beginner Roadmap)
5 months ago
-
-
- How to build a beginner-friendly watchlist
- Top-down analysis workflow in under 10 minutes per pair
- Setting alerts and planning orders (market vs limit vs stop)
- Example trade walkthrough: bias, zones, and R:R plan
- Step-by-step: from chart scan to order placement
- What to do after entry: manage without micromanaging
-
- High-probability filters (optional) that add clarity without complexity
- Key levels that matter, weekly support and resistance and prior swing points
- Confluence with Fibonacci retracements, when to use, when to ignore
- ATR for realistic stop and target placement in different volatility regimes
- Simple momentum confirmation, RSI zone logic, not overbought and oversold traps
- Trend continuation vs range conditions, how to detect chop early
-
- Moving stops impulsively and turning planned risk into random risk
- Taking profits too early, handling fear and letting winners work
- Overtrading after wins or losses, creating a rule-based trade frequency
- Ignoring swap, rollover, and trading costs on multi-day holds
- Strategy hopping, how long to test before changing anything
-
- What timeframe should you use for swing trading forex?
- How many currency pairs should you trade as a beginner?
- What indicators do you need for this simple approach?
- How much should you risk per trade?
- Where should you place your stop loss?
- What risk to reward ratio should you target?
- How long will you hold swing trades?
- How do you handle news events and central bank days?
- Does swap matter for swing trading?
- How do you know if your strategy works?
- What is the most common beginner mistake in swing trading?
-
-
- How to build a beginner-friendly watchlist
- Top-down analysis workflow in under 10 minutes per pair
- Setting alerts and planning orders (market vs limit vs stop)
- Example trade walkthrough: bias, zones, and R:R plan
- Step-by-step: from chart scan to order placement
- What to do after entry: manage without micromanaging
-
- High-probability filters (optional) that add clarity without complexity
- Key levels that matter, weekly support and resistance and prior swing points
- Confluence with Fibonacci retracements, when to use, when to ignore
- ATR for realistic stop and target placement in different volatility regimes
- Simple momentum confirmation, RSI zone logic, not overbought and oversold traps
- Trend continuation vs range conditions, how to detect chop early
-
- Moving stops impulsively and turning planned risk into random risk
- Taking profits too early, handling fear and letting winners work
- Overtrading after wins or losses, creating a rule-based trade frequency
- Ignoring swap, rollover, and trading costs on multi-day holds
- Strategy hopping, how long to test before changing anything
-
- What timeframe should you use for swing trading forex?
- How many currency pairs should you trade as a beginner?
- What indicators do you need for this simple approach?
- How much should you risk per trade?
- Where should you place your stop loss?
- What risk to reward ratio should you target?
- How long will you hold swing trades?
- How do you handle news events and central bank days?
- Does swap matter for swing trading?
- How do you know if your strategy works?
- What is the most common beginner mistake in swing trading?
-
How to Place a Forex Trade Step by Step (Your First Trade Explained)
3 months ago -
Forex Trading vs Crypto Trading: Which Market Is Better for Beginners?
3 months ago -
Forex Lot Size Calculator: How to Use It to Size Trades Correctly
5 months ago -
How to Calculate Position Size in Forex (Position Sizing Formula + Examples)
5 months ago -
Forex Leverage Explained: How It Works, Pros, Cons & Examples
5 months ago
-
Forex Trading Platforms Comparison: MetaTrader vs cTrader vs TradingView
5 months ago -
Is Forex Trading Legal in the United States? Rules, Regulators & What to Know
5 months ago -
Stop Loss vs Take Profit: Differences, Examples & Best Practices
5 months ago -
Forex Market Hours & Trading Sessions Explained (Best Times to Trade)
5 months ago -
Best Forex Trading Journal Tools (Top Picks Compared)
5 months ago