ATR Indicator for Forex: How to Set Stop Loss Using Volatility

Stops fail when you place them where price noise lives. You need a stop that matches current volatility.
The Average True Range, ATR, measures how far price typically moves per candle. You can use that number to set a stop loss with a fixed buffer, based on data, not guesswork.
In this guide you will learn what ATR tells you in forex, how to choose an ATR period, how to set a stop with an ATR multiple, and how to adjust position size so your risk stays constant when volatility changes. You will also learn when ATR stops work, and when they break, such as during news spikes or low liquidity.
If you trade higher timeframes, you can pair this with a simple swing trading forex strategy for cleaner stop placement.
- In het kort: ATR measures volatility, not direction. You use it to place stops where normal price noise will not hit you.
- Pick one timeframe and one ATR period, then keep them consistent. ATR(14) is a common baseline.
- Set your stop with an ATR multiple. Many traders start around 1.5 to 2.5 ATR, then test what fits your pair and timeframe.
- Place the stop beyond structure first, then check ATR. If structure needs more room than your ATR stop gives, you need a wider stop or no trade.
- Use position sizing to keep risk fixed. When ATR rises, reduce lot size. When ATR falls, you can increase lot size, if your setup stays valid.
- Trail with ATR only if the market trends cleanly. In ranges, tight ATR trails cut winners early.
- ATR stops fail during news spikes and thin liquidity. Spread jumps and slippage can ignore your “perfect” ATR distance.
- Backtest per pair. EURUSD and GBPJPY do not behave the same, even with the same ATR settings.
- Keep your entry rules simple. Use ATR for risk and stop logic, and use price action for the setup. Read the price action trading forex guide if you need a clean entry framework.
What the ATR indicator tells you in Forex (and what it doesn’t)
Volatility in trader terms, the “typical move” per candle
ATR measures how much price tends to move each candle.
It does not measure trend strength. It measures range.
If ATR(14) on H1 reads 0.0012 on EURUSD, that is about 12 pips of typical hourly movement over the last 14 hours.
That number updates every candle. It expands in fast markets and contracts in quiet markets.
Use it as a distance tool. It helps you set stops and targets in line with current conditions, instead of using a fixed pip value.
- Higher ATR, bigger candles, wider stop needed.
- Lower ATR, smaller candles, tighter stop possible.
- ATR changes by pair, session, and timeframe.
ATR is directionless, and that matters for stop placement
ATR has no bullish or bearish bias.
A rising ATR means candles got larger. It does not mean price will go up or down next.
This matters because an ATR stop only answers one question, how much room price usually needs to breathe.
You still choose the side of the stop based on your trade idea.
- Long trade, stop goes below structure, then you check if the distance equals your ATR multiple.
- Short trade, stop goes above structure, then you check if the distance equals your ATR multiple.
If you place stops using ATR alone, you can end up with stops sitting in random locations. You want the stop to make sense on the chart first, then use ATR to size the buffer.
Keep your risk per trade fixed. Let the ATR distance change your position size. If you do not do this, higher ATR periods force you into larger losses. Use the rules in risk management basics to keep that part consistent.
When ATR becomes misleading, gaps, session opens, and low-liquidity spikes
ATR is an average of recent true ranges. One abnormal candle can distort it for the next N periods.
That distortion can push your stop farther than needed, or trick you into thinking volatility is stable when it is not.
- Weekend gaps and reopen gaps: True range includes gap distance. ATR can jump even if the current session trades normally. Your stop distance can get inflated for hours or days on higher timeframes.
- Session opens: London open and New York open often print wide candles. ATR rises fast. If you set stops right after the open, you may overshoot your normal buffer.
- Low-liquidity spikes: Late Friday, rollover, holidays, and thin Asian hours on some pairs can produce sharp wicks. ATR reads that as volatility. The move may not reflect real follow-through, but it still expands your ATR.
- One-off news candles: Even if you avoid trading the release, the spike can lift ATR for the next 14 candles. That changes your stops and position size even when conditions return to normal.
Handle this with simple rules.
- Do not anchor decisions to one ATR print. Check if the last few candles look normal.
- If one candle is extreme, expect ATR to stay elevated until it rolls out of the ATR lookback.
- Compare ATR to recent candle sizes. If they do not match, treat the ATR reading as contaminated.
How ATR is calculated (quick math + practical interpretation)
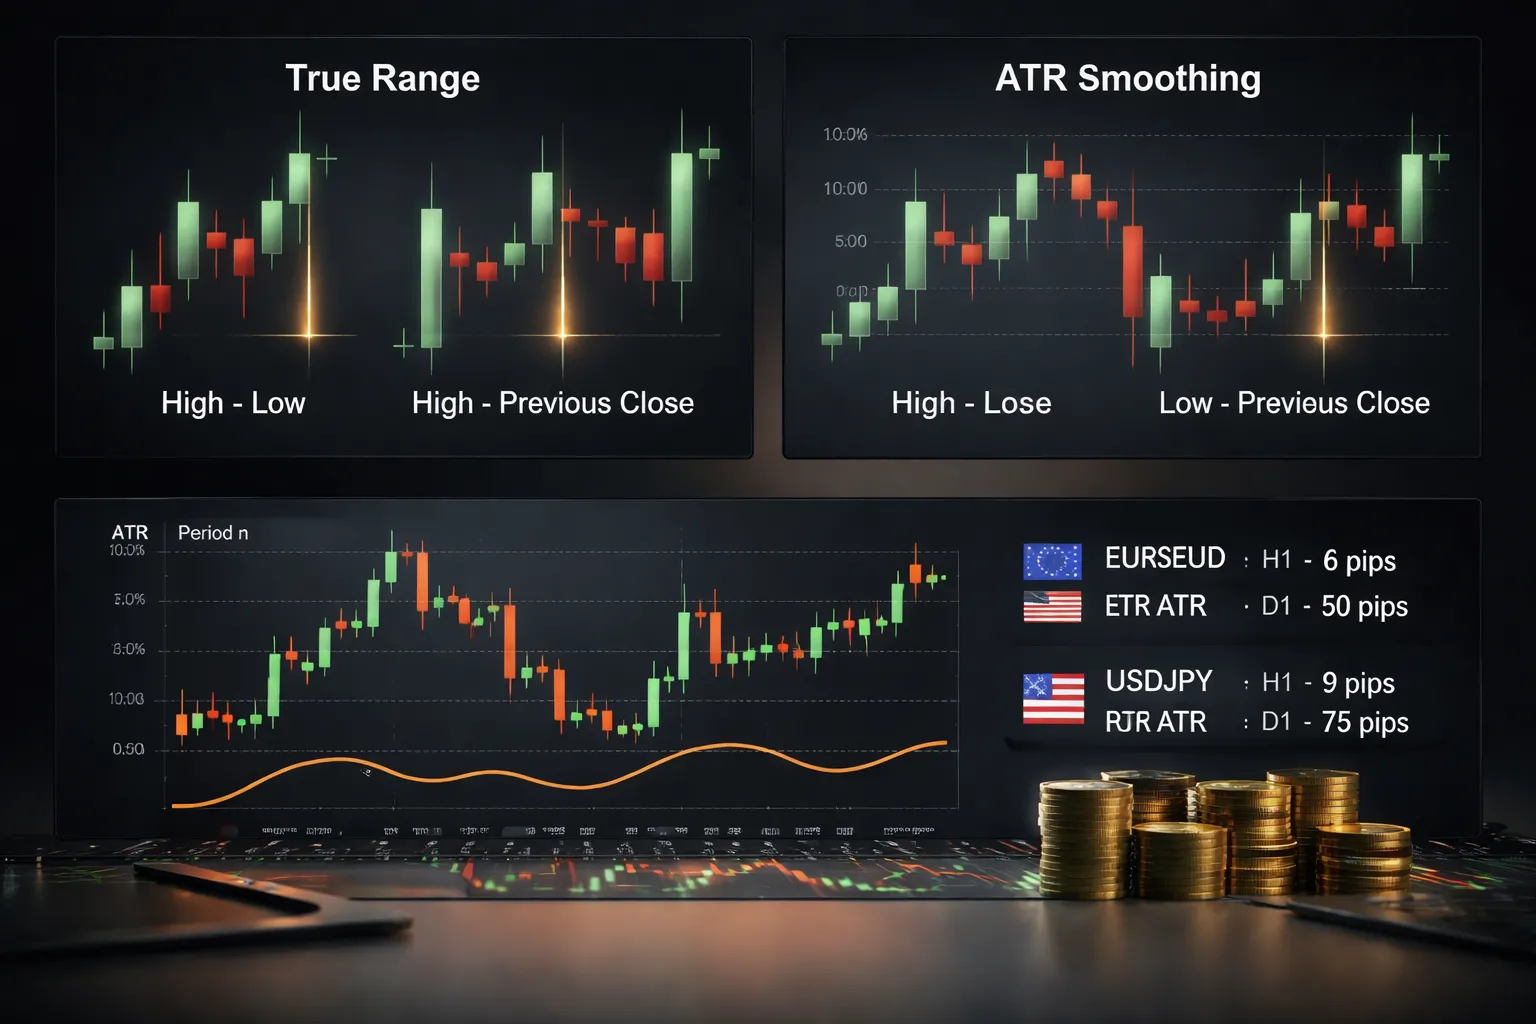
True Range, the 3-part volatility measure
ATR starts with True Range, called TR. TR measures how far price could have moved in one candle, including gaps.
For each candle, calculate these three values, then take the largest.
- High minus Low
- Absolute value of High minus previous Close
- Absolute value of Low minus previous Close
The “previous close” part matters in Forex when the market reopens after the weekend, or when price jumps after news. It stops you from underestimating volatility.
ATR calculation, quick math you can do fast
ATR is the average of TR over a lookback period, often 14.
- First ATR value, simple average. Add the last 14 TR values, then divide by 14.
- Next ATR values, Wilder smoothing. Most platforms use this form.
Wilder smoothing updates ATR like this:
ATR(t) = ((ATR(t-1) x (n-1)) + TR(t)) / n
n is your period, like 14. TR(t) is the current candle’s True Range.
This smoothing makes ATR stable. It also means shocks fade slowly. A single huge candle can affect your ATR for many candles after.
What the period setting changes (14 is not magic)
The period controls how fast ATR reacts.
- Lower period, faster response, more noise. Your stop distance changes more often.
- Higher period, slower response, more stability. Your stop distance adapts late.
If you trade intraday around sessions and news, a shorter ATR can track changes faster. If you trade swings, a longer ATR can reduce stop size whipsaws.
Read ATR in pips, on your current timeframe
ATR outputs price units, not pips. Convert it so you can place stops without guessing.
Example: ATR on EURUSD H1 shows 0.0012. That is about 12 pips. If you use a 1.5x ATR stop, that is about 18 pips.
Match the ATR timeframe to the stop you want. H1 ATR measures H1 volatility. D1 ATR measures daily volatility. Do not mix them unless you do it on purpose.
- If you place a stop based on an H1 structure level, use H1 ATR.
- If you place a stop beyond a daily swing, use D1 ATR.
When you practice this, log the ATR reading, the candle sizes, and your stop distance in a replay routine. Use demo replays to test how different ATR periods behave in calm sessions versus news spikes.
Choosing ATR settings for stop loss placement in Forex
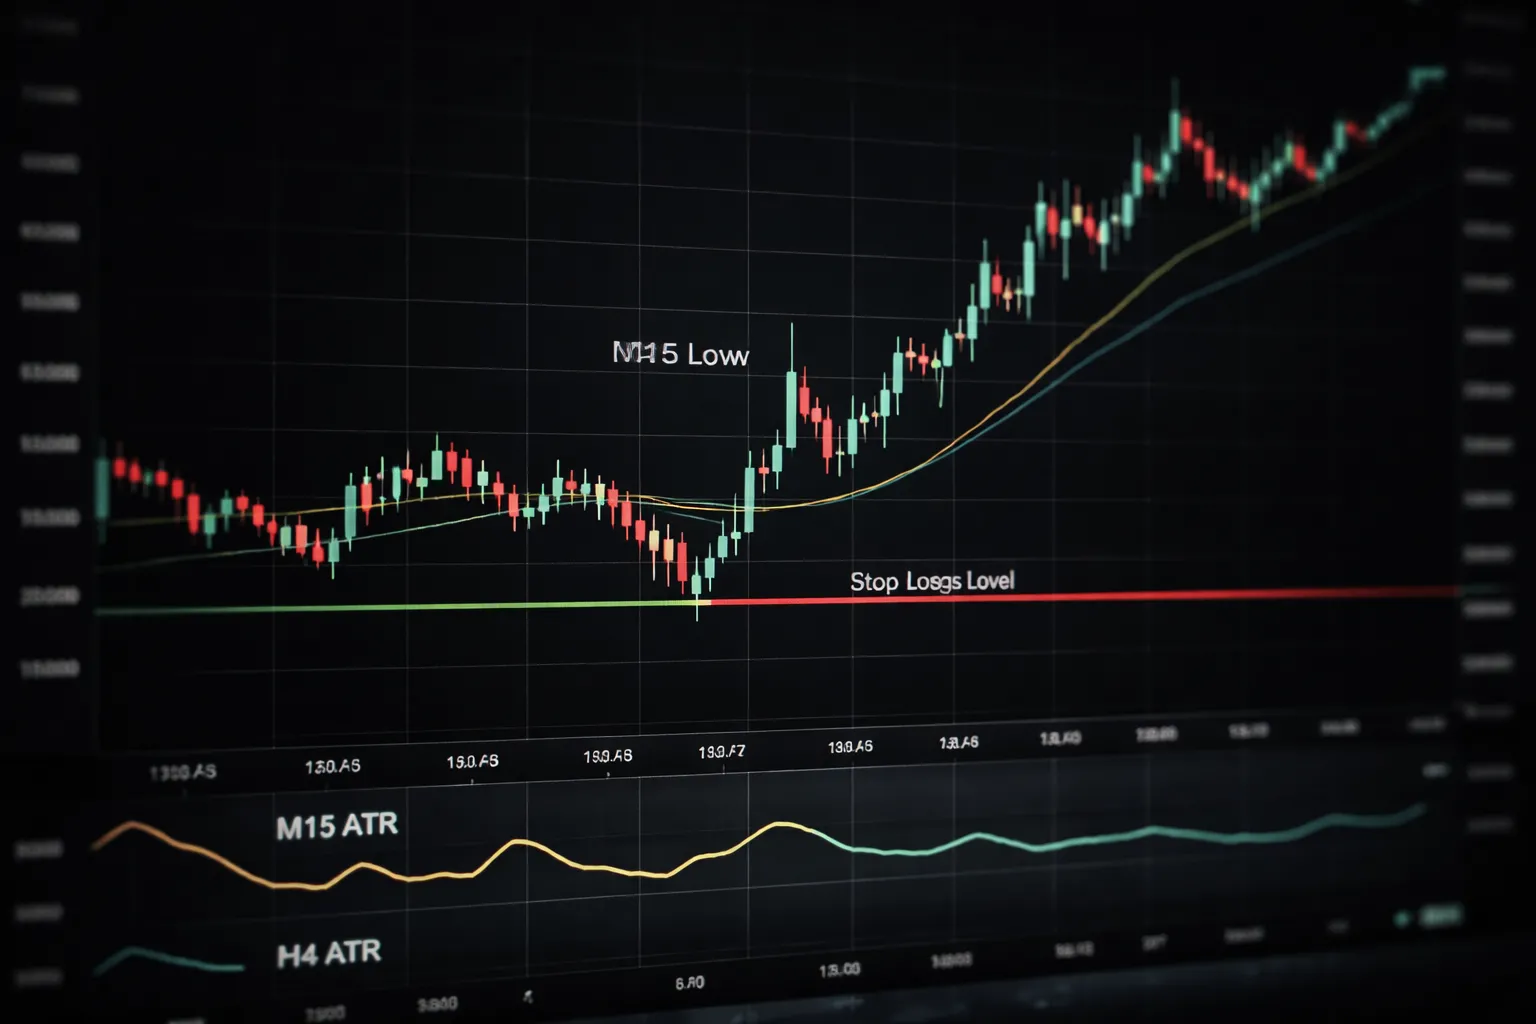
Best starting points by timeframe
Use ATR periods that match how long you hold trades. Short holds need a fast ATR. Long holds need a slower ATR.
- Scalping (M1 to M15 charts), start with ATR(14) on your trading chart. If your stops get hit by normal noise, test ATR(20).
- Day trading (M15 to H1 charts), start with ATR(14) on H1. If ATR swings too hard around session opens, test ATR(21).
- Swing trading (H4 to D1 charts), start with ATR(14) on D1. If you trade wide swings and hold through multiple days, test ATR(20) or ATR(21).
Keep one default per timeframe, then change it only with logged evidence.
ATR period selection, responsiveness vs stability
The ATR period controls how fast your stop distance adapts.
- Short periods (5 to 10), react fast. Stops expand after a spike and shrink fast after calm returns. You get more variance in stop size.
- Medium period (14), balanced. It tracks current conditions without flipping every few candles.
- Long periods (20 to 50), smooth. Stops change slowly. You avoid overreacting to one news candle, but you can lag when volatility regime shifts.
Pick the period based on the problem you see in your journal.
- If you see many small stop-outs during normal candles, your ATR is too reactive or your stop multiple is too small.
- If your stop stays tight right after volatility expands, your ATR is too slow or your stop multiple is too small.
- If your stop gets huge after one spike and stays huge, your ATR is too reactive or your rule needs a volatility filter.
| ATR period | What it does | When it fits stop placement |
|---|---|---|
| 5 to 10 | Tracks the last few candles closely. | Very short holds, stable sessions, tight structure stops. |
| 14 | Mix of speed and smoothing. | Default choice across pairs, solid baseline for testing. |
| 20 to 21 | Smoother, less jumpy around opens and spikes. | Stops beyond H1 or H4 swings, trades held through sessions. |
| 50 | Slow, stable, regime level volatility. | Wide swing stops, position trades, filtering intraday noise. |
Using a higher-timeframe ATR to avoid overreacting to intraday noise
Intraday ATR can inflate on one large candle. That pushes your stop far away or forces you to reduce size. A higher timeframe ATR can stabilize your stop plan.
Use this when you enter on a lower chart but you anchor risk to a higher structure level.
- Entry on M15 or H1, stop beyond an H4 swing, use H4 ATR for the stop distance.
- Entry on H1 or H4, stop beyond a daily swing, use D1 ATR for the stop distance.
Keep the logic consistent. Structure decides the chart. ATR follows the chart.
Then align the stop with the level you trade. Use clean swing points and pattern boundaries, and keep your level work consistent with your charting rules. If you need a refresher, use this guide to chart patterns to mark the same types of swings each time.
Log both ATR readings when you blend timeframes. Track H1 ATR, D1 ATR, final stop distance in pips, and outcome. You will see if the higher timeframe ATR reduces random stop-outs or just makes your trades too wide for your edge.
Core method: ATR indicator for Forex stop loss placement (step-by-step)
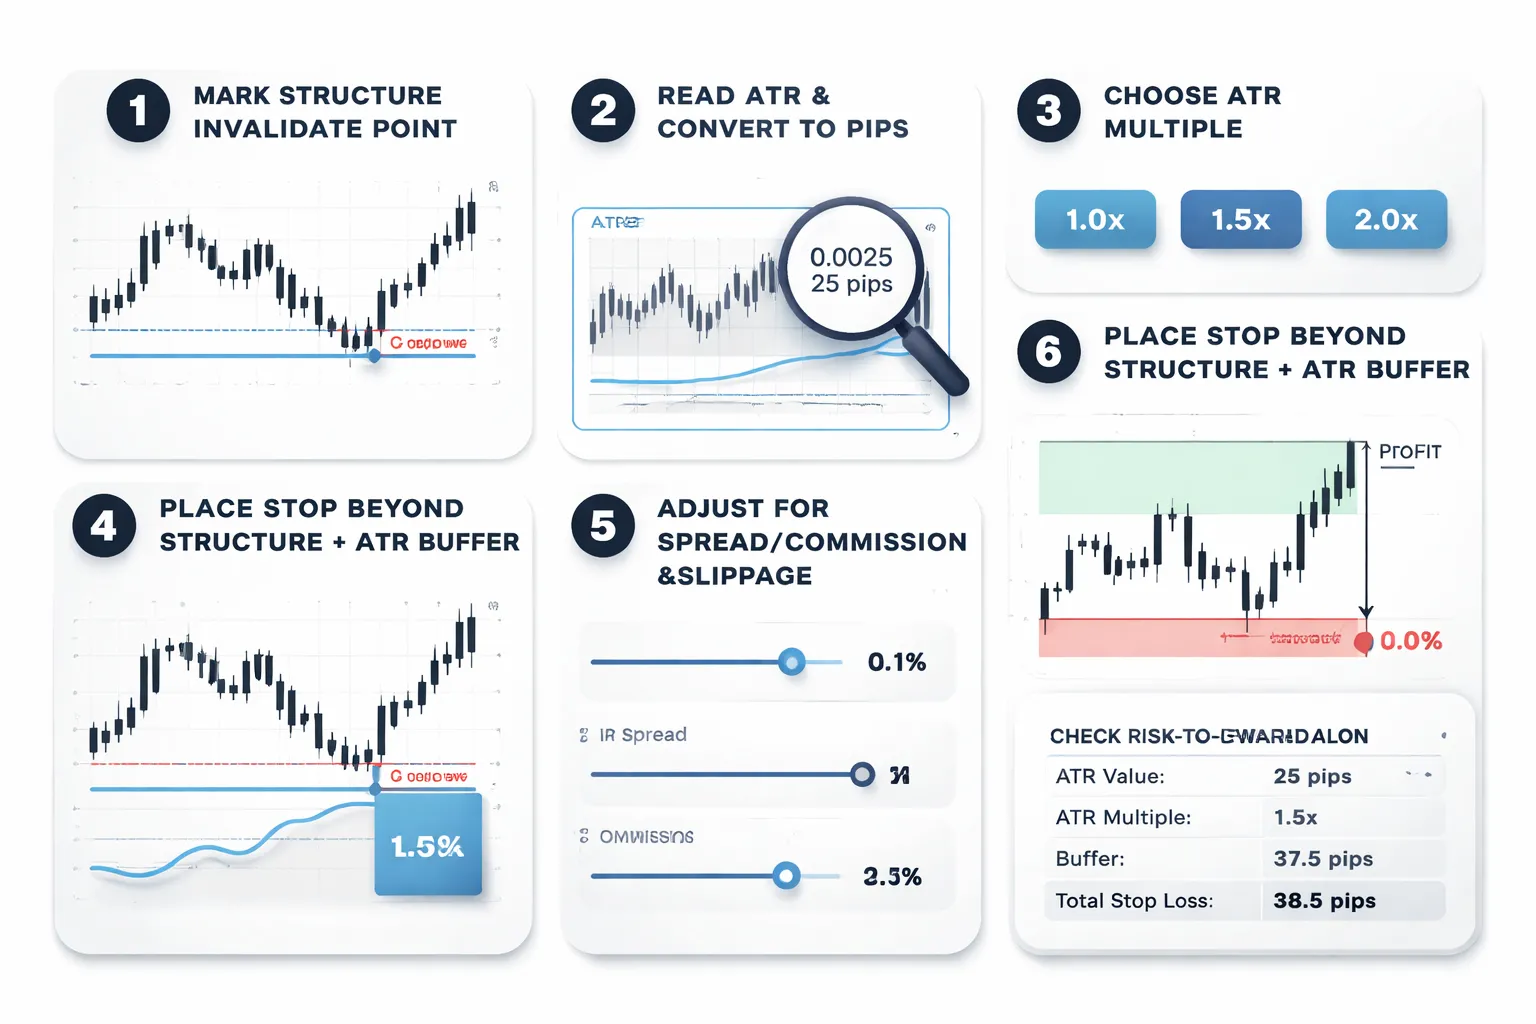
Step 1: Define the trade idea and invalidate point, structure first
Start with price structure, not ATR.
- Mark your entry trigger, the swing you trade from, and the level that proves you wrong.
- Place the invalidate point where your setup fails, not where you feel discomfort.
- Use the same swing rules every time. If you keep changing what counts as a swing, your stops will not mean anything.
- Write it down. Entry, invalidate point, timeframe, and market condition.
If your invalidate point is unclear, fix that first. Use consistent charting rules from your pattern work, then add ATR as a buffer. If you need to rebuild your process, use a trading plan template to lock in rules.
Step 2: Convert ATR to pips and choose an ATR multiple
You need ATR in pips because your stop and risk are in pips.
- Check your ATR setting, most traders use 14 periods.
- Read the ATR value on the same timeframe as your setup, or log both if you blend timeframes.
- Convert ATR to pips.
| Quote format | ATR shown as | Convert to pips | Example |
|---|---|---|---|
| Most pairs, 0.0001 pip | Price units | ATR ÷ 0.0001 | 0.0042 = 42 pips |
| JPY pairs, 0.01 pip | Price units | ATR ÷ 0.01 | 0.62 = 62 pips |
Pick an ATR multiple based on how tight your setup is and how noisy the pair trades.
- 1.0x ATR. Tighter. More stop-outs in choppy flow. Works better when structure is clean and you enter near the invalidate point.
- 1.5x ATR. Middle ground. Often the best starting point for testing because it reduces random hits without exploding risk.
- 2.0x ATR. Wider. Better when volatility spikes or swings are large. It can break your risk to reward if your target does not expand too.
Do not guess. Backtest each multiple on your pair, your session, your setup type.
Step 3: Place the stop beyond structure plus a volatility buffer
Your stop goes where the market must go to prove you wrong, plus room for normal movement.
- Find the structure stop, beyond the swing low for longs, beyond the swing high for shorts.
- Calculate your buffer, ATR in pips multiplied by your chosen multiple.
- Add the buffer past the structure stop.
| Item | Formula |
|---|---|
| ATR buffer (pips) | ATR(pips) × multiple |
| Final stop distance (pips) | Structure stop distance + ATR buffer |
Example workflow in pips.
- Structure stop distance from entry: 18 pips.
- ATR(14) on your timeframe: 20 pips.
- Multiple: 1.5x.
- Buffer: 30 pips.
- Final stop distance: 48 pips.
This keeps structure in charge. ATR just covers normal noise.
Step 4: Confirm stop placement vs spread, commission, and average slippage
Your chart stop is not your real stop. Trading costs widen it.
- Check the average spread for the hours you trade, not the best case.
- Add commission in pip terms if your platform does not include it in spread.
- Estimate slippage from your journal, especially around news and session opens.
Use a simple cost buffer.
- Effective stop distance = final stop distance + spread + slippage.
If your stop sits inside a common spread spike zone, you will get clipped on normal ticks. Either widen the stop or skip the trade.
Step 5: Validate risk-to-reward and decide whether to take or skip the trade
ATR stops can push your risk up. Your trade must still make sense.
- Calculate risk in pips using your effective stop distance.
- Set a target based on structure, not hope.
- Compute risk-to-reward from entry to target.
| Check | Rule |
|---|---|
| Stop size vs setup | If ATR makes the stop too wide to fit the pattern, skip. |
| R to R | If your minimum R to R is not met, skip. |
| Position size | If the required stop forces a position too small to matter or too large for your limits, skip. |
Your rule is simple. If structure plus volatility makes the trade unattractive, you pass. You do not force it.
ATR stop loss formulas and examples you can copy
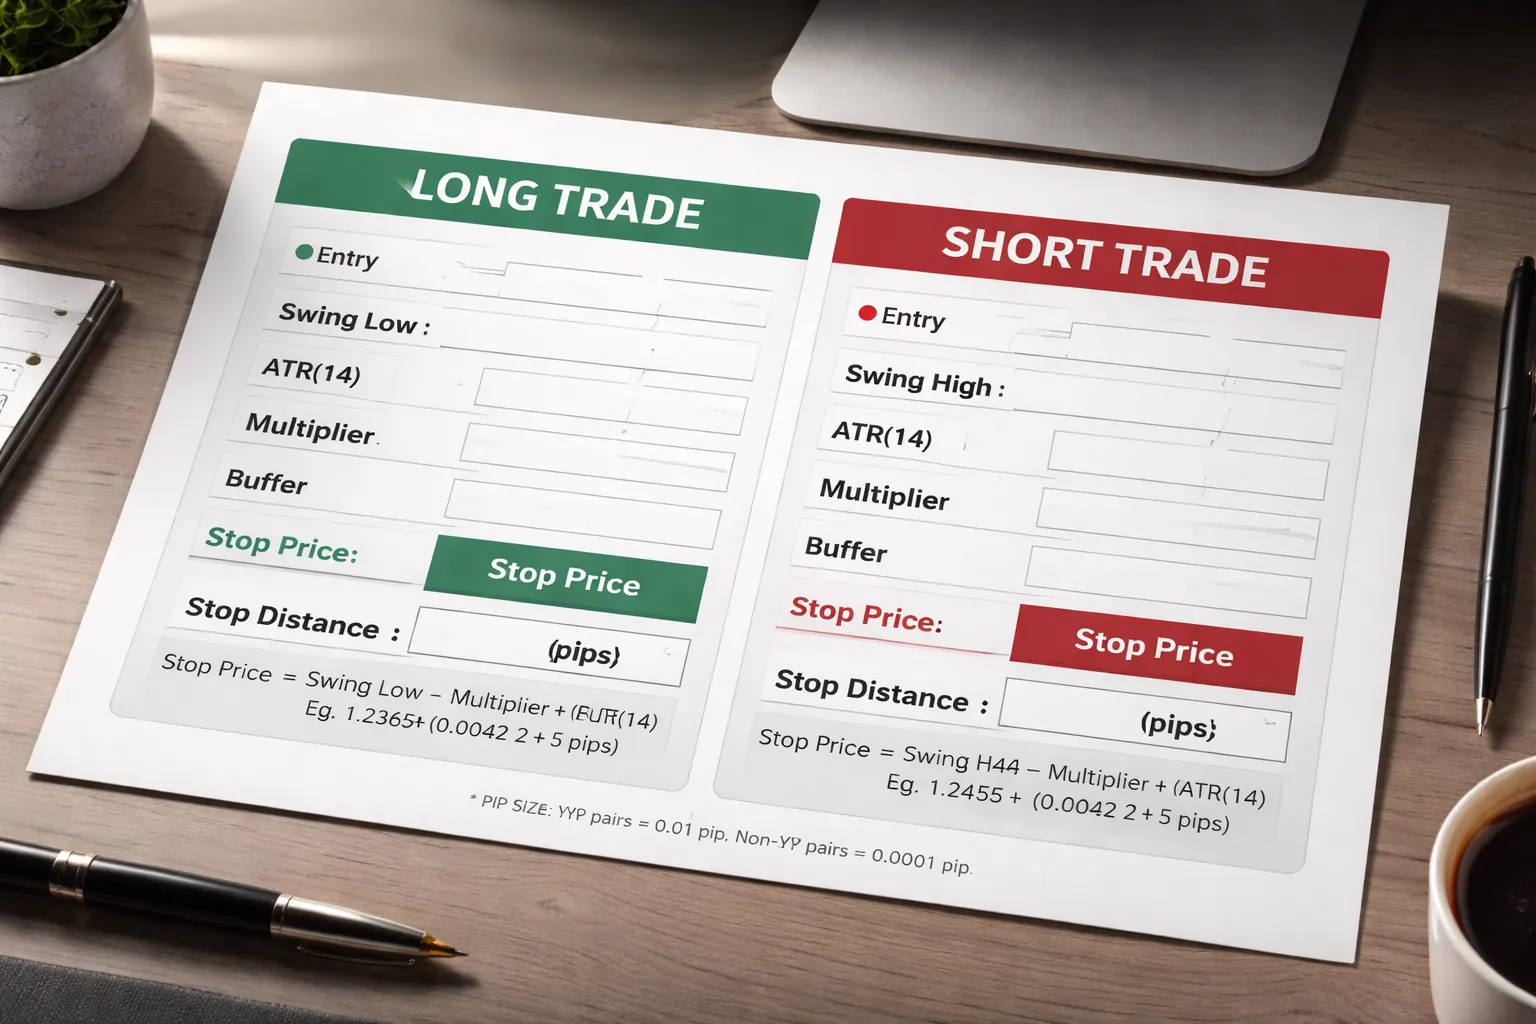
Long trade template, entry, stop distance, volatility buffer
Use structure first. Use ATR as a buffer. You want your stop beyond the level that should not break.
- Entry: at your trigger price. Example, break and close, pullback, or limit at support.
- Structure level: the swing low, base low, or support that defines the setup.
- Volatility buffer: ATR × multiplier.
Formula (long)
- Stop price = Swing Low − (ATR × M)
- Stop distance (pips) = (Entry − Stop price) ÷ PipSize
Common multipliers: 1.0 for tight conditions, 1.5 for normal conditions, 2.0 for choppy price action.
Keep the stop anchored to structure. Do not place the stop at “ATR below entry” if it lands inside the noise zone.
Short trade template, swing high plus ATR buffer
Same logic. Structure first. ATR adds breathing room above the invalidation level.
Formula (short)
- Stop price = Swing High + (ATR × M)
- Stop distance (pips) = (Stop price − Entry) ÷ PipSize
If the swing high is far, ATR will not fix the trade. It will make it worse. Pass.
Worked example in pips, EUR/USD vs GBP/JPY (why pairs differ)
Assume you use ATR(14) on the same timeframe as your setup. Use M = 1.5.
| Pair | Entry | Swing level | ATR(14) | Buffer (ATR × 1.5) | Stop price | Stop distance |
|---|---|---|---|---|---|---|
| EUR/USD (long) | 1.0850 | Swing low 1.0820 | 0.0038 (38 pips) | 0.0057 (57 pips) | 1.0820 − 0.0057 = 1.0763 | (1.0850 − 1.0763) = 0.0087 = 87 pips |
| GBP/JPY (short) | 187.20 | Swing high 188.10 | 1.20 (120 pips) | 1.80 (180 pips) | 188.10 + 1.80 = 189.90 | (189.90 − 187.20) = 2.70 = 270 pips |
These stops look nothing alike because the pairs do not move the same. GBP/JPY prints larger ranges, so ATR is larger. That is the point. ATR forces you to pay the real volatility cost of the trade.
If your target cannot cover that stop with your minimum R to R, you skip. If you need help setting R to R rules, use this risk reward ratio guide.
Common rounding rules, broker pip conventions and platform formatting
- Know your pip size: most non-JPY pairs use 0.0001 per pip. JPY pairs use 0.01 per pip.
- Know your quote digits: many brokers show fractional pips. Example, EUR/USD at 1.08507. Your stop still works, but your platform may require exact tick increments.
- Round away from price: for a long stop, round the stop slightly lower. For a short stop, round the stop slightly higher. You avoid accidental stop-outs from rounding up the wrong way.
- Respect minimum stop distance: some brokers enforce a minimum number of points from current price. If your structure plus ATR stop violates it, adjust or skip.
- Keep formatting consistent: write your plan in both price and pips. Price prevents mistakes. Pips helps position sizing.
ATR multiples: how to pick the right one for your strategy
Tighter multiples for mean reversion, wider multiples for trend following
ATR multiples control how much noise your stop can survive. Pick the multiple that matches how your edge behaves.
- Mean reversion: You want fast feedback. Price should snap back soon or your idea fails. Use tighter buffers, often 0.8x to 1.5x ATR, placed beyond structure.
- Trend following: You expect pullbacks and churn. You need room to stay in. Use wider buffers, often 1.5x to 3.0x ATR, placed beyond the swing that defines the trend.
- Breakouts: You need to survive retests. If you use a tight stop, you need higher win rate and cleaner entries. Many breakout plans start near 1.5x to 2.5x ATR and tighten only after the trade moves in your favor.
Do not force a tight ATR stop to work in a trend system. You will cut winners early and raise costs from re-entries.
Ranging vs trending markets, adapt the buffer without curve-fitting
Volatility changes with regime. Your multiple can change too, but keep rules simple and stable.
- Ranging markets: Use smaller multiples and tighter structure. The goal is to avoid paying for wide stops when the market does not travel far. Typical range setting sits near 1.0x to 1.5x ATR.
- Trending markets: Use larger multiples and wider structure. The goal is to avoid getting shaken out during pullbacks. Typical trend setting sits near 1.5x to 2.5x ATR.
- One switch rule: Define trend with one filter you already trust, like price above a 200 EMA, or ADX above a fixed level. Two regimes only, range or trend. No extra buckets.
- Cap your changes: Use two fixed multiples, for example 1.2x in range and 2.0x in trend. Do not tune per pair, per session, and per month.
Every extra condition makes your stop look smarter in hindsight and weaker live.
Backtest guidance, what to record to choose a multiple
Test a small set of multiples on the same entry and exit logic. Start with 1.0x, 1.5x, 2.0x, 2.5x. Keep position sizing constant by risking a fixed percent per trade.
Record these metrics for each multiple.
- Stop-out rate: Percent of trades that hit the stop. Split by regime and session if you trade specific hours.
- MAE (Maximum Adverse Excursion): Worst move against you before exit. This shows how much heat your trades usually take.
- MFE (Maximum Favorable Excursion): Best move in your favor before exit. This shows if wider stops actually allow bigger winners or just delay losers.
- Expectancy: Average R per trade, where R equals your initial risk. Track win rate and average win and loss in R.
- Time to stop or target: Helps you see if a multiple traps you in long, low quality trades.
- Slippage sensitivity: Compare results around news and high spread periods. ATR stops can look fine until spreads expand.
| Multiple | What usually improves | What usually worsens | What to check in your data |
|---|---|---|---|
| 1.0x | Smaller losses, faster invalidation | More stop-outs, more re-entries | MAE distribution, spread costs, win rate stability |
| 1.5x | Fewer noise stop-outs | Slightly larger losses | Expectancy change versus 1.0x, MFE capture |
| 2.0x | Better trend survival | Lower R multiples if targets stay fixed | Average win in R, hold time, drawdown |
| 2.5x+ | Fewer premature exits in strong trends | Bigger losses, slower feedback | Whether average win grows enough to pay for larger risk |
Pick the smallest multiple that keeps stop-outs from random noise while preserving your expectancy. Then lock it in and judge performance over a meaningful sample. Align your profit target with the new stop so your risk-reward ratio stays realistic.
ATR trailing stop approaches (and when they help)
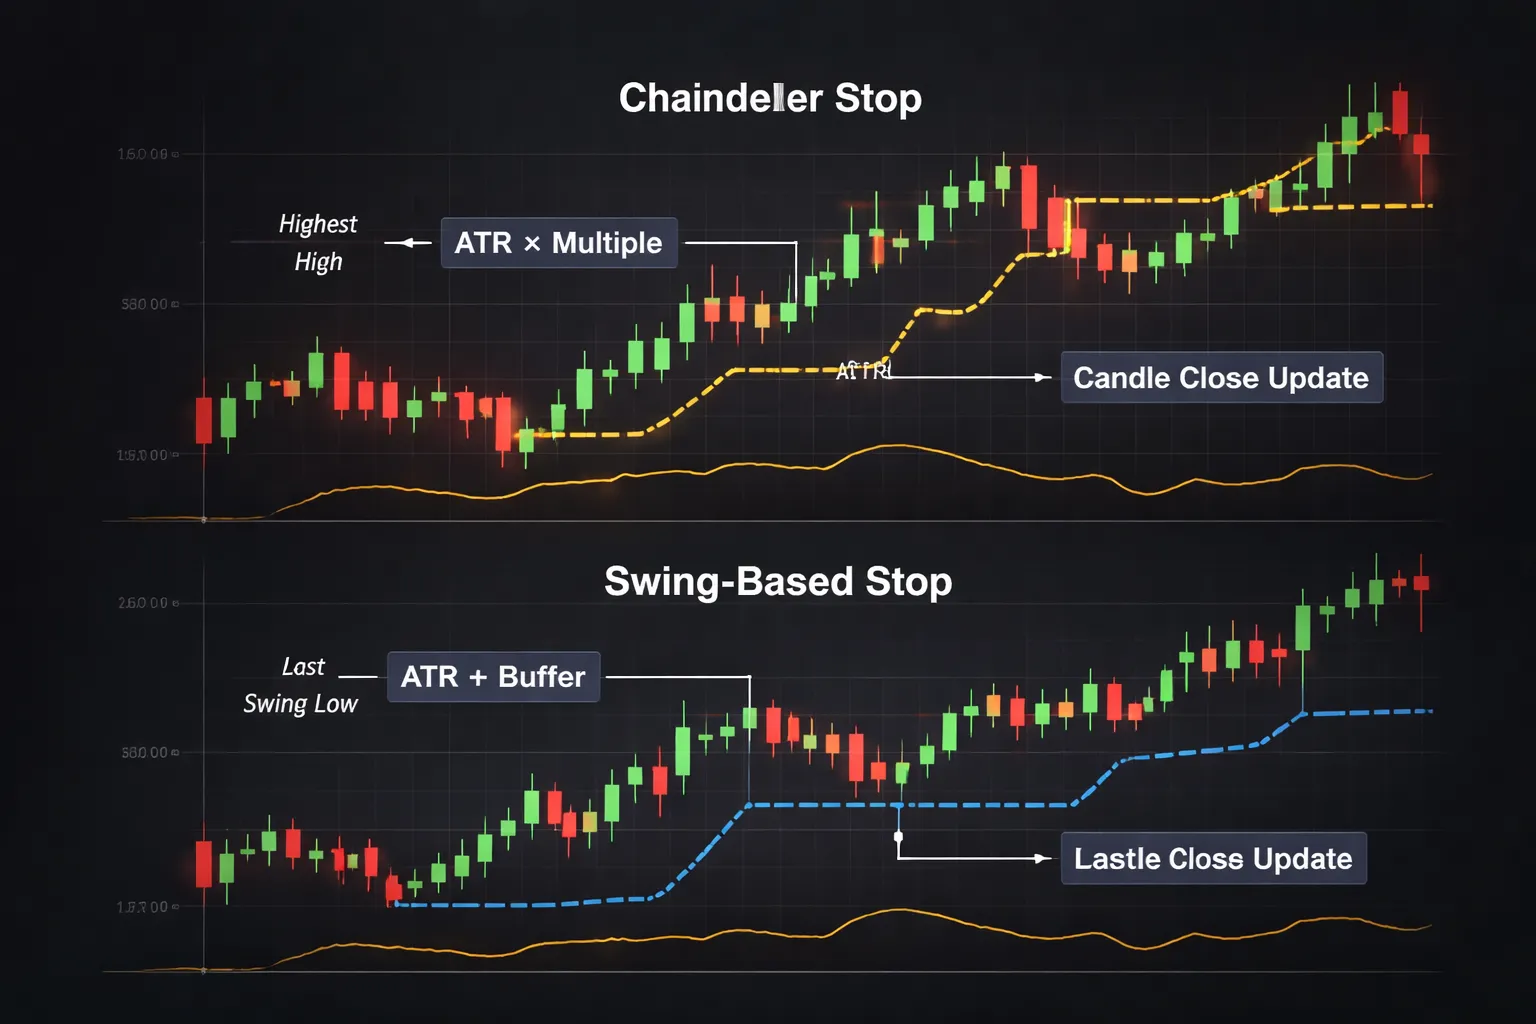
Chandelier-style trailing using ATR, simple and consistent
A Chandelier stop trails price at a fixed ATR distance from the most favorable extreme.
- Long trade: Stop = Highest high since entry minus (ATR x multiple).
- Short trade: Stop = Lowest low since entry plus (ATR x multiple).
This method does two things well. It gives the trade room when volatility expands, and it tightens when volatility contracts. You avoid placing the stop where normal range can hit it.
Use it when you trade trends and want a rules-based exit. It works best when price makes steady progress and your edge comes from riding longer moves.
- Main benefit: You stay in strong trends longer than with swing-based stops.
- Main cost: You give back more open profit on reversals, especially after a blow-off move.
Pick the ATR multiple from your testing. Many trend systems land between 2.0 and 3.0 ATR, but your pair and timeframe decide.
Swing-based trailing plus an ATR buffer, fewer premature exits
Instead of trailing from the highest high or lowest low, trail behind structure. Use the last confirmed swing, then add an ATR buffer to account for noise.
- Long trade: Stop goes below the last swing low minus (ATR x buffer).
- Short trade: Stop goes above the last swing high plus (ATR x buffer).
This approach cuts over-management. You only move the stop when the market prints a new swing. You also avoid tightening the stop just because price drifted higher for a few candles.
Use it when the pair chops between pushes. It helps when a pure ATR trail would tighten too soon and exit you before the next leg.
- Buffer guide: Start with 0.5 to 1.5 ATR beyond the swing.
- Risk control: Do not move the stop closer if it sits inside the current ATR range. Let structure and ATR agree.
If you still get clipped, your swing definition is too tight, or your buffer is too small for that timeframe. Fix the rule, not the trade.
Rules for moving stops, cadence, confirmation, and control
Trailing stops fail when you move them too often. Your goal is fewer decisions and cleaner data.
- Set a cadence: Update once per candle close on your trading timeframe. Do not update mid-candle.
- Use confirmation candles: Move the stop only after a close that confirms the new high or swing. One close is the minimum. Two closes reduces noise but reacts slower.
- One-way rule: Your stop only tightens. It never loosens.
- Minimum step: Only move the stop if the new level improves by at least 0.25 to 0.5 ATR. This avoids micro-adjustments.
- Do not trail to breakeven too early: If price has not moved at least 1 ATR in your favor, breakeven often becomes a guaranteed scratch in normal pullbacks.
- Lock the process: You choose the trail type, ATR period, multiple, and cadence before the trade. You do not change them because the trade feels tense.
If you need a baseline for clean execution, follow the same order workflow you use for any stop, then add the trailing rule after entry. See this beginner-friendly stop loss guide for the mechanics.
Position sizing with ATR-based stops (risk management that stays consistent)
Why stop distance and lot size must be linked
ATR-based stops change with volatility. Your position size must change with them.
If you keep the same lot size while your stop gets wider, your risk per trade rises. If you keep the same lot size while your stop gets tighter, your risk per trade falls. Both break consistency.
Linking stop distance to position size keeps your dollar risk stable. You accept the market’s volatility, but you control your exposure.
Position size formula using account risk %, stop pips, and pip value
Start with three inputs. Account size, risk percent, and ATR stop distance in pips.
- Account risk ($) = Account Equity × Risk %
- Stop (pips) = ATR(pips) × ATR multiple
- Position size (lots) = Account risk ($) ÷ (Stop (pips) × Pip value ($/pip per lot))
Example.
- Equity: $10,000
- Risk: 1% so $100
- ATR: 18 pips
- Multiple: 2.0 so stop = 36 pips
- Pip value: $10 per pip per 1.00 standard lot
Position size = 100 ÷ (36 × 10) = 0.277 lots. You round down to what your broker allows. Your risk stays near $100.
Handling different quote currencies and pip value variations
Pip value changes by pair and account currency. Do not assume $10 per pip.
Use your platform’s pip value field, or compute it, then plug it into the same formula.
- If your account currency matches the quote currency in the pair, pip value stays straightforward.
- If your account currency does not match the quote currency, you must convert pip value into your account currency at the current exchange rate.
- JPY pairs use a different pip size. One pip is usually 0.01. Your ATR in pips must use the same pip definition.
- Crosses and exotics often have larger spreads and different contract specs. Use the broker’s pip value for accuracy.
Operational rule. Before you place the trade, confirm three numbers in the ticket. Stop in pips, pip value, and resulting risk in account currency. If your platform supports it, use the order ticket from your usual order types workflow and check the projected loss at stop.
Risk caps for correlated pairs to avoid stacking hidden exposure
ATR sizing controls risk per trade. It does not control risk across trades.
Correlated pairs can move together. If you take multiple trades with the same underlying exposure, you can stack risk without noticing.
- Set a per-theme cap. Example, max 1.5% total risk across all USD-long trades.
- Set a per-currency cap. Example, max 2% total risk where USD is a primary driver, even across different pairs.
- Reduce size when you add a second correlated position. Keep total risk under the cap.
- Treat highly linked pairs as one position. Example, EURUSD and GBPUSD often move together, especially during broad USD moves.
Simple rule. If two trades likely lose together, they share the same risk budget.
Advanced stop placement: combining ATR with structure and confluence
Support and resistance integration, place stops beyond zones, not lines
Start with structure. Mark support and resistance as zones, not single prices. Use the swing high and swing low, plus nearby wicks and closes. That range is the zone.
Then add ATR as your volatility buffer. Your stop goes outside the zone by an ATR fraction or multiple. This reduces random tag outs.
- For long trades, place the stop below the support zone low, then subtract a buffer like 0.5 ATR to 1.5 ATR.
- For short trades, place the stop above the resistance zone high, then add a buffer like 0.5 ATR to 1.5 ATR.
- Use smaller buffers in tight ranges. Use larger buffers in trend legs and during high impact sessions.
Keep the stop anchored to structure. If the zone breaks with momentum, you want out. ATR alone cannot tell you where the trade idea fails, structure can.
Using ATR with Fibonacci levels, avoid obvious stop clusters
Many traders place stops right behind 38.2, 50.0, or 61.8. Those levels attract liquidity. You want your stop where the idea breaks, not where the crowd hides.
- Find the Fib level that supports your entry plan.
- Identify the nearest structure behind it, like a swing low for longs or swing high for shorts.
- Place the stop beyond that structure, then add a volatility buffer, often 0.5 ATR to 1.0 ATR.
If you must use a Fib level as the reference, do not park the stop a few pips beyond it. Offset by a meaningful ATR fraction. You trade less, but you survive longer.
Breakout trades, ATR filters to reduce false breakouts and stop hunts
Breakouts fail when price clears a level by a small margin, then snaps back. ATR helps you set a minimum breakout distance and a smarter stop.
- Breakout filter, require price to move beyond the level by at least 0.25 ATR to 0.50 ATR before you treat it as a real break.
- Stop placement, put the stop back inside the range by 0.5 ATR to 1.0 ATR, beyond the opposite side of the broken zone, not just behind the line.
- Entry method, if you wait for a retest, use ATR to define how deep a retest can go before the breakout thesis fails.
Do not tighten stops to force a better risk-reward ratio. Use a stop that fits the structure and volatility, then size the position to your risk.
Session-based context, London and New York overlaps need adaptive buffers
ATR is a rolling average. It lags. Session shifts can change volatility faster than ATR updates.
- During the London open and the London to New York overlap, expect wider swings. Use larger ATR buffers, often closer to 1.0 ATR to 1.5 ATR.
- During late New York and early Asia, ranges often tighten. Smaller buffers can work, often 0.5 ATR to 1.0 ATR, if structure supports it.
- Before major scheduled news, spreads can widen and candles can spike. Treat that as a different regime. Reduce size or widen the stop buffer, do not pretend your normal ATR still applies.
Your goal stays the same. Put the stop where the idea breaks, then add enough ATR space to survive normal session noise.
High-impact news and volatility shocks: adapting ATR stops safely
Why ATR can lag during sudden volatility expansions
ATR is a moving average of True Range. It updates after the candle closes. During a volatility shock, price expands first, ATR catches up later.
This creates a gap between what your ATR shows and what the market does. Your normal 1.0 ATR stop can sit inside the next candle’s range. You get stopped even if your direction was right.
Spreads also widen during news. ATR does not include your broker spread and slippage. Your real risk increases even if ATR looks stable.
- Risk 1: ATR underestimates the next bar range.
- Risk 2: spread plus slippage pushes your fill past the stop level.
- Risk 3: liquidity gaps break clean structure based stops.
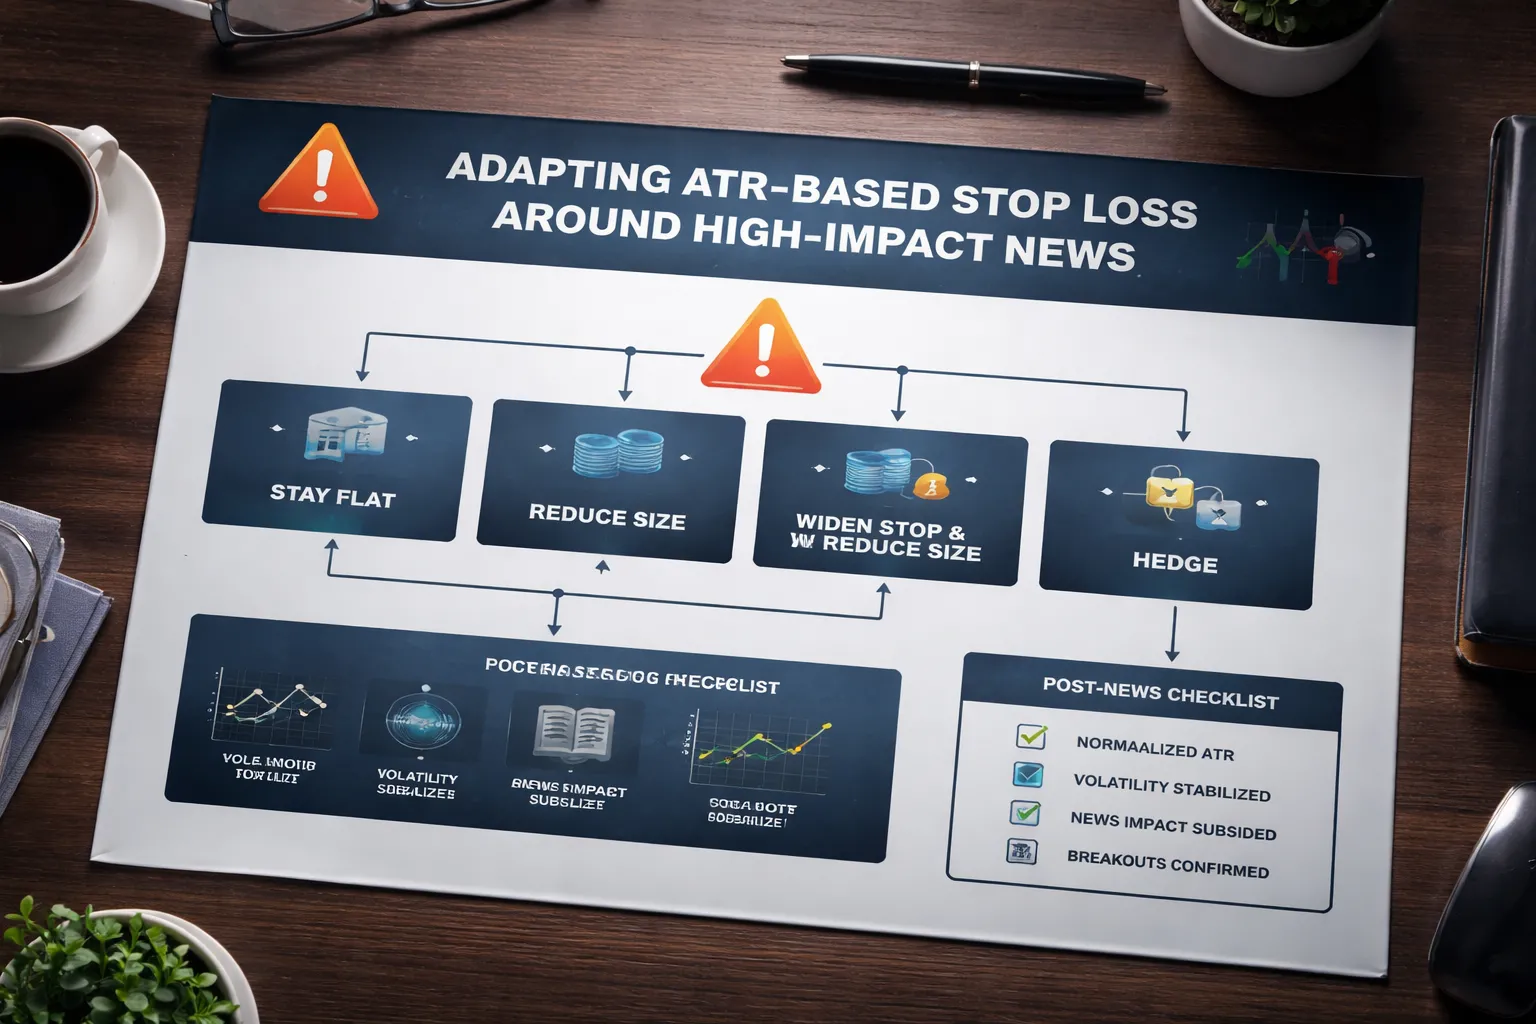
Pre-news decision tree: reduce size, widen stop, hedge, or stay flat
Start with the calendar. Flag high-impact releases for the currencies in your pair. Treat the next 30 to 90 minutes as a different regime.
Use one rule. Do not change your stop and keep your size. Pick one lever.
- Option A, stay flat: if your edge depends on tight execution, stand down. You avoid slippage risk you cannot model.
- Option B, reduce size: keep your stop logic, cut position size. Aim to keep your account risk per trade constant.
- Option C, widen the ATR buffer: keep size smaller, widen the stop to match shock conditions. Use structure first, then add a larger buffer, often 1.5 ATR to 3.0 ATR of the current timeframe. If that stop sits in an invalid place, skip the trade.
- Option D, hedge only if your plan supports it: do not improvise. If you hedge, define the unwind rule before the release, and cap total exposure.
Keep the math simple. If you double your stop distance, you should cut size in half to keep the same cash risk. If you cannot size down, you cannot widen safely. Use the same risk rules you follow in normal conditions, then apply them harder. See risk management basics.
| Situation | Action | Stop logic |
|---|---|---|
| You need clean fills | Stay flat | No trade |
| You have a setup, spreads rising | Reduce size | Normal structure stop plus 0.5 to 1.0 ATR |
| You expect a breakout and can accept noise | Widen stop and cut size | Structure stop plus 1.5 to 3.0 ATR |
| You hold a position into news by design | Predefined hedge or partial exit | Hard stop stays, exposure drops |
Post-news normalization: wait for ATR to stabilize
After the release, the first candles can print extreme ranges. ATR will spike, then decay. If you apply your normal ATR multiple right away, you often place stops too wide and destroy your reward to risk.
Wait for stabilization, then go back to standard rules.
- Step 1: let the first impulse and one retrace complete on your trading timeframe.
- Step 2: wait until ATR stops rising and flattens for several candles. You want the new range regime priced in.
- Step 3: measure today’s ATR versus the pre-news baseline. If ATR still runs at 1.5x to 3.0x normal, keep size smaller or stay out.
- Step 4: reapply your standard stop rule, structure first, then your usual 0.5 ATR to 1.5 ATR buffer based on conditions.
News creates two common traps. The first is tight stops that ignore the shock. The second is huge stops that ignore the trade’s logic. Your fix is consistent. Define the invalidation point, then add ATR space that matches the current regime, and size the trade so one stop out stays small.
Platform implementation: setting ATR stops in popular Forex tools
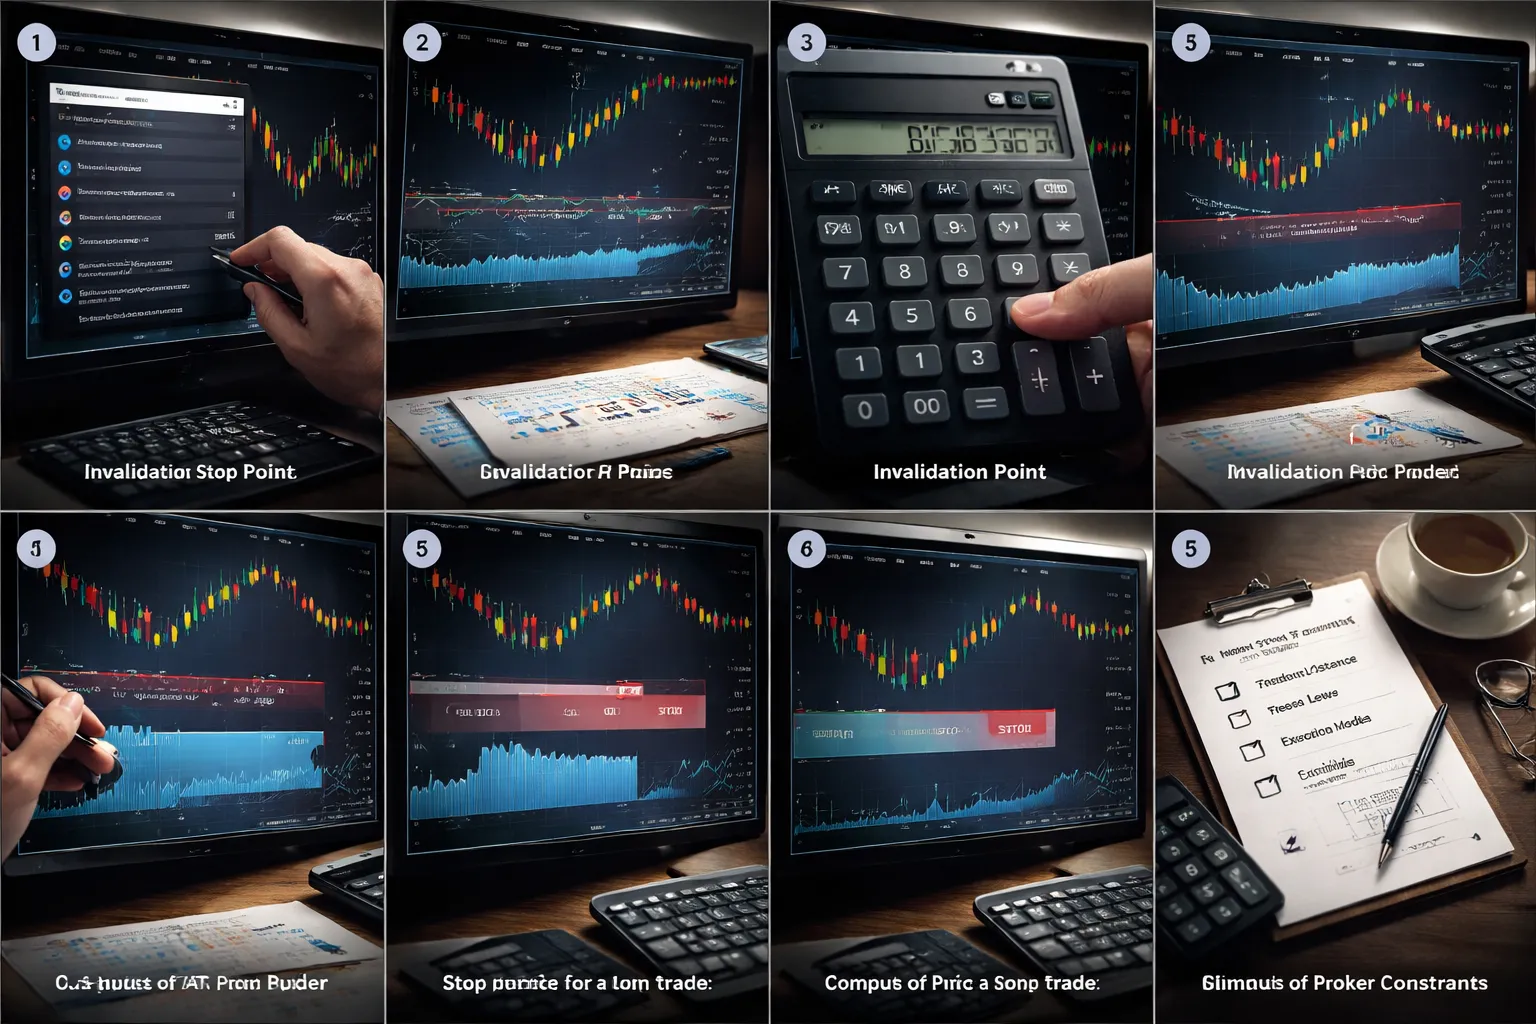
MetaTrader 4 and MetaTrader 5: add ATR, read it, place the stop
1) Add ATR to your chart.
- MT4: Insert, Indicators, Oscillators, Average True Range.
- MT5: Insert, Indicators, Oscillators, Average True Range.
- Set the period you use in your plan. Common is 14. Do not change it mid trade.
2) Read the ATR value in pips.
- Hover your mouse over the ATR line, or open Data Window to see the current value.
- MT4 and MT5 show ATR in price units, not pips.
- Convert to pips. For most USD quote pairs, 1 pip = 0.0001. For JPY pairs, 1 pip = 0.01.
- Example: ATR = 0.00120 on EURUSD. That is 12 pips.
3) Place a manual ATR stop using your structure first rule.
- Mark your invalidation point, recent swing, level, or setup low or high.
- Choose your buffer, usually 0.5 ATR to 1.5 ATR based on current conditions.
- Compute stop price.
- Long: stop = invalidation price minus ATR buffer.
- Short: stop = invalidation price plus ATR buffer.
4) Enter the stop on the order ticket.
- Open a new order. Set Stop Loss to your computed price before you send the trade.
- If you already entered, right click the position, Modify or Delete, then set Stop Loss.
- Check the stop distance in pips matches your plan before you confirm.
5) If you trail manually, use a fixed rule.
- Update only after a candle close on your trading timeframe.
- Trail by structure, then add your ATR buffer again.
- Do not tighten the stop just because ATR falls for a few bars. Use the same review schedule each time.
TradingView: ATR settings, pips, alerts for trailing logic
1) Add ATR and set inputs.
- Indicators, search for Average True Range.
- Set Length to your plan value, often 14.
- Keep the chart timeframe consistent. ATR changes with timeframe.
2) Convert ATR to pips fast.
- ATR prints in price units on most charts.
- Convert with the symbol tick size.
- Rule of thumb: EURUSD ATR 0.00120 = 12 pips. USDJPY ATR 0.30 = 30 pips.
3) Measure the stop distance on chart.
- Use the ruler tool to measure from entry to stop. TradingView shows price change and pips on many FX symbols.
- Set the stop at structure, then add your ATR buffer distance.
- Write the exact stop price. Use that price in your broker platform.
4) Use alerts to enforce trailing rules.
- TradingView alerts cannot move your broker stop by default.
- Use alerts as reminders to recalc the stop at your chosen cadence, such as on candle close.
- Create an alert on bar close with your rule inputs, for example “trail stop to swing plus 1.0 ATR”.
- If you automate through webhooks, keep the logic simple. Update stop only when your rule triggers, not on every tick.
Consistent rules reduce impulsive edits. That helps prevent the same pattern that drives overtrading.
Broker constraints to check: minimum stop distance, freeze levels, execution model
- Minimum stop distance. Some brokers require your stop to sit a set number of points away from current price. If your ATR buffer puts the stop too close, the platform rejects the order. Increase the buffer or skip the trade.
- Freeze level. Many brokers block stop modifications within a small range near current price. Your trailing rule may fail during fast moves. Plan for fewer updates and larger steps.
- Execution model. Market execution and instant execution behave differently. Requotes, slippage, and partial fills change your real risk. Assume your stop can fill worse than your stop price in spikes.
- Spread and session effects. Wider spreads at rollover or news effectively shrink your stop distance. Your ATR buffer must cover normal spread plus volatility, or you take random stop outs.
- Stop order type. A stop loss is not a guaranteed fill in most spot FX and CFD accounts. Treat ATR as spacing, then size your position so the worst reasonable fill stays inside your risk limit.
Common mistakes with ATR stop loss placement (and how to fix them)
Using ATR alone without an invalidation point
ATR measures movement. It does not tell you where your trade idea breaks.
- Mistake: You set the stop at 1.5x ATR because it “fits volatility”, but price can hit it while your setup still holds.
- Fix: Place the stop where the setup becomes wrong, then check if that level sits outside normal noise.
- Process: Identify the invalidation level first, then add an ATR buffer to reduce random taps.
- Rule: If the invalidation stop needs more than your max risk, skip the trade or reduce size. Do not “force” ATR to make it work.
Use structure for the “why” of the stop, ATR for the “how far”. Support and resistance levels help define invalidation, see support and resistance.
Placing stops inside average noise or inside the spread-heavy zone
Most stop outs come from tight stops, not bad entries.
- Mistake: You use 0.5x to 1.0x ATR on choppy pairs and get clipped by normal back and fill.
- Mistake: You ignore spread expansion at rollover, illiquid hours, and pre news positioning. Your real stop distance shrinks.
- Fix: Measure typical spread during the hours you trade, then add it to your stop buffer.
- Fix: Use a minimum distance rule, for example stop distance must be greater than 1x ATR plus typical spread, then validate it still sits beyond the structure level.
- Fix: Avoid placing stops at obvious equal highs and lows where liquidity sits. Shift beyond them by a volatility based buffer.
Mixing timeframes incorrectly
ATR only makes sense when it matches the timeframe of your trade.
- Mistake: You enter on M5, then use D1 ATR for the stop because it “looks safer”. The stop becomes huge, your position size collapses, and your reward to risk breaks.
- Mistake: You use M5 ATR for a multi day swing. Your stop sits inside daily swings and you exit early.
- Fix: Match ATR to your holding period. If you trade M5 signals and hold 15 to 60 minutes, base ATR on M5 or M15.
- Fix: Use a two layer approach when needed. Set invalidation on the entry timeframe, then sanity check it against the next higher timeframe ATR so you do not anchor to micro noise.
- Rule: Your ATR timeframe should reflect the candle size that will hit your stop in normal conditions.
Changing ATR settings after losses
Frequent tweaks turn ATR into hindsight fitting.
- Mistake: After a stop out you switch ATR(14) to ATR(7), or you change from 1.5x to 2.3x, then you call it “optimization”.
- Problem: You create inconsistent risk, inconsistent trade management, and results you cannot replicate.
- Fix: Lock your inputs for a sample size. Use at least 30 to 50 trades before you change period or multiple.
- Fix: Change one variable at a time. Track outcomes by pair, session, and strategy type.
- Fix: Prefer stable rules over perfect rules. Use ATR settings that keep your stop outside noise, then control risk with position size.
| Mistake | What happens | Fix |
|---|---|---|
| ATR without invalidation | Stops hit while setup still valid | Set invalidation first, add ATR buffer second |
| Stop inside noise or spread zones | Random stop outs, worse fills | Use ATR plus typical spread, avoid thin liquidity hours |
| Timeframe mismatch | Stops too wide or too tight for the hold | Match ATR to holding period, cross check one TF higher |
| Changing settings after losses | Data snooping, inconsistent risk | Lock inputs, evaluate over 30 to 50 trades |
Pros, cons, and limitations of ATR-based stops in Forex
Key advantages of ATR-based stops
- Adapts to volatility. When range expands, your stop widens. When range contracts, your stop tightens. You avoid using the same stop size in two different market states.
- Creates consistent risk rules. You can standardize execution with a fixed multiple, like 1.5 ATR or 2.0 ATR. This reduces rule changes and makes results easier to review.
- Reduces random stop-outs. ATR-based stops sit outside normal price movement for that timeframe. You cut the number of exits caused by routine candles, spread spikes, and small liquidity gaps.
- Improves position sizing. Wider stop equals smaller size. Tighter stop equals larger size. You keep your account risk stable instead of letting volatility decide your risk.
Key drawbacks and limitations
- ATR lags. ATR looks backward. After a volatility spike, ATR stays elevated for a while. Your next trades may use stops that are too wide, which hurts reward to risk.
- Regime shifts break assumptions. Quiet range, then news. Trending phase, then chop. ATR adjusts, but it cannot predict the shift. You still need hard rules around events and sessions.
- ATR ignores structure. A clean swing low, prior day low, or key level can matter more than a volatility number. If you place a stop purely by ATR, you may park it inside a known liquidity target.
- Different pairs, different microstructure. Spreads, gaps, and session behavior change by pair. A single ATR multiple across all pairs can misfit. Cross pairs also amplify risk when they move together. Use Forex correlation checks before you stack exposure.
- Whipsaw periods still hurt. In tight ranges, ATR drops. Stops shrink. You can get chopped out fast unless you add a market filter, like structure range boundaries or time based trade limits.
- One number cannot cover all trade management. ATR helps define distance. It does not solve when to move to breakeven, when to trail, or when to exit early. You need a plan for each.
When to consider alternatives
- Use fixed stops when your strategy tests best with stable stop sizes, like mean reversion systems on a single pair and timeframe. Fixed stops also help when ATR swings distort your sizing too much.
- Use structure-only stops when your edge depends on level invalidation, like breakouts from defined ranges or swing trading off clear highs and lows. Place the stop beyond the invalidation point, then size the trade to fit your risk.
- Use ATR plus structure when you want both. Put the stop beyond structure, then require a minimum ATR distance, like max of structure stop and 1.5 ATR. This avoids stops that sit too close during low volatility.
- Use options-based hedging when you trade around major scheduled events and you want defined risk without wide spot stops. Spot FX options access depends on your broker and jurisdiction. For many retail traders, this is not available.
Mini checklist: ATR stop loss placement workflow for real trading
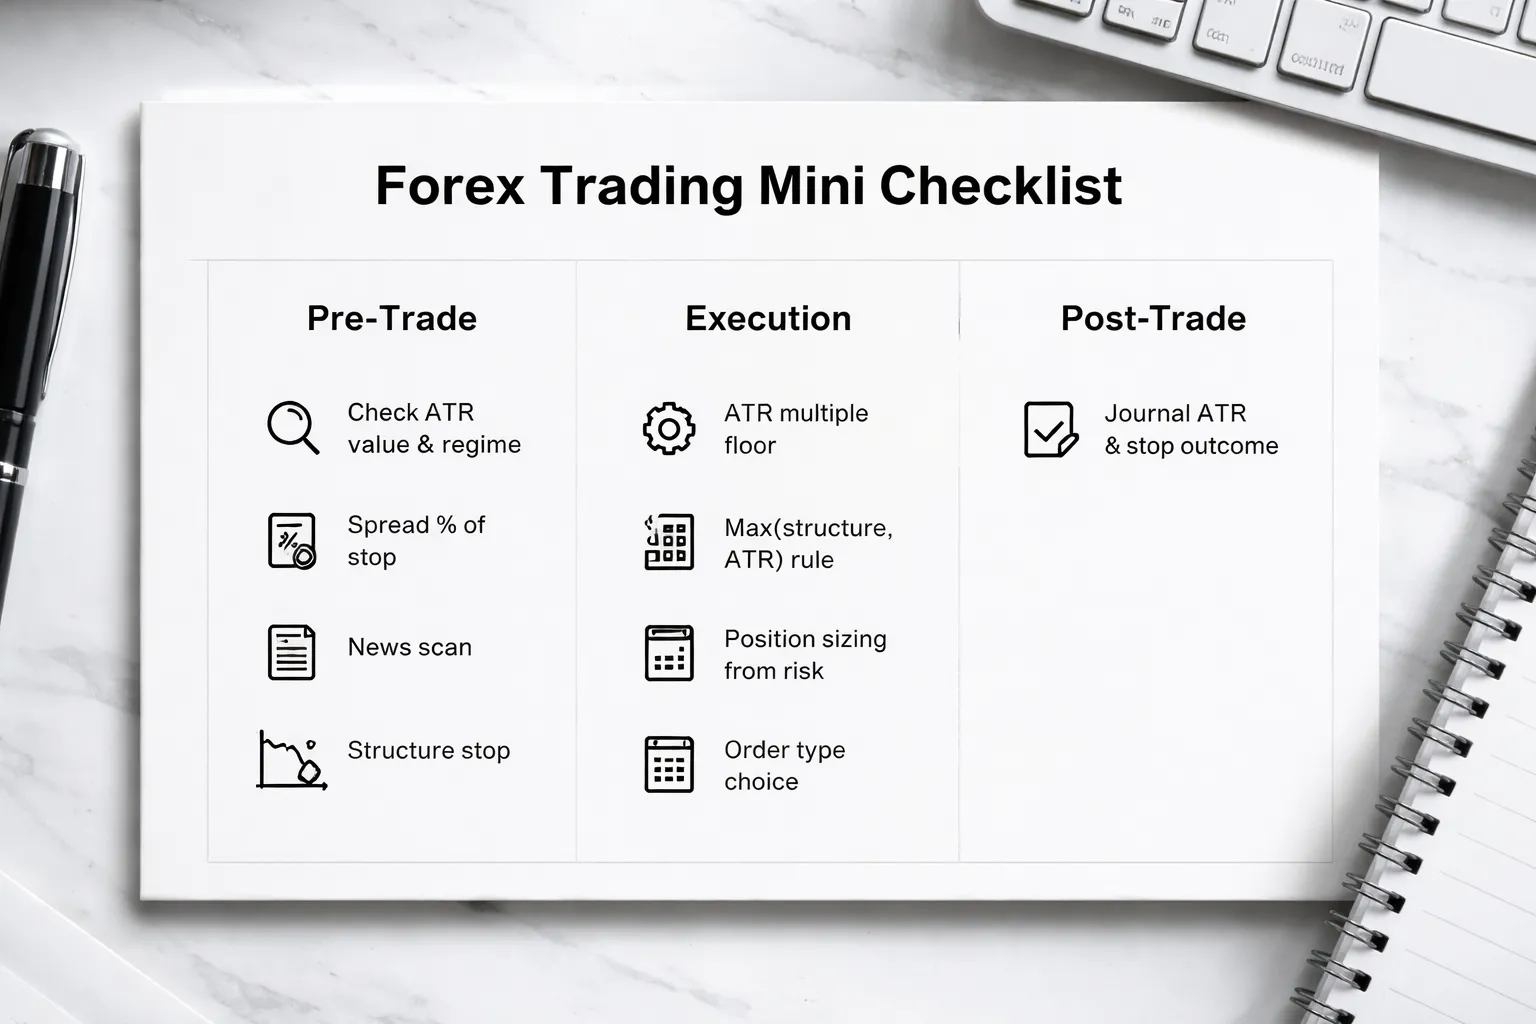
Pre-trade checklist: volatility, spread, session, and news scan
- Confirm your ATR inputs. Set the ATR period you will use, most traders start with 14. Match it to your stop timeframe, not your entry trigger timeframe.
- Read current volatility. Note the ATR value in pips. Compare it to the last 5 to 20 sessions to see if volatility sits low, normal, or high.
- Check spread cost. Record the live spread in pips. Avoid trades where spread eats a meaningful chunk of your stop, a common rule is spread under 10 percent of your planned stop.
- Match the session to the pair. Trade majors when their home session runs. Expect wider spikes in overlap and thinner moves in dead hours.
- Scan the calendar. Mark high impact releases for both currencies. If news hits inside your planned holding window, widen your stop, reduce size, or skip.
- Mark structure first. Identify the swing high or low you will use for the structure stop. If you need a refresher, use this support and resistance guide.
Execution checklist: stop distance, lot size, and order type selection
- Pick your stop method. Start with structure. Then apply an ATR floor so you do not place a tight stop in quiet conditions.
- Calculate stop distance. Use this workflow.
- Structure stop. Place beyond the swing plus a small buffer for spread.
- ATR stop. ATR multiple, common starting points are 1.0 to 2.0 ATR.
- Final stop. Use the larger distance, max of structure stop and ATR stop.
- Set your risk per trade. Choose a fixed percent or fixed amount. Do not change it based on confidence.
- Size the position from the stop. Lot size must come from stop distance and risk, not from what looks small on the chart.
- Confirm pip value. Check pip value for the pair and account currency. JPY and cross pairs can surprise you.
- Choose the order type.
- Market order. Use when liquidity is strong and spread is stable.
- Limit order. Use when you want a specific price and you accept missed fills.
- Stop order. Use for breakouts, but expect slippage in fast moves.
- Place the stop immediately. Attach it to the order. Do not add it later.
- Set a sanity check. If your stop sits inside normal noise, your ATR multiple is too low or your structure level is weak.
Post-trade checklist: journaling ATR, multiple used, and stop outcome for optimization
- Log the ATR value at entry. Save the number in pips and the timeframe.
- Log the multiple used. Record 1.0 ATR, 1.5 ATR, 2.0 ATR, and whether structure or ATR was the binding constraint.
- Log spread and session. Save spread at entry and the session block. This helps explain stop outs that come from costs and thin liquidity.
- Tag the stop outcome. Use clear labels.
- Clean stop. Price hit the stop and continued against you.
- Noise stop. Price hit the stop, then reversed and ran your original direction.
- Slippage stop. Fill worse than stop by more than your normal slippage range.
- Track MFE and MAE. Maximum favorable excursion and maximum adverse excursion show if your stop distance matches real movement.
- Review by sample size. Evaluate changes only after a meaningful batch, like 30 to 50 trades on the same setup.
- Adjust one variable at a time. Change ATR multiple or structure buffer, then retest. Do not change both.
FAQ
What ATR period should you use for Forex stops?
Use 14 as your default. It reacts fast enough for most swing and day trades. Use 7 for faster signals and tighter stops. Use 20 to 28 to smooth noise on higher timeframes. Keep the period stable while you test.
What ATR multiple works best for a stop loss?
Start at 1.5x to 2.5x ATR from your stop reference point. Use 1.0x to 1.5x for tight mean reversion setups. Use 2.5x to 4.0x for trend trades. Validate with MAE and a 30 to 50 trade sample.
Where do you measure ATR stops from, candle close or swing high and low?
Anchor the stop to structure first, then add ATR as a buffer. For longs, place it below the swing low or support, then subtract an ATR buffer. For shorts, place it above the swing high or resistance, then add the buffer.
Should you use ATR on the same timeframe you trade?
Yes. Calculate ATR on your execution timeframe to match the noise you face. If you enter on M15 but manage risk on H1, you can use H1 ATR for the stop and M15 for entries. Keep rules fixed.
How do you convert ATR into pips for stop loss placement?
Read the ATR value in price units, then convert to pips. Example, EURUSD ATR(14) = 0.0012 equals 12 pips. Multiply by your ATR multiple. A 2.0x stop equals 24 pips, before any structure buffer.
Does ATR work during news and high volatility spikes?
ATR lags. It widens after the spike, not before it. During high impact news, use smaller size, wider stops, or no trade. If you trade it, add a slippage buffer and avoid stops inside the spread expansion zone.
How do you use ATR for trailing stops?
Trail from the highest close for longs or lowest close for shorts, minus or plus an ATR multiple. Update once per bar close to reduce whipsaws. Do not trail inside normal pullbacks on trends, use a higher multiple.
How does ATR stop loss affect position sizing?
Wider ATR stops reduce position size if you keep risk fixed. Set your account risk per trade, then divide that risk by stop distance in pips, plus spread. This keeps losses consistent across pairs and volatility regimes.
Why does your ATR stop get hit even when the trade idea stays valid?
Your ATR multiple may sit inside normal noise. Increase the multiple, or anchor the stop beyond a clearer swing point. Also check execution. Spread and slippage can tag stops. Log stop hits versus MAE to confirm.
How do you backtest an ATR stop loss method correctly?
Keep one setup, one timeframe, one exit rule. Test at least 30 to 50 trades per variant. Track MAE, MFE, win rate, and R multiple. Use realistic spreads. Follow a clear process from how to backtest a forex strategy.
Conclusion
Conclusion
ATR gives you a stop that matches current volatility. It will not predict direction. It will control risk.
Keep your process tight. Pick one ATR length and one multiple. Place the stop beyond structure, then confirm the distance with ATR. Size the position so the cash risk stays fixed.
- Use 14 ATR as your baseline, then test 10 and 20.
- Start with 1.5x to 2.5x ATR, then tune by pair and timeframe.
- Anchor stops to swing highs and lows, then adjust to meet the ATR buffer.
- Track MAE on every trade, then set your multiple so normal noise does not tag your stop.
- Backtest with real spreads and expected slippage, then avoid trading methods that fail on costs.
Your final tip. Write one ATR stop rule and do not change it trade to trade. Log results for 30 to 50 trades per variant. Keep the best version, then layer your entry filter if needed, such as RSI confirmation.
-
Stop Loss vs Take Profit: Differences, Examples & Best Practices
6 months ago -
Forex Trading Psychology Tips: How to Stay Disciplined and Consistent
6 months ago -
Forex Order Types Explained: Market vs Limit vs Stop Orders
6 months ago -
How to Set Stop Loss and Take Profit (Step-by-Step)
6 months ago -
How to Start Forex Trading Step by Step (Beginner Roadmap)
6 months ago
-
- Step 1: Define the trade idea and invalidate point, structure first
- Step 2: Convert ATR to pips and choose an ATR multiple
- Step 3: Place the stop beyond structure plus a volatility buffer
- Step 4: Confirm stop placement vs spread, commission, and average slippage
- Step 5: Validate risk-to-reward and decide whether to take or skip the trade
-
- What ATR period should you use for Forex stops?
- What ATR multiple works best for a stop loss?
- Where do you measure ATR stops from, candle close or swing high and low?
- Should you use ATR on the same timeframe you trade?
- How do you convert ATR into pips for stop loss placement?
- Does ATR work during news and high volatility spikes?
- How do you use ATR for trailing stops?
- How does ATR stop loss affect position sizing?
- Why does your ATR stop get hit even when the trade idea stays valid?
- How do you backtest an ATR stop loss method correctly?
-
- Step 1: Define the trade idea and invalidate point, structure first
- Step 2: Convert ATR to pips and choose an ATR multiple
- Step 3: Place the stop beyond structure plus a volatility buffer
- Step 4: Confirm stop placement vs spread, commission, and average slippage
- Step 5: Validate risk-to-reward and decide whether to take or skip the trade
-
- What ATR period should you use for Forex stops?
- What ATR multiple works best for a stop loss?
- Where do you measure ATR stops from, candle close or swing high and low?
- Should you use ATR on the same timeframe you trade?
- How do you convert ATR into pips for stop loss placement?
- Does ATR work during news and high volatility spikes?
- How do you use ATR for trailing stops?
- How does ATR stop loss affect position sizing?
- Why does your ATR stop get hit even when the trade idea stays valid?
- How do you backtest an ATR stop loss method correctly?
-
How to Place a Forex Trade Step by Step (Your First Trade Explained)
4 months ago -
Forex Trading vs Crypto Trading: Which Market Is Better for Beginners?
4 months ago -
Forex Lot Size Calculator: How to Use It to Size Trades Correctly
6 months ago -
How to Calculate Position Size in Forex (Position Sizing Formula + Examples)
6 months ago -
Forex Leverage Explained: How It Works, Pros, Cons & Examples
6 months ago
-
Forex Trading Platforms Comparison: MetaTrader vs cTrader vs TradingView
6 months ago -
Stop Loss vs Take Profit: Differences, Examples & Best Practices
6 months ago -
Is Forex Trading Legal in the United States? Rules, Regulators & What to Know
6 months ago -
Forex Market Hours & Trading Sessions Explained (Best Times to Trade)
6 months ago -
Forex Leverage Explained: How It Works, Pros, Cons & Examples
6 months ago