Breakout Trading Strategy (Forex): Rules, Entries, Stops & Common Traps

Breakout trading aims to catch the move that starts when price leaves a clear range. In forex, that usually means price pushes above resistance or below support, then keeps running. The problem is simple. Many breakouts fail and snap back.
This guide gives you rules you can follow. You will learn how to mark breakout levels, what counts as a valid break, and when to stand aside. You will get entry methods for stop and retest setups. You will learn stop placement, position sizing basics, and where to take profit. You will also learn the most common traps, like false breaks, stop hunts, news spikes, and low volatility ranges.
You will also see how to use forex order types to place entries and manage exits with less guesswork.
- In het kort: Trade breakouts only from clear, tested levels, with a defined trigger, a fixed stop, and a preset exit plan.
- Define the level first. Mark support and resistance from swing highs and lows, and ignore messy zones.
- Require a valid break. Use a close beyond the level and a minimum distance buffer, do not trade the first tick through.
- Pick one entry method. Use a stop entry for momentum breaks, or a retest entry for cleaner risk, do not mix rules mid trade.
- Place stops where the setup fails. Put your stop beyond the broken level or beyond the retest swing, not at the exact line. Use stop loss placement rules you can repeat.
- Size the position from the stop. Set your account risk per trade first, then calculate lot size from stop distance.
- Plan exits before you enter. Target the next major level, scale out, or trail only if your rules define it.
- Avoid the common traps. Skip low volatility ranges, late moves, and pre news entries. Expect false breaks and stop hunts around obvious levels.
- Use order types to reduce mistakes. Place entries with buy stop or sell stop, protect with stop loss, and manage exits with limit orders.
What Is a Breakout Trading Strategy in Forex?
Breakout definition in spot FX: ranges, swing levels, and market structure
A breakout trading strategy in Forex aims to capture the move that starts when price leaves a defined area and holds outside it.
In spot FX, you define the area with market structure, not volume. You work with three common structures.
- Range breakout: Price trades between clear support and resistance. You trade the first clean close and follow through outside the box.
- Swing level breakout: Price breaks the last swing high or swing low that traders use as a reference. You treat it as a level, not a single pip.
- Structure breakout: Price breaks a sequence, for example lower highs, higher lows, or a trendline that contains multiple touches. The break signals a change in control.
Your job is simple. Mark the boundary. Define what counts as a break. Trade only when price proves it can stay outside the level.
Why breakouts work: volatility expansion, order-flow, and stop clustering
Breakouts work when volatility expands after a period of contraction. You get movement because orders stack at the same prices.
- Volatility expansion: Compression creates tight candles and smaller ranges. When price escapes, the next bars often cover more distance. Your edge comes from catching that range increase early.
- Order-flow shift: A range holds because buying and selling absorb each other. A breakout starts when one side stops absorbing and starts chasing.
- Stop clustering: Many traders place stops just beyond swing highs, swing lows, and range edges. When price hits those areas, stop orders turn into market orders. That can add fuel to the move.
These mechanics also create false breaks. Stops can trigger, price can spike, then reverse back into the range. You need strict rules for confirmation and invalidation.
Breakout vs trend-following vs mean reversion: when each dominates
Breakout trading performs best at the transition from quiet to active conditions.
- Breakout: Best after consolidation, compression, and time spent at a clear level. You want room to the next major level.
- Trend-following: Best after the breakout already proved itself and the market prints higher highs and higher lows, or lower lows and lower highs. You focus on pullbacks and continuation.
- Mean reversion: Best inside a stable range when price repeatedly returns to the middle after tagging edges. Breakout signals fail more often in this regime.
Do not mix regimes. If you treat a range market like a breakout market, you overtrade and get chopped. If you treat a breakout like a range, you exit too early.
Core vocabulary: support/resistance, consolidation, compression, expansion, retest
- Support: A price zone where selling previously stalled and buyers defended.
- Resistance: A price zone where buying previously stalled and sellers defended.
- Consolidation: Sideways price action that builds a range and traps both sides.
- Compression: Shrinking candle size and narrowing ranges, often before a break.
- Expansion: Larger candles and wider ranges after the break. This is what pays for your risk.
- Retest: Price breaks a level, then returns to test it. A successful retest holds the level from the other side and can offer a second entry.
Market Conditions Where Forex Breakouts Perform Best
Session Behavior: Asia Range, London and New York Expansion
Most clean intraday breakouts start with a tight Asia range, then expand when Europe opens.
- Asia session. Often builds the range. Liquidity stays lower. Moves fade more. You get cleaner levels.
- London open. Often delivers the first real expansion. Watch the first 60 to 120 minutes for the break and follow through.
- London and New York overlap. The day’s biggest volume window. Breakouts can run far, but whipsaws increase. Manage size and stops.
- Late New York. Trends slow. Breakouts fail more. Spreads can widen around rollover.
For range breakouts, mark the Asia high and low. Favor breaks that happen with London participation. Avoid forcing breaks in the middle of Asia unless a major catalyst hits.
Volatility Regimes: ATR Contraction and Expansion
Breakouts pay when volatility shifts from contraction to expansion. You can measure this with ATR.
- Contraction. ATR falls. Candle ranges shrink. You see more overlap. This builds pressure and defines risk.
- Expansion. ATR rises. Candle ranges widen. Price moves with less overlap. This is where your R multiple comes from.
- High ATR already. You chase. Stops need more room. False breaks increase because price swings through levels.
Use ATR to filter trades. You want a low, stable ATR during the range, then a clear pickup on the break. If ATR stays flat after the break, treat it as a warning. You may get a stop run, not a trend.
If you need a simple trend filter, align the breakout with your higher timeframe direction using a moving average, see moving average setups.
Pair Selection: Majors vs Crosses vs Exotics
Your pair choice decides your costs and your fill quality. Breakout edges are small. Spreads and slippage can erase them.
- Majors. Tight spreads. Deep liquidity. Cleaner fills. Best for tight stop breakouts.
- Crosses. Wider spreads. More irregular moves. Breakouts can travel, but fake outs increase. Use wider stops and smaller size.
- Exotics. Large spreads. Gaps. Sudden spikes. Stops slip. Many breakouts look great on charts and trade poorly live.
Match the pair to the session. Trade EURUSD and GBPUSD around London and the overlap. Trade USDJPY and AUDUSD when their home markets drive flow. Avoid thin pairs during off hours if your plan needs tight execution.
Calendar Sensitivity: How Scheduled News Changes Reliability
Scheduled news can create the strongest breakouts and the worst traps. Your job is to know which one you are trading.
- High impact releases. CPI, NFP, rate decisions, pressers. Expect spread widening, slippage, and fast reversals.
- Pre news compression. Price often tightens into the event. Levels look perfect. That does not mean they will hold.
- First spike risk. The initial move often hits stops on both sides. The real direction may show after the first pullback.
Pick one approach and stay consistent. Either stand aside until the first post news retest, or trade it with wider stops, smaller size, and a plan for slippage. Do not judge a breakout system on news candles unless you always trade news.
How to Identify High-Quality Breakout Levels
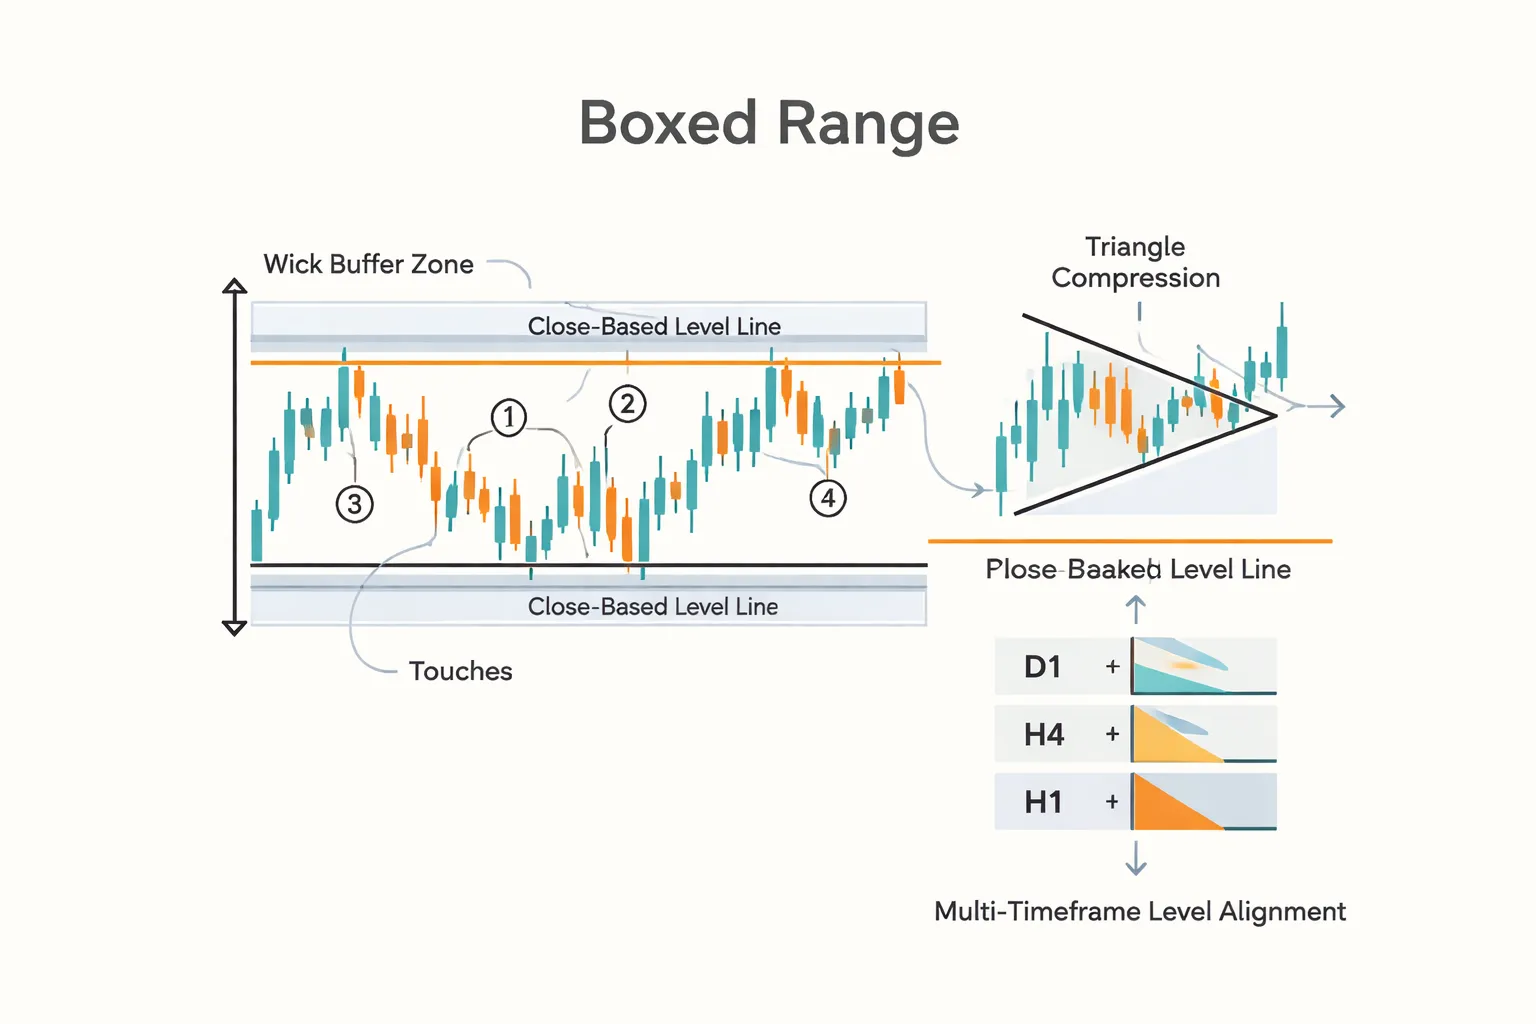
Drawing rules for clean levels, touches, wicks, and closes
Your breakout level must come from obvious order flow. Keep it simple and repeatable.
- Start with closes. Mark the price where candles repeatedly close and stall. Closes show acceptance.
- Use wicks to define the buffer. If wicks keep piercing but closes hold, treat the level as a zone. Draw the core line at closes, then note the wick extremes as your noise band.
- Count clean touches. Aim for 2 to 4 clear reactions. More than that can mean the level is getting consumed.
- Reject “one print” levels. A single spike high or low is not a breakout level. It is usually stops.
- Use round numbers last. If a round number aligns with closes and reactions, keep it. If it stands alone, ignore it.
Range quality checklist, duration, symmetry, and boxed price action
High-quality breakout levels come from a range that traps price. You want a box, not a blur.
- Duration. The range should hold long enough to build orders. On H1, that often means 6 to 24+ candles. On H4, 4 to 12+ candles.
- Symmetry. Both sides should show defense. You want swings that reach each boundary and get rejected, not a one-sided drift.
- Boxed action. Most candles should stay inside the range. If many closes sit outside and snap back, the market is already breaking.
- Clear boundaries. The top and bottom should be easy to draw from multiple points. If you need to “best fit” it, skip it.
- Room to run. Check the next obvious level. If it sits too close, your breakout has limited space for follow-through.
Compression signals, triangles, flags, and volatility squeeze patterns
Compression raises breakout odds because it shows agreement tightening before expansion. You want shrinking ranges and reduced follow-through inside the box.
- Triangle. Lower highs and higher lows. Each push travels less distance. Breakouts work best when the final third of the structure forms without messy spikes.
- Flag. A sharp impulse, then a tight channel or small range that holds near the move’s extreme. Avoid wide flags that retrace most of the impulse.
- Volatility squeeze. Candle ranges contract for several bars. Look for smaller bodies, fewer long wicks, and fewer boundary breaches.
- Level interaction improves. In good compression, price respects the boundaries more as time passes. In bad compression, it chops through both sides.
Multi-timeframe mapping, aligning H1, H4, D1 levels without clutter
Map from higher to lower. Your lower timeframe level should make sense inside the higher timeframe structure.
- D1 first. Mark the nearest major swing high and low zones. These define where breakouts tend to fail or accelerate.
- H4 next. Add only the levels that caused strong reactions and that sit close to current price.
- H1 last. Use H1 to refine the exact breakout trigger, usually the range boundary or the last lower high before the break.
- One level per side. If you have three resistance lines within a small band, you do not have clarity. Keep the most defended line and delete the rest.
- Check confluence, then stop. When an H1 level aligns with an H4 or D1 boundary, treat it as higher quality. Do not keep adding lines.
Avoiding messy zones, overlapping levels and high-noise congestion
Messy zones create false breaks and random fills. Filter them out before you plan entries.
- Overlapping support and resistance. If the same band acted as both multiple times in a short window, you are in churn. Avoid breakout trades there.
- Too many wicks through both sides. That shows stop runs, not defense. Your level will not hold cleanly.
- Wide, uneven ranges. If the “range” width varies a lot bar to bar, you cannot place a logical stop or target.
- Mid-range trading. If price spends most time in the middle instead of respecting edges, skip it. Edge behavior drives breakout edge.
- Nearby event risk. If a major release is minutes away, treat all levels as lower quality until after the first post-news retest.
| Level feature | Higher quality | Lower quality |
|---|---|---|
| Touches | 2 to 4 clear reactions at the boundary | Many taps with fading reactions |
| Closes vs wicks | Closes respect the line, wicks form a small buffer | Frequent closes beyond the level |
| Range shape | Boxed, defined edges, consistent width | Blurred edges, uneven width |
| Compression | Ranges contract, fewer boundary breaches | Chop increases, both sides get swept |
| Space to next level | Clear room for price to travel | Next barrier sits close, limits follow-through |
Breakout Trading Strategy Forex Rules (Step-by-Step)
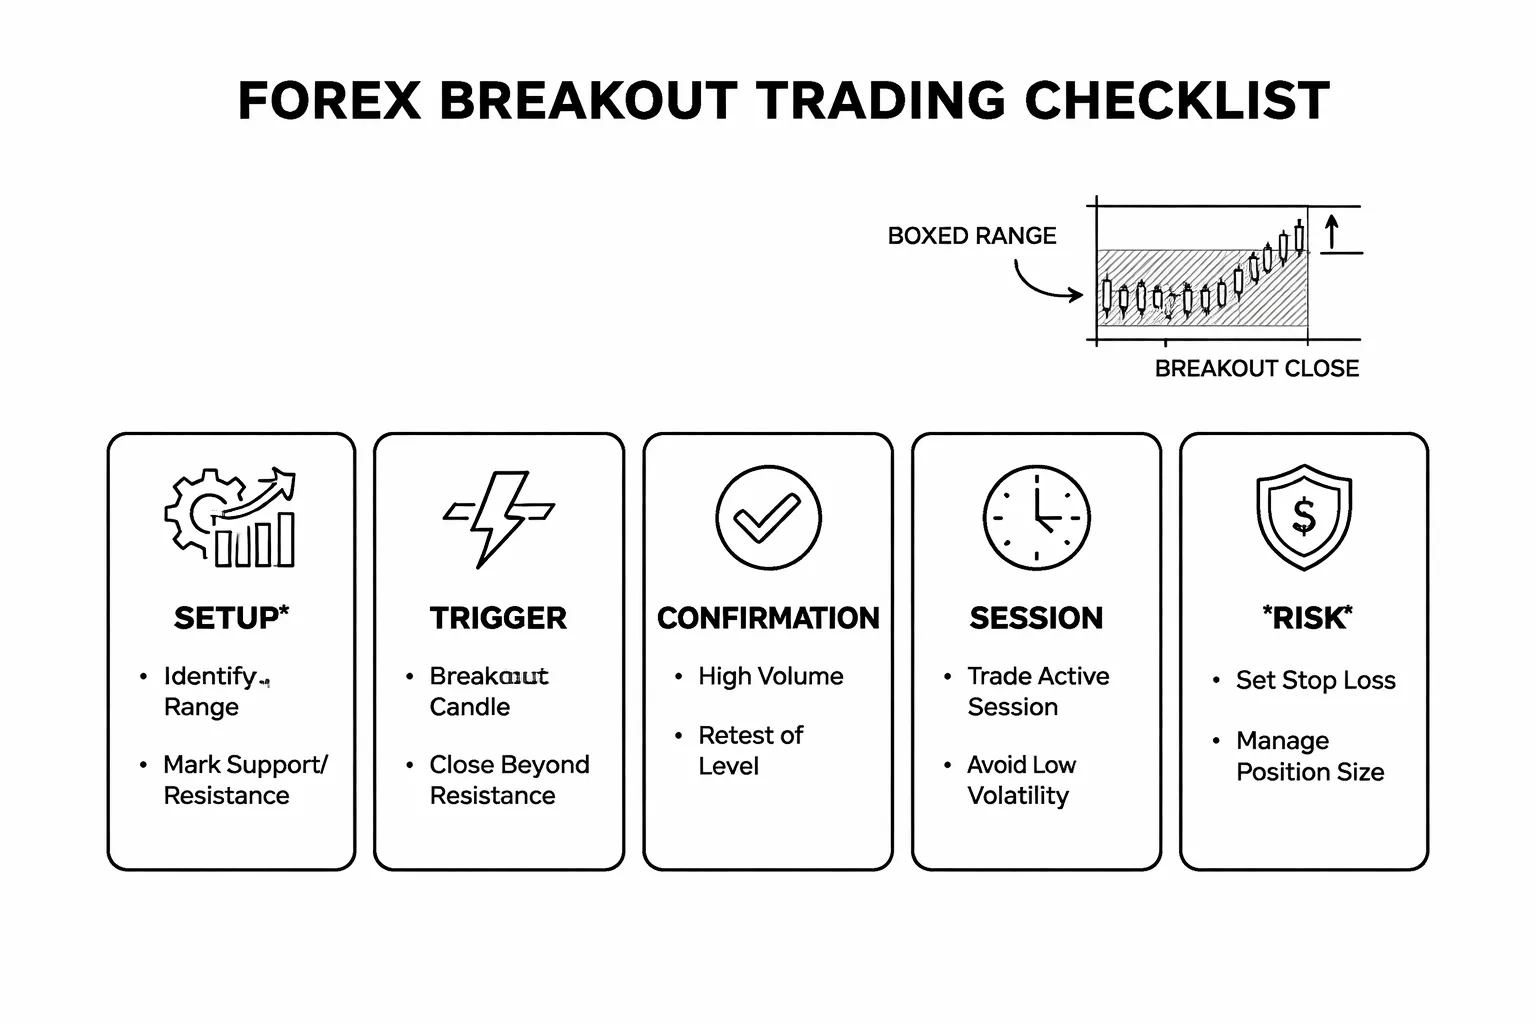
Setup Rules (Define the Range, Boundaries, Invalidation)
You need a clean range before you trade any breakout. If the range is messy, skip it.
- Timeframe: Use one execution timeframe and stick to it. Common picks are M15, H1, H4. Higher timeframes cut noise.
- Range size: Price must respect the same high and low multiple times. Aim for at least 3 touches on each side, or 5 to 8 total swings.
- Range boundaries: Draw your top and bottom at the closes first. Then allow a small wick buffer. Keep the buffer consistent on both sides.
- Range width filter: Avoid tiny ranges. As a baseline, range height should be at least 1.0 to 1.5 times the current ATR(14) of your execution timeframe.
- Space filter: Check the next support or resistance beyond the range. You want room. If the next level sits close, the breakout has poor expectancy.
- Invalidation point: Define the price that proves your breakout read is wrong. Most clean invalidations sit back inside the box, beyond the opposite side of the range or beyond the midpoint, depending on your stop method.
Trigger Rules (What Counts as a Break)
Wicks break levels all day. You trade the move that holds.
- Close rule: Enter only if a candle closes beyond the boundary. This cuts many false breaks.
- Displacement rule: The breakout candle must show expansion. Use a body size filter, not feelings.
- Body filter: Breakout candle body should be at least 50% to 70% of its full range. Small bodies mean hesitation.
- Distance filter: Close should be at least 0.1 to 0.2 ATR beyond the boundary. If it barely closes over, skip it.
- Entry options:
- Close entry: Buy or sell at the close of the breakout candle. Fast, fewer missed moves.
- Stop entry: Place a buy stop a few points above the breakout high, or sell stop below the breakout low. Use a small buffer to avoid spread spikes.
- Retest entry: Wait for price to break, then retest the level from the other side and reject. Slower, often better R:R. If you use this, learn clean rejection candles from your candlestick patterns guide.
Confirmation Rules (Momentum, Volatility, Spread)
You want expansion in price and acceptable trading costs.
- ATR filter: Trade breakouts when ATR(14) is rising versus the last 10 to 20 bars. Flat ATR signals compression without release.
- Range compression filter: The last 5 to 10 candles inside the box should show smaller average ranges than earlier candles in the range.
- Breakout candle range: Breakout candle total range should be at least 1.2 to 1.5 times the median candle range of the prior 20 bars.
- Spread filter: Skip trades when spread is elevated. As a simple rule, spread should be under 10% of your planned stop size.
- News filter: Avoid entering 10 to 15 minutes before high-impact news on either currency. Let the first spike print, then reassess.
Session Rules (When to Trade, When to Stand Down)
Breakouts need participation. Trade during active windows.
- Best windows: London open to London mid-session, and London to New York overlap. These periods often give follow-through.
- Acceptable window: New York morning, before liquidity fades.
- No-trade windows: Late New York, most of Asia for non-JPY pairs, and the rollover period when spreads widen.
- Range-build rule: Let the range form first. Do not force a breakout setup in the first minutes of a session.
- One direction bias rule: If both sides of the range get swept in the last 10 to 20 bars, skip. That is chop, not buildup.
Risk Rules (Position Sizing, Daily Loss, Exposure Caps)
Your edge dies fast if you oversize or overtrade.
- Fixed fractional risk: Risk 0.25% to 1.0% of your account per trade. Pick one number and keep it constant.
- Hard stop placement options:
- Structure stop: Stop goes back inside the range, beyond the opposite side of the box. Fewer stop-outs, larger stop.
- Breakout bar stop: Stop goes beyond the low of the breakout candle for longs, or high for shorts. Tighter stop, more stop-outs.
- ATR stop: Stop size equals 1.0 to 1.5 ATR(14) from entry. Use when structure is unclear.
- Max daily loss: Stop trading after 2R lost in a day, or after 2 consecutive full-stop losses. Pick one rule and follow it.
- Exposure cap: Limit correlated exposure. If you trade EURUSD and GBPUSD, treat them as one risk bucket. Cap total open risk at 1.5% to 2.0% across correlated pairs.
- Trade count cap: Max 1 to 3 breakout attempts per pair per session. If it fails twice, the market told you something.
- Order quality rule: If spread, slippage, or execution feels unstable, you reduce size or stand down. Costs kill breakout expectancy.
| Rule Block | Minimum Standard | Skip If |
|---|---|---|
| Setup | Defined box, multiple touches, space to next level | Blurred edges, uneven width, nearby barrier |
| Trigger | Close beyond level plus displacement | Wick-only break, tiny body, marginal close |
| Confirmation | ATR rising, spread acceptable | Flat ATR, spread too wide, high-impact news near |
| Session | London and overlap windows | Rollover, thin hours, repeated sweeps both sides |
| Risk | 0.25% to 1% risk, daily loss cap, correlation cap | Revenge trades, stacking correlated positions |
Entry Techniques: Breakout, Retest, and Pullback Methods
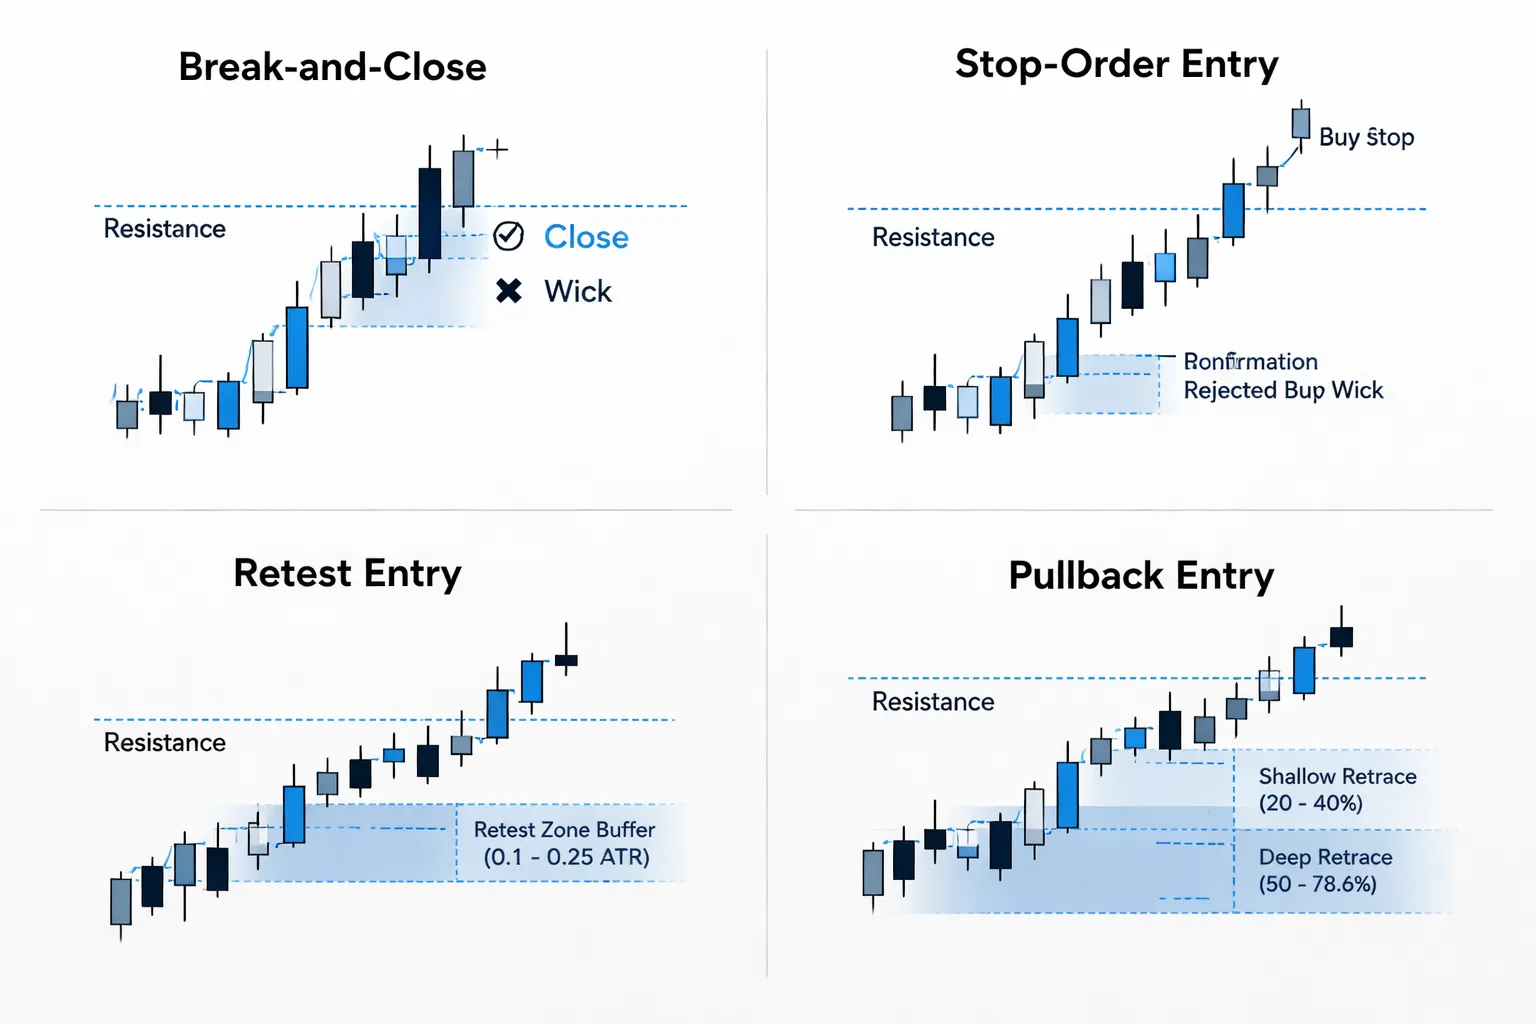
Break-and-close entry, confirmation first
You enter after price breaks the level and closes beyond it. You give up some price. You cut down whipsaws.
- Rule: Wait for a candle close beyond the level, not a wick.
- Rule: Require a minimum close distance, set it as 0.2 to 0.5 ATR(14) beyond the level.
- Rule: Skip breaks that close back inside the range.
- Best use: When the range is clean and price compresses into the level.
- Main risk: Late entry. You reduce R multiple. You still face retest risk.
Execution: place a market order on the next candle open after the confirming close, or use a limit order near the close price if spread stays tight.
Stop-order entry, catch the fast move
You place a buy stop above resistance or a sell stop below support. You get filled during momentum. You must control slippage.
- Placement: Put the stop 1 to 3 pips beyond the level on majors, or 0.05 to 0.10 ATR beyond the level on volatile pairs.
- Filter: Trade only if ATR is rising and spread is within your normal range for that session.
- Slippage control: Avoid news windows. Avoid thin hours. Reduce size if spread expands.
- Cancel rule: If price repeatedly tags the level without breaking, cancel the stop. Each touch burns liquidity.
If you need a quick refresher on stop and limit mechanics, see forex order types.
Retest entry, use the level as a decision point
You let price break the level, then come back to test it. You enter on the hold. You trade structure, not speed.
- Requirement: The breakout candle must close beyond the level with a real body. Avoid wick breaks.
- Retest zone: The old level plus a buffer of 0.1 to 0.25 ATR.
- Trigger: Enter after a rejection close from the retest zone, or after a lower timeframe break of retest structure.
- Invalidation: A close back inside the range. Treat it as failed breakout.
- Benefit: Better stop placement. Often higher R multiple than break-and-close.
- Cost: You miss some trades because strong breakouts never retest.
Pullback method, depth tells you what you have
Pullbacks happen after the break, often after a brief extension. Depth matters. It signals strength or weakness.
- Shallow pullback: 20% to 40% retrace of the breakout impulse, or holds above the broken level with small candles. This often signals strength. You can enter earlier with tighter stops.
- Deep pullback: 50% to 78.6% retrace, or a full return into the old range. This often signals weak demand or supply. You need stronger confirmation, or you skip it.
- Time filter: If price spends too long grinding at the level, momentum is gone. Reduce size or stand aside.
- Trigger idea: Enter on the first higher low after a bullish breakout, or first lower high after a bearish breakout, as long as the level still holds.
Scaling approaches, add only after proof
Scaling can help. It can also compound errors. Keep rules tight.
- Partial entry: Take 30% to 50% on the break-and-close. Add the rest on the retest hold. Your first fill gets you in, your second fill demands confirmation.
- Pyramiding: Add only after price makes a new structure break in your direction and your stop is at breakeven or better.
- Risk cap: Keep total risk on the idea fixed. If you add size, you must tighten the stop or reduce initial size.
- No averaging down: Do not add while price sits back inside the range. That is not a breakout trade anymore.
| Method | What you need | What you avoid |
|---|---|---|
| Break-and-close | Close beyond level, minimum distance, acceptable spread | Wick breaks, marginal closes, range re-entry |
| Stop-order | Rising ATR, clean level, slippage plan | News spikes, repeated level tags, thin sessions |
| Retest | Strong breakout close, hold of level with buffer | Late chases, weak momentum, failed retests |
| Pullback | Depth rules, structure trigger, time filter | Deep retrace into range, slow grind, impulse fade |
Stop-Loss Placement for Forex Breakouts
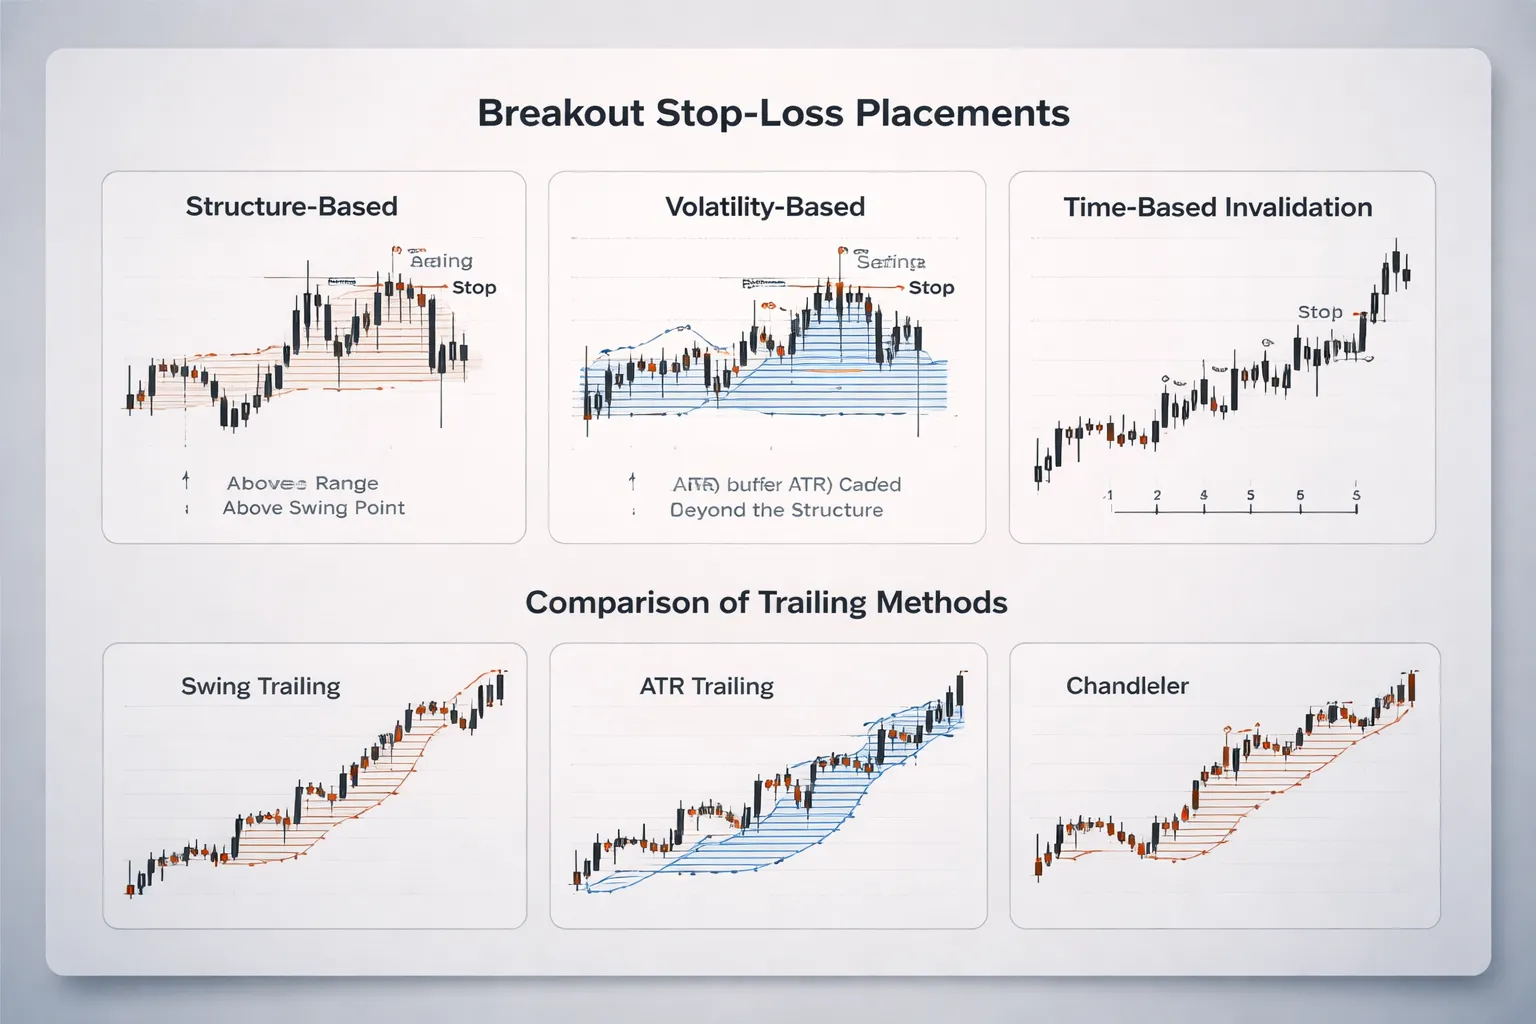
Structure-based stops
Your stop goes where your breakout idea fails. Use structure first. Volatility comes second.
- Beyond the range boundary: Put the stop outside the broken level, not on it. Add a buffer so normal noise does not tag you.
- Beyond the last swing: If you enter on a retest or pullback, the prior swing low, for longs, or swing high, for shorts, is your key invalidation. If price breaks that swing, the breakout has lost structure.
- Outside the whole box: Tight boxes need wider stops. If the range is small, a stop just inside the range invites stop runs and spread hits. Place it past the opposite side only if your plan expects a full range failure, and your position size can handle it.
Rule you can follow. If your stop sits at the exact level everyone sees, it is too close.
Volatility-based stops
Breakouts expand range. Your stop must respect current volatility.
- ATR multiple: Use a fixed fraction or multiple of ATR as your buffer beyond structure. Common ranges are 0.5 ATR to 1.5 ATR depending on timeframe and pair.
- Adaptive buffer: Increase your buffer when ATR rises into the breakout. Reduce it when ATR compresses and the market stays orderly.
- Match stop to setup type: Stop-order entries need bigger buffers. Retest and pullback entries can use tighter structure stops, since you enter closer to invalidation.
Do not set ATR stops in a vacuum. Anchor them to a level that matters, then add ATR as padding. If you need a refresher on volatility stops, see the ATR stop loss guide.
Time-based invalidation
Some breakouts do not fail fast. They stall. You still need an exit.
- Time limit after entry: If price does not move away from the level within a set number of candles, exit. Stalls often roll back into the range.
- No follow-through rule: If you get one breakout candle, then several small candles with overlap near the level, treat it as loss of momentum. Cut the trade before your hard stop.
- Retest deadline: For retest entries, if the retest drags on and keeps tagging the level, the edge drops. Exit or reduce size.
Pick the time rule before you enter. Enforce it the same way you enforce a stop.
Handling spread and stop hunts
Stops fail when you place them where the market can hit them without invalidating your idea.
- Use the right price: For long trades, your stop triggers on the bid. For short trades, it triggers on the ask. Account for that when you set the level.
- Place stops past liquidity: Highs and lows around the level attract sweeps. If your stop sits just beyond the obvious swing, you will get tagged. Push it to the point where a sweep would also break structure.
- Add session-aware buffers: Spreads widen in rollovers and thin sessions. Either widen your stop, reduce size, or skip the trade.
- Use invalidation, not pain: Do not move a stop because it feels close. Move it only if your original invalidation point changes.
Trailing methods
Trail only after the trade proves itself. Breakouts can snap back early.
- Swing trailing: Trail under higher lows in an uptrend, or above lower highs in a downtrend. This fits clean trend breakouts. It keeps you in the move, but it gives back more on reversals.
- ATR trailing: Trail at a fixed ATR distance from price or from a moving reference like the close. This adapts to volatility. It can cut winners early when ATR expands.
- Chandelier-style logic: Trail from the highest high since entry minus X ATR for longs, or lowest low plus X ATR for shorts. It works well in strong trends. It fails in choppy breakouts.
Pick one trailing method per system. Do not mix rules mid-trade.
Take-Profit Models and Trade Management
Measured Move Targets
Breakouts often travel a distance linked to the prior range. You can plan targets before you enter.
- Range height projection: Measure the consolidation height, project it from the breakout level. Example, a 60 pip range, breakout above the top, target +60 pips.
- Half and full measured moves: Use 0.5x and 1.0x range height as preplanned objectives. Take partial at 0.5x, aim the rest at 1.0x, if your system allows scaling.
- Market structure targets: Use the next swing high or low, weekly level, or prior supply and demand zone as the first target. These levels often act like magnets, then reject price.
- Confluence rule: If measured move and structure sit close, treat it as a higher quality target. If they conflict, prioritize the nearer one for first profits.
Do not stretch targets to “make” the trade work. If the closest structure sits inside your planned R, the market may not pay you.
R-Multiple Planning for Breakouts
Plan targets around R, your initial risk. Breakouts do not pay evenly. Many fail fast, a few trend far.
- Set a minimum payout threshold: If your testing shows your system needs 1.5R average win, do not take trades that cannot realistically reach 1.5R before major structure.
- Use a two-bucket plan: Take a “base hit” target at 1R to 2R, then leave a runner for outliers. This fits the fat-tail nature of breakout winners.
- Match target to breakout type: Tight range breakouts often deliver quick 1R to 2R moves, then stall. Large base breakouts can justify 2R to 4R planning.
- Do not change R mid-trade: Your stop defines R. If you widen the stop after entry, you destroy your expectancy math.
If you need a refresher on how stops and targets work together, read stop loss vs take profit.
Partial Profits and Break-Even Rules
Scaling out and moving to break-even can reduce drawdowns. It can also cut your best trades.
- Partial profits, pros: You lock gains in choppy markets. You reduce emotional pressure. You improve streak survival.
- Partial profits, cons: You cap upside. You lower average win. You may need a higher win rate to compensate.
- Common partial plan: Take 50 percent off at 1R, move stop to entry or to a reduced-loss level, trail the rest with your chosen method.
- Break-even, pros: It cuts large losses from late reversals. It protects you during news spikes.
- Break-even, cons: It increases scratch trades. It often stops you out before the real move starts.
Common mistakes are predictable.
- Moving to break-even too early, like at +0.3R to +0.7R. Breakouts retest. You get clipped.
- Taking partial profit because of fear, not because your plan says so.
- Using partial profit to “justify” poor entries. Fix entries instead.
Managing Runners in Trends
Your runner pays for the many small losses that breakouts produce. You need rules that keep you in trends.
- Pick one exit engine for the runner: a swing-low trail, an ATR trail, or a chandelier trail. Keep it consistent.
- Use add logic only if you test it: Add after a clean consolidation and second breakout, or after a pullback holds above the breakout level. Risk on adds should come from open profit, not fresh account risk.
- Account for volatility expansion: After the break, ATR can expand. If you use an ATR-based trail, expect wider swings. If your trail tightens during expansion, you will exit the trend early.
- Define a trend continuation filter: Examples, price stays above the breakout level for longs, or above a rising short-term moving average. Keep the filter simple.
A runner plan should accept giveback. If you cannot handle giveback, do not pretend you run runners.
When to Exit Early
Early exits protect you from failed breakouts. They also create churn if you fire them too often. Use clear triggers.
- Failed follow-through: Price breaks out, then closes back inside the range within 1 to 3 candles on your trading timeframe. Treat it as failure. Exit at market or on the next liquidity pocket, based on your rule.
- Hard rejection candles: A strong reversal candle at the breakout level, with a close back inside the range, signals trapped traders. Exit if your stop sits too far to wait it out.
- Time stop: If price does not reach at least +0.5R within N candles, exit. Stagnant breakouts often roll over.
- News-driven reversal: If a scheduled release hits and price snaps back through the level with force, do not “hope.” Follow your failure rule.
Re-entry needs structure. Do not revenge trade the same level.
- Re-entry rule 1: Only re-enter after price reclaims the breakout level and closes outside the range again.
- Re-entry rule 2: Require a fresh setup, like a retest hold, a new micro-range, or a higher low for longs.
- Re-entry rule 3: Keep risk fixed. Do not increase size to “get it back.”
Common Breakout Traps (and How to Avoid Them)
False Breakouts and Liquidity Sweeps
Many breakouts fail because price hunts stops first. It pushes through the level, triggers orders, then snaps back into the range.
Common signs of a stop run
- Fast push through the level, then an immediate close back inside the range.
- Long wick beyond the range edge, small body, and poor follow-through on the next candle.
- Breakout happens after a slow grind into the level with no pullbacks. Orders stack. Stops sit close.
How to avoid it
- Wait for a close outside the range, not a poke. If your plan uses candle closes, follow it every time.
- Use a retest entry when conditions look “sweep-like”. Let price come back to the level, then hold.
- Place your stop where the idea breaks, not where the crowd puts it. If your stop sits on the obvious swing, you sit in the sweep zone.
- Track failure rate by session and pair. If a level gets swept often in that window, tighten your rules, not your stop.
News-Spike Breakouts
News can create a breakout that looks clean and trades dirty. Spread jumps. Slippage rises. The first move often reverses.
Two types of news moves
- Noise spike: A fast wick through both sides, then price returns to the prior range. You get filled at the worst price.
- Repricing: Price breaks, holds outside, then builds a new range above or below the old one.
How to avoid it
- Do not place breakout stops seconds before high impact releases. You hand control to spread and slippage.
- Require a post-news close and a hold. If price cannot hold outside the level after the first impulse, skip it.
- Reduce size or skip the trade if your stop distance must expand to survive spread. Your risk must stay fixed.
Low-Liquidity Traps: Rollover, Holidays, Thin Sessions
Thin liquidity creates fake breaks. Price moves far on little order flow. Then it snaps back when liquidity returns.
High risk windows
- Rollover and the minutes around it.
- Major holidays and half-days.
- Late Friday and early Monday.
- Session gaps where your pair has low participation.
How to avoid it
- Trade breakouts when your pair has real participation. Match pairs to their active sessions.
- Demand stronger confirmation in thin periods. Close outside plus retest hold, not just a single candle.
- Widening spread is a filter. If spread expands relative to normal, treat every breakout as lower quality.
“Too Obvious” Levels and Crowded Trades
The clearest level on the chart attracts the most orders. That also attracts the most stop hunting and profit taking. The first break can fail because it provides liquidity for larger players.
What “crowded” looks like
- A level that has been respected many times and sits in clear view on higher timeframes.
- Price compresses into the level with small candles and no pullbacks. Breakout traders stack. Stops tighten.
- The breakout candle is large, then the next candle stalls or prints back inside the range.
How to avoid it
- Prefer the second opportunity. Let the first break happen, then trade the reclaim and retest.
- Use a buffer. Define your breakout line with the range edge plus a small margin based on recent volatility.
- Require structure after the break. A new micro-range, a higher low for longs, or a lower high for shorts. If you do not get it, you do not have control.
Range Drift and Expanding Ranges
Your box can become invalid before it “breaks.” Ranges drift. Volatility expands. Old boundaries stop acting like boundaries.
Signs your range is no longer a range
- Range highs and lows start stepping in one direction. You see higher lows and higher highs inside the box.
- The range width expands over time. Each swing gets larger than the last.
- Closes start happening near the edges, not the middle. Price stops mean-reverting.
How to avoid it
- Redraw the range using the most recent swings. Old levels lose relevance when volatility regime changes.
- Set a time limit on your setup. If price takes too long, cancel the order and reassess.
- Use a volatility filter. If current average candle size rises sharply versus the range-building phase, expect more fake breaks and larger stops.
- Anchor your bias to what price is doing now. If the structure shifts into a trend, switch from “box breakout” rules to trend pullback rules. Use a simple moving average filter if you need one. See this moving average strategy.
| Trap | What it looks like | Rule that saves you |
|---|---|---|
| Liquidity sweep | Wick through level, close back inside, reversal | Wait for close outside, then retest hold |
| News spike | Spread jump, slippage, spike then fade | Trade after the dust settles, require hold |
| Thin liquidity | Random breaks, fast snapbacks | Trade active sessions, raise confirmation |
| Crowded level | Obvious line, compression, first break fails | Prefer reclaim setup, use volatility buffer |
| Range drift | Stepping swings, expanding width | Redraw, set time limit, filter volatility |
Filters and Confluence Tools (Without Overfitting)
Filters and Confluence Tools (Without Overfitting)
Filters should do one job, remove bad trades. Keep them few. Define them in numbers. Test them on at least 50 to 100 examples per pair and session. If a filter cuts your trades in half but does not lift expectancy, drop it.
- Use 1 trend filter, 1 momentum check, 1 volatility gate.
- Skip stacking similar signals. Three momentum tools often say the same thing.
- Lock inputs. Do not change settings per pair to “make it fit”.
Trend Filter Options
Trade breakouts in the direction of the higher-timeframe bias. You will face fewer snapbacks and fewer “first break fails” moves.
- Higher-timeframe bias: Use H4 or Daily.
- Longs only if price closes above the HTF swing midpoint or last major swing high.
- Shorts only if price closes below the HTF swing midpoint or last major swing low.
- Alternate rule, use HTF close vs HTF 20 EMA, above for longs, below for shorts.
- Moving average slope: Use one MA, one timeframe.
- Example: 50 EMA on H1.
- Longs only if the EMA rises for the last 10 bars.
- Shorts only if the EMA falls for the last 10 bars.
- Flat slope means range conditions, expect more fakeouts.
Momentum Confirmation
A breakout needs force. You want a shift in regime, not a slow drift through a line.
- RSI regime: Use RSI(14) on your entry timeframe.
- Long breakouts, RSI holds above 50 after the break.
- Short breakouts, RSI holds below 50 after the break.
- Stricter option: long only if RSI prints 55 or more on the breakout close, short only if RSI prints 45 or less.
- MACD impulse: Focus on direction, not fancy crosses.
- Long breakouts, MACD line above signal and histogram above zero on the breakout close.
- Short breakouts, MACD line below signal and histogram below zero on the breakout close.
- Candle displacement: Use price itself as the confirmation.
- Breakout candle closes outside the level by at least 0.2 to 0.3 ATR(14).
- Body is at least 60% of the candle range.
- Close near the extreme, top 25% for longs, bottom 25% for shorts.
Volatility Filters
Breakouts fail when volatility is dead or when it is chaotic. You want enough movement to follow through, not so much noise that stops get clipped.
- ATR thresholds: Use ATR(14) on the entry timeframe.
- Set a minimum ATR so the pair can pay your stop and target.
- Rule: skip trades when current ATR is below its 20-bar median.
- Also cap extremes: skip when ATR is above 1.8 to 2.0 times its 20-bar median, this is often news spillover.
- Bollinger Band squeeze: Use BB(20, 2).
- Trade after contraction, not during random chop.
- Simple rule: bandwidth is in the lowest 20% of the last 120 bars, then break and close outside the band in your direction.
- Do not tune the percentile per pair, pick one and keep it.
- Keltner channels: Use KC(20, 1.5 ATR) as a “real move” check.
- Long breakout confirms when price closes above the upper Keltner.
- Short breakout confirms when price closes below the lower Keltner.
- If price breaks your level but stays inside the Keltner, treat it as weak.
Market Structure Confluence
Structure keeps you aligned with the path of least resistance. It also tells you when a “breakout” is just range drift.
- Higher highs and higher lows: Only take upside breakouts when your last two swings show HH and HL on the entry timeframe, or one timeframe higher.
- Lower highs and lower lows: Only take downside breakouts when your last two swings show LH and LL.
- Breakout direction alignment:
- Upside breakouts work best when the range sits under resistance but forms higher lows.
- Downside breakouts work best when the range sits above support but forms lower highs.
- If swings expand both ways, treat it as unstable, reduce size or skip.
- Retest behavior: A clean retest should hold with small overlap. Deep retests into the range signal a trap.
Correlation and USD Exposure
Breakout systems can cluster risk. You can “diversify” into five trades and still place one USD bet.
- Track your base and quote exposure: If you buy EURUSD and GBPUSD, you short USD twice.
- Avoid accidental concentration:
- Limit to one or two trades that share the same driver.
- If you already hold a USD short, skip the next USD short breakout unless it is your best setup of the week.
- Use correlation as a filter, not a signal: If two pairs show strong positive correlation, treat them as one trade for risk purposes. For a deeper guide, see forex correlation explained.
- Cap total risk: If two positions share exposure, split your normal risk across them. Do not stack full risk on each. Tie this to your rules in your risk management plan.
3 Practical Forex Breakout Setups You Can Start With
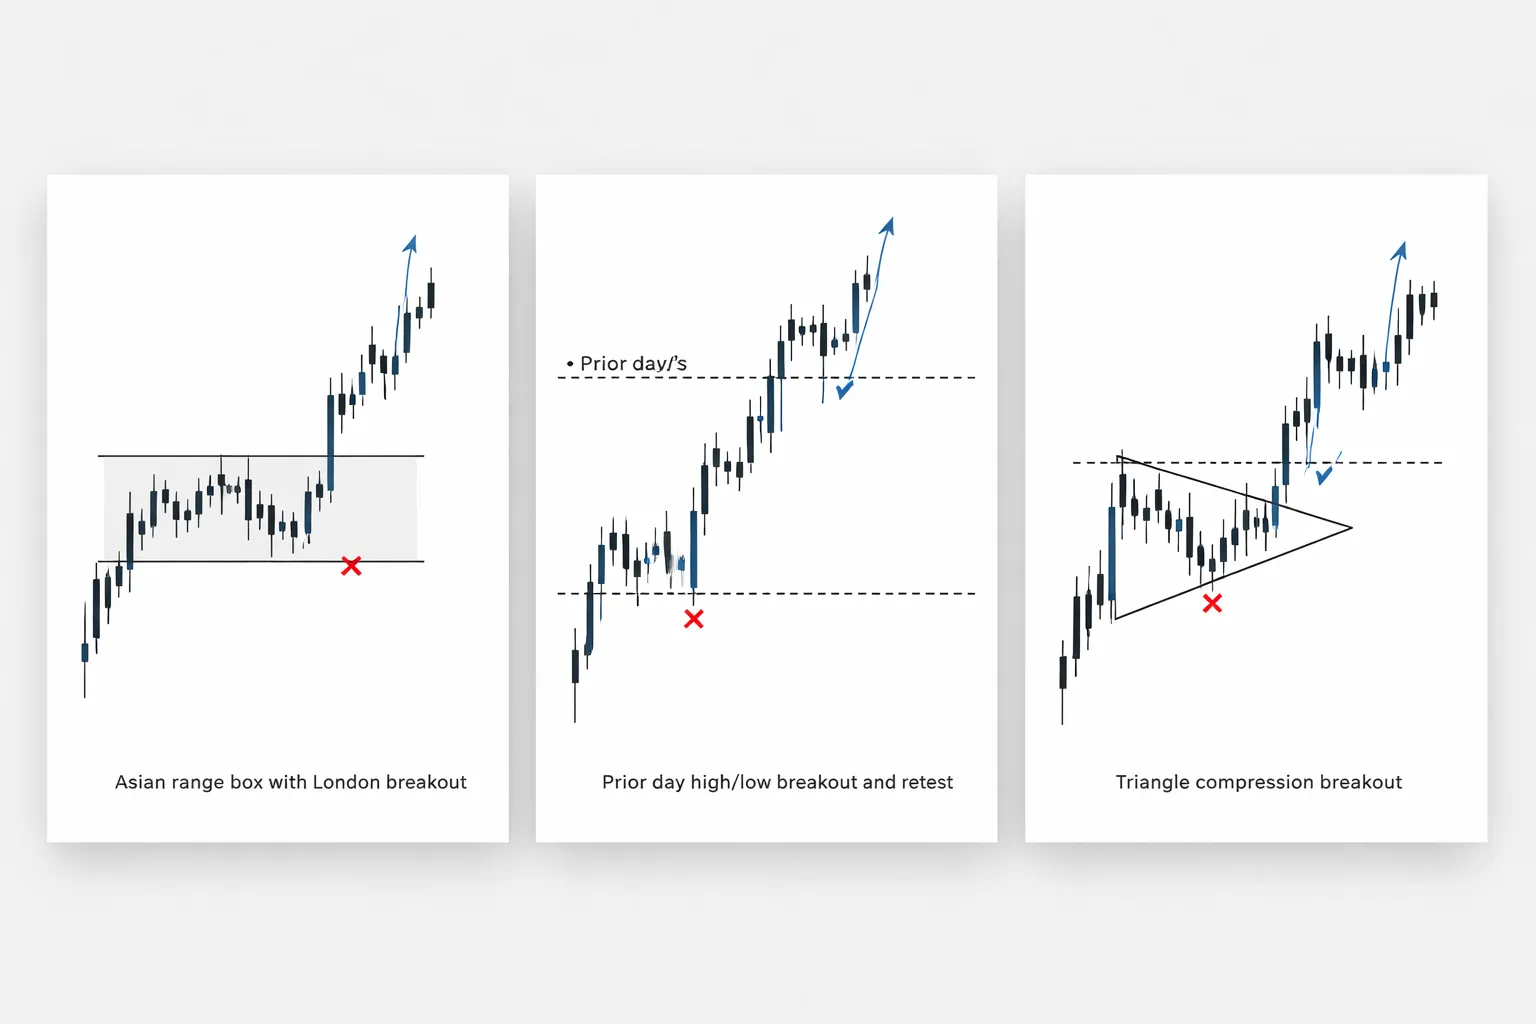
1) London session range breakout (box breakout)
This setup targets the first real expansion after the Asian range and the London open. You define a box, then you trade the break.
- Markets: EURUSD, GBPUSD, USDJPY, EURJPY. Avoid thin crosses.
- Timeframe: 5 minute or 15 minute for execution. Use 1 hour to check context.
- Box definition: Use the Asian range high and low. A practical default is 00:00 to 06:00 London time. Mark the high and low. That is your box.
- Trade window: Only take breaks from 07:00 to 10:00 London time. Skip late breaks. Skip if major GBP or EUR news hits in the next 30 minutes.
- Entry rule: Wait for a candle to close outside the box. Enter on the next candle if price holds outside the level. No entries on a wick break.
- Stop loss: Put the stop on the other side of the box, plus a small buffer. If the box is very wide, use the last swing inside the box, but keep the stop outside the level that broke.
- Take profit: First target at 1R. Move stop to breakeven only after 1R prints. Second target at 2R, or trail behind the last two candle lows or highs on the execution timeframe.
- Skip rules: Skip if the box is too tight and spreads take a big share of the range. Skip if the box is too wide and your stop needs to exceed your max planned risk.
Common trap: You chase the first spike at the open. You fix this by requiring a close outside the box, then a hold. That one rule removes many false breaks.
2) Daily high and low breakout (prior day levels)
This setup uses the previous day high and low as clean, repeatable breakout lines. You trade the first confirmed break during liquid hours.
- Markets: Major pairs. This works best where liquidity stays consistent.
- Levels: Mark yesterday high and yesterday low. Do not add more lines.
- When to trade: London and early New York. Avoid the last hours of New York where follow through drops.
- Confirmation rules:
- Require a candle close beyond yesterday high or low.
- Require the close to be at least a small distance beyond the level, not a 1 pip edge. Use a buffer that matches the pair’s spread and normal noise.
- Optional filter, use RSI for momentum confirmation, align it with your rules from how to use RSI the right way.
- Entry choices:
- Aggressive: enter on the close.
- Conservative: enter on a retest of the broken level, then a rejection back in the breakout direction.
- Stop loss: Place the stop back inside yesterday range, beyond the broken level. If you enter on a retest, the stop goes beyond the retest swing.
- Take profit: Target 1R into the first obvious liquidity area, then 2R if momentum holds. Do not aim for huge multiples on a day where the pair already printed most of its typical daily range.
- One trade rule: Take the first clean break of the day. Do not keep trading each re break. Chop increases after the first failed attempt.
Common trap: You trade a break after a trend day where the market already moved far. You fix this by checking if price already traveled an unusually large distance for the day before the break. If it did, you reduce size or skip.
3) Triangle or flag breakout (compression to expansion)
This setup trades a coil, then a release. You need clean structure. You also need a clear invalidation point.
- Where it works: After a strong impulse move, then a pause. Flags and triangles that form in the middle of a range fail more.
- What to draw:
- For a triangle, connect at least two swing highs and two swing lows. Lines must converge.
- For a flag, draw a tight channel against the impulse. Keep it compact.
- Compression checklist:
- Swings get smaller. Wicks do not keep expanding.
- Price respects both pattern borders. Few random pierces.
- The pattern forms in a reasonable number of candles, not a long drift.
- Breakout trigger: Take the break only after a candle close outside the pattern boundary. If the close is weak and sits on the line, do nothing.
- Entry options:
- Close entry: enter on the close if the candle closes well beyond the line.
- Retest entry: enter after price retests the broken line and holds.
- Stop loss: Put the stop on the other side of the pattern, or beyond the last swing inside the pattern. Your stop must sit where the pattern is clearly invalid.
- Targets:
- First target at 1R to pay for the trade.
- Second target at 2R.
- Optional measured move: project the height of the pattern at its widest point and use it as a stretch target, but only if momentum stays strong.
- Invalidation: A close back inside the pattern after the breakout, plus failure to reclaim the breakout side, is a warning. A push to the opposite boundary kills the setup.
Common trap: You draw messy patterns and call them triangles. You fix this by enforcing structure rules. If you cannot connect clean swings, you do not have a trade.
Risk Management and Position Sizing for Breakout Traders
Position Sizing With Pip Value
Your edge means nothing if your size breaks you. Fix your risk per trade first. Then build your position from the stop distance and pip value.
Step 1. Set cash risk. Risk = Account balance × Risk %.
Step 2. Measure stop in pips. Use your planned stop, not what you hope will hold.
Step 3. Convert to position size.
Units = Risk ($) ÷ (Stop pips × Pip value per unit)
Shortcut using standard lots:
Lots = Risk ($) ÷ (Stop pips × Pip value per lot)
- For most USD quoted majors (EURUSD, GBPUSD), pip value is about $10 per standard lot per pip.
- For JPY pairs, one pip is 0.01. Pip value per standard lot is still about $9 to $10, but it moves with price and USDJPY.
Example 1, EURUSD. Account $10,000. Risk 1% = $100. Stop 25 pips. Pip value $10 per lot.
Lots = 100 ÷ (25 × 10) = 0.40 lots.
Example 2, GBPUSD. Account $5,000. Risk 0.5% = $25. Stop 40 pips. Pip value $10 per lot.
Lots = 25 ÷ (40 × 10) = 0.0625 lots. Round down to your broker step size.
Spread, Slippage, and Gap Risk in FX
Breakouts fail fastest when you ignore trading costs and execution.
- Spread. Your entry pays it. Your stop pays it. If your stop is tight, spread can turn a valid trade into a stop-out.
- Slippage. Breakouts trigger in fast moves. Stops can fill worse than planned. Treat news spikes as a different strategy.
- Weekend gaps. FX gaps on reopen. A stop is not a guarantee. If you hold risk through Friday close, size down.
Cost-aware stop sizing. Add a buffer for friction.
- Effective stop (pips) = Planned stop + Spread + Slippage allowance.
Example. Planned stop 18 pips. Spread 1.2 pips. Slippage allowance 1.8 pips.
Effective stop = 21 pips. Use 21 pips in your position size formula.
Gap rule. If you hold over a known risk window, cap exposure by reducing risk per trade, or close before the window. Do not rely on stops.
Expectancy Math and Why Breakouts Feel Streaky
Breakout systems often cluster wins and losses. You get clean expansions, then you get chop. Your job is to survive the chop.
Track results in R. R is your risk per trade. If you risk $100, then +1R is +$100, and -1R is -$100.
Expectancy per trade (in R) = (Win rate × Avg win R) − (Loss rate × Avg loss R)
- Loss rate = 1 − Win rate.
- Avg loss R should stay near 1R if you respect stops.
Example. Win rate 38%. Avg win 2.4R. Avg loss 1.0R.
Expectancy = (0.38 × 2.4) − (0.62 × 1.0) = 0.912 − 0.62 = 0.292R per trade.
That edge still produces long losing runs. Plan for it.
- Lower win rate systems need larger average wins. Protect that by avoiding early exits that cut winners.
- If your average win falls, expectancy collapses fast. Fix exits before you increase size.
Drawdown Control Rules
You need hard limits. You also need a reset plan. This prevents one bad session from turning into a week of revenge trades.
- Daily stop. Stop trading after -2R to -3R on the day, or after two consecutive full-stop losses. Pick one rule and keep it.
- Weekly stop. Stop trading after -5R to -8R on the week. Resume only after a review of every trade.
- Cooling-off rule. After you hit a stop limit, take the next session off, or trade half size for the next three trades.
- Chop filter. If you get three failed breakouts in the same pair and session, stop trading that pair for the day.
If you struggle to follow these rules, you are likely overtrading. Use this guide on how to avoid overtrading and lock in a hard cap.
Journal Fields That Matter
Generic notes do not improve results. Record fields that explain why breakouts work, and why they fail.
- Breakout type. Range high or low, triangle, flag, opening range, prior day high or low.
- Session. Asia, London, New York, overlap. Note if entry happened near a major fix or data release.
- Volatility regime. Expanding or contracting. Use a simple tag like ATR rising, ATR flat, ATR falling.
- Trigger quality. Close beyond level, wick beyond level, retest entry, no retest.
- Stop method. Structure stop, ATR stop, time stop.
- Execution. Spread at entry, slippage in pips, limit or market.
- Outcome. Result in R, max favorable excursion in R, max adverse excursion in R.
| Field | What you record | Why it matters |
|---|---|---|
| Breakout type | Range, triangle, flag, ORB | Different patterns have different failure rates |
| Session | Asia, London, NY | Liquidity changes breakout follow-through |
| Volatility regime | ATR rising, flat, falling | Breakouts need expansion to run |
| Outcome | R, MFE, MAE | Shows if exits or entries need work |
Backtesting and Optimizing a Breakout Trading Strategy (Forex)
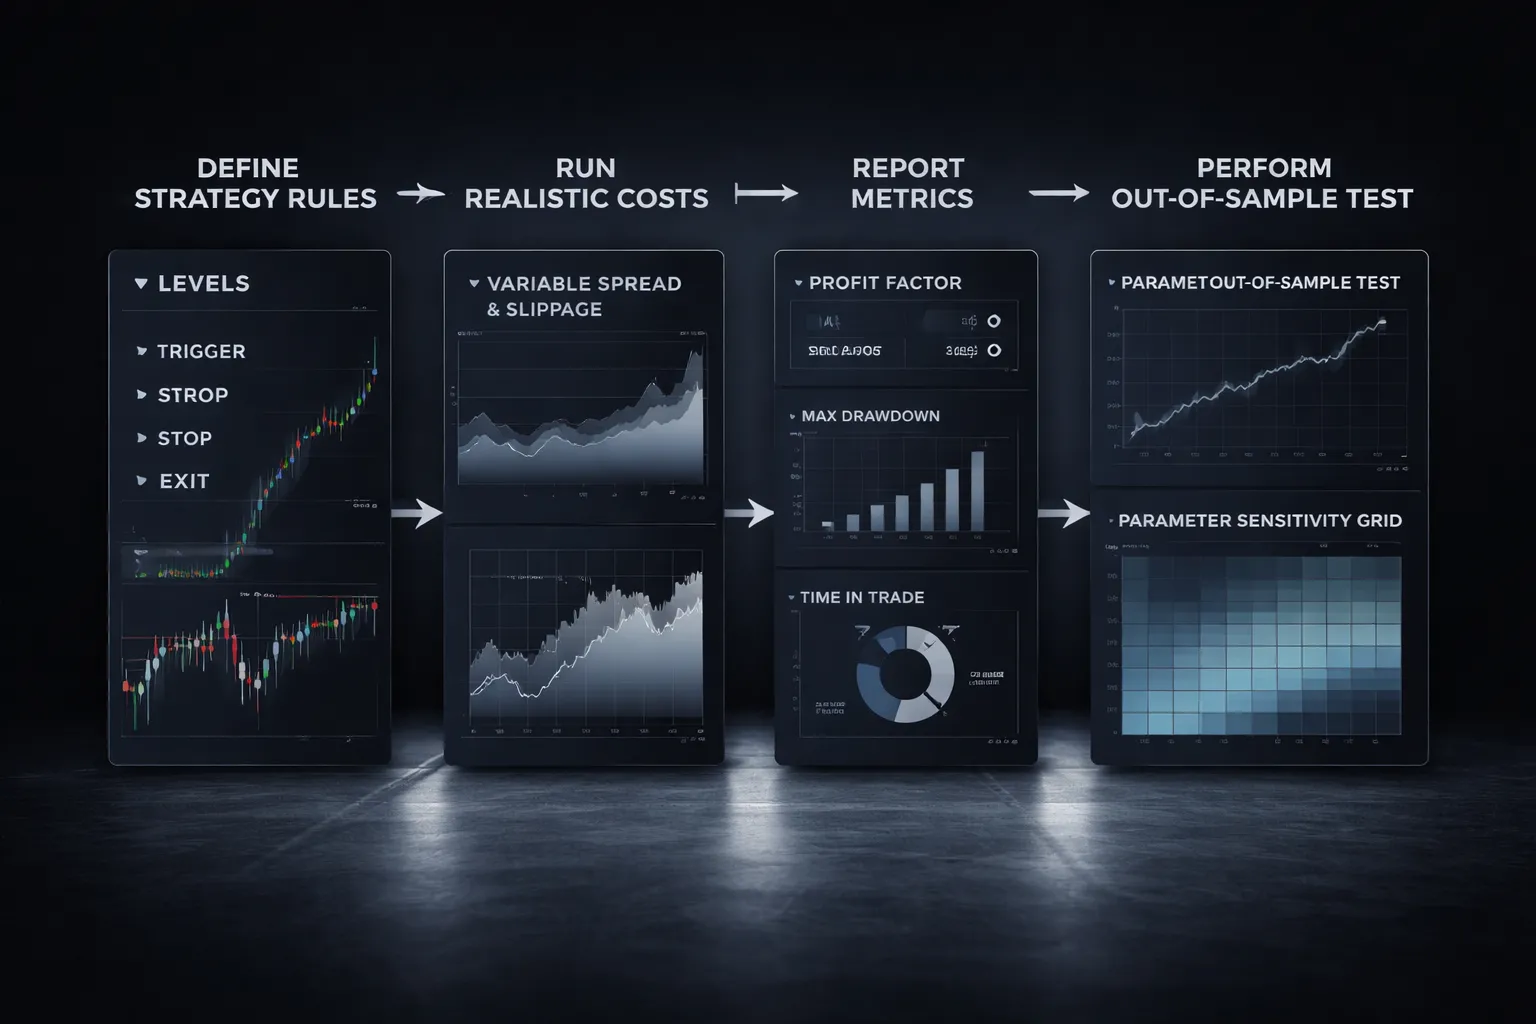
What to Test: Define Levels, Triggers, and Exits in Rules
If you cannot code the rules, you cannot trust the results. Write definitions a script can follow.
- Level definition. Use fixed lookbacks. Example, prior day high and low, Asian range high and low, last 20-bar swing high and low. Avoid hand drawn lines. If you need help standardizing levels, use support and resistance rules that map to clear swing logic.
- Range boundaries. Define when a range starts and ends. Example, Asian range uses 00:00 to 06:00 broker time. ORB uses first 15 minutes of London.
- Breakout trigger. Specify what counts as a break. Example, close above level by X pips, or close above level by 0.2 ATR(14). Do not mix definitions across tests.
- Retest rules. If you trade pullbacks, define max wait time and invalidation. Example, enter on first touch within 10 bars, cancel if price closes back inside range.
- Entry order type. Market at close, stop order above level, limit on retest. Each has different slippage and fill rate.
- Stop placement. Pick one logic and keep it stable. Example, stop at other side of range, or 1.0 ATR, or last swing low. Add a buffer that scales with volatility.
- Exit logic. Test one idea at a time. Fixed R target, trailing stop, partials, time stop, or opposite signal exit. Define the exact trigger, on close or intrabar.
- Trade filters. Keep filters measurable. Example, ATR(14) above its 50-period average, or no trade during red news windows you can timestamp.
Data Realism: Spreads, Commissions, and Execution Assumptions
Breakouts fail fast when costs and fills get ignored. Model the mess.
- Variable spread. Use spread by session and pair. Spread widens in rollovers, news, and illiquid hours. A fixed 1 pip spread will overstate results.
- Commission and swaps. Add round turn commissions. Include swap if you hold past rollover. Some breakout systems look good until swaps hit.
- Slippage. Assume worse fills on stop entries. Add slippage that increases with volatility. Breakout triggers often fire when the book thins.
- Order fill rules. Decide how you handle gaps and spikes. If price jumps over your stop entry, fill at next available price, not your trigger price.
- Bar data limits. Candle data hides the path inside the bar. If your strategy relies on intrabar touches, use tick data or accept that backtests will lie.
- Time alignment. Lock broker time and session boundaries. A one hour shift changes Asian range and ORB results.
Key Metrics to Track
One metric does not protect you. Track a small set that exposes failure modes.
- Expectancy in R. Average R per trade. This lets you compare across pairs and position sizing.
- Profit factor. Gross wins divided by gross losses. Watch for profit factor built on a few outliers.
- Max drawdown. Use peak-to-trough in percent and in R. This tells you if you can survive the system.
- R distribution. Count how many trades land at -1R, small wins, and large wins. Breakouts often depend on the right tail.
- Win rate and average win to average loss. These move together. Do not chase win rate at the cost of payoff.
- MFE and MAE. If MFE stays high but exits give it back, fix exits. If MAE is high before winners run, tighten entries or widen stops.
- Time in trade. Median bars held. Add a time stop test if winners and losers both linger.
- Trade frequency. Trades per week by session. If the edge only shows with heavy filtering, it may vanish live.
Robustness Checks: Out-of-Sample and Parameter Sensitivity
You want stability, not a perfect curve.
- In-sample, then out-of-sample. Build rules on one period, validate on a later period. Do not touch settings after you view out-of-sample.
- Walk-forward testing. Refit on a rolling window, then test the next block. This matches how market conditions shift.
- Parameter sensitivity. Sweep key inputs. Example, breakout buffer from 0.1 to 0.5 ATR, stop from 0.8 to 1.5 ATR, target from 1R to 3R. You want a broad plateau, not a single best point.
- Pair and session diversification. Test on multiple majors and across Asia, London, and New York. A strategy that only works on one pair often rides a specific microstructure quirk.
- Regime split. Separate results by ATR rising versus falling, and by trending versus ranging weeks. A breakout system should degrade in contraction. You want it to degrade slowly.
- Monte Carlo on trades. Shuffle trade order to estimate drawdown ranges. This helps you size risk without relying on a lucky sequence.
Common Optimization Mistakes That Ruin Breakout Systems
- Curve-fitting filters. Adding one more condition often fixes the backtest and kills live trading. If a filter does not improve out-of-sample, delete it.
- Hindsight levels. Marking “obvious” support or resistance after the move bakes in future info. Use level rules that exist before the breakout.
- Using the best session window after the fact. If you pick London because it worked last year, you must confirm it holds in a separate period.
- Optimizing for profit factor only. You can raise profit factor by cutting trade count. Then one bad month breaks the system.
- Ignoring tails. A few large wins often drive breakout expectancy. If your test period misses those runs, you will overestimate stability.
- Changing multiple variables at once. You lose causality. Change one input, measure, then move to the next.
- Over-tight stops to boost win rate. Breakouts need room. Tight stops often turn real breakouts into stop hunts in your results.
| Optimization item | What to do instead |
|---|---|
| Pick the single best ATR buffer | Choose a buffer range that stays profitable across pairs and years |
| Add filters until drawdown disappears | Accept drawdown, then size risk to survive it |
| Manually adjust levels per chart | Use fixed lookbacks and session boundaries |
| Assume perfect fills on stop entries | Model slippage and spread expansion during volatility |
Pros, Cons, and Who This Strategy Is Best For
Pros
- Scales well across pairs. Breakouts rely on structure and volatility, not a pair-specific pattern. With fixed session rules and fixed lookbacks, you can test and deploy the same playbook on multiple majors and crosses.
- Clear invalidation. Your line in the sand is simple. Price breaks the level, triggers you, then must hold. If it snaps back inside the range, you exit or your stop hits. You avoid “hoping” trades back to life.
- Captures momentum fast. When a market leaves a range, it often moves hardest early. A stop entry gets you in during the expansion phase, not after the move cools.
- Rule-driven execution. You can standardize entries, stops, time filters, and news filters. That makes journaling and optimization cleaner.
Cons
- False breaks are common. Many breakouts fail, especially in low liquidity, pre-news chop, and inside large higher-timeframe ranges. You must accept strings of small losses.
- Slippage and spread can erase edge. Breakouts often trigger when spreads widen and quotes jump. Stop entries and tight stops suffer most. Your backtest must model worse fills around volatility.
- Psychological pressure is high. You buy highs and sell lows by design. You will feel late, even when you are early. You also have to re-enter after being faked out, which many traders avoid and miss the real move.
- More platform risk. If your internet or broker feed lags during fast markets, you take the worst fills. The strategy exposes execution weaknesses.
Who This Strategy Is Best For
- You like rules and repetition. You can define levels, set orders, and follow the same checklist daily.
- You tolerate frequent small losses. Your mindset fits a win-rate that can sit near 35% to 55% depending on filters, with larger winners paying for many scratches.
- You can trade specific sessions. Breakouts work best when liquidity and volatility rise. London open, London New York overlap, and post-news windows tend to offer cleaner expansion.
- You manage risk like a system. You size positions so a losing streak does not change your behavior. If you have not built that yet, start with a structured plan like this beginner roadmap.
Matching Timeframe to Your Lifestyle
- M15 and H1 breakouts. More signals, more noise, more false breaks. You must watch sessions, spreads, and news. You often need fast management, quick stop moves, and strict “no trade” windows around data releases.
- H4 and D1 breakouts. Fewer signals, cleaner structure, wider stops. You can place orders once or twice per day and let the trade work. Slippage matters less relative to stop size, but drawdowns can last longer and patience matters more.
- Session fit. If you can only trade one active block, use M15 or H1 during that block. If your schedule is scattered, use H4 or D1 and check charts at set times.
Practical Checklist: Your Pre-Trade Breakout Plan
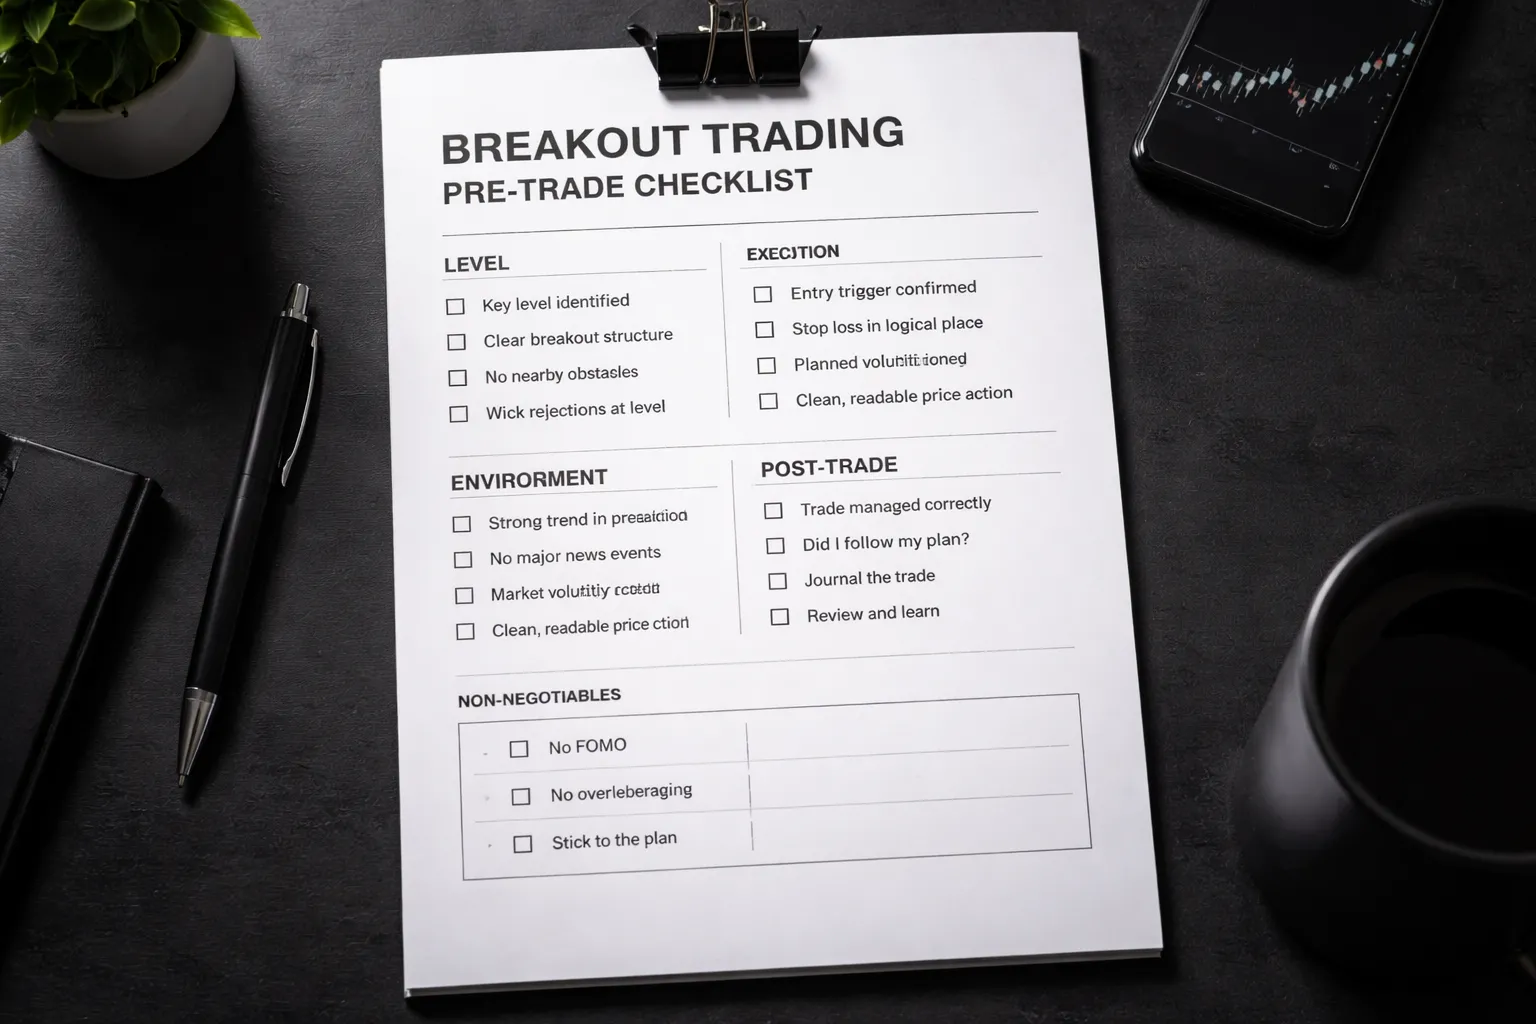
Level Checklist: Clean Boundaries, Touches, Room to Target
- Define the level on the next higher timeframe. If you enter on M15, mark the level on H1 or H4. If you enter on H1, mark it on H4 or D1.
- Use a zone, not a line. Mark the swing high or low cluster, not the single wick tip.
- Demand clean touches. You want at least 2 clear reactions into the zone. More is better if price respected the zone without chopping through it.
- Reject messy ranges. Skip levels that price crossed many times. That is noise, not a boundary.
- Check left-side structure. Avoid trading into a nearby support or resistance that sits inside your target path.
- Confirm room to target. Measure from breakout level to the next major level. You need enough space for at least 1R before the next barrier.
- Scan wick behavior. Long wicks and repeated rejections at the level can signal liquidity grabs. Tighten rules or skip.
Environment Checklist: Session, News, Volatility Regime, Spread
- Trade during your chosen session window. London and New York overlap brings the cleanest continuation moves. Asian session often ranges on many pairs.
- Align timeframe with your schedule. If you can watch actively, use M15 or H1. If you check charts 1 to 2 times per day, use H4 or D1.
- Check high-impact news. If a red-flag event hits your pair within the next 60 to 90 minutes, reduce risk or stand down.
- Classify the volatility regime. Look at the last 10 to 20 candles on your entry timeframe. If ranges are expanding, breakouts travel. If ranges compress and overlap, expect traps.
- Confirm spread condition. Compare current spread to your typical spread. Skip trades when spread widens enough to distort your entry and stop distance.
- Avoid thin liquidity times. Skip minutes around daily rollover and the first minutes after market open when spreads jump and stops slip.
Execution Checklist: Entry Type, Stop Location, Target Plan, Contingency Exits
- Choose your entry type before price breaks. Use one of these and stick to it:
- Stop entry above resistance or below support for momentum breaks.
- Close confirmation where you enter only after a candle closes beyond the level.
- Retest entry where you wait for price to break, pull back, then hold the level.
- Define what counts as a valid break. Use a candle close beyond the zone, or a minimum distance beyond the zone such as 0.25 to 0.50 ATR of your entry timeframe.
- Place the stop where the breakout is proven wrong.
- For a resistance break, stop goes below the breakout zone or below the retest swing low.
- For a support break, stop goes above the breakout zone or above the retest swing high.
- Do not place stops inside the zone.
- Set targets from structure, not hope. First target sits at the next major level. Second target can use a measured move based on the range height.
- Write your management rule. Pick one:
- Take partial at 1R, move stop to break-even only after a clean close away from the level.
- Trail behind swing highs and lows on the entry timeframe.
- Hold full position to the next higher timeframe level.
- Plan your contingency exits.
- If price breaks then closes back inside the zone, exit or cut size.
- If the breakout fails to expand within 3 to 5 candles on M15 or H1, or 2 to 3 candles on H4, tighten management or exit.
- If spread spikes or slippage hits your entry, cancel the second attempt.
- Know your candle signal. If you struggle to read closes and wicks, review this candlestick charts guide and standardize your confirmation rule.
Post-Trade Checklist: Screenshots, Rule Score, Improvement Notes
- Save screenshots. Take one before entry, one at entry, one at exit. Include higher timeframe level marks.
- Log the setup. Pair, timeframe, session, level type, entry type, stop distance in pips, ATR value, spread at entry, and result in R.
- Score rule adherence. Rate 0 to 5 on each item: level quality, environment fit, entry rule, stop rule, target rule, and contingency handling.
- Tag the outcome type. Continuation breakout, retest breakout, false break, news spike, spread issue, execution error.
- Write one improvement note. One sentence. Focus on process, not profit. Example, “Entered without a close beyond the zone, next time wait for the close.”
- Track repeat mistakes. If the same rule break happens 3 times, block trading that pattern for the next 20 trades.
| Checklist Block | Non-Negotiables |
|---|---|
| Level | 2+ clean reactions, zone marked, no nearby barrier inside your target path |
| Environment | Right session, no imminent high-impact news, normal spread, clear volatility expansion |
| Execution | Entry type chosen in advance, stop outside zone, target mapped, failure exit defined |
| Post-trade | Screenshots saved, R logged, rule score recorded, one improvement note added |
FAQ
What is a breakout in forex?
A breakout happens when price closes beyond a defined support or resistance zone and holds. You trade the expansion, not the level itself. Mark the zone first, wait for a clean close, then use a stop outside the zone.
What confirms a breakout?
Use price, not hope. Look for a strong close beyond the zone, a clear volatility expansion, and no nearby barrier inside your target path. If price breaks, then stalls and wicks back into the zone, treat it as weak.
Do you enter on the break or the retest?
Pick one before you trade. Break entry gets you in fast, but needs wider stops. Retest entry improves price, but you miss runners. If you take retests, require a retest that holds above the zone, then triggers a clear continuation.
Where should your stop loss go?
Put your stop outside the breakout zone, beyond the point that invalidates your setup. Do not tuck it inside the zone. Consider using a volatility-based buffer, such as ATR, so normal noise does not stop you out.
How do you set targets on breakout trades?
Map the next opposing zone first. That is your first target. Avoid targets that sit inside nearby chop. If there is no clean path, skip the trade. Record the planned R multiple before entry and do not invent targets mid-trade.
What is the most common breakout trap?
The false breakout. Price pokes past the zone, then snaps back and closes inside. You avoid it by trading closes, not spikes, by filtering out news spikes, and by skipping breakouts into nearby support or resistance.
Should you trade breakouts during news?
Avoid imminent high-impact news. Spreads widen and fills degrade. The move can reverse in seconds. If you trade news anyway, cut size, define a hard failure exit, and accept slippage as part of the risk.
Which sessions work best for forex breakouts?
Trade when liquidity and range expand, usually London open, London and New York overlap, and early New York. Avoid dead hours where price drifts and breaks fail. Match your strategy to the pair, not your schedule.
How many pips should your breakout buffer be?
Do not use a fixed pip buffer across pairs. Use structure plus volatility. A tight buffer works in low ATR conditions, but fails in expansion. Base the buffer on recent range or ATR so your stop sits beyond normal movement.
How do you manage a breakout trade after entry?
Follow one plan. Take partials only if you tested it. Do not move stops to breakeven too early, it kills expectancy. If price closes back inside the zone, execute your failure exit. Save screenshots and log rule score.
What candlestick patterns help with breakout retests?
Use simple rejection signals at the retest, such as pin bars and strong engulfing closes, but only at your marked zone. Patterns without location mean little. See this guide on candlestick patterns.
What risk per trade fits breakout trading?
Keep risk small and consistent, often 0.25% to 1% per trade. Breakouts cluster. You can hit several losses fast. Small fixed risk keeps you alive through streaks and lets your winners matter when expansion runs.
How do you know if your breakout system has edge?
Track at least 50 to 200 trades. Log R, rule score, session, spread, and breakout type. Measure win rate, average win, average loss, and max drawdown. If expectancy stays positive after costs and slippage, you have edge.
Conclusion
Breakouts pay when you treat them like a numbers game. You define the level, wait for clean expansion, then manage risk the same way every time. You avoid the chop, the news spikes, and the crowded levels.
- Trade only one breakout type. Same market, same session, same rules.
- Use one entry trigger. Close beyond the level, retest entry, or stop entry, pick one.
- Set one stop method. Level based, ATR based, or structure based, keep it consistent.
- Risk a fixed fraction. Keep position size tied to stop distance, not conviction.
- Track R and costs. Spread and slippage decide if the edge is real.
Your final actionable step is simple. Build a one page ruleset, then execute 50 trades with zero tweaks. Review the log, keep what works, cut what does not. If you need a refresher on support, resistance, and structure, read technical analysis core concepts.
-
Stop Loss vs Take Profit: Differences, Examples & Best Practices
7 months ago -
Forex Trading Psychology Tips: How to Stay Disciplined and Consistent
7 months ago -
How to Set Stop Loss and Take Profit (Step-by-Step)
7 months ago -
Forex Order Types Explained: Market vs Limit vs Stop Orders
7 months ago -
Understanding Forex Candlestick Charts (Beginner Guide)
7 months ago
-
- Drawing rules for clean levels, touches, wicks, and closes
- Range quality checklist, duration, symmetry, and boxed price action
- Compression signals, triangles, flags, and volatility squeeze patterns
- Multi-timeframe mapping, aligning H1, H4, D1 levels without clutter
- Avoiding messy zones, overlapping levels and high-noise congestion
-
- What is a breakout in forex?
- What confirms a breakout?
- Do you enter on the break or the retest?
- Where should your stop loss go?
- How do you set targets on breakout trades?
- What is the most common breakout trap?
- Should you trade breakouts during news?
- Which sessions work best for forex breakouts?
- How many pips should your breakout buffer be?
- How do you manage a breakout trade after entry?
- What candlestick patterns help with breakout retests?
- What risk per trade fits breakout trading?
- How do you know if your breakout system has edge?
-
-
- Drawing rules for clean levels, touches, wicks, and closes
- Range quality checklist, duration, symmetry, and boxed price action
- Compression signals, triangles, flags, and volatility squeeze patterns
- Multi-timeframe mapping, aligning H1, H4, D1 levels without clutter
- Avoiding messy zones, overlapping levels and high-noise congestion
-
- What is a breakout in forex?
- What confirms a breakout?
- Do you enter on the break or the retest?
- Where should your stop loss go?
- How do you set targets on breakout trades?
- What is the most common breakout trap?
- Should you trade breakouts during news?
- Which sessions work best for forex breakouts?
- How many pips should your breakout buffer be?
- How do you manage a breakout trade after entry?
- What candlestick patterns help with breakout retests?
- What risk per trade fits breakout trading?
- How do you know if your breakout system has edge?
-
-
How to Place a Forex Trade Step by Step (Your First Trade Explained)
5 months ago -
Forex Trading vs Crypto Trading: Which Market Is Better for Beginners?
5 months ago -
Forex Lot Size Calculator: How to Use It to Size Trades Correctly
7 months ago -
How to Calculate Position Size in Forex (Position Sizing Formula + Examples)
7 months ago -
Forex Leverage Explained: How It Works, Pros, Cons & Examples
7 months ago
-
Forex Trading Platforms Comparison: MetaTrader vs cTrader vs TradingView
7 months ago -
Stop Loss vs Take Profit: Differences, Examples & Best Practices
7 months ago -
Is Forex Trading Legal in the United States? Rules, Regulators & What to Know
7 months ago -
Forex Leverage Explained: How It Works, Pros, Cons & Examples
7 months ago -
Forex Market Hours & Trading Sessions Explained (Best Times to Trade)
7 months ago