Forex Chart Patterns Guide: Head & Shoulders, Triangles, Flags and More

Forex chart patterns help you spot repeatable price structures and plan trades with clear risk points. In this guide, you will learn the main pattern groups, reversal patterns like head and shoulders, continuation patterns like flags and pennants, and consolidation patterns like triangles, wedges, and rectangles. You will learn what each pattern signals, how to confirm it, where to place entries, stops, and targets, and the common failure modes that trap traders. You will also learn how timeframe changes pattern reliability, and how to avoid forcing shapes onto noisy charts. Most patterns reduce to two tools, trendlines and support and resistance. If you need a refresher, read our step-by-step guide to drawing trendlines.
- In het kort: Patterns are structure, not a signal. Trade them only when price confirms.
- In het kort: Most setups reduce to two tools, trendlines plus support and resistance.
- In het kort: Define the invalidation point first. Your stop goes where the pattern breaks.
- In het kort: Use clear targets. Measure the pattern or use the next major level.
- In het kort: Higher timeframes filter noise. Lower timeframes create more failures and false breaks.
- In het kort: Avoid forced patterns. If you need to redraw lines to “make it fit”, skip it.
- In het kort: Expect failure modes, early entries, breakout traps, and breakouts with no follow-through.
- In het kort: Use one extra confirmation at most, trend alignment, key level confluence, or momentum. Keep it simple.
Key takeaways
- Head and shoulders: Treat the neckline as the decision line. Enter on a break and close beyond it, or on a retest that holds. Place your stop beyond the right shoulder or beyond the retest level. Target the measured move from head to neckline.
- Triangles: You trade compression then expansion. Wait for a clean break and close outside the boundary. Put your stop back inside the triangle, beyond the last swing. Target the widest part of the triangle, or the next major support or resistance.
- Flags and pennants: You trade continuation. Confirm with a strong impulse into the flag, then a breakout in the trend direction. Stop goes beyond the opposite side of the flag. Target often matches the flagpole length, then manage around nearby levels.
- Breakouts: Most losses come from weak breaks. You reduce them by trading level plus close confirmation, waiting for retests, and avoiding breakouts into nearby support or resistance.
- Risk control: Size your position from the stop distance, not from how confident you feel. If your stop must be wide to “survive”, the trade often has poor odds. If you need help with mechanics, read our stop loss guide.
What are forex chart patterns (and why they work)?
What are forex chart patterns (and why they work)?
Forex chart patterns are repeatable price structures. They form because traders place orders in similar places, manage risk in similar ways, and react to the same levels. You use patterns to plan entries, stops, and targets with clear invalidation.
Patterns do not predict. They map where liquidity sits, where stops cluster, and where price can move fast once those orders trigger.
Pattern types: continuation, reversal, and bilateral formations
- Continuation patterns form during a trend. They pause the move, then often resume it. Common examples include flags, pennants, and many triangles.
- Reversal patterns form near the end of a move. They show failed attempts to continue. Common examples include head and shoulders, double tops, and double bottoms.
- Bilateral patterns allow both outcomes. Price compresses, then breaks either way. Symmetrical triangles and some wedges often act this way.
Your edge comes from treating each type differently. Continuations need trend context. Reversals need clear exhaustion and a broken structure. Bilateral patterns need strict confirmation because direction is unknown until the break.
Market structure behind patterns: trend, range, impulses, and corrections
Most patterns are just market structure in a clean shape.
- Impulse creates the pole or the first leg. It comes from strong order flow and rapid repricing.
- Correction creates the body of the pattern. It shows profit taking, hedging, and mean reversion flows.
- Trend stays valid when impulses break and hold prior swing levels. Continuation patterns tend to form here.
- Range forms when both sides defend levels and neither side can hold a breakout. Many failed patterns come from ranges.
Read the swings, not the name. If the swing sequence supports your trade, the pattern has value. If swings overlap and closes cluster, treat it as chop.
The role of liquidity, stop placement, and breakout behavior in FX
FX moves on liquidity. Patterns work best when they sit near obvious stop pools and clear resting orders.
- Stops cluster above equal highs, below equal lows, and beyond clean trendlines. Patterns often build these clusters.
- Breakouts need participation. In FX you cannot rely on centralized volume. Use closes, candle size, and follow-through instead.
- Retests matter. A clean break, then a retest that holds, often signals real positioning. A break that snaps back into the pattern often signals a liquidity sweep.
- Stop placement must match structure. Put your stop where the pattern is invalid, not where it feels small. If a stop sits inside the structure, normal noise can take you out.
Expect false breaks. FX hunts obvious levels, then reverses when that liquidity fills larger orders. You reduce damage by requiring a close beyond the level, then waiting for the retest, and avoiding breaks into nearby support or resistance. For a rules-based framework, see our breakout trading strategy.
How forex differs from stocks: volume limitations, session effects, and macro catalysts
- Volume is fragmented. Spot FX has no single tape. Broker volume helps, but it is not complete. Prioritize price behavior at levels over volume signals.
- Sessions change behavior. Asia often ranges, London often expands, New York often trends then mean-reverts into the close. Pattern breaks that align with session expansion tend to follow through more.
- Macro catalysts override shapes. CPI, jobs, rate decisions, and central bank speeches can break any structure. Your pattern setup must account for the calendar and the spread widening that comes with it.
When patterns fail: chop zones, news spikes, and low volatility regimes
- Chop zones create overlapping swings and many wicks. Breakouts fail because neither side commits. Avoid patterns that form in the middle of a larger range.
- News spikes can trigger breaks that reverse within minutes. Liquidity drops, spreads widen, and stops slip. Do not judge a pattern by a single news candle.
- Low volatility regimes produce shallow moves and weak follow-through. Patterns may break, then stall. Size down or demand tighter structure and closer targets.
You improve results by filtering. Trade patterns that sit at clean levels, break with strong closes, and have room to the next support or resistance. Skip patterns that form in congestion, into major events, or with no space to run.
How to read chart patterns correctly (before you trade them)
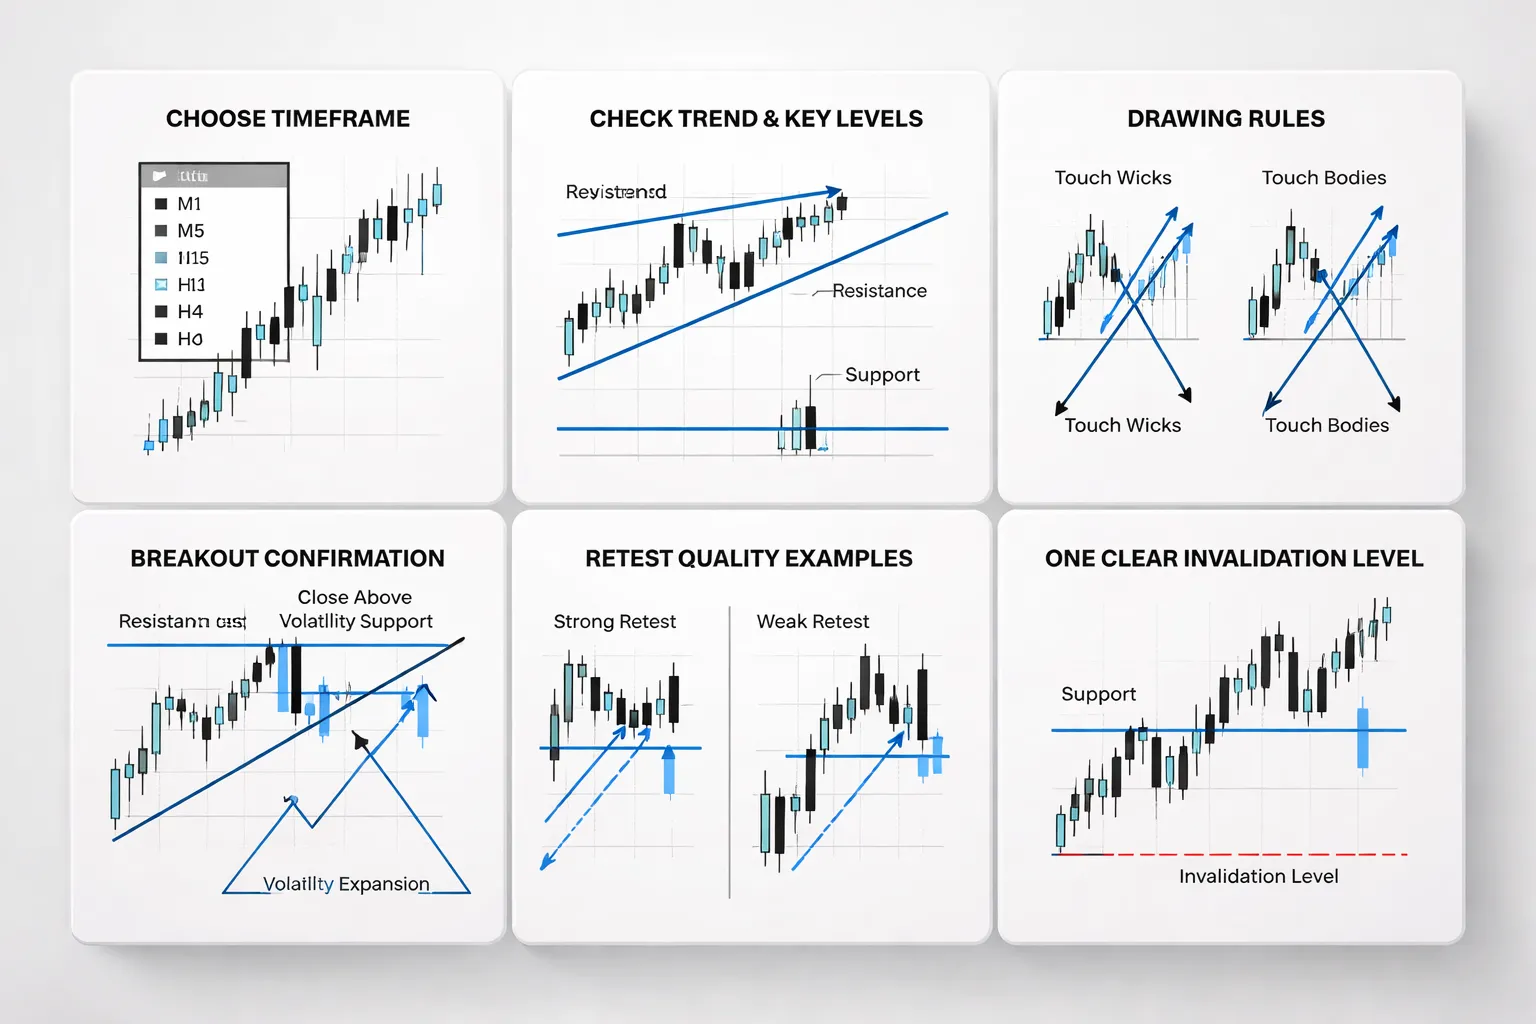
Timeframe selection, match the pattern to your holding time
Your timeframe decides how much noise you must sit through. Pick it first. Then judge the pattern.
- Scalping (minutes to 1 hour holds): Use M1 to M15 patterns, confirm with M30 to H1. Demand tight structure and fast follow-through.
- Day trading (hours to end of day): Use M15 to H1 patterns, confirm with H4. Avoid patterns that need a multi-day move to hit target.
- Swing trading (days to weeks): Use H4 to D1 patterns, confirm with W1. Ignore small patterns inside weekly levels.
- Rule: Enter on your trading timeframe. Set the bias and key levels one to two timeframes higher.
Context checklist, trend, levels, and swing structure
Patterns fail most when you trade them in the wrong place. Run this checklist before you draw anything.
- Trend direction: Trade continuation patterns with the higher timeframe trend. Treat reversal patterns as lower probability unless they form at major levels.
- Key levels: Mark the closest support and resistance that price respects. You need space from the breakout to the next level.
- Prior swings: Identify the last two impulse legs. Strong trends show clear higher highs and higher lows, or lower lows and lower highs. Choppy swings signal range conditions.
- Compression vs expansion: Good setups often compress into the pattern, then expand on the break. If volatility stays flat after the break, expect a stall.
- Confluence that stays simple: One clean level plus the pattern is enough. If you need many lines to “prove” it, skip it. If you use fib, keep it to obvious swing points, see Fibonacci retracement.
Drawing rules, wicks vs bodies, touches, and clean lines
Bad drawing creates fake patterns. Use consistent rules.
- Wicks vs bodies: Use wicks to mark extremes and liquidity grabs. Use candle bodies to define where price accepted value. For breakouts, prioritize the close, not the spike.
- Touches: Two touches draw a line. Three touches validate it. More than five usually means over-tested and weaker.
- Trendlines: Connect swing highs to swing highs, or swing lows to swing lows. Do not force a line through the middle of candles.
- Symmetry: The left and right side should look similar in scale. If one side uses tiny swings and the other uses big swings, you are mixing structures.
- One pattern at a time: If you can label it as a triangle, a flag, and a wedge at once, it is noise.
Confirmation criteria, close, volatility, and retest quality
Trade the break that shows commitment. Ignore the break that only tags a level.
- Candle close: Wait for a close beyond the boundary on your entry timeframe. For major levels or higher timeframe patterns, require a strong close near the candle high for bullish breaks, or near the low for bearish breaks.
- Volatility expansion: Look for range expansion on the breakout candle relative to the last 10 to 20 candles. Small breakout candles signal weak participation.
- Volume proxy: In spot FX you often lack centralized volume. Use session timing and candle range as the proxy. London and New York breaks tend to carry more follow-through than quiet hours.
- Retest quality: A good retest holds near the broken line, rejects quickly, and does not drift deep back into the pattern. A bad retest spends time inside the pattern and prints multiple closes back within it.
- Entry planning: Decide if you enter on the close, on a stop above the breakout candle, or on the retest. Use the order type that matches your plan, not your mood.
Invalidation logic, one price that proves you wrong
Your invalidation level must sit at one clear price. If price hits it, the pattern is broken. You exit.
- Continuation patterns (flags, pennants, triangles): Invalidate when price closes back inside and then breaks the opposite side, or when it takes out the last swing point that defines the structure.
- Reversal patterns (head and shoulders, double tops): Invalidate when price breaks and closes beyond the right shoulder high for a head and shoulders, or beyond the swing high that defines the top.
- Wick vs close rule: If your strategy uses close confirmation, your invalidation should also use closes. If you stop on wicks, accept more stop-outs.
- Placement rule: Put the invalidation where the pattern is objectively wrong, not where the stop feels smaller.
- Risk rule: If the stop must sit too far away to respect the structure, skip the trade.
Head and Shoulders (H&S) and Inverse Head and Shoulders
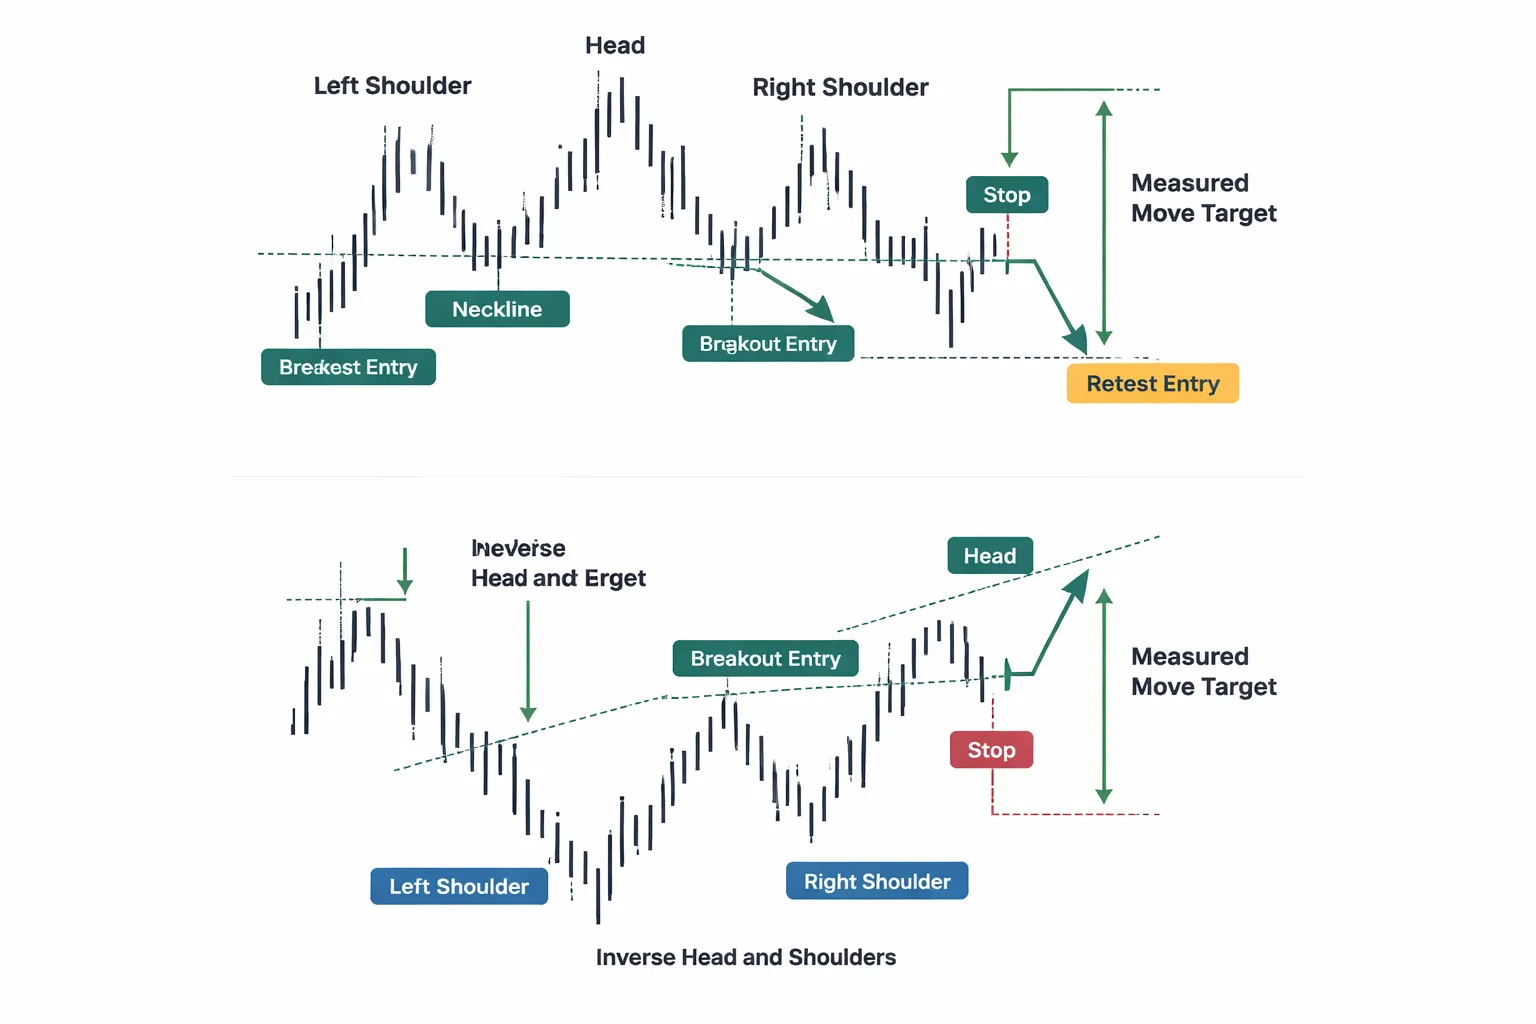
Anatomy
Head and Shoulders (H&S) is a reversal pattern. It often forms after an extended uptrend. Inverse H&S forms after an extended downtrend.
- Left shoulder: price makes a swing high, then pulls back.
- Head: price makes a higher swing high, then sells off again.
- Right shoulder: price fails to make a new high and rolls over.
- Neckline: connect the two reaction lows between shoulder and head.
Necklines come in two main types.
- Flat neckline: clearer level, cleaner trigger, often stronger breakout follow-through.
- Sloped neckline: common in trending markets, but it changes your entry and stop math because the trigger level moves over time.
Inverse H&S flips the structure. The head is the lowest low. The neckline connects the two reaction highs.
Entry models
You have three practical ways to trade H&S and inverse H&S. Pick one and stay consistent.
- Aggressive break: enter on the neckline break. Use a close rule if you want fewer false breaks. Expect more missed trades.
- Conservative retest: wait for price to break, then retest the neckline from the other side. This often improves R multiple, but you will lose some trades that never retest.
- Scaling: take a starter position on the break, add on the retest, then add only if price holds the neckline and prints a lower high for H&S, or a higher low for inverse H&S.
Retests behave like pullbacks into structure. Use the same rules you use for a pullback entry, level quality, momentum shift, and clean rejection.
Targets and stop placement
Use targets and stops that match the pattern logic, not your comfort.
- Measured move: measure from the head to the neckline, project that distance from the breakout point. This gives a clear base target.
- Structure-based stop: common placements are above the right shoulder for H&S, or below the right shoulder for inverse H&S. A tighter option is beyond the neckline retest swing, but only if that level proves the pattern wrong when hit.
- Partials: take partial profit at the first major support or resistance, then trail the rest using swing highs and lows. This reduces giveback when the breakout stalls.
If your neckline is steep, measured move targets can land inside nearby structure. In that case, prioritize the nearest major level for your first take profit, then reassess.
Best-fit conditions
- Extended trend: H&S works best as a reversal after a mature move. Inverse H&S works best after a sustained decline.
- Clear swing points: you need clean pivots. If swings overlap and chop, the pattern loses meaning.
- Supportive momentum shift: the head pushes further, but the follow-through weakens. The right shoulder shows failure to reclaim prior highs for H&S, or failure to make new lows for inverse H&S.
- Neckline quality: fewer touches before the break, clear reactions at both neckline points, and a break that displaces with intent.
Common mistakes
- Early entries: shorting before the neckline breaks, or buying inverse H&S before the neckline breaks. You end up trading a range, not a reversal.
- Forcing symmetry: shoulders do not need to match in size or time, but they must make sense as swing points. If you have to draw it twice, skip it.
- Ignoring neckline quality: a neckline with many chops and closes through it often acts like noise. You will get fake breaks and messy retests.
- Wrong invalidation: stops placed inside the shoulder structure get tagged by normal volatility. Place invalidation where the pattern is objectively broken.
Triangle patterns in forex: ascending, descending, and symmetrical
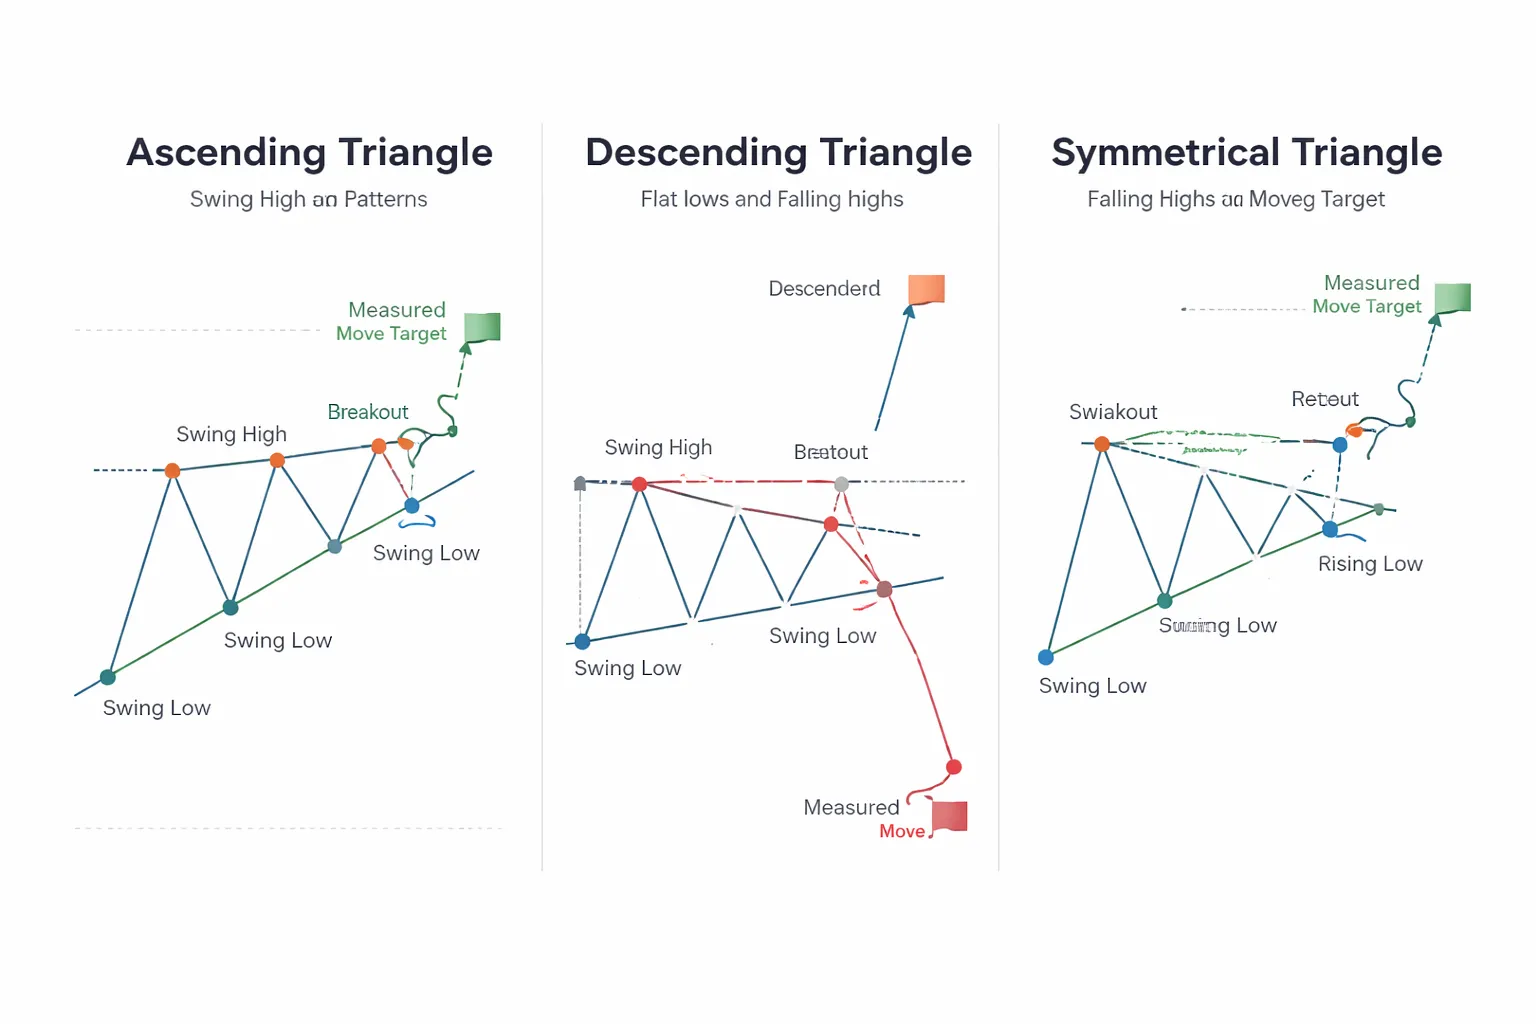
Triangle patterns in forex: ascending, descending, and symmetrical
Triangles show compression. Range shrinks as price prints lower highs, higher lows, or both. You trade the boundary breaks, not the middle.
How to identify each triangle type
- Common rules. Use clear swing highs and swing lows. You need at least two touches on each boundary, three is better. Keep the lines tight around closes, not extreme wicks. If price closes through a boundary several times, skip it.
- Ascending triangle. Flat or near-flat swing highs, rising swing lows. Price compresses upward into the ceiling.
- Descending triangle. Flat or near-flat swing lows, falling swing highs. Price compresses downward into the floor.
- Symmetrical triangle. Lower swing highs and higher swing lows. Both sides compress. Direction stays uncertain until the break.
- Compression check. Each swing should cover less distance than the prior swing. If swings expand, you do not have a triangle.
What triangles signal about order flow
- Ascending triangle. Buyers absorb offers at a known level. Sellers fail to push price down as higher lows form. If the level keeps holding, inventory builds for a stop run above the highs.
- Descending triangle. Sellers absorb bids at a known level. Buyers fail to lift price as lower highs form. If the level keeps holding, inventory builds for a stop run below the lows.
- Symmetrical triangle. Two-sided compression. Both sides pull liquidity toward the apex. You often get a sweep first, then the real move.
Breakout triggers and false-break filters
- Primary trigger. Wait for a candle close beyond the boundary, not a wick. Use the timeframe you traded the pattern on.
- Retest acceptance. After the close, price retests the broken line and holds. You want rejection back in the breakout direction. If price closes back inside the triangle, treat it as failed.
- Distance filter. Require a close at least 10 to 20 percent of the triangle’s max height beyond the boundary. This cuts “edge taps” that reverse fast.
- Time filter. Prefer breaks that happen between 50 and 80 percent of the triangle length. Breaks very near the apex often lack follow-through.
- Context filter. Skip breakouts that run straight into nearby major support or resistance. You want room to the next level.
Targeting methods: measured move vs liquidity mapping
- Measured move. Measure the triangle’s max height, then project it from the breakout point. Use it as a baseline target, not a promise.
- Next liquidity pool. Mark the nearest swing high or swing low outside the triangle, prior day high or low, and obvious equal highs or equal lows. These areas attract stops and often act as first target zones.
- S/R mapping. If the measured move target lands beyond a major level, take partial at the level and trail the rest. If the measured move lands inside heavy structure, downgrade the target.
Avoiding traps
- Late-stage breakouts. If price drifts to the apex with tiny candles and no range, expect whipsaw. Reduce size, demand a stronger close, or pass.
- Low-range days. If the session prints unusually small ranges, triangles can break and stall. Favor the retest entry, not the first break.
- Nearby major levels. A triangle that breaks into weekly support or resistance often fails or turns into a shallow push. Map the higher timeframe levels first.
- Over-trading the inside. Do not scalp the center. Your edge sits at the boundaries and the post-break retest.
Triangles rely on clean trendlines. If your lines feel subjective, tighten your process with trend lines and channels before you trade triangle breaks.
Flags and pennants: trend continuation setups
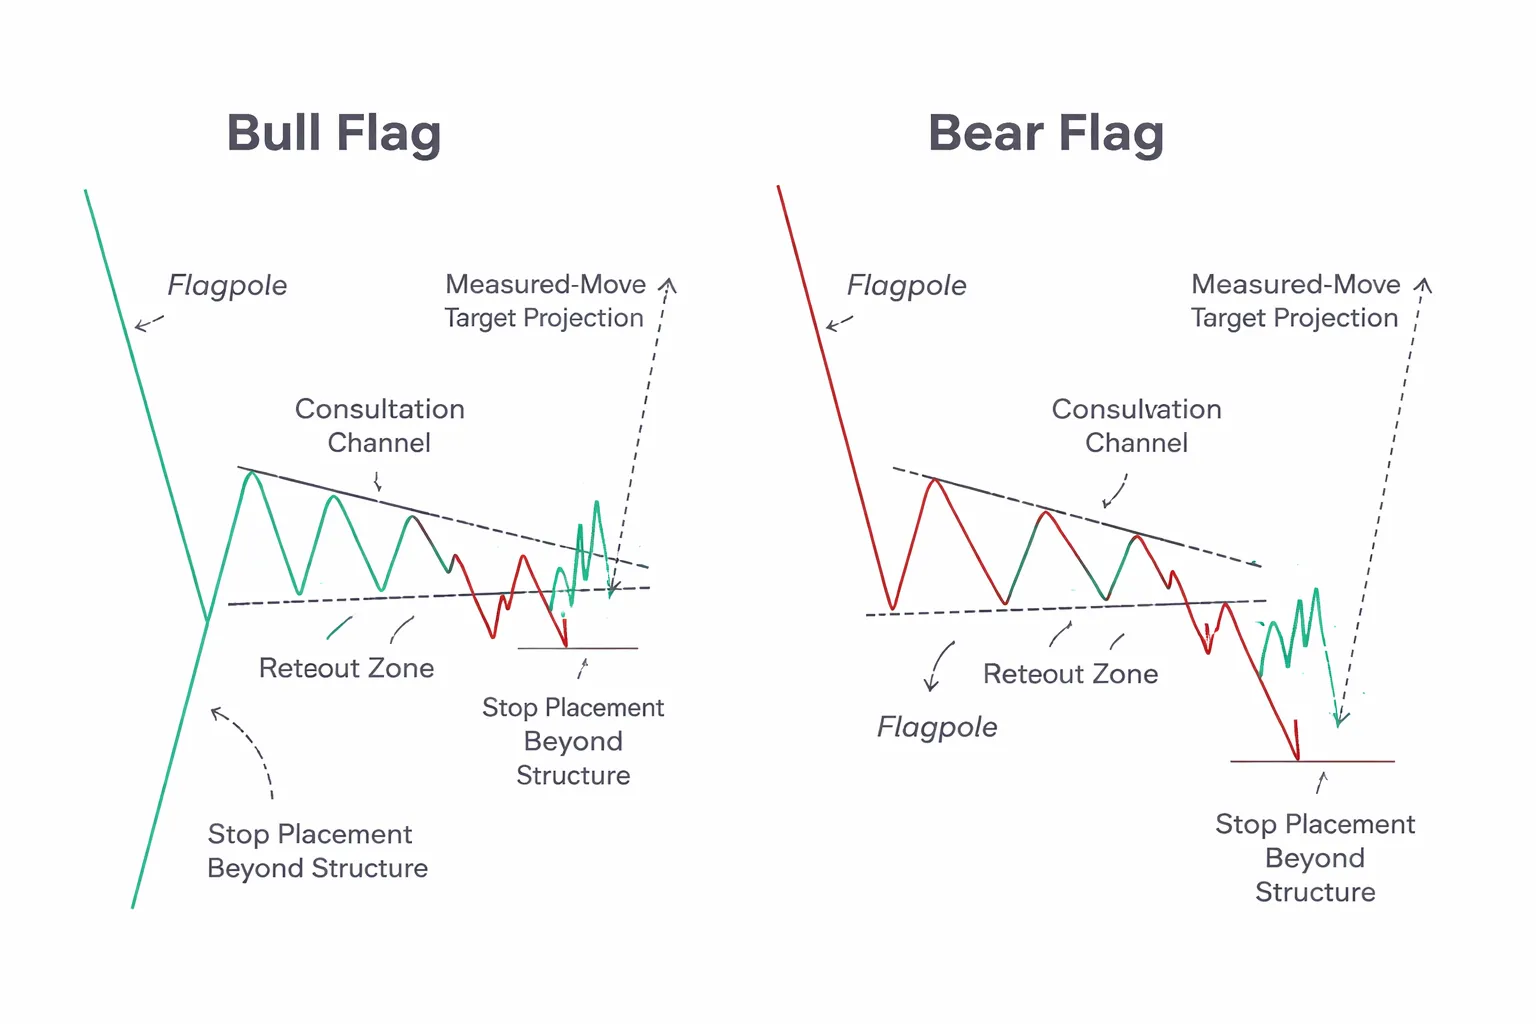
Flagpole and consolidation rules: what qualifies as a valid structure
Flags and pennants work best as trend continuation setups. You trade them when price pauses after an impulsive move, then breaks in the original direction.
- Start with the pole. You want a fast, clean push with few pullbacks. The move should break a prior swing high or low, or a key level.
- Then a tight pause. The consolidation should stay compact. Choppy, overlapping swings kill the setup.
- Keep the retracement shallow. As a rule, if the pullback gives back most of the pole, treat it as a reversal risk, not continuation.
- Time matters. The pause should look like a pause. If it drags on and builds many swings, it often turns into a range.
- Structure matters. A flag prints parallel or near-parallel boundaries. A pennant prints converging boundaries.
- Location matters. The best flags form away from major higher timeframe support or resistance. If the pole runs straight into a weekly level, expect failures and fakeouts.
Bull flag vs bear flag: how trend strength changes management
A bull flag forms after a strong rally. A bear flag forms after a strong selloff. Your job is to match risk and trade management to the strength of the trend leg.
- Strong bull flag traits. Shallow pullback, higher lows inside the flag, quick compression, clean breakout above the flag top.
- Strong bear flag traits. Shallow bounce, lower highs inside the flag, quick compression, clean breakdown below the flag base.
- Adjust your expectations. Strong trends often do not give deep retests. Weak trends often retest more, or fail.
- Adjust your stop plan. In strong trends, you can often use a tighter structure stop. In weaker trends, you need more room, or you skip the trade.
Pennants vs small triangles: practical distinctions for entries and stops
Pennants look like small triangles, but you should trade them like continuation pauses, not like standalone triangle patterns.
- Pennant. Needs a clear pole first. The consolidation converges fast. Volume and volatility often contract. You focus on the break in the pole direction.
- Small triangle. May form without a pole. It can break either way. It can act as reversal or continuation depending on context.
- Entry trigger difference. Pennants favor direction bias from the pole. Small triangles need more confirmation because direction is less certain.
- Stop difference. Pennants usually allow a stop beyond the opposite side of the pennant. Small triangles often need a wider stop because wicks and false breaks show up more.
Breakout and retest playbook: entries, add-ons, and trailing approaches
Trade flags and pennants with a simple plan. Define the boundary. Wait for the break. Control risk on the retest.
- Step 1, mark the structure. Draw the flag channel or pennant lines using clear touches. Keep it objective. If needed, use a consistent trendline process from your higher timeframe down.
- Step 2, choose your entry type. Use a breakout entry when the trend is strong and levels are clear. Use a retest entry when the market runs fakeouts or when the break occurs near support or resistance.
- Step 3, place the stop. Put your stop beyond the opposite side of the flag or pennant, or beyond the last swing inside the structure. Avoid stops inside the consolidation.
- Step 4, plan add-ons. Add only after price holds above the broken bull flag top, or below the broken bear flag base. Add on a clean retest hold, not on the first spike.
- Step 5, manage the trade. Trail behind higher lows in a bull continuation, or lower highs in a bear continuation. Tighten the trail after a strong expansion candle, or after a second push away from the structure.
- Step 6, set targets. Common targets include the measured move using the pole length, and nearby higher timeframe levels. Use a defined take-profit plan, not hope, see take profit levels and examples.
| Method | Entry | Stop | Best when |
|---|---|---|---|
| Breakout | Close through the boundary, then enter on continuation | Beyond the opposite side of the structure | Strong pole, clean level break, low nearby HTF friction |
| Retest | Enter after price breaks, pulls back, then holds the level | Below the retest low in bull setups, above the retest high in bear setups | Choppy markets, common fakeouts, break near HTF levels |
| Scale-in add-on | Add after a successful hold and renewed expansion | Protect the add-on with a tighter swing-based stop | Trend resumes with momentum and clean structure |
Failure cases: weak pole, overly deep retracement, and breakout into resistance/support
- Weak pole. If the “pole” looks like a grind with many pullbacks, you do not have the pressure you need. Expect chop and failed breaks.
- Overly deep retracement. If the pullback eats most of the pole, the market has already repaired the imbalance. Continuation odds drop. Treat it as a range or a potential reversal.
- Messy consolidation. If both sides of the flag get pierced often, your boundary has no respect. Skip it.
- Breakout into support or resistance. If the breakout runs straight into a prior swing, daily supply or demand, or weekly levels, the market often stalls and snaps back. You want space to run.
- Late entries. If price already expanded far past the boundary, you chase. Wait for the retest or stand down.
Other high-probability patterns traders use alongside H&S, triangles, and flags
Double top and double bottom
These patterns trade like a simple idea, a level fails twice, then the market breaks the middle swing.
- Neckline logic: The neckline is the swing low between two highs in a double top. It is the swing high between two lows in a double bottom. You want clean pivots, not noise.
- What counts as “two tests”: The second peak or trough should stall near the first and show weaker follow-through. If the second push slices through fast, the level did not hold.
- Confirmation you can use: Wait for a decisive close beyond the neckline. Better, wait for a retest that fails at the neckline, then enter on continuation.
- Common failure: You take the break when it runs straight into higher timeframe support or resistance. Your “measured move” dies inside the next wall.
- Stops: Put the stop beyond the second peak or trough, or beyond the retest swing if you enter on the retest. Size the trade so the stop makes sense, not the other way around. Use this stop loss placement guide if you need a clear framework.
| Pattern | Trigger | Cleaner entry | Typical target logic |
|---|---|---|---|
| Double top | Close below neckline | Retest neckline fails, then break lower | Neckline to top height projected down |
| Double bottom | Close above neckline | Retest neckline holds, then break higher | Neckline to bottom height projected up |
Wedges (rising and falling)
Wedges look similar. Context decides if you treat them as reversal or continuation.
- Reversal wedge: You see a wedge after an extended trend, near a higher timeframe level. The swings compress and momentum fades. You want the break to occur with a clear close outside the wedge, then a failed retest back into it.
- Continuation wedge: You see a wedge as a pause inside a strong trend, often after one impulse leg. Treat it like a compression setup. You want the break in trend direction, with room to run into the next level.
- Structure check: Both trendlines should connect at least two clear pivots each. If you keep redrawing lines to “make it fit,” skip it.
- Quality tell: Price should respect the wedge boundaries. If it keeps piercing both sides, the market does not care about your lines.
- Execution tip: You get better trades by entering after the retest, not on the first spike through the line. Spikes reverse often in FX.
Rectangles and ranges
Ranges give you two plans. Range expansion for breakouts, and mean reversion for rotations.
- Define the box: Mark the top at repeated swing highs, and the bottom at repeated swing lows. Use closes and bodies first. Wicks help, but only if they repeat.
- Range expansion plan: Wait for a close outside the range. Then wait for a retest of the broken boundary. Enter only if the retest holds. You want the breakout to have space before the next major level.
- Mean reversion plan: Trade from edge to edge only when the range stays intact. You need clear rejection at the boundary and a realistic path to the midpoint and the far side.
- Midpoint matters: Many ranges pivot at the 50% level. If price cannot reclaim the midpoint after a bounce, the “rotation” trade often fails early.
- Failure mode: You trade mean reversion inside a range that is already expanding. Bigger candles, deeper probes, faster swings. That is often pre-breakout behavior.
| Range style | What you trade | What you avoid |
|---|---|---|
| Breakout | Close out, retest, continuation | First-touch spikes into the boundary |
| Mean reversion | Edge rejection to midpoint, then far edge | Fading strong momentum bars at the edge |
Cup and handle (FX adaptation)
In FX, “cup and handle” often becomes a rounded base plus a tight pullback. Many examples are just a range with a last pullback.
- When it is valid: You see a clear prior high as resistance. Price sells off, recovers, and returns to that high. Then you get a short, tight pullback that holds above the midpoint of the base. The handle should stay contained and not turn into a full range.
- What the handle should do: Drift lower in a narrow channel or small range. It should not dump with large candles. It should not break below key swing structure that built the right side of the base.
- Trigger: A close above the prior high, then a retest that holds. If it breaks out and immediately drops back into the base, it was likely a range break attempt.
- When it is just a range: The “cup” has sharp V-turns, messy overlaps, or multiple equal highs that keep rejecting. That is a rectangle with stories added.
- Target logic: Treat it like a range breakout. Use the base height as a rough projection, but respect the next higher timeframe supply zone first.
Rounding bottoms and tops
These patterns try to capture a slow transition. You need rules to avoid overfitting.
- What you look for: Lower volatility after a trend, smaller pushes in trend direction, and higher lows in a rounding bottom or lower highs in a rounding top. Price starts to spend more time near the middle than at the extremes.
- How to mark it: Use swing structure, not a perfect curve. You want three or more swing points that show the slope changing over time.
- Confirmation: Treat it like a level break. Identify the “rim” level, usually the last clear swing high in a bottom or swing low in a top. Wait for a close beyond it, then a retest that holds.
- What ruins it: One large impulse candle that resets structure. That often signals news flow or positioning shifts. Your “rounding” story becomes hindsight.
- Practical filter: If you cannot name the level that must break for the pattern to work, you do not have a trade, you have a shape.
Trade planning: entries, stops, targets, and risk management

Entry frameworks: breakout, pullback, and hybrid triggers
You need one trigger, one invalidation level, and one target plan before you enter. Pick an entry style that fits your pattern and timeframe.
- Breakout entry. Enter on a candle close beyond the pattern level, like a neckline, triangle edge, or flag boundary. Use a close rule, not a wick rule. Define the level on the higher timeframe first. Avoid breakouts into nearby support or resistance.
- Pullback entry. Wait for the breakout, then enter on the retest that holds. Your trigger can be a rejection candle, a close back in the breakout direction, or a minor structure break on the retest. You trade fewer setups, but you often get a tighter stop.
- Hybrid entry. Split the position. Take a small size on the breakout close. Add the rest on a successful retest. This reduces missed trades and keeps risk controlled if the breakout fails.
Stop-loss placement: beyond structure, ATR-based buffers, and swing invalidations
Your stop must sit where the pattern becomes wrong, not where pain feels smaller.
- Beyond structure. Place the stop beyond the level that defines the pattern. For head and shoulders, that can mean beyond the right shoulder swing. For triangles, beyond the last swing inside the structure. For flags, beyond the flag low or high, not inside the flag.
- ATR-based buffer. Add a volatility buffer so normal noise does not stop you out. Use a multiple of ATR on your trading timeframe, like 0.5x to 1.0x ATR, added beyond the structural stop. Keep the buffer consistent across trades so your stats mean something.
- Swing invalidation. Use a clear swing point as the line in the sand. Long trades stay valid while price holds a higher low. Short trades stay valid while price holds a lower high. If that swing breaks on a close, you exit.
If your stop sits inside the pattern, you usually trade randomness. If your stop sits too far beyond structure, your position size collapses and your edge must be strong to compensate.
Take-profit strategies: measured moves, multi-target scaling, and trailing stops
Your target plan should match how the pattern tends to deliver. Use rules you can repeat.
- Measured moves. Use pattern geometry. Head and shoulders often targets the head-to-neckline distance projected from the break. Triangles often target the widest part of the triangle projected from the break. Flags often target a move similar to the pole, projected from the breakout.
- Multi-target scaling. Take partial profits at fixed levels. Example structure: first target at 1R, second target at the measured move, leave a runner if the market trends. Scaling reduces volatility in your equity curve, but can lower your average R per trade.
- Trailing stops. Trail behind structure, not behind hope. Common methods include trailing behind higher lows or lower highs, trailing behind a moving average, or trailing by a fixed ATR multiple. Pick one method and log it.
Align targets with nearby support and resistance. If your measured move lands inside a major level, expect front running and partial fills. Adjust by taking profit before the level or tightening the trail into it.
Position sizing: calculating lot size from stop distance and account risk %
Size the trade from your stop distance. Do not move the stop to fit your preferred lot size.
Step-by-step
- Set your account risk per trade, like 0.25% to 1.0%.
- Measure stop distance in pips from entry to stop.
- Convert pips to money per lot for the pair you trade. Use your platform pip value.
- Calculate position size.
Example
- Balance: $10,000
- Risk: 0.5% = $50
- Stop: 25 pips
- Pip value: $10 per pip per 1.0 lot
- Lot size = 50 / (25 x 10) = 0.20 lots
Recalculate size each trade. Your stop changes with structure and volatility. Your risk should not.
Risk-to-reward and expectancy: what to track to know if your pattern edge is real
One trade proves nothing. Your log does.
- Track R. Record results in R, not dollars. 1R equals your initial risk. This lets you compare trades with different stops.
- Track win rate and average win and loss. You need all three to understand performance.
- Calculate expectancy. Expectancy = (Win rate x Avg win in R) minus (Loss rate x Avg loss in R). Avg loss should stay near 1R if you respect stops.
- Separate by entry type. Breakout, pullback, and hybrid trades often behave differently. Log them as different strategies.
- Track rule breaks. Mark trades where you entered early, moved stops, or skipped the retest rule. Remove them from performance analysis.
Set minimum sample size targets, like 30 to 50 trades per pattern and entry type. Then decide if the edge holds. If you need help setting thresholds, use this guide on the risk-reward ratio.
Confluence that improves pattern reliability (without overcomplicating)
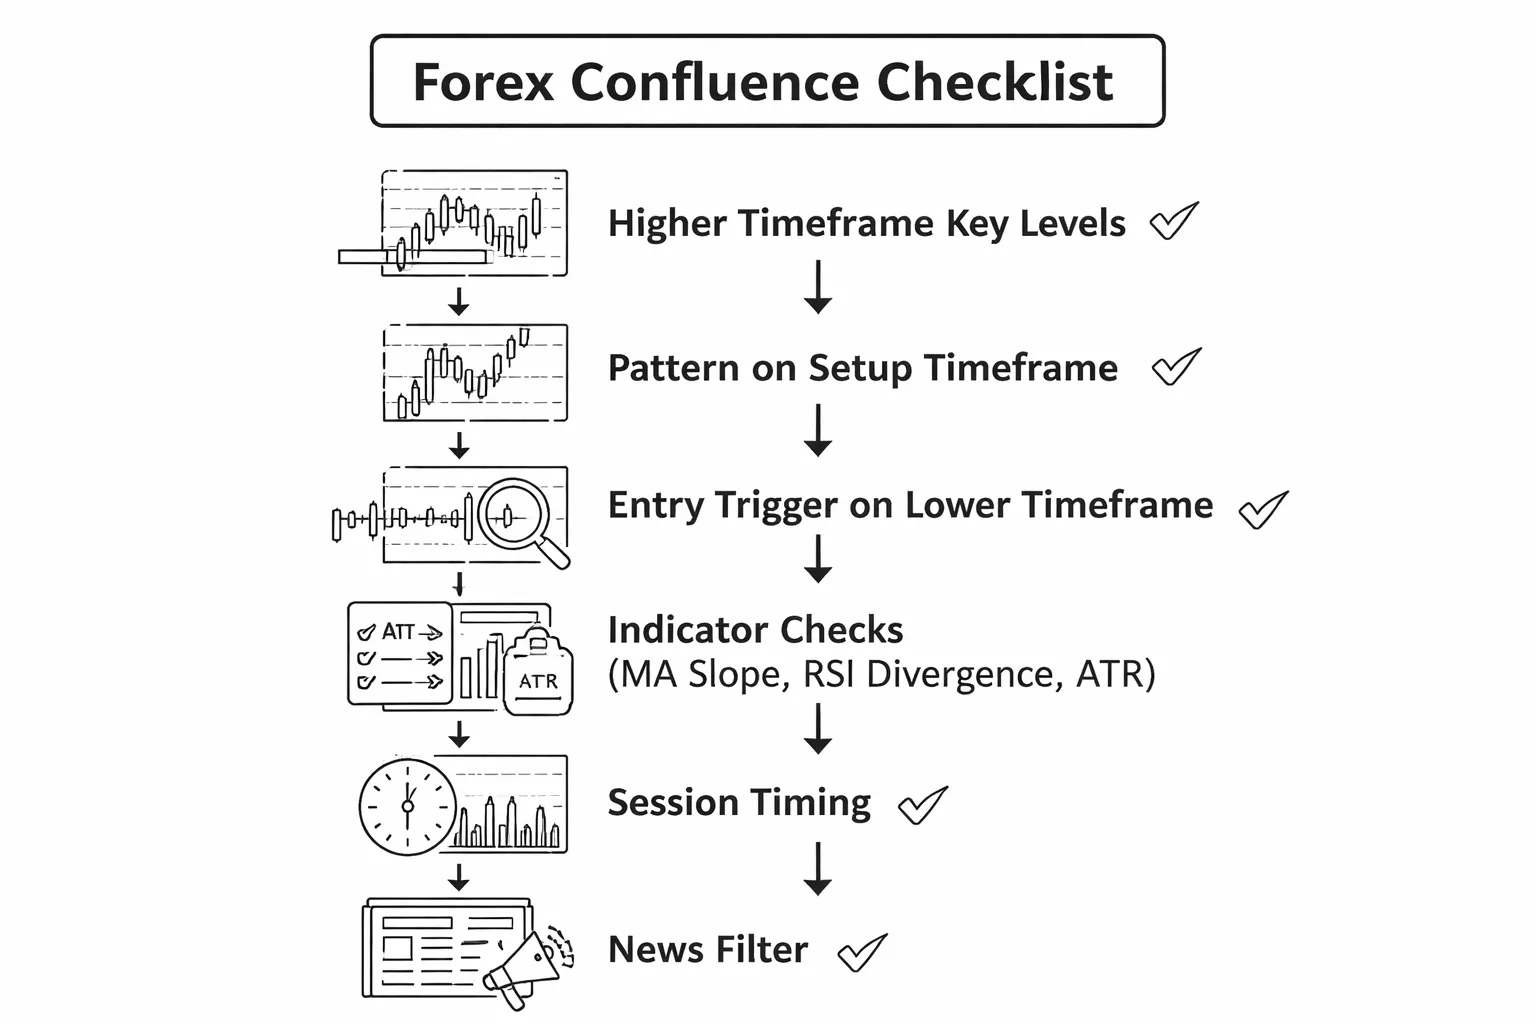
Support, resistance, and key levels
Patterns work best when they form at levels traders already watch.
Start with higher timeframes. Mark weekly and daily swing highs and lows. Mark the most recent strong impulse move origin. Mark round numbers if they line up with structure.
- Breakout patterns: Favor triangles, flags, and ranges that break through a higher timeframe level with clean space to the next level.
- Reversal patterns: Favor head and shoulders, double tops, and wedges that form into a higher timeframe supply or demand zone.
- Invalidation: Place your pattern invalidation beyond the level, not inside the noise. If your stop must sit inside the level, skip the trade.
Track one rule in your journal. Pattern at a key level, yes or no. You will see the impact fast.
Indicators as confirmation (keep it minimal)
Use indicators to confirm context, not to replace the pattern.
- Moving averages: Use one or two. Price above a rising MA supports long setups. Price below a falling MA supports shorts. Avoid countertrend breaks when the MA slope fights you.
- RSI divergence: Use it on reversals, not breakouts. If price prints a higher high and RSI prints a lower high, treat it as a warning that momentum fades. Keep your rules consistent. For a deeper RSI rule set, use this RSI trading guide.
- ATR for volatility: Check if current ATR sits near recent highs. High ATR often means wider stops and more fake breaks. Low ATR often means tighter ranges and cleaner breakouts. Use ATR to size the stop, not to decide direction.
Limit yourself to one trend filter and one momentum or volatility check. Log them as binary fields. On or off.
Session timing
Time changes behavior. Your pattern does not trade the same in every session.
- London and New York overlap: Expect higher volume and follow-through. Breakouts and flag continuations often perform better here.
- Asia range breaks: Many pairs form tight ranges in Asia. A clean break during London open can run. Define the Asia high and low, then trade the break only with space to the next higher timeframe level.
- End of day effects: Liquidity can thin. Spreads can widen. Late breakouts can fail. If you trade late, tighten your entry criteria and reduce size.
Add one timing tag to every trade. Asia, London, NY, overlap, or rollover. Then review results by tag.
Fundamental context (simple filters)
News can override patterns. You do not need a macro model. You need a filter.
- Economic calendar: Mark high impact events for the pair. If a release hits within 30 to 60 minutes, avoid new entries or wait for the first post-news swing to form.
- Central bank events: Rate decisions, pressers, and minutes can break technical levels without respect. Treat them as no-trade windows unless you trade news on purpose.
- Risk-on, risk-off: When markets flip to risk-off, JPY and CHF often strengthen and high beta currencies can drop. In risk-on, the opposite can happen. Use this as a bias check, not a signal.
Journal one field. News risk, yes or no. Then compare win rate and average R across both buckets.
Multi-timeframe alignment (top-down workflow)
Use a short workflow. Keep the same order every time.
- 1. Higher timeframe map: On daily or 4H, mark trend, key levels, and the next target zone.
- 2. Setup timeframe: On 1H or 30M, find the pattern at or near your mapped level. Define trigger, stop, and target before entry.
- 3. Entry timeframe: On 15M or 5M, execute only if price action matches your trigger rule. If you require a retest, enforce it.
- 4. Quick validation: Confirm you have room to target, acceptable ATR-based stop distance, and no imminent high impact news.
This keeps confluence objective. Fewer checks. Cleaner data. Better pattern stats.
Backtesting and practice: how to build confidence in pattern trading
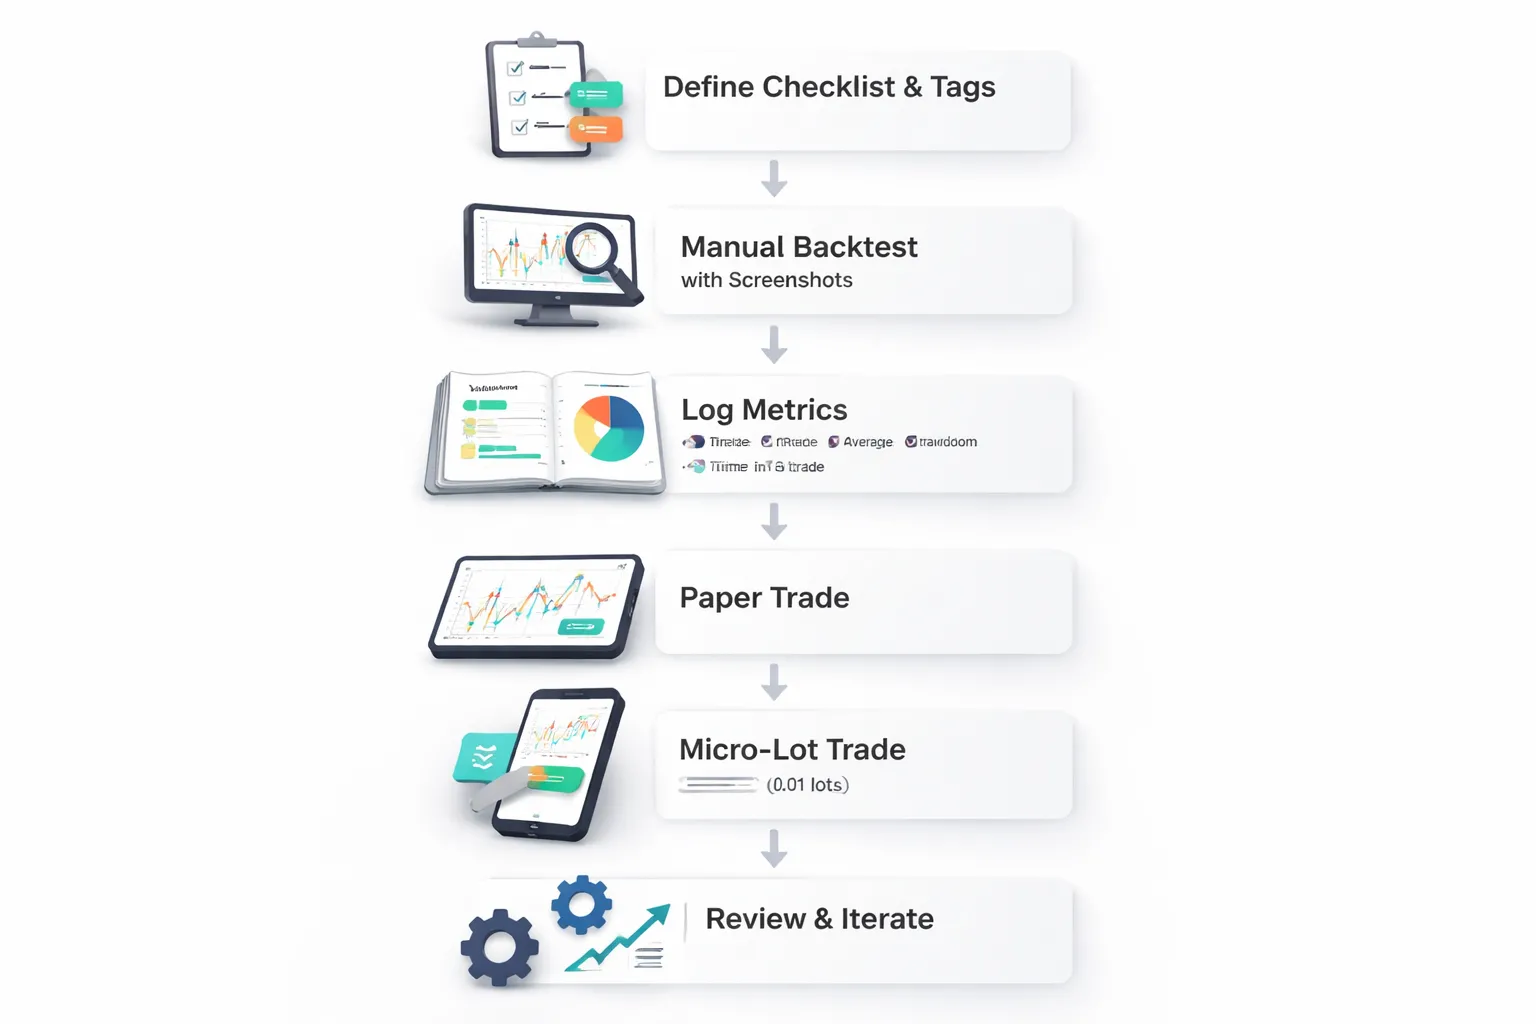
Creating a pattern checklist and tagging rules to avoid bias
You do not backtest “patterns”. You backtest your rules.
Create a one page checklist. Keep it binary. Yes or no. No “looks strong” fields.
- Pattern type: head and shoulders, triangle, flag, wedge.
- Market state: trend, range, or transition.
- Location: at key level, away from key level.
- Structure rules: number of touches, symmetry, clean swing points.
- Breakout rule: close beyond level, not just a wick.
- Retest rule: required or not required. Define “retest” in pips or ATR.
- Trigger candle: engulf, pin, inside break, or simple close rule.
- Stop rule: fixed structure stop, or ATR based stop distance.
- Target rule: measured move, prior swing, or fixed R multiple.
- Invalidation: what cancels the setup before entry.
- News filter: skip trades within your defined window.
Set tagging rules before you start. Do not edit tags mid run.
- Tag “A setup” only if it passes every checklist line.
- Tag “B setup” only if one specific rule fails, for example no retest.
- Tag “No trade” if two or more rules fail.
- Never tag after you see the outcome. Tag at the decision candle.
Manual backtesting steps: screenshots, journaling, and outcome classification
Manual testing builds pattern recognition and execution discipline. Do it like a lab process.
- Pick one pair, one session, one timeframe for pattern detection, for example 1H.
- Pick one entry timeframe, for example 15M.
- Pick one risk model, fixed 1R per trade.
- Hide the future. Scroll bar replay or candle by candle.
- When a setup appears, stop. Complete the checklist.
- Mark entry, stop, target. Log spread and ATR if you use them.
- Screenshot the chart at entry. Include both timeframes.
- Move forward until exit. Screenshot the exit.
- Write one sentence on execution quality, not on feelings.
Classify outcomes with the same labels every time.
- Full win: target hit.
- Full loss: stop hit.
- Scratch: exit near breakeven by rule.
- Partial: scaled out by rule. Record weighted R.
- Missed: valid setup, no entry. This is an execution error.
- Invalid: checklist failed. Do not count it as a trade.
Metrics to record: win rate, average R, drawdown, and time-in-trade
Track a small set of numbers. They tell you if the pattern has an edge and if you can trade it.
- Trades: total A setups taken, and total A setups found.
- Win rate: wins divided by trades.
- Average R: average of R multiple outcomes. Use net R after spread.
- Expectancy: average R per trade. This is your edge in one number.
- Profit factor: gross R wins divided by gross R losses.
- Max drawdown: largest peak to valley drop in equity in R.
- Average time in trade: candles or minutes from entry to exit.
- MAE and MFE: max adverse and max favorable excursion in R.
| Metric | What it tells you | What to do with it |
|---|---|---|
| Expectancy (avg R) | Edge per trade | Keep rules stable until sample size grows |
| Max drawdown (R) | Worst historical pain | Set position size so you can survive it |
| Time in trade | Execution fit for your schedule | Match timeframe to your available focus |
| MAE | How far trades go against you | Tighten entries, do not tighten stops blindly |
Record stop logic the same way every time. If you use volatility, use one method and keep it consistent. See ATR based stop sizing for a clean framework.
Paper trading vs micro-lot trading: when to move from practice to live
Paper trading tests your process. Micro lots test your behavior.
- Use paper trading to confirm you can follow the checklist and log every trade.
- Switch to micro lots once you execute cleanly and your stats hold.
- Risk small enough that one loss feels boring. Your goal is consistency.
Use simple promotion rules.
- Move from backtest to paper: you have a defined rule set and at least 50 classified trades on one pattern.
- Move from paper to micro: you logged at least 20 trades with zero rule breaks, and results match backtest range.
- Scale size: increase risk only after another 20 to 30 trades with the same rule compliance.
Common cognitive errors: hindsight bias, overtrading, and selective sampling
Most pattern traders fail from weak process, not from weak patterns.
- Hindsight bias: you redraw levels after the move and call it “clean”.
- Fix: timestamp screenshots at entry. Never edit the marked level in your journal.
- Overtrading: you take lower quality setups to stay busy.
- Fix: cap trades per session. Stop after two losses. Trade only A setups.
- Selective sampling: you test only the best looking examples.
- Fix: backtest a full date range. Take every valid setup in order. No skipping.
- Rule drift: you change stops and targets after a few losses.
- Fix: lock rules for the entire sample. Review only after the run ends.
- Outcome focus: you judge a good trade by profit, not by execution.
- Fix: grade the checklist first. Profit comes second.
Common questions and pitfalls with forex chart patterns
Why patterns look different on brokers, spreads, feeds, and candle construction
Chart patterns do not print the same on every broker. Small differences change what you see.
- Spread and execution: A wider spread can trigger a breakout or stop on your platform while another broker stays inside the level. This hits tight stops and turns clean breaks into fake-outs.
- Price feed and liquidity mix: Brokers aggregate quotes from different providers. That changes wick length, exact highs and lows, and how “clean” a neckline looks.
- Candle construction: Daily candles depend on server time. A New York close feed can show a clear pin bar or engulfing candle. A different session cut can split that signal into two weaker candles.
Fix your inputs. Use one broker feed for testing and execution. If you switch brokers, re-check key levels and re-test your pattern rules.
How to handle false breakouts, filters, retests, and time-based stops
False breakouts are normal. You need rules that cap damage and keep you out of weak breaks.
- Close filter: For candle-based patterns, require a candle close beyond the level, not a wick. Define the candle type, like 15m, 1h, or 4h, and keep it fixed.
- Distance filter: Require the break to clear the level by a minimum amount. Use a fixed pip buffer or an ATR fraction. Keep the number stable in testing.
- Retest entry: Let price break, then retest the level. Enter only if the retest holds and you get a clear rejection candle. This cuts bad breaks but you will miss some runners.
- Time-based stop: If price does not move within X candles after entry, exit. Stale breakouts often reverse. This rule also reduces opportunity cost.
Pick one approach. Do not mix filters trade by trade. You will curve fit in real time.
Pattern quality scoring, clarity, space to target, and nearby obstacles
Most patterns fail because you trade low quality structures. Score them before you place risk.
- Clarity: You should draw the key lines fast and get the same answer each time. If you need to “adjust” the neckline three times, skip it.
- Symmetry and proportions: Legs should make sense on your timeframe. If one side takes 3 candles and the other takes 40, treat it as messy structure.
- Space to target: Measure from entry to the next major barrier. If the next support or resistance sits too close, your reward shrinks and your win rate drops.
- Nearby obstacles: Prior swing highs and lows, round numbers, session highs and lows, and major trend lines and channels can block follow-through.
- Volatility fit: If recent candles expand, your stop needs more room. If you keep a small stop, expect more stop-outs.
| Quality check | Pass criteria | Fail sign |
|---|---|---|
| Clarity | One obvious level, clean touches | You keep redrawing levels |
| Room | Next obstacle allows your minimum R | Target sits inside congestion |
| Context | Pattern aligns with higher timeframe bias | Pattern fights the dominant structure |
| Risk fit | Stop sits beyond structure with logic | Stop sits inside noise |
Managing trades around news, reduce size, widen stops, or stand aside
High impact news can break your pattern rules. Slippage jumps. Spreads widen. Levels get ignored.
- Stand aside: If your setup needs a tight stop or a clean retest, skip entries 15 to 30 minutes before major releases and wait for the first reaction to settle.
- Reduce size: If you still trade, cut risk per trade. Keep the stop logic the same. Size absorbs the extra volatility.
- Widen stop with rules: Only widen if you also reduce size and you planned the rule in advance. Random widening turns into unmanaged risk.
- Avoid holding through scheduled shocks: If you already sit in profit, consider taking partials or moving to a structure-based stop. Do not move stops to break even just from fear. Use a rule.
Write a news plan once. Apply it every time.
Avoiding pattern hunting, focusing on A+ setups and rules-based execution
Pattern hunting kills performance. You see a shape, then you force a trade.
- Limit the patterns you trade: Pick two to three patterns. Master the entries, stops, targets, and filters.
- Define A+ criteria: Require clear structure, room to target, and no major obstacles nearby. If one item fails, you skip.
- Use a checklist: Make it binary. Yes or no. No “almost”.
- Set scan times: Check charts at fixed times. This stops you from searching until you find something.
- Track execution stats: Log if you followed rules, not just P and L. Your edge comes from repeatable decisions.
Trade less. Grade harder. Your best results come from your cleanest setups.
FAQ
Which forex chart patterns work best?
No pattern wins by default. Your edge comes from rules, market, and execution. Test each pattern on your pair and timeframe. Track win rate, average win, average loss, and maximum drawdown. Keep only patterns that stay profitable after fees and slippage.
How do you confirm a chart pattern?
Use objective triggers. For breakouts, wait for a candle close beyond the key level. For reversals, wait for the neckline or support break. Avoid early entries inside the structure. Define your invalidation level before you enter.
What timeframe should you use for patterns?
Match timeframe to your holding period. Higher timeframes reduce noise but give fewer trades. Lower timeframes give more signals but more false breaks. Keep one main execution timeframe and one higher timeframe for direction. Do not mix rules across timeframes.
Do chart patterns work in forex?
They can, if you treat them as risk structures, not predictions. Forex reacts to liquidity, sessions, and news. Patterns fail often around major releases. Filter trades by time of day, spread, and nearby support and resistance. Size positions to survive strings of losses.
How do you set stops and targets for patterns?
Put the stop where the pattern is invalid. For head and shoulders, beyond the right shoulder. For triangles and flags, beyond the structure edge. Set targets using measured moves, then adjust for nearby levels. Use at least 1R, skip trades blocked by close obstacles.
How do you avoid false breakouts?
Trade the close, not the spike. Avoid low liquidity hours. Check spread before entry. Require space to the next level. Reduce risk when volatility jumps. If you trade breakouts often, follow a strict breakout trading plan with fixed triggers and filters.
Is volume needed for forex pattern trading?
Spot forex volume is limited and broker specific. You can use tick volume as a proxy, but do not build rules that need perfect volume data. Focus on price, levels, and volatility. If you use volume, use it as a filter, not a trigger.
What is the difference between flags, pennants, and triangles?
Flags and pennants are continuation patterns after a strong impulse. They usually break in the impulse direction. Triangles can form as continuation or reversal structures. Trade them with the same logic, define the range, wait for a close outside, then manage risk.
How many times should you backtest a pattern before trading live?
Test enough trades to cover different conditions. Aim for at least 100 samples per pattern, per market, per timeframe. Include spreads, slippage, and session filters. Log execution errors. Use a consistent process, learn how to backtest a forex strategy before you risk real size.
Conclusion
Chart patterns help you organize price action. They do not predict outcomes. Your edge comes from rules, filters, and execution.
- Define the pattern in one sentence. List the exact swing points, minimum touches, and invalidation level.
- Trade the breakout close, not the spike. Use a fixed rule for entries, either close outside the level or a retest entry, then stick to it.
- Set risk first. Place your stop where the pattern breaks, size the trade so one loss stays small, and predefine your take profit method.
- Track the only metrics that matter. Win rate, average win, average loss, expectancy, max drawdown, and time in trade.
- Backtest with clean samples. Aim for 100-plus trades per pattern, per pair, per timeframe. Include spread, slippage, and session rules.
Your final tip. Pick one pattern, one timeframe, and one pair. Build a checklist, then run a 30-trade demo block with the same position sizing and rules you will use live. If your results match your backtest within normal variance, scale up slowly. If they do not, tighten your definitions and retest. Use solid levels and trend context, start with how to draw trendlines.
-
Stop Loss vs Take Profit: Differences, Examples & Best Practices
6 months ago -
Forex Trading Psychology Tips: How to Stay Disciplined and Consistent
6 months ago -
Forex Order Types Explained: Market vs Limit vs Stop Orders
6 months ago -
How to Set Stop Loss and Take Profit (Step-by-Step)
6 months ago -
How to Start Forex Trading Step by Step (Beginner Roadmap)
6 months ago
-
- What are forex chart patterns (and why they work)?
- Pattern types: continuation, reversal, and bilateral formations
- Market structure behind patterns: trend, range, impulses, and corrections
- The role of liquidity, stop placement, and breakout behavior in FX
- How forex differs from stocks: volume limitations, session effects, and macro catalysts
- When patterns fail: chop zones, news spikes, and low volatility regimes
-
- Flagpole and consolidation rules: what qualifies as a valid structure
- Bull flag vs bear flag: how trend strength changes management
- Pennants vs small triangles: practical distinctions for entries and stops
- Breakout and retest playbook: entries, add-ons, and trailing approaches
- Failure cases: weak pole, overly deep retracement, and breakout into resistance/support
-
- Entry frameworks: breakout, pullback, and hybrid triggers
- Stop-loss placement: beyond structure, ATR-based buffers, and swing invalidations
- Take-profit strategies: measured moves, multi-target scaling, and trailing stops
- Position sizing: calculating lot size from stop distance and account risk %
- Risk-to-reward and expectancy: what to track to know if your pattern edge is real
-
- Creating a pattern checklist and tagging rules to avoid bias
- Manual backtesting steps: screenshots, journaling, and outcome classification
- Metrics to record: win rate, average R, drawdown, and time-in-trade
- Paper trading vs micro-lot trading: when to move from practice to live
- Common cognitive errors: hindsight bias, overtrading, and selective sampling
-
- Why patterns look different on brokers, spreads, feeds, and candle construction
- How to handle false breakouts, filters, retests, and time-based stops
- Pattern quality scoring, clarity, space to target, and nearby obstacles
- Managing trades around news, reduce size, widen stops, or stand aside
- Avoiding pattern hunting, focusing on A+ setups and rules-based execution
-
- Which forex chart patterns work best?
- How do you confirm a chart pattern?
- What timeframe should you use for patterns?
- Do chart patterns work in forex?
- How do you set stops and targets for patterns?
- How do you avoid false breakouts?
- Is volume needed for forex pattern trading?
- What is the difference between flags, pennants, and triangles?
- How many times should you backtest a pattern before trading live?
-
-
- What are forex chart patterns (and why they work)?
- Pattern types: continuation, reversal, and bilateral formations
- Market structure behind patterns: trend, range, impulses, and corrections
- The role of liquidity, stop placement, and breakout behavior in FX
- How forex differs from stocks: volume limitations, session effects, and macro catalysts
- When patterns fail: chop zones, news spikes, and low volatility regimes
-
- Flagpole and consolidation rules: what qualifies as a valid structure
- Bull flag vs bear flag: how trend strength changes management
- Pennants vs small triangles: practical distinctions for entries and stops
- Breakout and retest playbook: entries, add-ons, and trailing approaches
- Failure cases: weak pole, overly deep retracement, and breakout into resistance/support
-
- Entry frameworks: breakout, pullback, and hybrid triggers
- Stop-loss placement: beyond structure, ATR-based buffers, and swing invalidations
- Take-profit strategies: measured moves, multi-target scaling, and trailing stops
- Position sizing: calculating lot size from stop distance and account risk %
- Risk-to-reward and expectancy: what to track to know if your pattern edge is real
-
- Creating a pattern checklist and tagging rules to avoid bias
- Manual backtesting steps: screenshots, journaling, and outcome classification
- Metrics to record: win rate, average R, drawdown, and time-in-trade
- Paper trading vs micro-lot trading: when to move from practice to live
- Common cognitive errors: hindsight bias, overtrading, and selective sampling
-
- Why patterns look different on brokers, spreads, feeds, and candle construction
- How to handle false breakouts, filters, retests, and time-based stops
- Pattern quality scoring, clarity, space to target, and nearby obstacles
- Managing trades around news, reduce size, widen stops, or stand aside
- Avoiding pattern hunting, focusing on A+ setups and rules-based execution
-
- Which forex chart patterns work best?
- How do you confirm a chart pattern?
- What timeframe should you use for patterns?
- Do chart patterns work in forex?
- How do you set stops and targets for patterns?
- How do you avoid false breakouts?
- Is volume needed for forex pattern trading?
- What is the difference between flags, pennants, and triangles?
- How many times should you backtest a pattern before trading live?
-
-
How to Place a Forex Trade Step by Step (Your First Trade Explained)
4 months ago -
Forex Trading vs Crypto Trading: Which Market Is Better for Beginners?
4 months ago -
Forex Lot Size Calculator: How to Use It to Size Trades Correctly
6 months ago -
How to Calculate Position Size in Forex (Position Sizing Formula + Examples)
6 months ago -
Forex Leverage Explained: How It Works, Pros, Cons & Examples
6 months ago
-
Forex Trading Platforms Comparison: MetaTrader vs cTrader vs TradingView
6 months ago -
Stop Loss vs Take Profit: Differences, Examples & Best Practices
6 months ago -
Is Forex Trading Legal in the United States? Rules, Regulators & What to Know
6 months ago -
Forex Market Hours & Trading Sessions Explained (Best Times to Trade)
6 months ago -
Forex Leverage Explained: How It Works, Pros, Cons & Examples
6 months ago